

1 Introduction
Over the past decades, an abundance of work has reported the occurrence and fate of antibiotics detected in hospital effluents, even rivers, with increasingly accumulative concentration owing to their prevalent applications in controlling and/or curing diseases regarding bacteria in humans and animals [1–3]. Among these pharmaceuticals, chloramphenicol (CAP) offers a higher degree of usability than other drugs [4]. Consequently, the long-lived existence of CAP in aquatic media may cause an antibiotic resistance cycle but severely trigger a range of fatal allergic symptoms in human (e.g., aplastic anemia) [5]. Therefore, introducing efficient techniques for the remediation of CAP antibiotic needs to be addressed. Although many methods can be applied to eliminate this emergent drug from wastewater, adsorption is proved as an “effective and green” approach in terms of performance cost and ecology [6,7]. However, designing and developing such highly recyclable and effective adsorbents have been still a drawback.
The main focuses of adsorbents have been on modifying surface functional groups and enhancing porosity properties so that CAP molecules can be well absorbed onto adsorbents [8–10]. Yao et al. [11] demonstrated the effectiveness of humic acid (HA)–modified nanoscale zero-valent iron (nZVI) particles (nZVI/HA) for the removal of CAP from aqueous solution. Regardless of the low surface area obtained (7.98 m2/g), the removal efficiency of nZVI/HA reached a promising result (84.2%), so far higher than noncomposite HA and nZVI forms alone [11].
Chemically modified carbonaceous materials such as activated carbon have been demonstrated as promising adsorbents toward CAP antibiotic remediation because of their high porosity and diverse functional groups on the surface [12]. Indeed, Li et al. [13] quantified these functional groups on low-cost H3PO4-activated carbon (AC) derived from Typha orientalis via Boehm's titration method. It was reported that the total amount of carboxyl, lactone, and phenolic groups was found to be 2.078 mmoL/g and the total amount of primary groups was found to be 0.995 mmoL/g. Accompanied by high surface area (794.8 m2/g), the AC reached an excellent maximum CAP adsorption capacity (Qm), at 0.424 mmoL/g. Li et al. [13] also proved the central role of functional groups in their study via proposed mechanisms, including π–π interaction, electrostatic attraction, and hydrogen-bonding interaction.
The metal-organic frameworks (MOFs) have gained considerable attention because they offered a range of potential and outstanding applications in various fields, such as heterogeneous catalysts for organic synthesis, carriers for drug delivery, adsorbents for gas separation or storage, biosensors for medical devices, etc. [14]. For example, Cu3(BTC)2 or HKUST-1 belongs to crystalline and porous materials, constructed by copper clusters and 1,3,5-benzenetricarboxylic acid (H3BTC) as ligands, bringing a series of practical functionalities [15,16]. Recently, S.H. Jhung et al. reported the transformation of various types of MOFs into novel mesoporous carbons (MPCs) for antibiotics treatment [17–20]. For instance, zeolitic-imidazolate framework-8–derived MPC was reported to be an efficient and robust adsorbent to remove ibuprofen (320 mg/g) and diclofenac sodium (400 mg/g) in water [21].
In our previous studies, we successfully synthesized the hierarchically mesoporous carbon by pyrolyzing the Fe-MOF precursor in an inert atmosphere (e.g., nitrogen) [22–26]. These materials were used to eliminate ibuprofen (206.5 mg/g), ciprofloxacin (90.0 mg/g), chloramphenicol (96.3 mg/g), and tetracycline (224 mg/g) antibiotics rapidly and efficiently. Herein, our goals are to develop the novel Cu3(BTC)2-derived mesoporous carbon (CMC700) and study its utilization for removal of CAP. To our best knowledge, morphological properties, porous structure, and CAP adsorption onto CMC700 adsorbent originated from Cu3(BTC)2 have not been reported yet; hence, it is required to investigate thoroughly.
2 Experimental section
2.1 Chemicals and analytical instruments
All chemicals including CAP, H3BTC, copper nitrate trihydrate (Cu(NO3)2·3H2O), and N,N-dimethylformamide (DMF) were commercially purchased from Merck. The D8 Advance Bruker powder diffractometer was used to record the X-ray powder diffraction (XRD) profiles using Cu–Kα beams as excitation sources. The S4800 instrument (Japan) was implemented to capture the scanning electron microscopy (SEM) images with the magnification of 7000 using an accelerating voltage source (15 kV). The JEOL JEM 1400 instrument was used to study the transmission electron microscopy. The N2 adsorption/desorption isotherm and pore size distribution data were recorded on the Micromeritics 2020 volumetric adsorption analyzer system. The UV–vis spectrophotometer was used to determine the CAP concentration at 278 nm.
2.2 Synthesis of Cu3(BTC)2 and CMC700 materials
The Cu3(BTC)2 was produced by the solvothermal method explained in our previous work [27]. To obtain the light blue Cu3(BTC)2 crystals, the 20-mL vials containing Cu(NO3)2·3H2O (0.438 g, 1.8 mmol) and H3BTC (0.236 g, 1.12 mmol) in a homogeneous mixture of DMF (3 mL), ethanol (4 mL), and water (2 mL) were heated at 85 °C for 24 h. The solid crystals were then washed with DMF (3 × 10 mL), exchanged with ethanol (3 × 10 mL), and dried at 110 °C (90% yield).
The CMC700 was fabricated by pyrolyzing the Cu3(BTC)2 crystals (1.0 g) under N2 nitrogen (100 cm3/min, 3 °C/min) for 4 h at 700 °C. The solid product was washed with dilute HCl (3 × 10 mL) and distilled water until the residue reached a neutral solution. The CMC700 was dried and stored in a desiccator.
2.3 Experimental batches
The adsorption batches were experimented with adding CMC700 (0.08–0.92 g/L) into 50 mL of CAP solutions (1.6–18.4 mg/L) at pH 2.6–9.4. Note that each experiment was separately carried out on a shaking table (200 rpm) at room temperature (25 ± 2 °C). If there were kinetic experiments, the regular time intervals were selected after each 0, 10, 20, 40, 60, 80, 100, and 120 min, and if there were isotherm experiments, the initial CAP concentrations were chosen at 10, 20, 30, and 40 mg/L. All aqueous samples were analyzed by UV-vis spectroscopy at 278 nm. The formulas for removal Y (%) and adsorption capacity Q (mg/g) are represented as follows:
| (1) |
| (2) |
2.4 Optimization study
In this study, we applied the response surface methodology (RSM) powered by Design–Expert 10 (DX10) as an efficient approach to optimize the experimental conditions [28]. The polynomial equation (Eq. 3) was established to describe the relationship between the responses (Y) and a set of three independent values (A, B, C) as displayed in Table 1.
| (3) |
List of variables for optimization of CAP removal.
| No | Independent factors | Unit | Code | Levels | ||||
| −1.68 | −1 | 0 | +1 | +1.68 | ||||
| 1 | Initial concentration (C) | mg/L | A | 1.6 | 5 | 10 | 15 | 18.4 |
| 2 | Adsorbent dosage (Dos) | g/L | B | 0.08 | 0.25 | 0.5 | 0.75 | 0.92 |
| 3 | pH of solution (pH) | – | C | 2.6 | 4 | 6 | 8 | 9.4 |
2.5 Error analysis
Error functions are commonly used to analyze the suitability of nonlinear models; hence, by comparing the error functions (Eq. 4–6) such as coefficient of correlation (R2), mean relative error (MRE), and sum of square for errors (SSE) values together, we can select the best-fitted models. Here, the Origin® 9.0 software (Massachusetts, United States) was used to minimize the error functions [29]. Moreover, Qi,cal and Qi,exp are defined as the theoretical and experimental values, respectively.
| (4) |
| (5) |
| (6) |
3 Results and discussion
3.1 Characterization studies
To explore the crystalline structure of Cu3(BTC)2 and CMC700 materials, the XRD diffraction patterns can be used. According to Fig. 1(a), a range of typical peaks can be observed at around 6.7° (200), 9.4° (220), 11.6° (222), 13.3° (400), 14.9° (331), 17.4° (551), 18.9° (440), 20.2° (600), 23.4° (620), 25.9° (731), and 29.2° (751), indicating that the Cu3(BTC)2 MOF has been successfully produced [15,16]. Meanwhile, the diffraction pattern of CMC700 in Fig. 1(b) showed a noticeable difference. Obviously, the existence of Cu2O (JCPDS No. 05–0667) and Cu (JCPDSNo.04–0836) phases in CMC700 is confirmed; this finding was highly in line with those of the previous work [30]. Liu et al. [47] also demonstrated the formation of zero-valent copper and copper (I) in the Cu/C and Cu2O/C composites by chemical reduction of Cu (II)–O bonds.
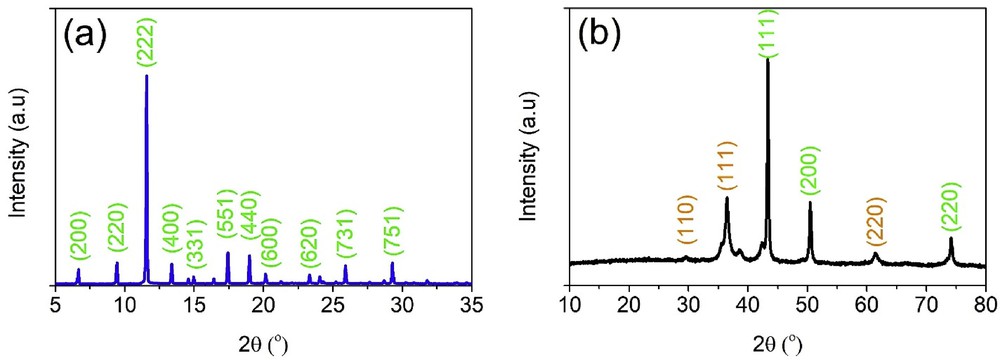
XRD diffraction patterns of Cu3(BTC)2 (a) and CMC700 (b) materials. XRD, X-ray powder diffraction.
Besides, we quantified the surface functional groups by Boehm's titration method (Table 2). Note that the quantitative experiments for Boehm's titration are performed to identify total bases and acids via using appropriate analytes and titrants. It is commonly known that HCl can neutralize basic groups, NaOH can neutralize Brønsted acids (phenol, lactone, and carboxyl), Na2CO3 can neutralize lactone and carboxyl, and NaHCO3 can neutralize carboxyl [31]. It was found that CMC700 can own acidic or oxygenated groups (2.12 mmoL/g) and base groups (0.32 mmoL/g) while Cu3(BTC)2 had no surface functional groups. The presence of these groups made a great contribution to adsorption toward CAP antibiotic.
Concentrations of surface functional groups on Cu3(BTC)2 and CMC700.
| No | Sample | Amount of functional groups via Boehm's titration (mmol/g) | |||||
| Carboxyl | Lactone | Phenolic | Total acidic | Total base | Total groups | ||
| 1 | Cu3(BTC)2 | – | – | – | – | – | – |
| 2 | CMC700 | 1.26 | 0.35 | 0.51 | 2.12 | 0.32 | 2.44 |
The porosity of materials gives the main information of internal structure, and hence, Cu3(BTC)2 and CMC700 were characterized by nitrogen adsorption/desorption isotherm and pore size distribution. Fig. 2(a) indicates that adsorption isotherm of Cu3(BTC)2 sharply reaches an equilibrium in low-relative-pressure regions in accordance with type I (International Centre for Theoretical and Applied Chemistry [IUPAC]), which is of significance to reflect a microporous structure [30]. Meanwhile, there was a hysteresis loop at a high relative pressure (P/Po > 0.5) in accordance with type IV (IUPAC), suggesting that CMC700 had a mesoporous structure. Supporting these, Fig. 2(b) shows the pore size distribution of materials with a micropore (<2 nm) for Cu3(BTC)2 and mesopore (2–50 nm) for CMC700. In addition, the surface area calculated by Brunauer–Emmett–Teller (BET) theory was found to be 418.5 m2/g and 78.8 m2/g for Cu3(BTC)2 and CMC700, respectively. With a highly porous structure along with diverse surface area, CMC700 may be an adsorbent for the CAP adsorption (Fig. 2).

Nitrogen adsorption/desorption isotherms (a) and pore size distribution plots (b) of Cu3(BTC)2 and CMC700 materials.
Morphological properties of Cu3(BTC)2 and CMC700 materials can be analyzed by SEM techniques. As shown in Fig. 3(a–c), Cu3(BTC)2 exhibits octahedral crystals with obvious edges, at around 20.0 μm in length [32]. Meanwhile, the structure of CMC700 was relatively amorphous and defective, which may be attributable to the effect of composition under high temperature. Liu et al. [47] documented the decomposition temperature of Cu3(BTC)2 via thermogravimetric analysis at 300 °C; hence, this material may be completely degraded at 700 °C to form a new structure (CMC700).

Morphological images of Cu3(BTC)2 (a–c) and CMC700 (d–f) materials.
3.2 Optimization studies
Herein, central composite design (CCD) powered from the program DX10 can be applied to design the experimental matrix with variables investigated. Accordingly, CAP concentration (A: 1.6–18.4 mg/L), CMC700 dosage (B: 0.08–0.92 g/L), and pH (C: 2.6–9.4) are listed in Table 3. The equation (Eq. 7) describing the mathematical relationship between CAP removal efficiency (H) and variables (A, B, and C) is as follows:
| Y (%) = 78.71 – 6.77A + 5.86B + 10.01C – 2.06AB – 5.89AC – 0.36BC – 2.39A2 – 16.04B2 – 17.67C2 | (7) |
Matrix of observed and predicted values for CAP removal.
| Run | Independent factors | CAP removal (%) | |||
| Concentration (mg/L) | Dosage (g/L) | pH | Actual | Predicted | |
| 1 | 5 | 0.25 | 4 | 18.6 | 25.2 |
| 2 | 15 | 0.25 | 4 | 30.8 | 27.6 |
| 3 | 5 | 0.75 | 4 | 35.2 | 41.7 |
| 4 | 15 | 0.75 | 4 | 29 | 35.9 |
| 5 | 5 | 0.25 | 8 | 64 | 57.7 |
| 6 | 15 | 0.25 | 8 | 42.5 | 36.5 |
| 7 | 5 | 0.75 | 8 | 69 | 72.8 |
| 8 | 15 | 0.75 | 8 | 49.4 | 43.4 |
| 9 | 1.6 | 0.5 | 6 | 89.4 | 83.3 |
| 10 | 18.4 | 0.5 | 6 | 55.3 | 60.6 |
| 11 | 10 | 0.08 | 6 | 17.9 | 23.5 |
| 12 | 10 | 0.92 | 6 | 49.6 | 43.2 |
| 13 | 10 | 0.5 | 2.6 | 21.6 | 11.9 |
| 14 | 10 | 0.5 | 9.4 | 36.7 | 45.6 |
| 15 | 10 | 0.5 | 6 | 78.3 | 78.7 |
| 16 | 10 | 0.5 | 6 | 78.6 | 78.7 |
| 17 | 10 | 0.5 | 6 | 76.8 | 78.7 |
| 18 | 10 | 0.5 | 6 | 80 | 78.7 |
| 19 | 10 | 0.5 | 6 | 77.8 | 78.7 |
| 20 | 10 | 0.5 | 6 | 80.6 | 78.7 |
To assess the compatibility and suitability of the proposed quadratic model, we analyzed the indicators involving P-value, R2, and adequate precision (AP) ratio via analysis of variance data, as shown in Table 4. It is evident that P-value obtained a low magnitude (<0.0001), while the coefficient of determination (R2 = 0.9457) was close to 1.0. This finding indicates that the proposed two-order model was statistically significant with the confidence level better than 0.95. By obtaining a high AP ratio (13.16) greater than 4.0, discrimination between predicted values and the average prediction error was adequate to navigate the design space.
ANOVA for the CAP removal model.
| Source | Sum of squares | Degree of freedom | Mean square | F-value | Prob. > F | Comment |
| Model | 10,250.48 | 9 | 1138.94 | 19.35 | <0.0001S | SD = 7.67 |
| A | 625.12 | 1 | 625.12 | 10.62 | 0.0086 S | Mean = 54.05 |
| B | 469.17 | 1 | 469.17 | 7.97 | 0.0181 S | CV(%) = 14.2 |
| C | 1367.55 | 1 | 1367.55 | 23.23 | 0.0007 S | R2 = 0.9457 |
| AB | 33.89 | 1 | 33.89 | 0.5757 | 0.4655 N | AP = 13.16 |
| AC | 277.69 | 1 | 277.69 | 4.72 | 0.0550 N | |
| BC | 1.03 | 1 | 1.03 | 0.0174 | 0.8975 N | |
| A2 | 82.63 | 1 | 82.63 | 1.40 | 0.2635 N | |
| B2 | 3708.62 | 1 | 3708.62 | 62.99 | <0.0001 S | |
| C2 | 4498.71 | 1 | 4498.71 | 76.41 | <0.0001 S | |
| Residuals | 588.74 | 10 | 58.87 | |||
| Lack of fit | 578.85 | 5 | 115.77 | 58.54 | 0.0002 N | |
| Pure error | 9.89 | 5 | 1.98 |
Then, we evaluated a number of residual analyses, including residuals versus runs, actual versus predicted, and normal plot of residuals, so that it indicates the compatibility for the proposed model as shown in Fig. 4(a–c). First, as can be seen from Fig. 4(a), there was a collection of actual and predicted points with the general distribution of a linear trend. Niizawa et al. [32] indicated that this linear tendency was likely to describe better suitability between actual versus predicted data. Moreover, the diagnose plot of predicted versus residual values in Fig. 4(b) indicates a random scatter without any trend, suggesting that the variance may be independent on the residuals variables. Fig. 4(c) shows the S-shaped plot, which can provide a better analysis with a transformation of the response [33]. Combined residual analysis methods gave clear evidence of the compatibility of the proposed model, which can describe the experimental data and predict the optimum region.
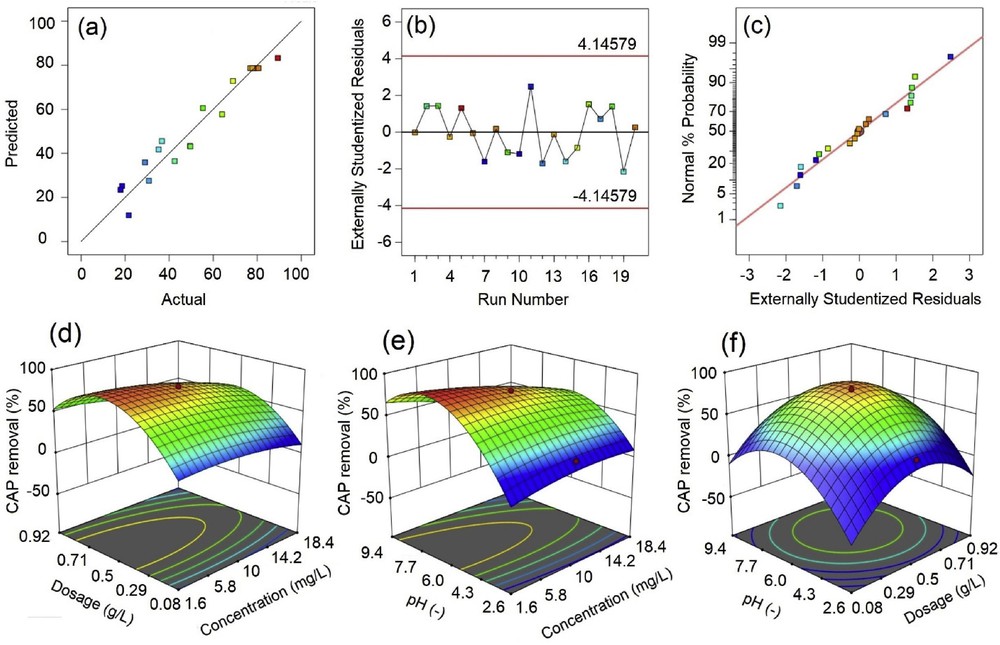
Actual versus predicted (a), residuals versus runs (b), normal plot of residuals (c), three-dimensional surface response (d–f) plots for quadratic model of CAP removal. CAP, chloramphenicol.
Three-dimensional (3D) response surface plots in Fig. 4(d–f) were used to elucidate the influential interactions of variables (concentration, dosage, and pH) and their effect on CAP removal efficiency. More specific, Fig. 4(d) shows a relationship of CAP concentration and CMC700 dosage at pH 6. It is evident that the CAP removal obtained a higher efficiency if the adsorption conditions were used at low concentration (<10 mg/L) and central level of CMC700 dosage (around 0.5 g/L). However, the pH was the most essential influent factor, as shown in Fig. 4(e). Indeed, an increase in solution pH could lead to a considerable improvement in CAP removal efficiency, and this trend reached a peak at the neutral pH region (∼pH 7). The mentioned value of optimum pH was consistent with that in a recent work reporting on the removal of CAP by using activated carbon [13]. Fig. 4(f) demonstrates that the CAP removal efficiency relied on both pH and dosage of CMC700. Evidently, the best condition for removing the CAP was the central values of these factors. For example, at pH 6 and a dosage of 0.5 g/L, nearly 90% of CAP was treated by CMC700. Finally, by using the DX10 program, the optimum conditions (concentration of 5.0 mg/L, CMC700 dosage of 0.56 g/L, and pH 6.9) for the removal of CAP antibiotic can be found, at 87.6%. Compared with the percentage of CAP removal (84.2%) obtained by using nZVI/HA particles as reported by Yao et al. [11], the result of removal efficiency in the present study was slightly higher (87.6%).
3.3 Adsorption studies
3.3.1 Effect of contact time
According to the optimization study, the best conditions for the removal of CAP antibiotic were determined. Therefore, we surveyed the effect of contact time on the CAP adsorption capacity based on the following criteria: CAP concentration at 5.0 g/L, dosage of CMC700 at 0.56 g/L, and pH of solution at 6.9. Correspondingly, the contact time investigation can be carried out by measuring the CAP concentration by UV-vis spectroscopy at scheduled periods (0, 10, 20, 40, 60, 80, 100, and 120 min) at room temperature. As can be seen from Fig. 5(a), the more extended the contact time was, the higher the CAP adsorption capacity obtained. In detail, the adsorbability toward CAP antibiotic sharply rose within the first 40 min and then gradually increased and reached the equilibrium nature at 120 min. Larger adsorption capacity at the first stage of sorption process may rely on the rapid diffusion and movement of CAP molecules into empty micropore of CMC700, but when these pores were inhabited by CAP molecules, the adsorption is gradually depleted. Based on this result, the contact time at 120 min was chosen for further experimetntal.
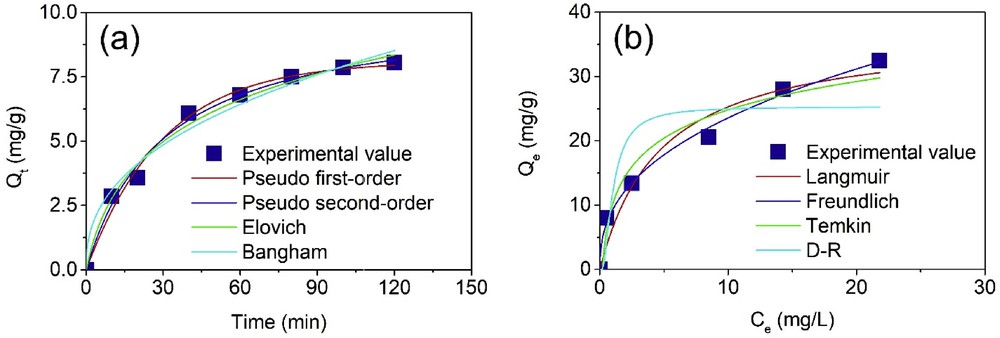
Effect of contact time (a) and initial concentration (b) on adsorption capacity of CAP onto CMC700. All experiments for the effect of contact time were under the conditions of initial concentration (5.0 mg/L), dosage (0.56 g/L), pH 6.9, and regular time (0–120 min); for the effect of initial concentration, the conditions were as follows: CMC700 dosage (0.56 g/L), pH 6.9, contact time (120 min), and various concentrations (10–40 mg/L), at room temperature. CAP, chloramphenicol; D-R, Dubinin-Radushkevich.
3.3.2 Effect of initial concentration
Based on the CCD investigation, initial concentration was one of three main variables having a profound impact on the adsorption of CAP. Therefore, it is necessary to study the fluctuation of initial CAP concentration. Herein, the experiments were conducted under the conditions of CMC700 dosage (0.56 g/L), pH 6.9, contact time (120 min), and various concentrations (10–40 mg/L) at room temperature. As shown in Fig. 5(b), the adsorption capacity tends to increase with booting the initial concentration and reached the highest capacity (32.5 mg/g) value at 40 mg/L. To gain insight into the adsorption behavior and mechanism, mentioned adsorption data could be transformed into mathematical forms by applying various models as shown in the following sections.
3.3.3 Adsorption kinetics
Generally, adsorption kinetic models can be used to well describe the uptake of CAP onto the CMC700 material in the heterogeneous phase [34]. Here, four basic equations were the pseudo-first-order, pseudo-second-order, Elovich, and Bangham equations (Eq. 8–12) The nonlinear mathematical forms of the pseudo-first-order and pseudo-second-order models are given in Eqs. 8–10 [35]. Note that the couples of k1 and k2 and Q1 and Q2 are defined as pseudo-first/second-order rate constants and equilibrium adsorption capacities, respectively (min−1); Qt (mg/g) is the adsorption capacity at time t (min); and H (mg/g min) is the initial adsorption rate [36].
| (8) |
| (9) |
| (10) |
In addition, the Elovich equation as shown in (Eq. 11) can be used to explain the chemisorption as a reversible process between adsorption [α, adsorption rate (mg/g min)] and desorption [β, desorption rate (g/mg)] over heterogeneous surfaces [37,38].
| (11) |
Meanwhile, pore diffusion mechanism can be elucidated by the nonlinear Bangham equation (Eq. 12) with αB and kB constants [37].
| (12) |
As observed in Table 5, three error functions (adjusted R2, MRE, and SSE) were used to diagnose the suitability of four models. Theoretically, any model is considered to be fitted well if the requirements of error functions are satisfied: adjusted R2 closer to 1.0, MRE less than 10, low SSE [39]. It is evident that these functions reached such standards: R2 coefficients are in the range from 0.9766 to 0.9914, MRE value is in the range from 4.58 % to 7.12 %, and SSE values are in the range from 0.52 to 16.84, suggesting that four models can be used to explain the experimental data. Among proposed equations, however, the pseudo-second-order model presented the best compatible one when the error functions including adjusted R2, MRE, and SSE reached the great magnitude, at 0.9914, 4.58, and 0.52, respectively. Therefore, the CAP adsorption kinetic on CMC700 in this study complied with the pseudo-second-order equation with the main characteristic of chemisorption assumption via mainly a rate-controlled step. In the previous study, we proved that the adsorption of CAP onto the MPC700 also fitted this equation better than other models [24]. Xie et al. [40] also reported the same trend toward the CAP adsorption onto hollow imprinted polymer nanorods.
Kinetic constants for the CAP adsorption over CMC700 material at various concentrations.
| Kinetic models | Equation | Parameters | Value |
| Pseudo-first-order | (9) | k1 (min−1) | 0.0333 |
| Q1 (mg/g) | 8.09 | ||
| MRE (%) | 5.31 | ||
| SSE | 0.52 | ||
| (Radj)2 | 0.9897 | ||
| Pseudo-second-order | (10) (11) | k2 (g/mg min) | 0.0033 |
| Q2 (mg/g) | 10.20 | ||
| H (mg/g min) | 0.34 | ||
| MRE (%) | 4.58 | ||
| SSE | 0.43 | ||
| (Radj)2 | 0.9914 | ||
| Elovich | (12) | α (mg/g min) | 0.4892 |
| β (g/mg) | 0.3760 | ||
| MRE (%) | 4.83 | ||
| SSE | 8.96 | ||
| (Radj)2 | 0.9875 | ||
| Bangham | (13) | kB (mL/(g/L)) | 1.22 |
| αB | 0.4057 | ||
| MRE (%) | 7.12 | ||
| SSE | 16.84 | ||
| (Radj)2 | 0.9766 |
3.3.4 Adsorption isotherms
Adsorption isotherm models can give more information about how the CAP molecules are adsorbed onto the CMC700 surface. Findings of the adsorption mechanism can be clarified by several isotherms such as the ones of Langmuir, Freundlich, Temkin, and Dubinin–Radushkevich (D–R), as shown in Eqs. 13–18. To interpret the monolayer adsorption behavior, the Langmuir equation can be adopted with the nonlinear mathematical form in Eq. 13. From the Langmuir equation, the maximum adsorption capacity (Qm) can be calculated via the relationship between Qe (equilibrium adsorption capacity, mg/g) and Ce (equilibrium concentration, mg/L) as shown in Fig. 5. More importantly, an adsorption process is evaluated to be favorable based on the RL constant in the range from 0 to 1 via Eq. 14, in which Co and KL (L/mg) are the initial concentration and Langmuir constant, respectively [41].
| (13) |
| (14) |
Freundlich's isotherm (Eq. 15) is used to describe the multilayer adsorption behavior of CAP onto CMC700 via a mechanism that relies on heterogonous phase surfaces, and there is no uniform distribution of heat of energies.
| (15) |
Temkin's equation is used to understand the influence of interactions during the adsorption process, and its nonlinear mathematical form is given in Eq. 16 [42].
| (16) |
| (17) |
The fourth equation, D–R, can be applied to explain the state of chemical/physical adsorption, as shown in Eq. 18. Note that B (mol2/kJ−2), Qm (mg/g), and Ɛ (kJ/mol) are defined as the D–R's activity coefficients and Polanyi's potential, respectively.
| (18) |
Table 6 summarizes the list of error functions (involving adjusted R2, MRE, and SSE) of respective four models (Langmuir, Freundlich, Temkin, and D–R). By comparing the magnitudes of error functions, the compatibility of mentioned models adhered to the following order: Freundlich > Temkin > Langmuir > D–R. Therefore, it is given that Freundlich's model gave solid evidence of fitting experimental data best, in accordance with the excellence of error functions adjusted R2 = 0.9933, MRE = 5.84%, and SSE = 4.02. Because the isotherm adsorption obeyed Freundlich's model, it is suggested that the uptake of CAP onto CMC700 was the multilayer adsorption mechanism. This finding was highly agreeable with the work reported by Xie et al. [40], in which halloysite nanotubes as-sacrificial-templated polymer nanorods were used to separate the CAP antibiotic. More interesting, Table 6 illustrated that the exponent value (1/n) and RL constant were found to be 0.4 and 0.19, respectively, proving the great favorability of the adsorption CAP onto CMC700 in this study. In comparison with the textual characteristic and adsorption capacity of various sorbents as listed in Table 7, CMC700 in this work obtained higher maximum adsorption capacity than that reported in previous works, suggesting that this adsorbent may be a good candidate for the removal of CAP from wastewater.
Isotherm constants for the CAP adsorption over CMC700 material.
| Kinetic models | Equation | Parameters | Value |
| Langmuir | kL (L/mg) | 0.2129 | |
| Qm (mg/g) | 37.2 | ||
| RL | 0.19 | ||
| MRE (%) | 18.96 | ||
| SSE | 31.76 | ||
| (Radj)2 | 0.9415 | ||
| Freundlich | kF (mg/g)/(mg/L)1/n | 9.33 | |
| 1/n | 0.40 | ||
| MRE (%) | 5.84 | ||
| SSE | 4.02 | ||
| (Radj)2 | 0.9933 | ||
| Tempkin | BT | 6.34 | |
| kT (L/mg) | 5.00 | ||
| MRE (%) | 16.63 | ||
| SSE | 23.37 | ||
| (Radj)2 | 0.9491 | ||
| D-R | B (kJ2/mol2) | 0.25 | |
| Qm (mg/g) | 25.3 | ||
| E (kJ/mol) | 1.41 | ||
| MRE (%) | 35.28 | ||
| SSE | 105.37 | ||
| (Radj)2 | 0.7385 |
Comparative textual characteristic (BET surface area, SBET) and adsorption capacity (Qm) of various sorbents.
| No. | Adsorbents | SBET (m2/g) | Qm (mg/g) | Ref. |
| 1 | CMC700 | 78.8 | 37.2 | This study |
| 2 | Fe3O(BDC)3 (MOF) | 7.6 | 24.1 | [24] |
| 3 | Mesoporous carbon from MOF | 224.7 | 96.3 | [24] |
| 4 | Matrix molecularly imprinted mesoporous sol–gel | 167.3 | 23.0 | [43] |
| 5 | Bamboo biochar | 67.8 | 8.1 | [44] |
| 6 | Nitrogen plasma modified steel shaving | 4.5 | 3.2 | [45] |
| 7 | Raw plasma modified steel shaving | 2.7 | 2.9 | [45] |
| 8 | H3PO4-functionalized biochar | – | 21.35 ± 2.27 | [46] |
4 Conclusion
The novel CMC700 material has been successfully synthesized and characterized structurally. The characteristic results revealed that CMC700 obtained a porous (SBET = 78.8 m2/g), defective structure along with surface functional groups (2.44 mmoL/g). For optimization study, it was found that three variables (initial concentration, dosage, and pH) had a profound impact on the CAP removal efficiency, and the optimum conditions (5.0 mg/L, 0.56 g/L, pH 6.9, respectively) by RSM approach were given. Adsorption kinetics and isotherm models proved that the adsorption of CAP obeyed the pseudo-second-order and Freundlich models. Compared with other previous works, the maximum adsorption capacity obtained (37.2 mg/g) was higher; therefore, CMC700 may be a suitable adsorbent to eliminate the AP antibiotic from wastewater.
Acknowledgements
This research is funded by Vietnam National Foundation for Science and Technology Development (NAFOSTED) under the grant number 104.05–2018.336.