


 CC-BY 4.0
1. Introduction
Previous research [1] has revealed that alumina–boria catalysts could be employed in catalyzing reactions, like methanol dehydration. Xiu et al. [2] employed a bimodal mesoporous boria–alumina composite for the dehydration of methyl alcohol to obtain methoxymethane, with a yield of 85%. Forni et al. [3] reported a sol–gel synthesis for the fabrication of a boron–alumina catalyst, which exhibited high catalytic efficiency for vapor-phase Beckmann reordering of (hydroxyimino)cyclohexane to caprolactam. Total conversion of cyclohexanone oxime was achieved, even with a small quantity of acid sites. Alumina belongs to a group of catalysts characterized by moderate acidity. Other than hydroxyl groups (none of them behaving as Bronsted acids), the remaining centers are associated with Lewis acidity. Modification of alumina with boron oxide generates Bronsted acid centers on the catalyst surface. Further, because boron has greater electronegativity than aluminum, borinic acid has a tougher acid force than aluminum hydroxide, contributing to organic bond cracking [4].
On the other hand, the problem of new energy sources and the question of finding resources for the petrochemical industry is one of the most important tasks of industrial chemistry and semi-product sources for almost all other branches of industry. Obtaining liquid biofuel from biomass is a different energy source, offering environmental benefits, such as fewer greenhouse influences and can be pollution-free of nitrogen and sulfur chemicals [5, 6].
Nowadays, the use of lignin represents a sustainable option, as it can be employed as process heat or transformed into renewable fuels by thermochemical technologies. Pyrolysis is the most common thermochemical process used to produce aromatic hydrocarbons from lignin polymer [7]. Lignin from softwood, hardwood, and grass have coniferyl and sinapyl alcohol monomer units [8]. Furthermore, lignin is an organic irregular polymer formed through free radical polymerization from an enzyme of alcohol precursors. As a consequence of electron delocalization in the aromatic ring, polymer bonding could take a place at different sites of the phenylpropane monomer.
Proposing a series of catalysts that selectively form organic molecules, with potential use as biofuel or organomolecules with added value in the chemical industrial market, in particular for complex organic vapors generated from lignin by pyrolysis, is necessary. However, prior to application of these materials, to study the complex lignin composition and catalytic support materials, including catalytic characteristics, such as catalytic activity, acidity, mesoporosity, stability, and even selectivity, it is necessary to understand constituent monomer units of lignin and identify the preferences of cracking of the catalysts.
In this research, we propose a catalytic material composed of synthetic aluminum–boron oxide, synthesized by a sol–gel route. One advantage of this method is the ability to tune final properties by the processing steps. The synthesized catalysts were used in coniferyl aldehyde cracking, with the aim of better understanding the catalytic activity according to characterization properties of the material’s surface. Coniferyl aldehyde was chosen instead of alcohol monomer because of its market acquisition facility.
2. Material and methods
2.1. Synthesis of aluminum–boron catalysts
A solution of orthoboric acid in 2-propanol was added, dropwise, to an aluminum isopropylate solution with continuous stirring, ensuring that orthoboric acid and aluminum isopropylate reacted completely. The molar ratio of aluminum isopropylate and orthoboric acid was 1:0.4. The pH was maintained at 3 or 4 to produce two different materials, a solution of acetic acid at 0.1 M was used to adjust the pH during the synthesis. To obtain the catalysts, the calcination was carried out at 550 °C for 8 h. All reagents were supplied by Sigma-Aldrich. A commercial catalyst of Pt/Al2O3 at 1 wt% (supplied by Sigma-Aldrich) was used in catalytic tests for comparison.
2.2. Characterization
Thermal study of the xerogels (synthesized material dried at 70 °C) was accomplished by employing a TA Instruments, model SDT-2960, thermogravimetric analyzer with a heating rate of 5 °C/min in air. X-ray diffraction (XRD) was performed with a Bruker Advance D8 diffractometer using Ni-filtered Cu Kα radiation in the 2𝜃 range (5–110°), an accelerating voltage of 35 kV, and a scan rate of 1.50°/min. The identification of crystalline phases was done using the Joint Committee on Powder Diffraction Standards (JCPDS) database. In order to study the evolution of the phases present during the preparation of the catalysts, samples were prepared from 200 to 550 °C and at each 50 °C, XRD were obtained.
Experimental scheme for kinetic tests of coniferyl aldehyde in N2 current over different catalysts.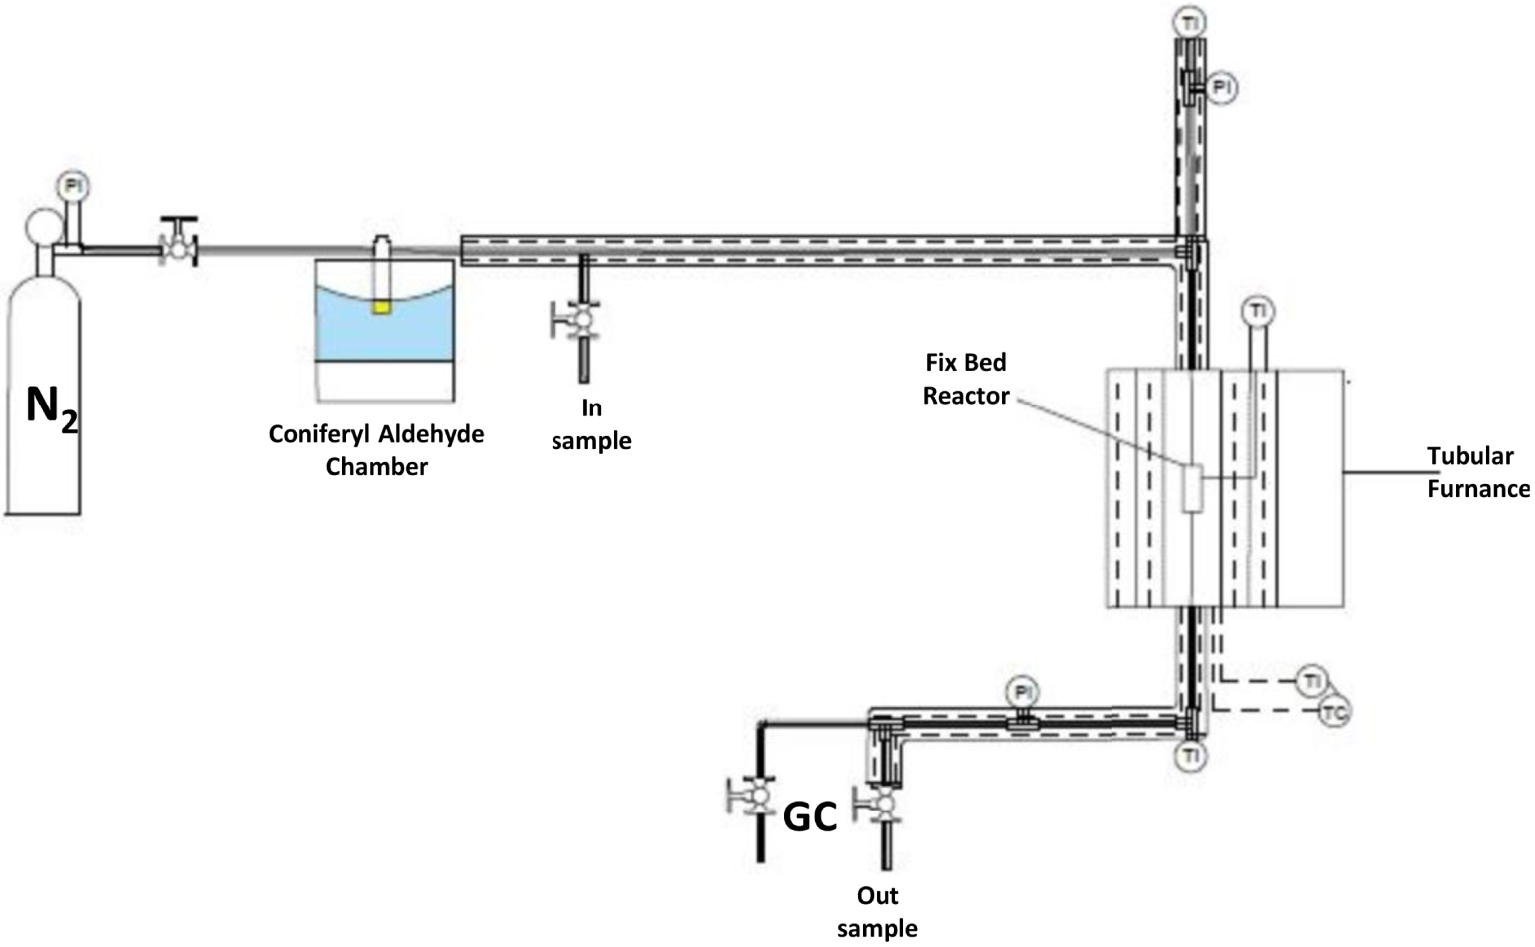
Scanning electron microscopy (SEM) images were acquired with a Nova Nano SEM200 at 10 kV and 6 mm working distance. High-resolution transmission electron microscopy (HRTEM) pictures were obtained using a Titan G2 80–300 at 300 kV, with Schottky-type field emission. HRTEM micrographs were recorded with a CCD camera and GATAN software. To prepare materials for HRTEM analysis, the powder catalysts were ultrasonically spread in ethyl alcohol and, then, supported on holey carbon-covered copper grids.
Fourier transformation infrared spectra (FT-IR) of the catalysts were recorded using a Perkin-Elmer P 1000 spectrometer. N2 sorption isotherms at 77 K were documented in a Quantachrome Co Autosorb-1 apparatus. Just before adsorption test, all powder catalysts were degassed overnight at 300 °C, and ultra-high purity He and N2 gases were used for adsorption runs.
2.3. Kinetic tests
A steel tubular reactor with an internal diameter of 6 mm was introduced into a tubular furnace, fitted alongside a temperature controller, and was packed with a gram of catalyst. Gas temperatures at the entry and exit of the steel tube were determined using type-K thermocouples. Figure 1 illustrates the experimental setup used for the coniferyl aldehyde (supplied by Sigma-Aldrich) reaction tests. The reactor influent and effluent gas analysis was performed with a HP 5890 gas chromatograph (GC), fitted with a flame-ionization detector and using an HP-5 column of 10 m length and 0.533 mm inner diameter. The steel reactor was operated with a steady state downstream, regularly after 30–40 min of operation steady state was achieved. For kinetic tests, the input concentration of coniferyl aldehyde was varied using a heat controlled vapor chamber, and the catalytic reaction was conducted at different temperatures (200, 230, 260, and 290 °C). Employing the volume reactor and total input flow of 100 mL/min, the calculated spatial velocity (SV) was 2122 h−1. The weight hourly space velocity (WHSV), calculated as the mass of flow divided by catalyst mass, was of 43.7 h−1. The next compounds were obtained in the purest possible presentation; acrolein, toluene, anisole, guaiacol, veratrol, methyl isoeugenol, 2-methoxy-4-methyl-phenol, 3-methylcatechol, eugenol, isoeugenol, pyrocatechol, decane, dodecane, tridecane, tetradecane were supplied by Sigma-Aldrich, and the GC factors were obtained in order to evaluate the concentration of the catalytic reaction products. For the reaction rate calculation, the approximation of differential reactor was used: − rCA ≈ (CCAo vo)x∕W, where rCA is the reaction rate of coniferyl aldehyde (CA), CCAo is inlet molar concentration of CA, vo the inlet volumetric flow, x the conversion fraction and W the weight of catalyst. The sieves used to choose the catalyst diameter size were 40 and 60 of mesh (425–250 μm according to ASTM). The reactor outlet was open to the atmosphere, then the pressure was considered atmospheric. The taking of inlet and outlet samples was done three times for each condition of operation.
3. Results and discussion
3.1. Thermal analysis
Figure 2a displays the thermogravimetric analysis (TGA) and differential thermal analysis (DTA) in the same plot for a xerogel of alumina with boron oxide at pH 3 (ABPH3). The TGA displays four sections of substantial weight depletion. The first mass loss of nearly 15% took place from 25–250 °C and could be ascribed to superficial water and the breakdown of isopropyl alcohol and acid boric, where transformations of boric acid into metaboric acid and then to boria occurred at 170 and 185 °C, respectively [9].
In the second section, a larger weight loss happened (near 63%) from 250–305 °C, corresponding to dehydroxylation, taking place throughout the transformation of boehmite into Al2O3 and whose shift is denoted for the following reaction; 2AlO(OH)→Al2O3 + H2O.
The next two weight loss events from 305 to 351 °C and 351–480 °C, together, totaled 85% loss. The slopes of these two losses were less pronounced, as shown in the TGA derivative (not shown here). Dehydroxylation could continue but not in the same manner as in the range of 208–305 °C; two different phenomena affected the mechanism of weight loss in the sample.
In the DTA curve, the first endothermic peak can be appreciated from 25 to 90 °C, which ratifies water desorption. A marked endothermic peak from 228 to 303 °C is interrupted by another exothermic peak from 305 °C and finishes at 331 °C. Later, another endothermic event occurs from 331 to 401 °C, followed by an exothermic feature from 401 to 461 °C. All these peaks were analyzed in the derived DTA curve (not shown here), and the events observed from 200 to 550 °C are better explained with XRD studies.
TGA and DTA of aluminum–boron-xerogel samples, synthesized at pH 3 (a) and pH 4 (b).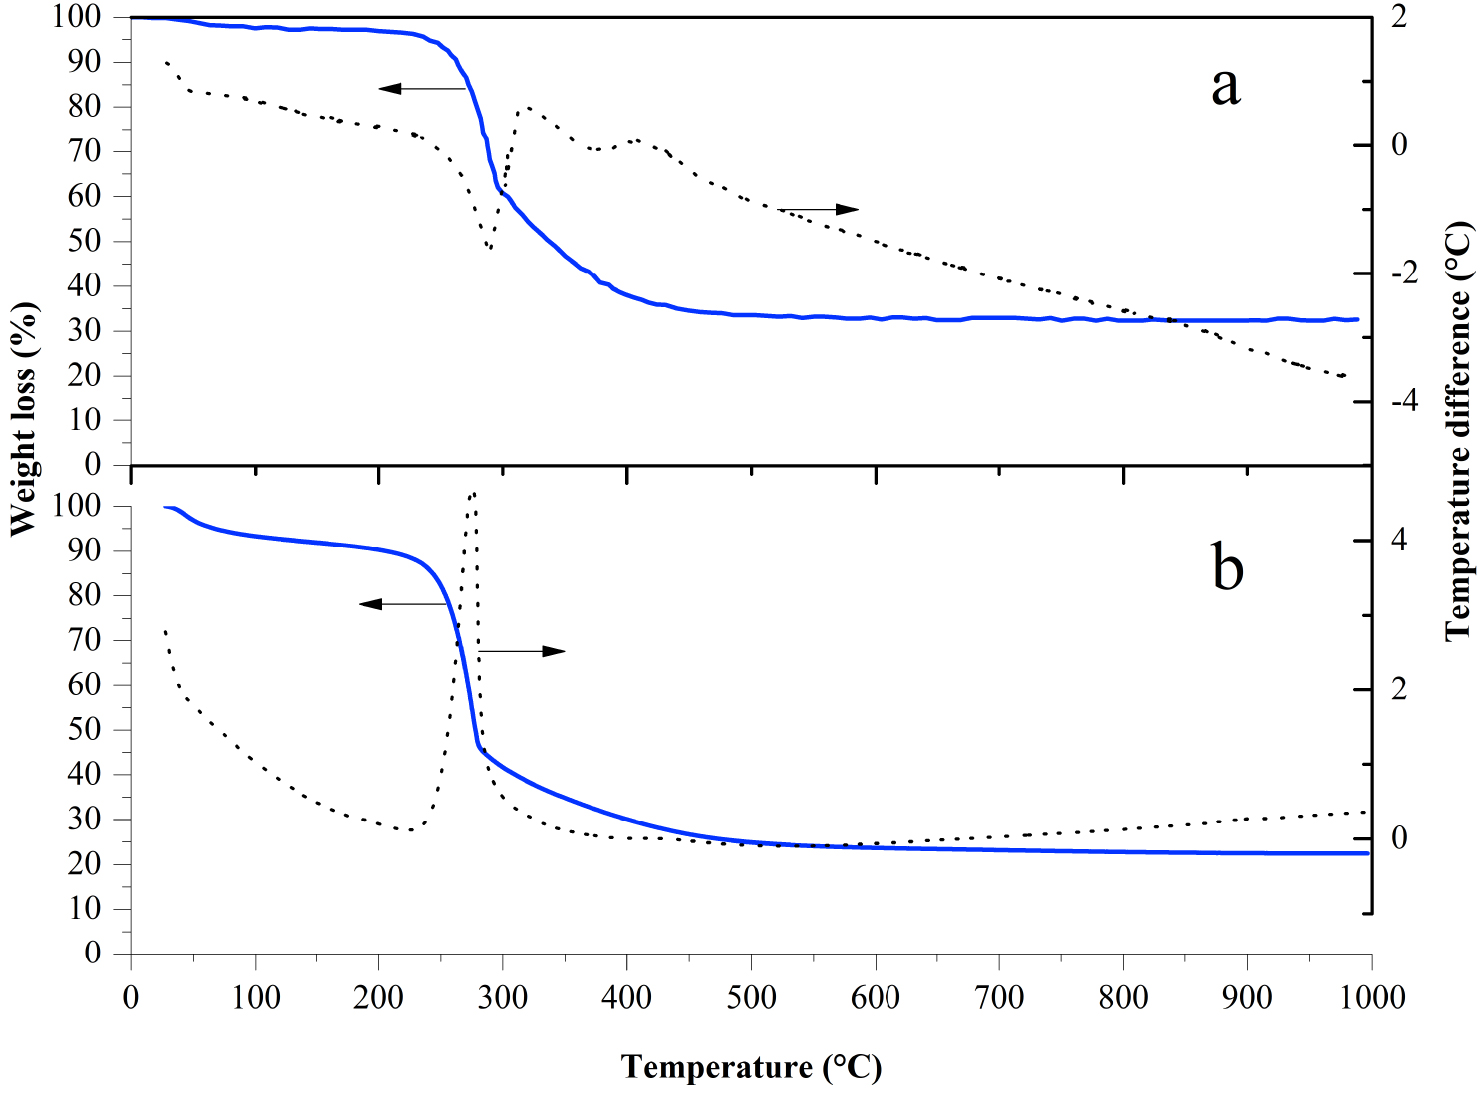
XRD patterns of aluminum–boron oxide catalysts at pH 3 (a) and 4 (b), calcined at different temperatures.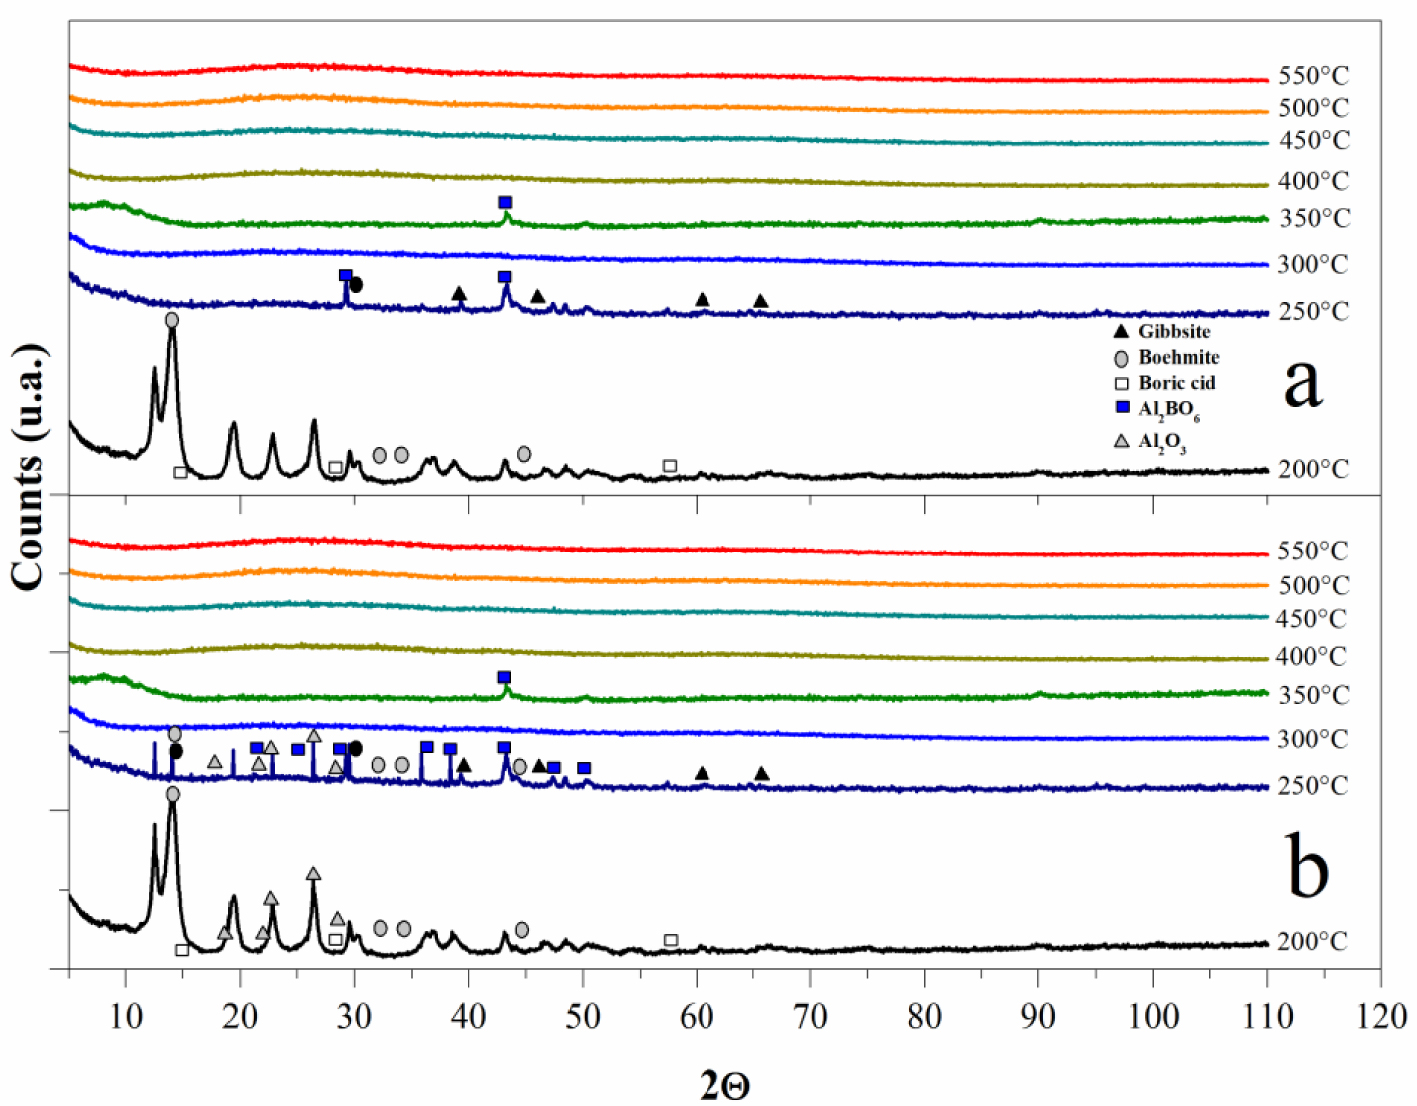
Figure 2(b) shows DTA and TGA results for alumina with boron oxide at pH 4 (ABPH4). The behavior is practically analogous to that observed for the sample at pH 3. The total weight loss for the sample at pH 4 was 76.5%, while weight loss for the pH 3 sample was 66.8%. This difference can be attributed to water content. The DTA described for the sample at pH 3 was also exhibited in the sample at pH 4, though the events were shifted by ∼40 °C or less. The exothermic event with a maximum at 275 °C in the sample at pH 4 is highly notorious and can be related to energy released by combustion, which can promote the loss of crystallinity at 300 °C reported in the XRD results (Figure 3). The loss of crystallinity was observed also for the sample with pH 3.
3.2. XRD studies
Figure 3 presents XRD patterns of both aluminum–boron oxide catalysts at two pH values and calcined at different temperatures from 200 to 550 °C. In the aluminum–boron oxide catalyst at pH 3 (Figure 3a) at 200 °C, different crystalline phases were identified: Al(OH)3 gibbsite (JCPDS 01-076-1782), AlO(OH) boehmite (JCPDS 01-083-1505), and boric acid (H3BO3; JCPDS 00-030-0199). Notably, the boehmite peak at 2𝜃 = 14.47° was more intense than the other two crystalline phases; at this temperature, the transition of gibbsite to boehmite can still be completed. In the same sample at 250 °C, the relative maximum diffraction peak (RMDP) of only the crystalline phase, aluminum–boron oxide (Al3BO6; JCPDS 00-026-0008), was detected at 2𝜃 ≈ 43.3°, and a second diffraction peak at 2𝜃 ≈ 28.9° was also marked. Even the RMDP of the boria phase was marked near this value of 2𝜃, some traces of γ-alumina (Al2O3; JCPDS 01-074-2206) were marked, as well. At 250 °C, a chemical reaction is thought to form Al3BO6 from boria and alumina oxide. Returning to DTA, the marked endothermic peak from 228 to 303 °C could be associated with the change of boric acid to boria, together with boehmite to alumina oxide species. At 300 °C, non-crystalline phases were not detected in XRD patterns, and between 250 °C and 300 °C, the crystalline phases were transformed and eventually molted, which can be described by the endothermic peak in the DTA curve with a minimum at 292 °C. At 350 °C, a crystalline signal was, again, observed, coinciding with the RMDP of Al3BO6 at 2𝜃 ≈ 43.3°. This may be related with the exothermic peak in the DTA curve with maximum at 324 °C. The amorphous state was maintained with the following temperatures. Importantly, in the XRD pattern at 350 °C, a broad diffraction peak can be seen from 2𝜃 = 6° to 2𝜃 = 14°. This signal may be related to the basal spacing of the one (001) plane (d001) to calculate the mean interlayer spacing in typical layered materials. The combination of amorphous material and the small proportion of Al3BO6 caused a layered material that was lost at higher temperatures under these conditions. In the DTA curve, an endothermic event, with its minimum at 380 °C, is related to a melting event of Al3BO6, and the exothermic event with a maximum at 416 °C describes a chemical exothermic reaction in the amorphous state, confirming the formation of aluminum–boron oxide, expected to have a stoichiometry either similar to or more complex than Al3BO6. The aluminum–boron oxide catalyst prepared at pH 4 presented very similar XRD patterns (Figure 3b). Observing how the crystalline phases (gibbsite, boehmite, boria, Al3BO6, and some traces of γ-alumina) were identified at 250 °C illustrates that increasing the pH also increases the stability of these crystalline compounds. Even, at temperatures higher than 350 °C both materials are amorphous, the diffractograms of the amorphous materials are shown in order to evidence absence of recrystallization from 400 to 550 °C. Different characteristics are even expected in the final mixed material.
3.3. SEM and TEM images
Figure 4 presents the SEM micrographs of both aluminum–boron oxide catalysts at two magnifications. The sample at pH 3 and 26,000× (Figure 4a) presents agglomerated particles smaller than 2 μm in diameter with a padded or spongy morphology. In some zones, a more dense material (more intense white color) is observed. At 200,000× magnification (Figure 4b), nanometric structures, very regular in morphology, are observed. The material is highly porous in the low density area of material, making it difficult to appreciate the porosity in the higher density zones. At pH 4 (Figures 4c and d), the catalyst is more similar in morphology to other reported amorphous Al2O3/B2O3 materials, synthesized by non-aqueous sol–gel routes [10]. These amorphous structures were regarded as a kind of arrangement of the polymeric gel and homogeneous dispersion of B2O3. At 200,000× magnification (Figure 4d), the nanoparticles presented a similar morphology, which has been reported in other works, with a mixture of Al4B2O9/Al18B4O33 crystalline phases, which presented the form of whiskers [11], but in XRD results, the samples at pH 4 and pH 3 were amorphous. Clearly, pH affects morphology in the aluminum–boron oxide catalyst. The important insight of SEM and TEM analyses of the samples at both pHs was to confirm the amorphous morphology, which only can contribute to catalytic reaction by permeability and percolation of the chemical species.
SEM images of aluminum–boron oxide catalysts (synthesized at 550 °C) at pH 3 (a, b) and pH 4 (c, d) under two different magnifications.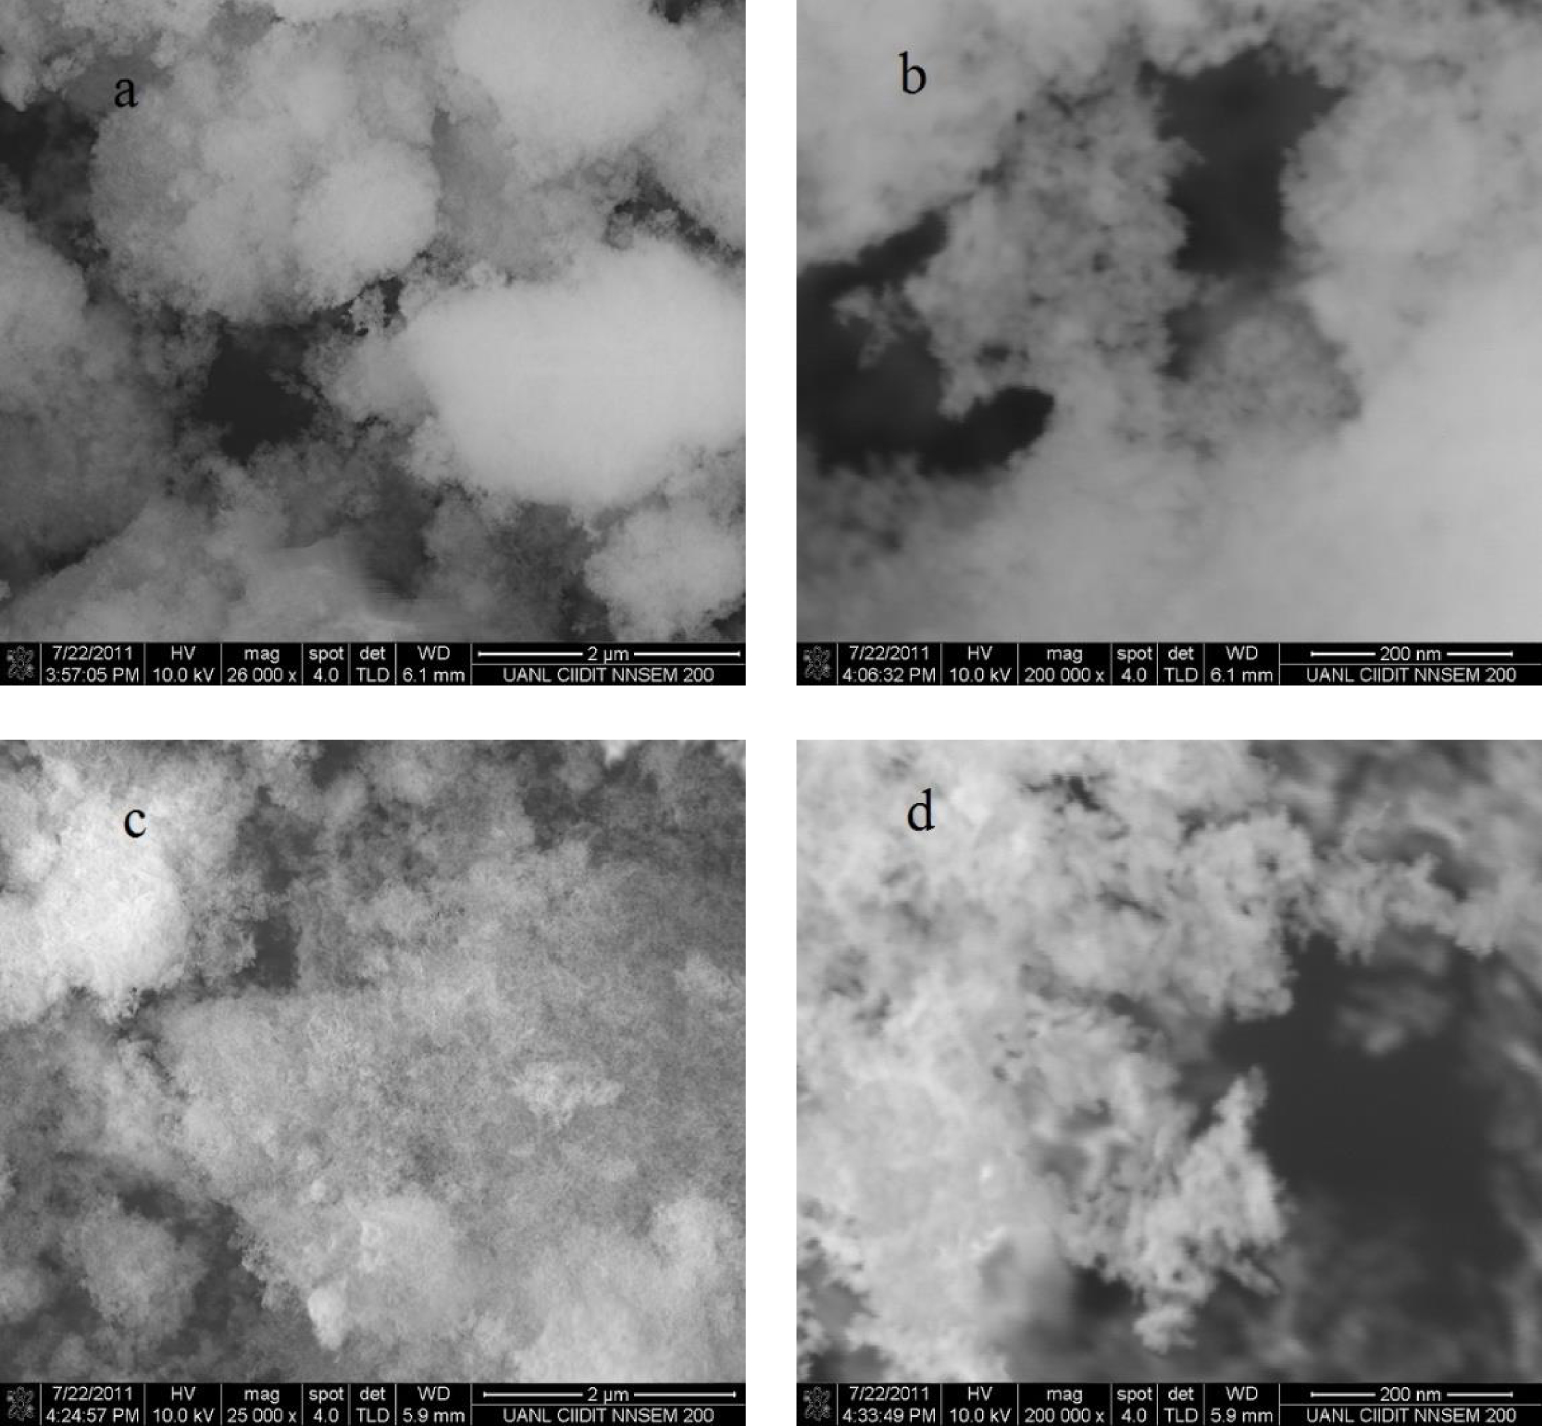
Figure 5 presents a SEM micrograph of a commercial catalyst, Pt/Al2O3 at 1 wt%. The alumina particles are well covered by platinum catalyst, but the size, morphology, and distribution of this metal are not homogeneous.
Micrograph of commercial catalyst: Pt/Al2O3 at 1 wt%.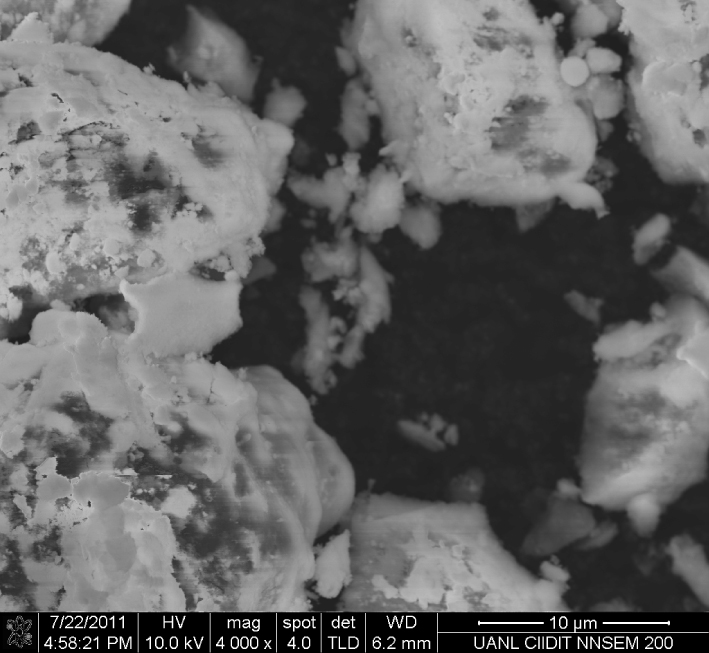
HRTEM images of catalyst ABPH4 showing agglomerated nanostructures around 20 nm in size (a) and higher magnification image, showing that the connected nanostructures are about 2 nm in diameter (b).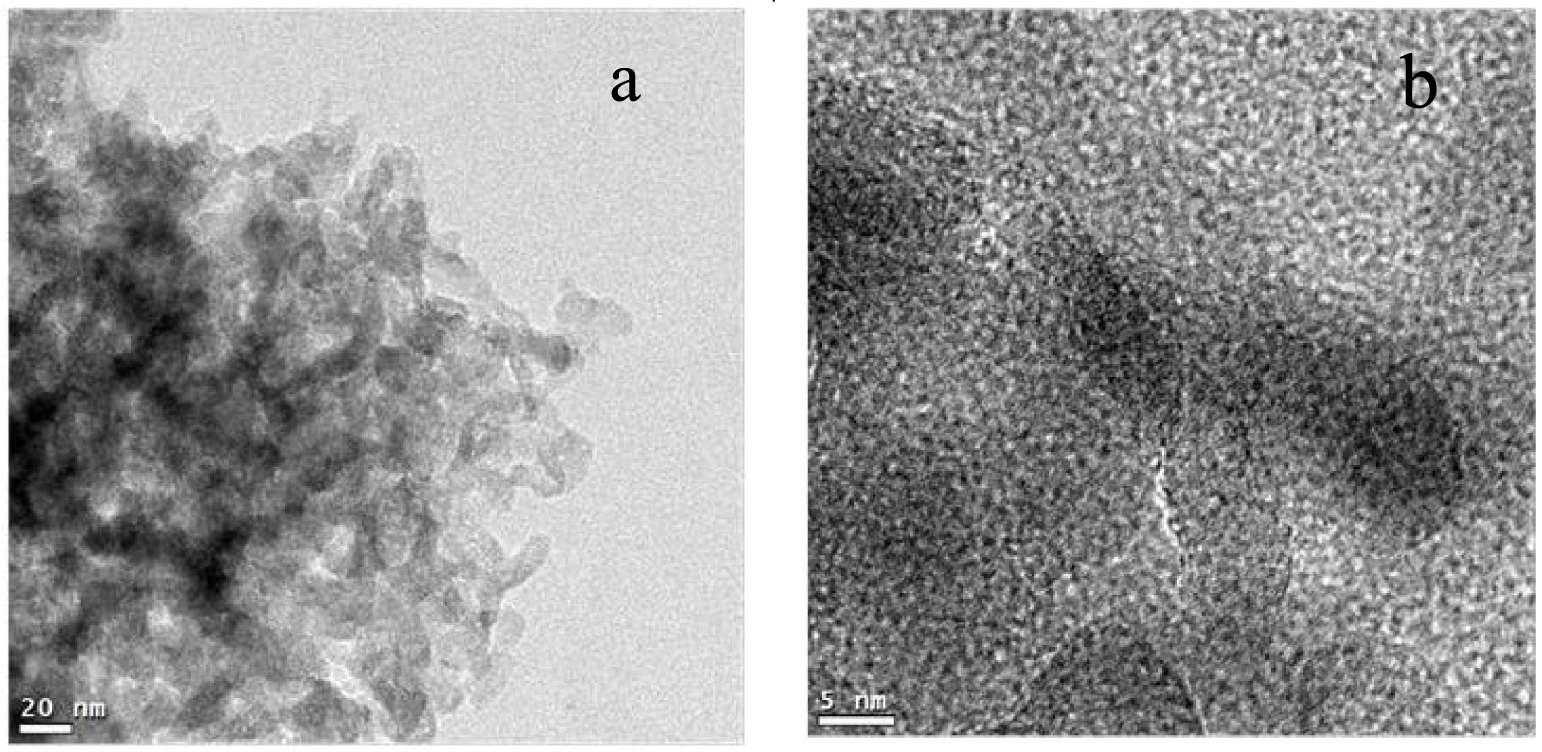
Structural parameter and acidity values for catalysts
| Catalyst | ABET (m2⋅g−1) | Pore volume Vp (cm3⋅g−1) | PSD mode (Å) | Average pore size (Å) |
|---|---|---|---|---|
| ABPH3 | 164 | 2.095 | 18.0, 158.1 | 158 |
| ABPH4 | 158 | 2.104 | 18.12, 154.91 | 179 |
ABET is the BET surface area; Vp is the BJH method cumulative desorption pore volume.
Figure 6 shows the HRTEM images of aluminum–boron oxide catalysts at pH 4. The amorphous nature of this sample can be clearly observed, consistent with XRD results. Figure 6a reveals agglomerated nanostructures around 20 nm in size, with whisker-like morphology. The addition of boric acid to the aluminum precursor in the solution step and thermal treatment until 550 °C produced an amorphous material with a spongy conformation and nanometer-sized agglomerates. Figure 6b presents a higher magnification image on these whisker-like nanostructures (dark part in the center of the image), showing that the connected nanostructures are about 2 nm in diameter, with lengths varying from a few nanometers to more than 20 nm.
3.4. Textural analysis from N2 isotherms
Figure 7 depicts the isotherms of N2 adsorption and desorption for both the synthetic catalysts (calcined at 550 °C) and the pore size distributions (PSDs) determined according to the desorption curves using the Barrett, Joyner, and Halenda (BJH) method for both samples. Table 1 presents the pore structural parameter values. The specific area, estimated with the Brunauer–Emmett–Teller (BET) technique, indicated values lower than those obtained in γ-alumina synthesized by sol–gel in other works [12].
N2 sorption isotherms (a, b) over both synthetic catalysts, and the PSD of the catalyst (c, d). (a) and (c) are for ABPH3, (b) and (d) for ABPH4.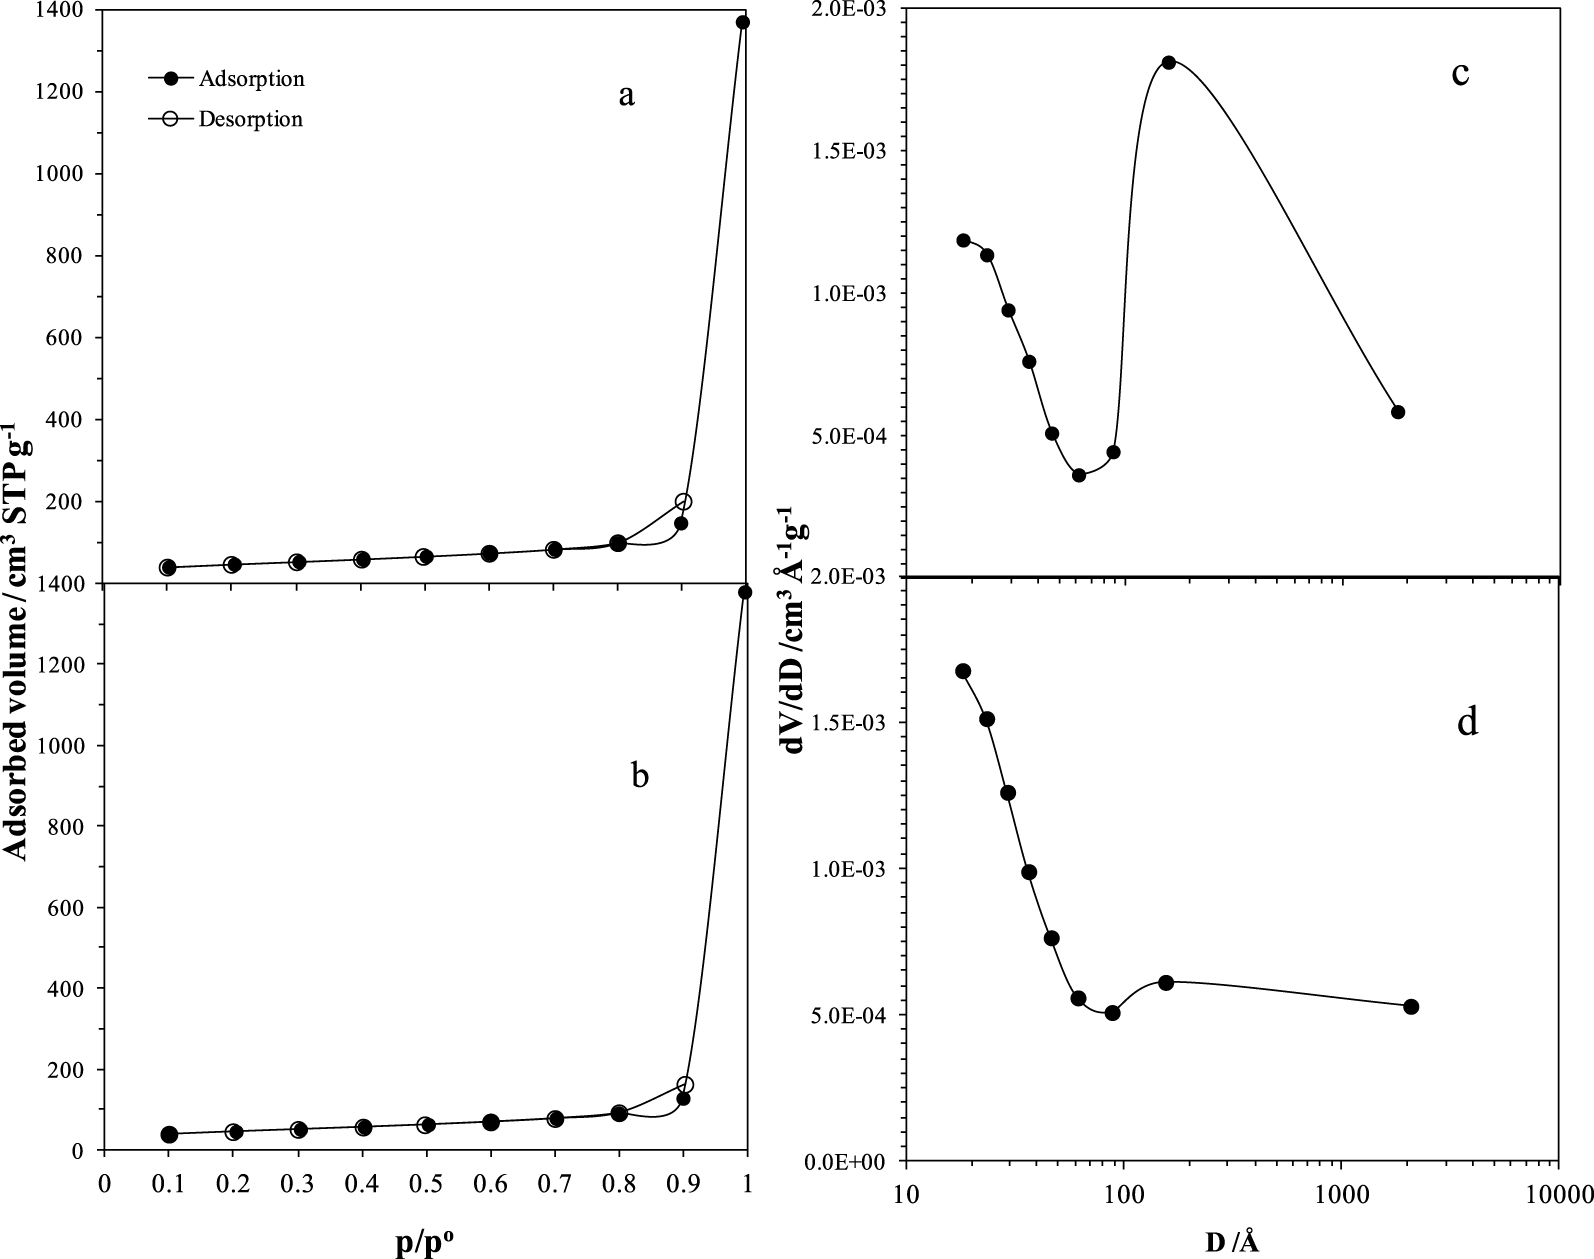
FT-IR spectra of aluminum–boron oxide catalysts, calcined at 550 °C, at pH 3 (a) and pH 4 (b).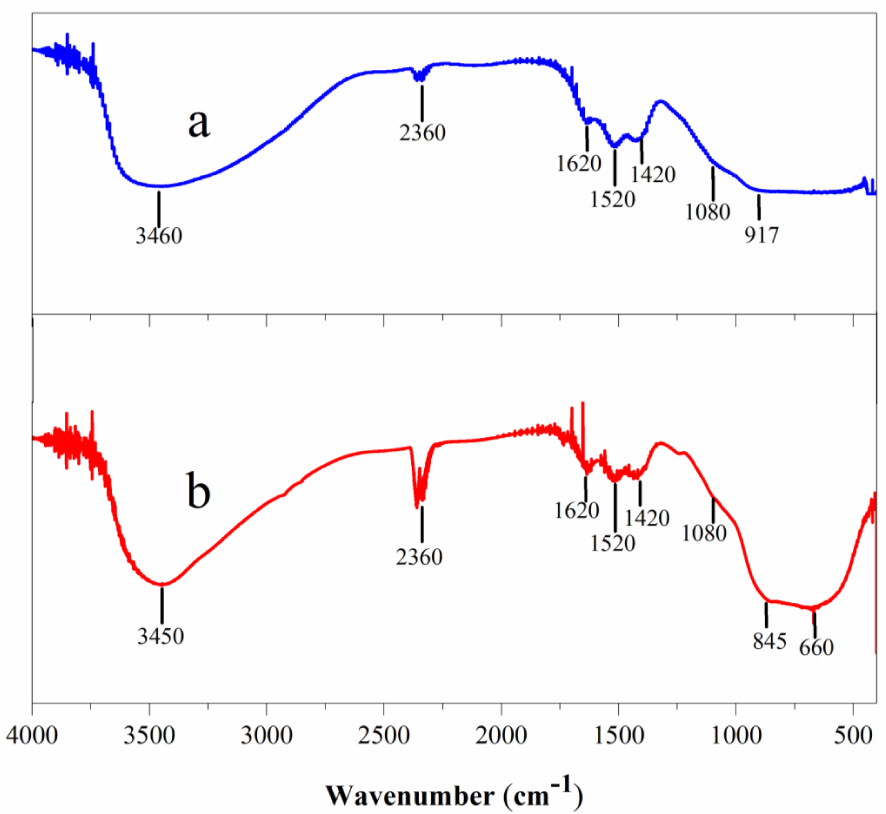
Surface reaction rates data of the CA cracking reaction at four different temperatures on ABPH3 (a), ABPH4 (b), and Pt/alumina (c) catalysts. The solid lines illustrate fittings from the model presented in (12).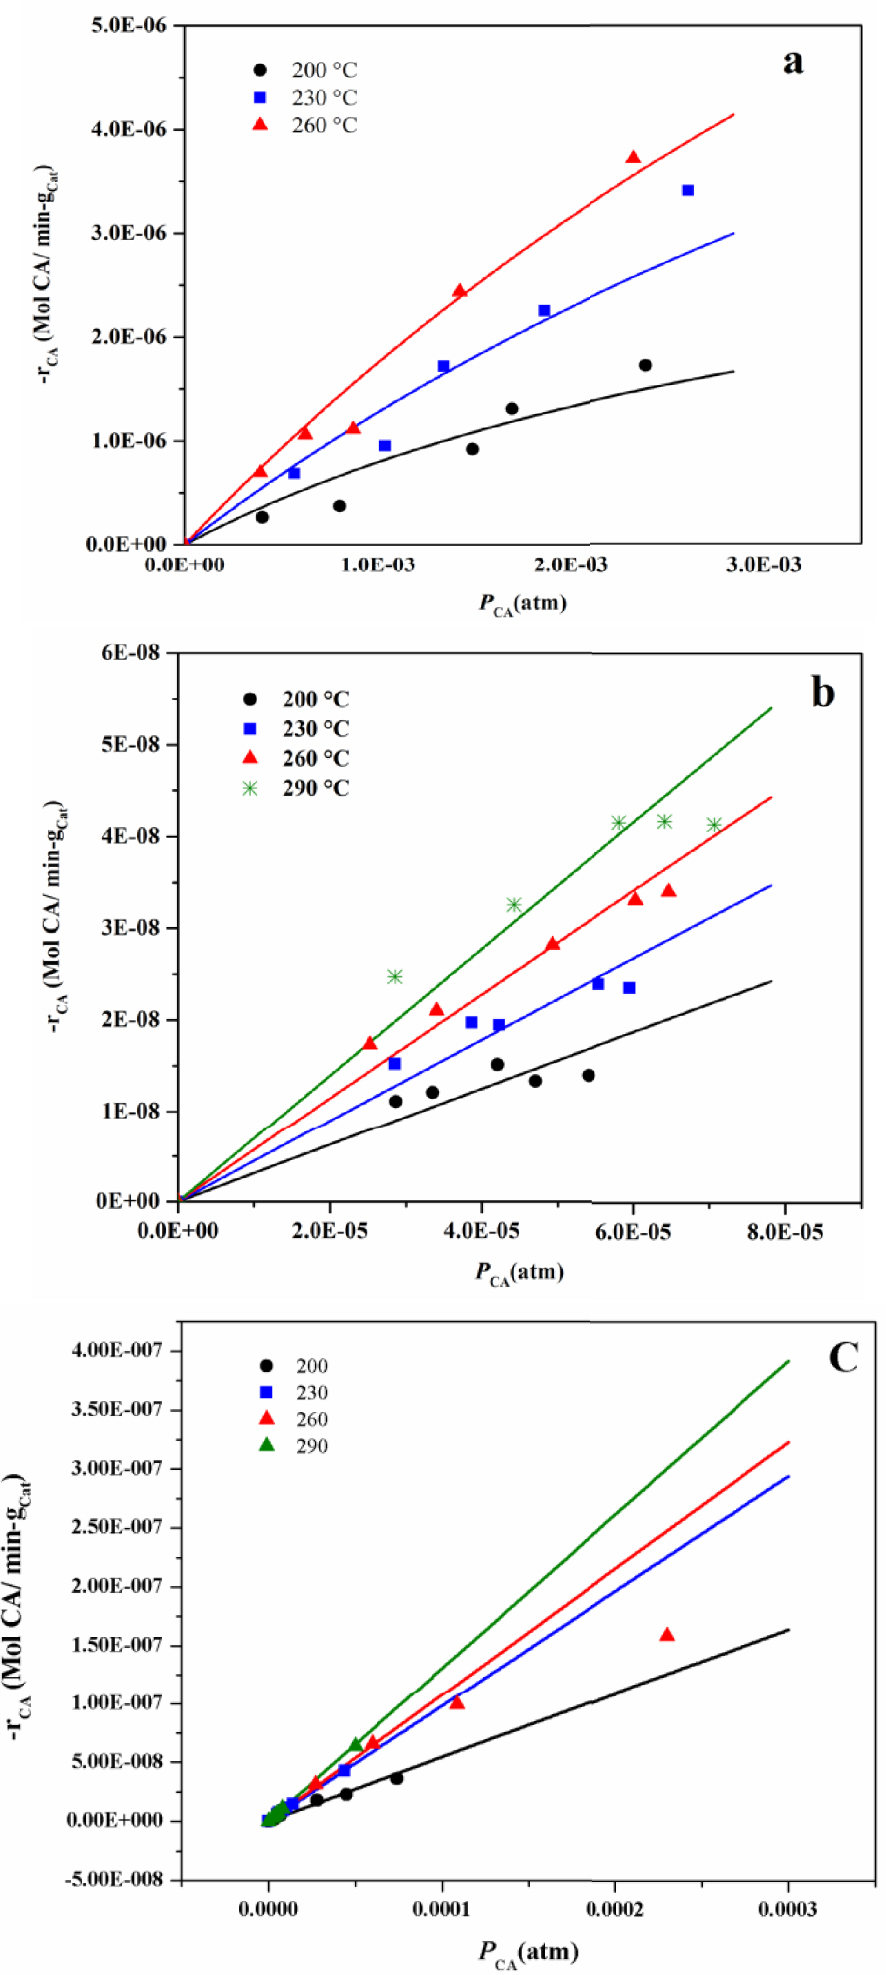
The sorption curves for ABPH3 and ABPH4 are presented in Figures 7a and b respectively. Black circles depict adsorption values, and white circles represent desorption values. The shape of isotherms, as stated by IUPAC classification, matches type V with a hysteresis loop [13]. Isotherms indicated mesopores (2–50 nm) and also existence of macropores (>50 nm). The hysteresis loop is practically present from only 0.8 to 0.902 p∕po, indicating no interconnection between cavities. With this characteristic combination of meso- and macropores it can be assumed that the solid aids percolation of different-sized molecules once the cracking products are released [14]. The PSD of ABPH3 (Figure 7c) is bimodal PSD (18–61 Å and 61–1790 Å) and ABPH4 shown in Figure 7d, also shows a bimodal PSD (18–87 Å and 87–2068 Å), but the PSD is less pronounced in the second range.
The structural properties of commercial catalyst (Pt/Al2O3 at 1 wt%) were not measured.
3.5. FT-IR analysis
Figure 8 presents the FT-IR spectra of aluminum–boron oxide catalysts at pH 3 and pH 4, both calcined at 550 °C. The bands detected around 2630 and 3460 cm−1 match the O–H stretching vibration, arising from the remaining alcohol and water absorbed on both samples. Notably, the band in the sample at pH 4 (Figure 8b) is more intense and defined than for the sample at pH 3. Homogeneous OH species are present on the pH 4 sample instead of the pH 3 sample, leading to a broader and more flattened band, likely owing to greater intermolecular interaction of hydrogen bonds. The band at 2360 cm−1 on both spectra is related to vibrational transitions in polarized dimeric oxygen molecules in the boehmite and γ-alumina lattice [15]. The band located at ∼1620 cm−1 is typical of the bending mode of H–O group frequencies, owing to the distorted vibration mode of superficial water, observed for both samples. The bands at 1500–1300 cm−1 are attributed to BO3 asymmetric stretches, and because of B–O–Al, they also remain in the same section [2]. In both spectra, the bands at 1520 cm−1 and 1420 cm−1 are related by those bonds. The small bands at 2360 cm−1 (in both samples) can be related to the background CO2. In the sample at pH 4, a strong and broad doublet at 845 cm−1 and 660 cm−1 indicated the existence of AlO6 octahedron, attributed to the existence of the AlO4 tetrahedron [12], which is barely noticed in amorphous alumina. The shoulder at 1080 cm−1 can be related to BO4 asymmetric stretches [2]. In the spectra of the pH 3 sample (Figure 8a), two bands were identified from 1080 to 1620 cm−1. For the same sample, in AlO4 and AlO6 (700–900 cm−1 and 500–900 cm−1), features were identified as broad and flattened bands, with only a slight shoulder at 917 cm−1. A possible explication of why the sample prepared at pH 3 presents a more marked doublet of AlO4 and AlO6 is that a greater concentration of hydronium ions in the syntheses is thought to cause intermolecular interactions with the oxy-aluminate signals.
3.6. Kinetic tests
Studies of surface reaction kinetics of coniferyl aldehyde (abbreviated as CA for this section) were conducted on the synthetic ABPH3 and ABPH4 catalysts, as well as a commercial catalyst (Pt/alumina at 1 wt%). Figure 9 depicts the experimental rate data as a function of CA partial pressure, the error of taking samples in GC areas was not significant, at less than 5%, and it was not represented. Although some conversions were too large to be considered in the model of differential reactor, the reaction rate of those few experimental data was estimated in order to decipher the tendency. The continuous lines are data fittings using (9), as explained later. Pinto et al. present a complete work about statistical analysis of theoretical kinetic-estimated parameters and also mention that the fitting stage is unavoidable [16]. In this work we present a fitting of experimental data in order to obtain the kinetic parameters.
It is important to calculate external and the intraparticle mass-transfer effect in order to determine that the experimental data can be taken to fit the surface reaction model. The Mears criterion to evaluate the external mass transfer from the bulk of the fluid phase to the catalyst surface [17] is according to
| (1) |
The kc values for 200, 230, 260 and 290 °C were 16.95, 18.33, 19.73, 21.16 MolA/cm2-s/(MolA/cm3) or cm/s respectively and the highest values for n = 1 and 2 were 1.87 × 10⁻³ and 3.74 × 10⁻³ respectively for ABPH3 and ABPH4 catalyst tests, therefore it can be considered that CAb ≈ Cs.
The Weisz–Prater criterion was applied to evaluate the internal diffusion [18], into the ABPH3 and ABPH4 catalysts.
| (2) |
The effective diffusivity can be calculated:
| (3) |
| (4) |
| (5) |
The DCA‐N 2 evaluated from 200 to 290 °C was from 2.39 × 10⁻¹ to 3.58 × 10⁻¹ cm2/s, the DK in the same range of temperature was from 1.33 × 10⁻² to 1.45 × 10⁻² cm2/s, the Dp resulted from 1.26 × 10⁻² to 1.39 × 10⁻² cm2/s and finally giving the Deff values were from 1.68 × 10⁻³ to 1.86 × 10⁻³ cm2/s. The density of amorphous alumina is 2.35 g/cm3 [23] and amorphous borax is 2.46 g/cm3 [24], then the density of the ABPH3 and ABPH4 catalysts can be estimated as 2.40 g/cm3. The values of 𝛷 for the ABPH3 catalyst using the experimental data (Figure 9a) at 200 °C were from 0.12 to 0.20, at 230 °C from 0.25 to 0.35, at 260 °C from 0.35 to 0.49 and for the ABPH4 catalyst the values of 𝛷 at 200 °C from 0.07 to 0.10, at 230 °C from 0.11 to 0.14, at 260 °C were from 0.14 to 0.19 and at 290 °C from 0.16 to 0.24. If the order of reaction was only two, the data of temperatures of 230 and 260 °C of the ABPH3 catalyst do not meet the Weisz–Prater criterion, but if the order was one, all the data of both catalysts meet the criterion.
Figure 9a depicts the experimental reaction rate over ABPH3 at three temperatures: 200, 230, and 260 °C. The reaction rates of the three isotherms follow the same tendency, with slight concave downward curvature that can be interpreted as some CA deposition on the catalyst. For ABPH4 (Figure 9b), the behavior is more marked at 260 °C and 290 °C. At 290 °C, cracking occurred [25]. The commercial catalyst, Pt/alumina 1 wt% (Figure 9c), presented more of a linear behavior. In addition, detectable black coloration in the used catalysts was not observed, and thus it can be inferred that coke formation was not present for the catalytic CA tests at the operation temperatures (from 200 to 290 °C).
Catalytic activity and kinetic parameters for the LHHW model
| LHHW model (Equation (12)) | |||||
|---|---|---|---|---|---|
| % conversion | KCA | ||||
| T = 260 °C PCA0 ≈ 2.5 E-3 atm | k0 (mol/min⋅gcat) | Ea (J/mol) | (J/mol) | (J/mol⋅K) | |
| ABPH3 | 70 | 8.7557 × 10⁻¹ | 47,831 | −23,832 | −5.48 |
| ABPH4 | 33 | 7.2655 × 10⁻² | 32,046 | −23,254 | −4.31 |
| Pt 1%/Al2O3 | 51 | 7.7912 | 49,020 | −29,721 | −37.17 |
A simple kinetic model of conversion of the only reactive is presented as a first proposal to the kinetic analysis. For interpretation of reaction rate for the cracking reactions; the Langmuir–Hinshelwood model has been used to fit data in other works [15, 16]. Basically, the mechanism consists of the following:
adsorption of CA onto a single active site of catalyst surface,
| (reaction 1) |
| (reaction 2) |
| (reaction 3) |
| (6) |
| (7) |
| (8) |
| (9) |
| (10) |
| (11) |
| (12) |
Percentages of reaction products at 260 °C and 2600 ppm of CA at the inlet for different catalysts. HTE describes a group of compounds with higher molecular weights than eugenol.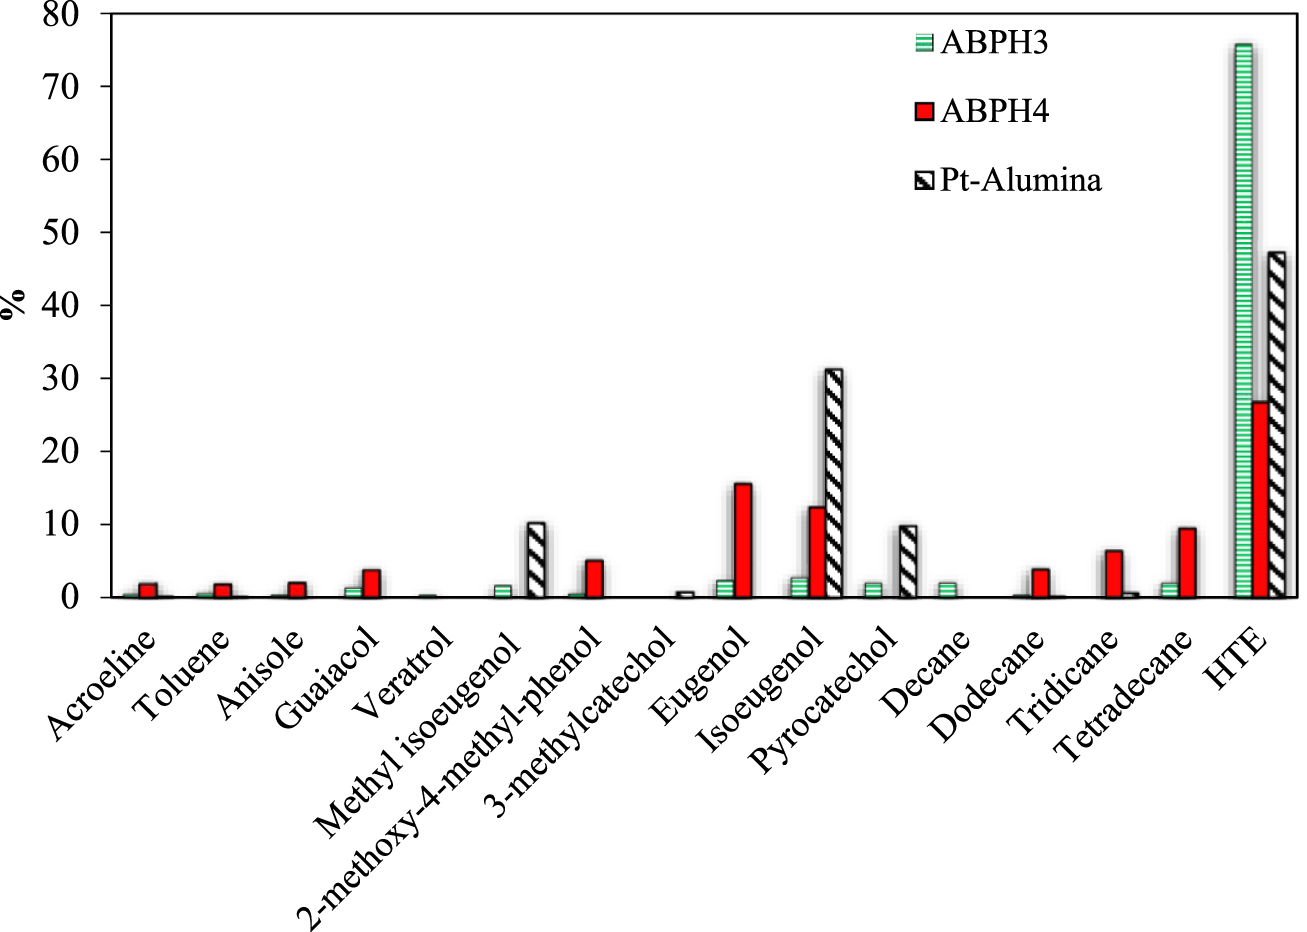
Table 2 contains activation energies of the rate constant (k) and pre-exponential constant, according to Arrhenius model:
| (13) |
| (14) |
Dealkylation of alkyl-aromatic molecules, such as isopropylbenzene, have been suggested to be accomplished on Bronsted acids, where the molecule can receive protons to create π complexes, which can be quickly converted into σ complexes [27, 28].
With respect to the use of the van’t Hoff equation for studying adsorption equilibrium constants, the heats of adsorption for all catalysts were negative (exothermic). Vannice suggested criteria to corroborate the parameter obtained from kinetic fittings [29], and as the first criterion, adsorption must be always exothermic. Therefore, the enthalpy of adsorption is negative, i.e., (Qads > 0). Secondly, entropy has to present a diminution after adsorption; as a result, , where is the standard total entropy in the gas phase.
The heat of adsorption for ABPH4 (−23,254 J⋅mol−1) indicates that CA is moderately adsorbed, owing to catalyst acidity, and reinforced by entropy depletion (−4.31 J⋅mol−1⋅K−1). A low value of means that adsorbed CA molecules should be quite mobile over the ABPH4 catalyst surface. ABPH3 presented similar values. For the commercial catalyst, the value of was significantly different (eight times higher) than the synthetic catalysts. In fact, this value indicates the good affinity of platinum catalyst for adsorbing CA molecules. Lastly, the heats of adsorption for the three catalysts are similar.
3.7. Identification and distribution of products
Figure 10 presents the percentages of different species in the outlet current of the continuous experimental catalytic reactor, not accounting for unreacted CA. All reported species were compared to pure compounds, which were injected in the chromatographic column and identified for the retention time by a FID as well. Compounds with higher retention time in GC than eugenol and probably with mass molar weights higher than eugenol (HTE) were also reported, which were not evaluated by injection of pure compounds and were only identified by the FID. The percentages of reaction products were calculated taking into account the reported areas from GC results.
ABPH3 produced a high percentage of molecules with mass molar weights higher than eugenol (HTE in Figure 10) and very low percentages of the identified compounds (e.g., eugenol, isoeugenol, pyrocatechol), with all of them accounting for less than 5% of the outlet composition. Instead, catalyst ABPH4 produced low weight molecules, such as acrolein (the aldehyde branch in CA molecule), toluene, anisole, and guaiacol, with a presence less than 5% in the exit current. The Pt/alumina catalyst did not yield these low weight compounds; though, veratrol was reported because it appeared at other concentrations and temperatures. The next group of molecules more similar to CA, such as methyl isoeugenol, 2-methoxy-4-methyl-phenol, 3-methylcatechol, eugenol, isoeugenol and pyrocatechol, were distributed as follows. Methyl isoeugenol, eugenol, and isoeugenol appeared for ABPH4, together, accounting for a total of 33%, while the Pt/alumina catalyst presented methyl isoeugenol, very little 3-methylcatechol, isoeugenol, and pyrocatechol, accounting for a total of 52%. In the group of aliphatic chains, ABPH4 presented a total of 19%, but the Pt/alumina catalyst only summed 0.63%. Clearly, the synthetic ABPH4 catalyst favored the recombination of free radicals to form aliphatic compounds. The HTE compounds, which were not evaluated, totaled 26% for ABPH4 catalyst and 47% for the commercial catalyst. Both synthetic catalysts produced a greater variety of cracked compounds, particularly eugenol isomers and isoeugenol species, with higher percentages; the commercial catalyst did not yield such a wide variety. The commercial Pt/alumina and ABPH3 catalysts presented heavier compounds. For eugenol, a double bond exists in the adjacent chain of ethyl, although the double bond is moved to the next carbon in isoeugenol. Both compounds have very similar properties, such as the heat of combustion and being high-value precursors to the fine chemical industry [30]. It is necessary to clear that 100% of mass balance was not evaluated due to the non-identification of the HTE. It is important to note that the products—methyl isoeugenol, isoeugenol and pyrocatechol—were almost 55% for the commercial catalyst; it can be thought that the Pt covering the surface of alumina (as was seen in Figure 5) promoted this kind of products.
For the four temperatures, eugenol and isoeugenol compounds were detected and evaluated as the highest molar percentage values of all species measured using synthetic catalyst ABPH4 and in lower percentages when using ABPH3. The molecular formula of eugenol has two more hydrogen atoms and one less oxygen atom than CA. We could establish that the hydrogenation of CA on the aluminum–boron oxide catalysts is the first step reaction network route for deoxygenation. At the conditions tested from 200 to 260 °C, the cracking of CA on ABPH4 provides valuable organic products, which are considered combustible, and taking into account the highest percentages, they can be ordered according to decreasing combustion potential: tetradecane, eugenol–isoeugenol, 2-methoxy-4-methylphenol, veratrole, and 3-methylcatechol-toluene-guaiacol.
3.8. Proposed reaction network to form eugenol
In principle, CA can be absorbed as a π complex, as mentioned previously. Observing the product percentages in Figure 10, the transformation of CA to the product eugenol is the first step in the reaction network. Given the formulas of CA and eugenol, clearly CA lost its carbonyl oxygen and gained two protons and moved the double bond between C2 and C3 of the aldehyde radical to C1 and C2 (Figure 11). In the aldehyde functional group, the oxygen is more electronegative than carbon and, hence, pulls electron density back from carbon to raise the bond polarity. Consequently, the carbonyl carbon becomes electrophilic, and as a consequence, more reactive with nucleophiles that, in our case, can be free protons. Also, the electronegative oxygen can react with an electrophile, for example, a proton in a Lewis acid site, forming an oxocarbenium ion. It can be inferred that the loss or gain of H2 is not enough to explain the formation of the observed products, but it can be a beginning to propose a scheme. It is necessary to denote that at step 6 it appears that an oxygen atom species is free, but it really is still present on the solid catalyst material. Figure 11 presents the proposed scheme, which is only to show that it is possible to arrive from CA to eugenol as product.
Scheme of eugenol formation from coniferyl aldehyde, catalyzed for catalyst acid sites. M can be Al or B.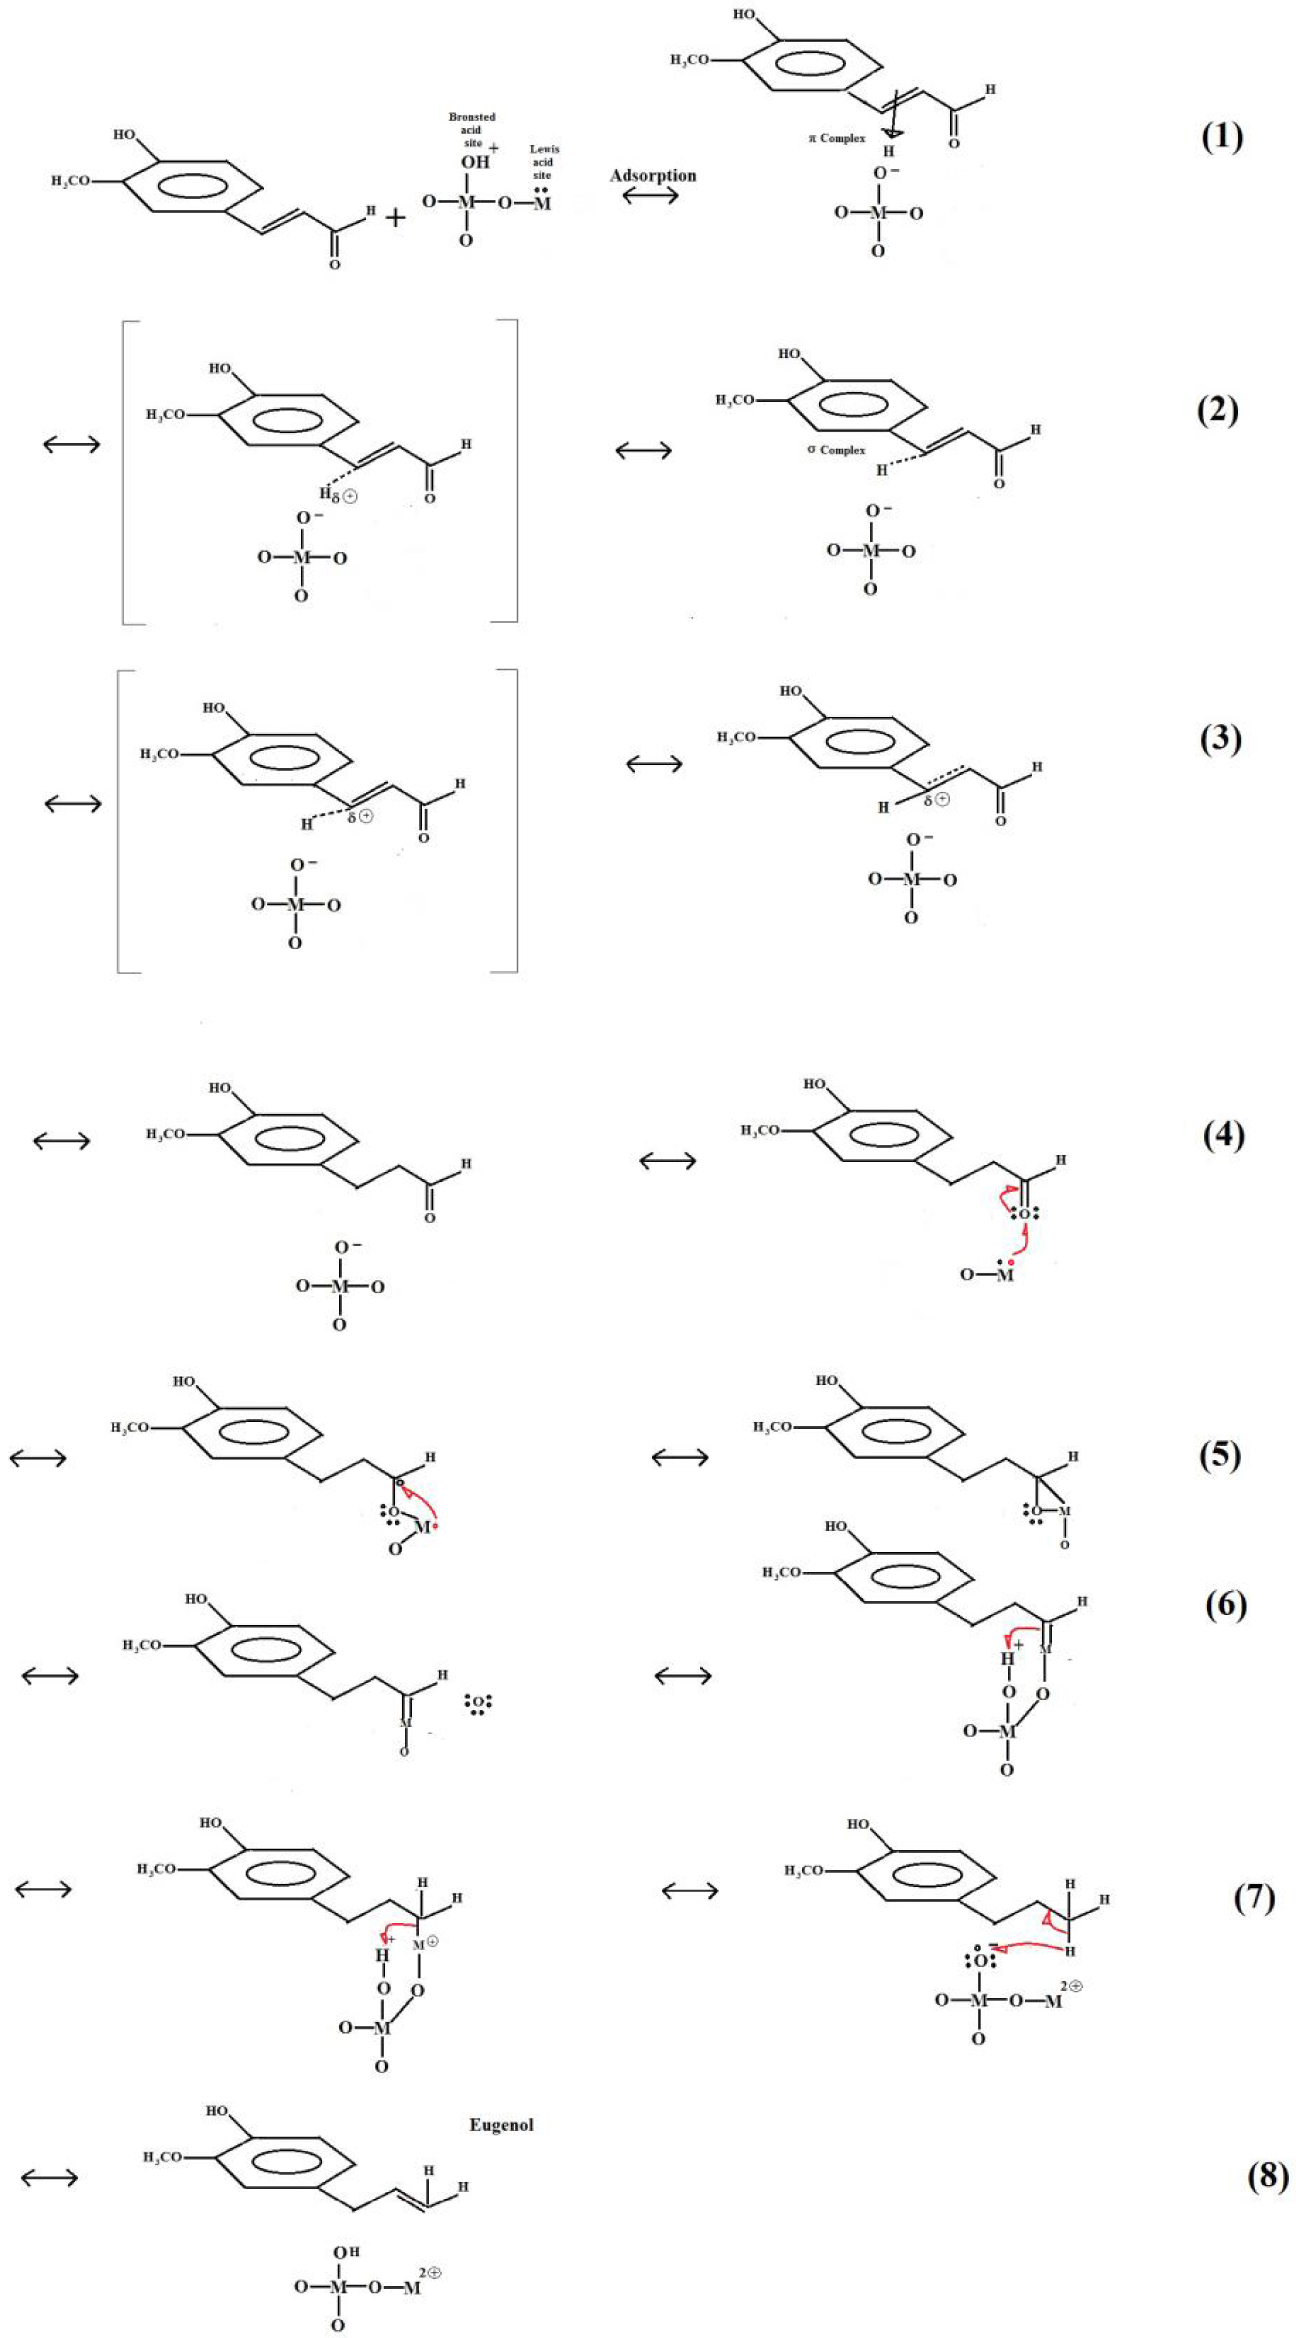
4. Conclusions
Two catalysts were synthesized from a mixture of aluminum oxide and boron oxide by a sol–gel method at both pH 3 and 4. The catalysts, calcined at 550 °C, were amorphous, but during the thermal process different crystalline compounds were detected, indicating intimate interaction between boron and aluminum bonds, yielding compounds such as Al3BO6, identified at 350 °C. All crystalline phases were melted and formed an amorphous structure. SEM analysis showed a spongy morphology in both catalysts, but the sample synthesized at pH 4 exhibited more whisker-like nanostructures, about 5 nm in diameter with lengths varying from a few nanometers to over 20 nm, providing homogeneity in the morphological structure of the catalyst. Both materials were mesoporous, and the porous structural properties promoted percolation and permeability of the chemical compounds. The boron–aluminum interaction was confirmed by FT-IR analysis, but the surface was influenced by pH, i.e., the concentration of hydronium ions, of the synthesis mixture.
Kinetic tests were completed for both aluminum–boron oxide catalysts and the commercial catalyst, Pt/alumina at 1 wt%, for thermocatalytic degradation of coniferyl aldehyde at different temperatures and concentrations under N2 current. The aluminum–boron oxide catalysts presented low values of , as one of thermodynamic properties of the adsorption constant of reaction rate for the Langmuir–Hinshelwood-type model of coniferyl aldehyde cracking, indicating high mobility of the adsorbed molecule on the catalytic surface. In contrast, the commercial catalyst, Pt/Al2O3, presented stronger adsorption of coniferyl aldehyde in the same model. The synthetic catalysts in this work produced a wider variety of organics products, including acrolein, the acrylic aldehyde functional group which forms part of the coniferyl aldehyde molecule; low weight aromatics; eugenol and isoeugenol isomers, with a high percentage of production; and aliphatic chains (10 to 14 carbons). Using the commercial catalyst, the variety of organic products was not as extensive, though a high production of isoeugenol was observed. A transformation scheme from coniferyl aldehyde to eugenol was proposed over the aluminum–boron oxide catalysts. Altogether, the synthetic aluminum–boron oxide catalyst at pH 4 is a good option for producing compounds with high commercial value.
Nomenclature
| CA | Moles of coniferyl aldehyde |
| [ ] | Free active site |
| [CA] | CA adsorbed on active site |
| [I] | Active site occupied by an intermediate |
| P | Product formed |
| KCA | Equilibrium constant for adsorption of coniferyl aldehyde, atm−1 |
| 𝜃CA | Fraction of site occupied by CA |
| PCA | Partial pressure of CA, atm−1 |
| 𝜃f | Free fraction on active site |
| rCA | Reaction rate of coniferyl aldehyde, molCA/min⋅gcat |
| k | Kinetic constant of surface reaction, molCA/min⋅gcat |
| k0 | Pre-exponential factor in Arrhenius model |
| Ea | Activation energy, J/mol |
| Change in standard enthalpy of adsorption, J/mol | |
| Change in standard entropy of adsorption, J/mol⋅K | |
| Qads | Heat of adsorption; kJ/mol |
| Standard total entropy of adsorption, J/mol⋅K | |
| Standard total entropy in the gas phase, J/mol⋅K |