


 CC-BY 4.0
1. Introduction
Activated carbons (AC) have been frequently applied in gas separation, solvents recovery, and water treatment and in catalytic processes [1, 2, 3, 4, 5]. AC is usually prepared using various sources of carbonaceous materials such as coal, wood and peat [6, 7, 8]. However, these materials are expensive for industrial production of AC. Consequently, an alternative source for activated carbon precursor that is relatively cheap is required. Agricultural by-products can be used as an alternative precursor for the production of activated carbons as they have shown comparable results to activated carbons from industrial by products with respect to their adsorptive properties, cheapness and renewability [9, 10, 11]. Several suitable agricultural by-products including olive stones [12], date stones [13], rice husks [14], plum stones [15] and pomegranate [16] have been studied as ACs precursors in many studies published over the last decades. These by products are abundant in some countries and do not have other direct technical applications and instead are discarded as wastes [17, 18].
Tunisia is one of the most experienced countries in the cultivation of olive trees in the southern Mediterranean region; over 30% of its arable land is devoted to olive cultivation [19]. The olive oil industry has contributed to the high generation of biomass wastes particularly of olive stones which indeed have been a major environmental concern to the country. Several studies have shown that valorization is the most used solution for the solid waste elimination [20, 21, 22, 23]. Several ways of valorization of agricultural by-products that is high in carbon have been used to transform biomass into other valued products. These biomass materials can be turned into valuable materials through pyrolysis producing solid biofuels (e.g. charcoal, chips), biochar [24, 25, 26], liquid products (ethanol, pyrolytic oils vegetable oil ester, agricultural water source) [27, 28] or gaseous fuel (biogas, poor gas) [27, 28]. It could be also transformed into activated carbon widely used in industry for water and waste gaseous treatment [1, 14, 16, 29]. Many researchers have shown that olive stones serve as an excellent precursor for the synthesis of activated carbon [17, 30]. In practice, activated carbons can be prepared by three methods: physical, chemical activation and a combination of both. The physical activation method consists on two-step scheme through pyrolysis of the raw material followed by activation of resulting char at high temperature in an oxidant atmosphere such carbon dioxide or steam atmosphere [31, 32]. While, chemical activation method consists of a single-step scheme by the pyrolysis of the raw material previously impregnated with a chemical agent such as zinc chloride, phosphoric acid, or potassium hydroxide [33, 34, 35]. A combined activation method links to impregnation of raw biomass by the chemical agent such as phosphoric acid followed by the activation of resulted material in an oxidant atmosphere [36]. Phosphoric acid can be considered the most widely used among chemical activating agents [9, 37]. The effects of phosphoric acid activation on preparation of activated carbon has been widely studied in recent years due to its relatively low activation temperature and high product yield [1, 37, 38, 39, 40]. Several studies have been reported on investigating the effect of H3PO4 impregnation ratio, activation time and temperature on porous texture of the resulting carbons [41, 42]. Nevertheless, the study on mechanism of H3PO4 action remains limited and requires further investigation. In fact, the limited studies available for this purpose were done by thermogravimetric analysis (TGA) [10, 11, 43].
TGA finds its broad application for testing the weight changes of the sample in controlled heat treatment. This step necessary to improve activated carbon production this insufficient for thorough kinetic study. Coupling TGA to other techniques must be used to obtain information about the products or fragments which formed during decomposition or devolatilisation. TGA coupling to mass spectrometry (MS) can provide quantitative and qualitative information on the emitted gas, enabling a better understanding of the thermal behaviour of materials. The utilization of MS techniques along with the thermal analysis can facilitate a deeper insight of the kinetic scheme and consequently allow one to understand the actual reaction mechanism. A lot of investigations have been carried out on the raw biomass thermal analysis using integrated TGA-MS [44, 45, 46], however no report has been presented on the investigation of phosphoric acid impregnated biomass analysis using TGA-MS. Thus, in order to further study on chemical reactions of phosphoric acid inside lignocellulosic biomass that affecting characteristics of the final carbons, Tunisian olive stones (OS) were chosen as the raw material (precursor) to prepare the activated carbons.
The novelty of this work is on the thermal behaviour analysis of the raw and impregnated olive stones with analysis of the corresponding gaseous emissions using coupled TGA/MS. In particular, this study examines the thermal degradation of raw and impregnated olive stone with focusing on effect of rate and time of impregnation.
2. Materials and methods
2.1. Sample preparation
Olive stones (OS) obtained from a Tunisian oil mill were used as precursor material in this study. The material was washed several times with distilled water, and then naturally dried until constant humidity value was achieved.
The resulting material denoted as raw olive stone were also chemically activated with phosphoric acid. To determine the effect of ratio and time of impregnation, the OS were mixed with a 50% (wt) H3PO4(Prolabo) solution to the desired acid/precursor ratio (weight of H3PO4/weight of olive stone). The H3PO4impregnated samples at different ratio of 1:2, 1:1, 3:2, were thoroughly shaken for homogenization, and then the solutions were left for 3, 6 and 9 h at a temperature of 110 °C. The resulting samples were dried at room temperature and then crushed using high-speed rotary cutting mill and sieved (model number OCT-609709, ENDECOTTS Octagon 2000) to desired particle size of <400 μm. The samples prepared were referred to as OS, IOS (0.5, 9 h): impregnated olive stones with a ratio of 0.5 under 9 h, IOS (1, 9 h), IOS (1.5, 9 h), IOS (1.5, 6 h), IOS (1.5, 3 h). Then, the samples were stored in sealed polyethylene bags.
2.2. Sample characterization
Proximate analysis of the samples was performed based on ASTM methods E871, E872-82 and D1102-84 using thermobalance TGA/SDTA851e manufactured by Mettler Toledo. Approximately 20 mg of the sample was loaded into a 150 μl aluminium ceramic crucible. The sample was heated continuously from room temperature to 950 °C in a nitrogen atmosphere. At this temperature, the oxygen was injected to oxidize the residual carbon formed during the pyrolysis step and thus to identify the ash content, keeping the same nitrogen flow rate (50 ml/min) up to a temperature of 1100 °C. The determination of each component was done by integration using software predefined by Mettler Toledo.
Meanwhile, elemental analysis was performed in a CHNS-O analyser (Model Thermo Finnegan Flashea 1112) according to the ASTM D 5373-02 standard. The analysis provided the amount of carbon, hydrogen, nitrogen and sulphur, while the oxygen content was obtained by difference. As for the calorific value, this analysis was performed according to the standard ASTM D 2015-96, using an Ika works C5000 calorimeter. Surface functional groups of olive stones and treated olives stones were analysed via Fourier transform infrared spectroscopy (FTIR; model: Perkin Elmer), over the range from 400 to 4000 cm−1.
2.3. Thermal analysis (TGA)
Thermal degradation of raw OS and impregnated IOS samples was carried out using a TGA apparatus (TGA/DSC 1, METTLER TOLEDO). Initial samples with an approximate weight of 20 mg were loaded into a 150 μl alumina crucible under non-isothermal conditions. The samples were continuously heated from room temperature to 750 °C, using a nitrogen atmosphere as carrier gas, with flow rate of 50 ml⋅min−1. TGA experiments were performed under dynamic conditions, at heating rates of 10 °C⋅min−1.
2.4. Thermoanalytical measurements TGA-MS analysis
TGA (Mettler-Toledo TGA/SDTA 851e) coupled with mass spectrometer (PFEIFFER Vacuum-Thermostar™) was used to analyse the thermal behaviour of different materials and detect the evolved gases simultaneously. Approximately 20 mg of the material was placed into an alumina crucible pan and heated from ambient temperature to 750 °C at a heating rate of 10 °C⋅min−1. All experiments used pure nitrogen (99.999%) as carrier gas. In order to identify ions with m∕z in the range 0 to 300, a preliminary broad scan was performed at a heating rate of 10 °C⋅min−1. The signals identified corresponded to the mass spectra of 2, 16, 18, 28, 30, 32, 44 a.m.u, which correspond to the main components of the pyrolysis gas (H2, CH4, H2O, CO, C2H6 and CO2, respectively). TG-MS analyses were done on the samples: OS, IOS (0.5, 9 h), IOS (1, 9 h), IOS (1.5, 9 h), IOS (1.5, 3 h).
3. Results and discussion
3.1. Materials characterization
Table 1 shows the proximate and ultimate analyses of OS. It is clear that OS have a low value of ash (≈0.24%). It has been noted that ash content influences the quality of organic yield. Biomass with low ash content has high fixed carbon which is desirable for activated carbon production. OS have a high fixed carbon and volatile matter contents (21.64%, 67.88%, respectively), as well as other common biomass such as: orange waste [47], olive solid waste [21], almond shell [48], date kernel [49], C. monspeliensis [49], date stones [50]. This implies that olive stones could be an excellent precursor for activated carbon production instead of expensive raw materials (wood) widely used for producing activated carbon.
Characterization of raw olive stone
| Proximate analysis (wet basis %) | |
| Fixed carbon | 21.64 |
| Volatile matter | 67.88 |
| Moisture | 10.24 |
| Ash | 0.240 |
| Ultimate analysis (wet basis %) | |
| C | 35.81 |
| H | 4.55 |
| N | 0.67 |
| S | <0.2 |
| O | 58.77 |
| HHV (kJ/kg) | 18.864 |
On the other hand, nitrogen content of OS is less than 1% which is similar to other biomass [48]. The low contents of ash matter and sulphur are particularly favourable factors in relation with the use of OS as a raw material for synthesis of activated carbon [51].
3.2. FTIR analyses
The FTIR spectrum of raw OS is shown in Figure 1. The FTIR signals with the assigned possible compounds and the typical functional groups are listed in Table 2. It is clear that infrared spectrum of OS is similar to those already found for other lignocellulosic materials [52, 53].
FT-IR spectra of OS.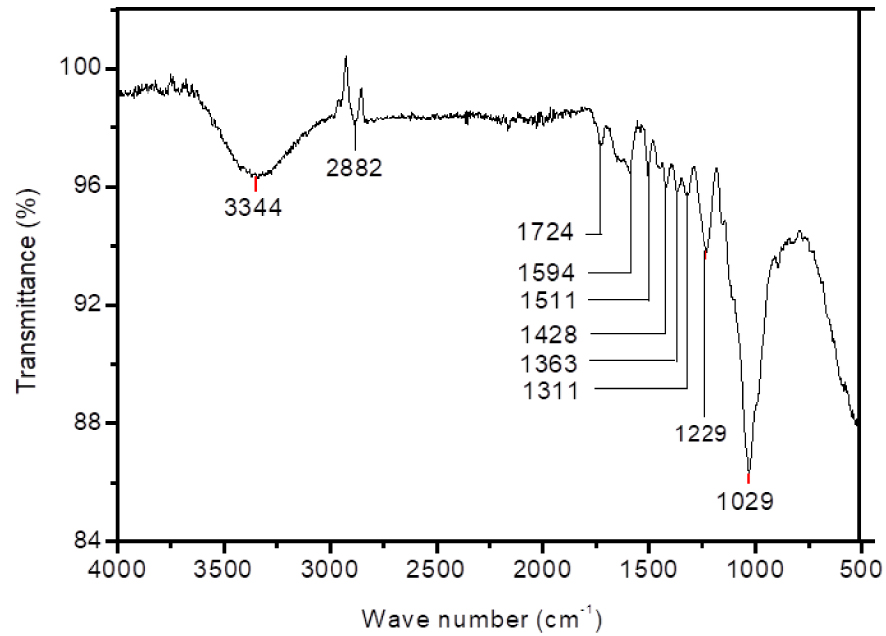
Assignment of peaks to the chemical functional groups and biomass components via FTIR for raw olive stones
| Wavenumber (cm−1) | Vibration | Functional groups | Biomass component | Ref |
|---|---|---|---|---|
| 3700–3000 | O–H (Stretch) | Phenolic, alcoholic, carboxylic | Lignin | [31] |
| 3000–2800 | C–H (Strech) | –CH2, –CH3 | Lignin, Hemicellulose | [31 ] |
| 1730 | C=O (Strech) | Carbonyl | Hemicellulose | [23 ] |
| 1650–1500 | C=C (Stretch) | Aromatic structure | Lignin | [30 ] |
| 1700–1600 | C=C (Stretch) | Olefinin structure | Lignin | [30 ] |
| 1430–1360 | O–H, C–H | Alcoholic, carboxylic, phenol, olefinic | Lignin, cellulose, Hemicellulose | [30, 31] |
| 1300–1200 | C–O | Unsaturated esters | [30] | |
| 1160–1000 | C–O, C=C, C–C–O (stretch) | Saturated esters, polysaccharides | Lignin, cellulose, Hemicellulose | [23, 31] |
The band located at 3344 cm−1 is almost entirely attributed to the stretching of O–H vibrations in hydroxyl, acid and phenol groups which are a significant feature of lignin polymers [54]. Meanwhile, the band located at 2882 cm−1 is ascribed to the vibration of C–H stretching of CH, CH2 and CH3 groups in methyl and methylene groups. These two peaks are typical of lignin and hemicelluloses polymers respectively [54].
The peak at 1724 cm−1 is assigned to the carbonyl groups C=O [45]. The vibrations of the olefin (C=C) cause the band to appear at approximately 1651 cm−1, while vibrations C=C of the carbon skeleton in the aromatic rings caused another two bands at 1594 and 1511 cm−1 [11]. The peaks at 1428 and 1363 cm−1 are attributed to C–H and O–H [52] groups forming the basic structure of lignocellulosic biomass. The band at 1311 cm−1 may be related to the vibration of C–O in carboxylate groups. The band at 1229 cm−1 can be ascribed to esters (e.g. R–CO–O–R_), ethers (e.g. R–O–R_) or phenol groups [53]. The sharp peak at 1029 cm−1 is due to C=C, C–O, and C–C–O stretching [54] which correspond to lignocellulosic polymers.
It is observed that FTIR spectrum of H3PO4/OS shows few identifiable peaks comparable to native OS, verifying that H3PO4 treatment caused significant chemical modifications (Figure 2(a)). The relative intensities increase with the increase of the impregnation rate in order 0.5; 1 and 1.5. However, the impregnation time doesn’t show an effect on the IOS spectra. Different activation times correspond to almost the same spectrum. On the other hand, a shift of bands is observed in peaks already detected for the OS. One may observe that the peak for OS shifted from 1029 cm−1 to ≈971 cm−1 for IOS with an increase in their relative intensity. As mentioned, this peak is a characteristic of C=C, C–O, and C–C–O stretching of alcohols in raw materials. Jiang et al. [55] reported that this peak was assigned as P–O stretching, indicating for H3PO4 existence. It is postulated that phosphoric acid introduces oxygenated functions (alcohol and/or ether) in the char, a fact that is expected to have important consequences for the adsorption performance of carbonaceous materials produced by chemical activation with phosphoric acid. The peak appearing at ≈1114 cm−1 could be attributed to asymmetric stretching vibration (O–P–O) [55].
It is also observed that the band at 1229 cm−1 was ascribed to C–O stretching of ethers, appears just for IOS (0.5, 9 h) and does not appeared for other impregnated OS. Also, it can be observed that there were no peaks pertaining to weak bands located between 1500 and 1200 cm−1 (Figure 2(b)). This translates the fact that phosphoric acid activation decrease aliphatic character of OS and increases in return the aromatic character [11].
FT-IR spectra of OS and IOS in wavelength interval 4000–400 cm−1 (a) and 3000–1000 cm−1 (b).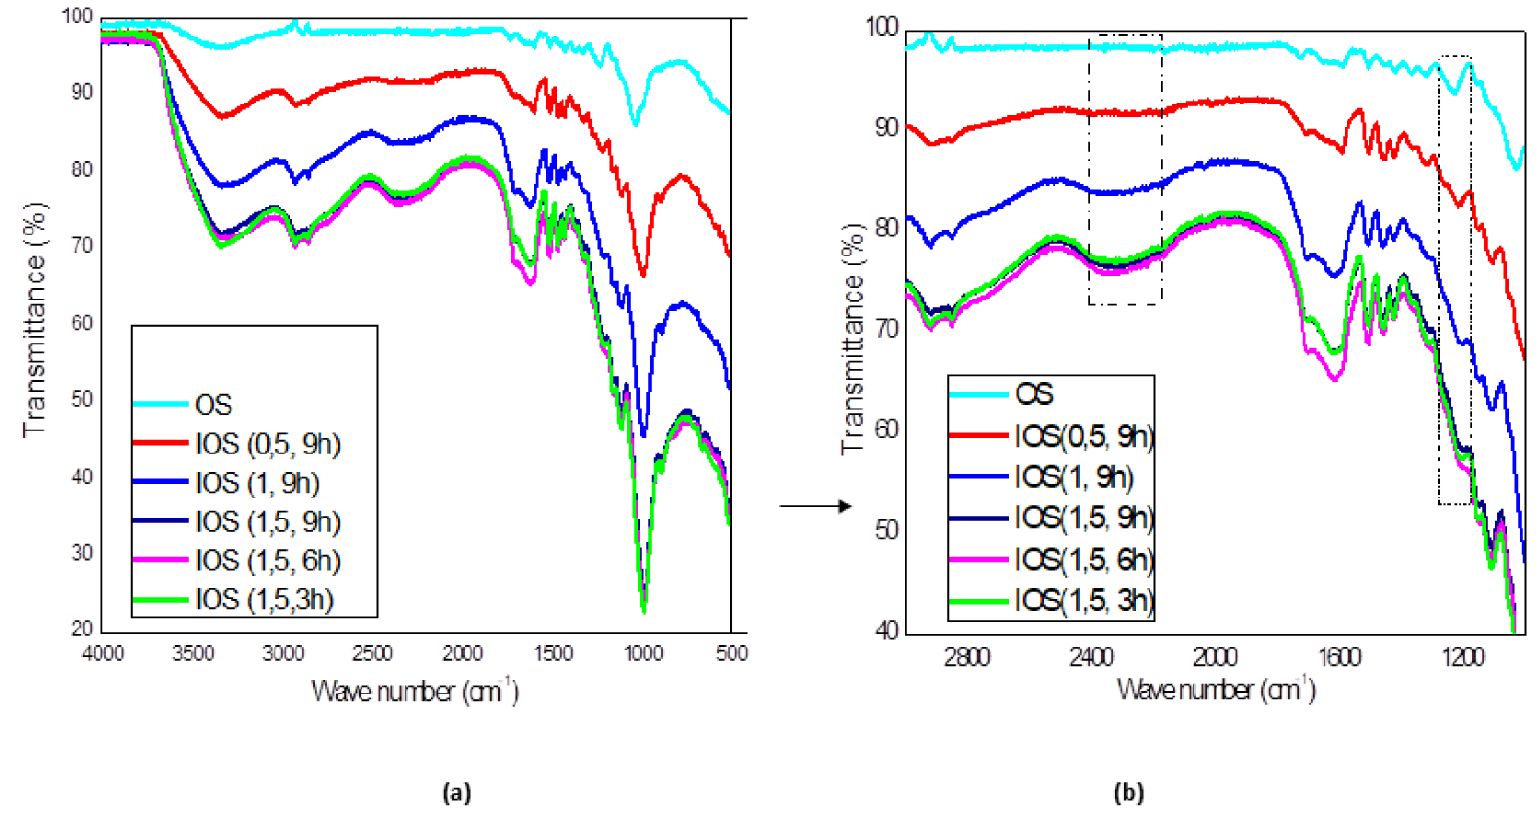
In the other hand, there is a disappearance of the band which corresponding to C=O groups at 1724 cm−1. The results showed that IOS contain less C=O groups than the OS. The hydrolysis effect of H3PO4 may be behind the decrease of carbonyl groups amount.
Finally, there is a remarkable appearance of a band at 2328 cm−1, which occurs at a low intensity for low impregnation rate (IOS (0.5, 9 h)) and then become more intense for other impregnated OS. The peak could be due to C=O stretching in ketene groups [56], confirming observations already found for acid impregnation effect [11].
3.3. TGA–DTG analyses
Figure 3 presents the evolution of the residual mass, the mass loss rate and the exchanged heat flow, during the OS pyrolysis.
TGA-DTG-DSC of OS pyrolysis.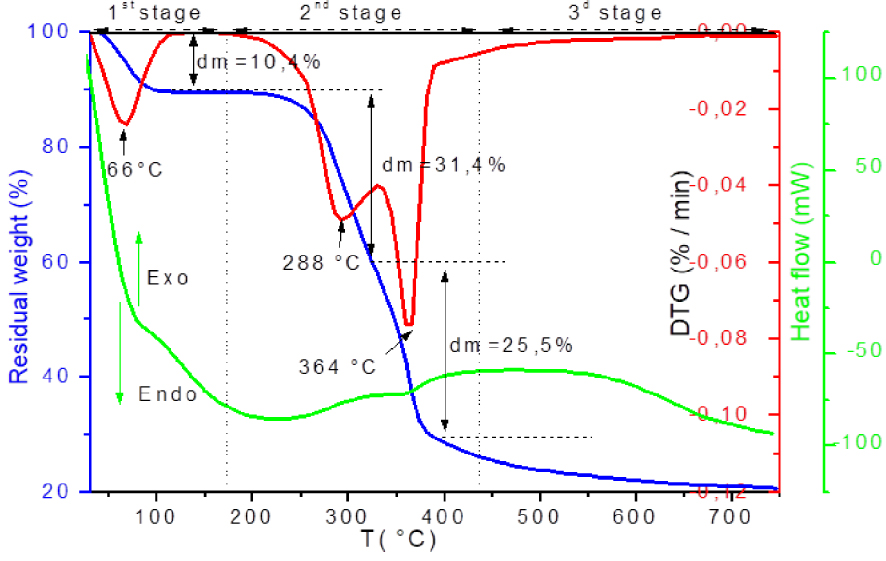
The thermal degradation of untreated OS follows the usual shape of the lignocellulosic materials behaviour. The degradation profile can be divided into three regions of mass loss: dehydration, active pyrolysis and passive pyrolysis, as described in the literature [44, 47].
The first region is due to water loss, recorded for temperature below 125 °C and corresponds to the first significant peak (Tpic = 66 °C) on the DTG curves. A weight loss of 10% is registered.
The second region corresponds to the active pyrolysis, occurred in the temperature interval between 217 and 407 °C. This stage consists of a major mass loss (≈56%) which may be related to the hemicellulose and cellulose degradation. Two distinct peaks are observed on the DTG curves: the first occurred at the lower temperatures in the range of 210–327 °C with a mass loss of about 31%. The maximum rate of mass loss was recorded at 288 °C. The second peak is located between 342 and 425 °C, the peak of DTG with a mass loss of about 25%. The maximum rate of mass loss is reached at 364 °C. The first peak was mainly attributed to the degradation of hemicellulose, while the second was related to the decomposition of the cellulose. This distribution was justified by the crystalline structure of the cellulose which is more thermally stable than hemicellulose of amorphous structure and therefore its thermal degradation is more difficult [48, 57]. The degradation of these two polymers with the evolution of secondary gases produced a significant fraction of char [58]. Simultaneous degradation of lignin occurred at that temperature range [59]. Over 430 °C, passive pyrolysis has also been shown to occur by Orfão et al. [60] and Yang et al. [61]. Indeed, it appears that the decomposition of lignin can continue up to 900 °C.
The heat flow profile shows that the dehydration stage is endothermic whereas the active pyrolysis and slow pyrolysis stage are exothermic.
TGA analysis of OS and IOS for different rate and time of impregnation (10 °C/min).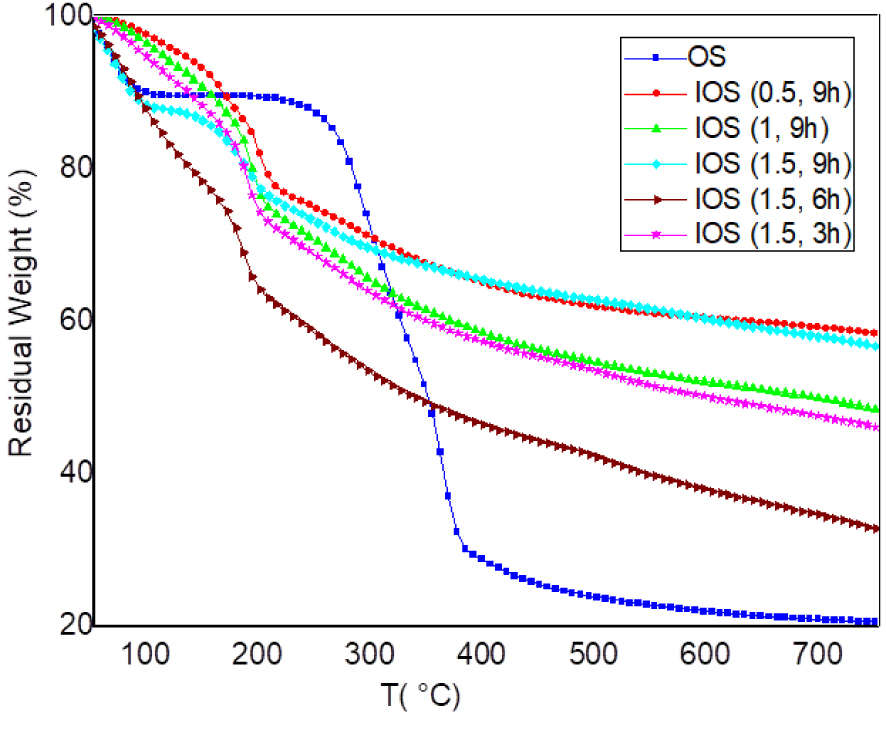
DTG and conversion rate analysis of raw OS and treated OS for different rate impregnations (10 °C/min).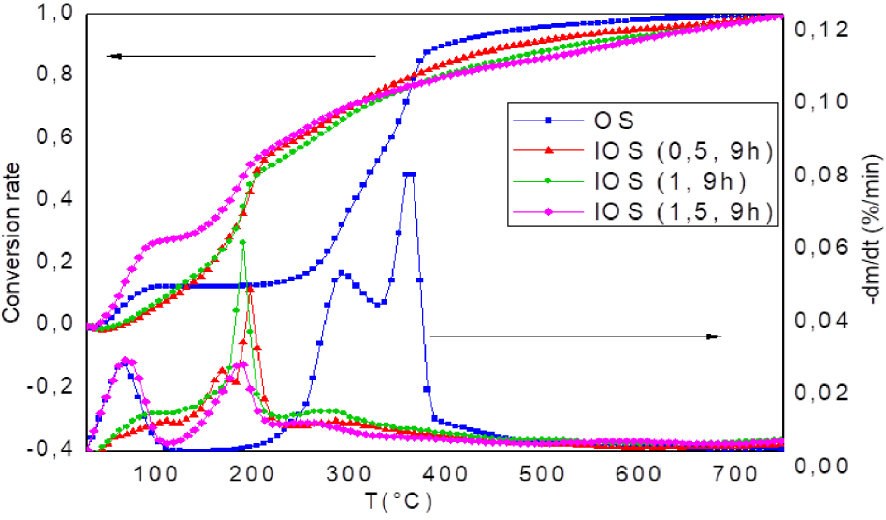
DTG and conversion rate analysis of OS and IOS for different time impregnations (10 °C/min).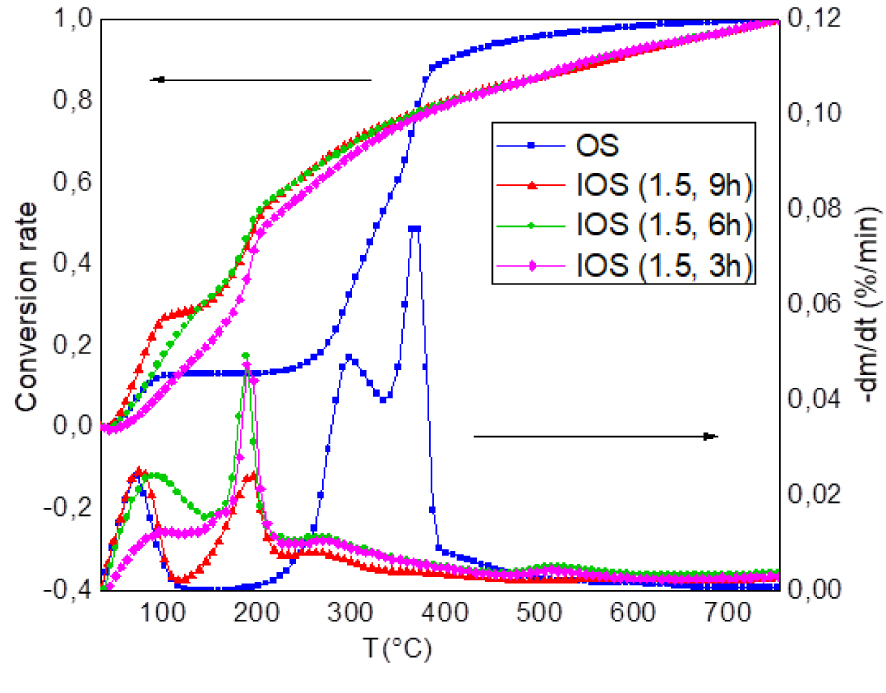
In comparison to the untreated material, activation with H3PO4 brings about significant modifications to the pyrolysis of the precursor as shown in Figure 4–6.
The impregnated OS shows an extremely fast kinetic of thermal degradation (Figure 4). It is clear that the weight loss of IOS (1.5, 9 h) and IOS (1.5, 6 h) are the fastest (Figure 4). Indeed, a mass loss of more than 25% is recorded for a temperature at 230 °C for different IOS instead of only 12% for OS at the same temperature. This behaviour is observed in the literature for other phosphoric acid-impregnated materials such as wood [10]. It may be related to the catalytic effect promoted by H3PO4 and which allows an early loss of mass. Above 230 °C, the rate of mass loss decreases gradually. At that point, the start of stabilization and expansion of the char structure may be the cause of a slower rate of mass loss [11].
Based on the DTG curve, the thermal degradation evolution of IOS can be divided into three regions (Figure 5 and 6). The first region is indicated by the first peak DTG, which is located at temperatures below 135 °C for all different concentrations and time impregnation. With the increase of H3PO4 concentration, the weight loss stages shifted to lower temperature. The rate of conversion at the end of this stage was 32% for IOS (1.5, 9 h) as opposed to only 12% for OS, which could be attributed to the strong hygroscopic property of IOS samples (Figure 5).
The second region is indicated by the second peak DTG, may be related to the main degradation of the IOS. So, it is designed by active pyrolysis. The regions of IOS decomposition are observed at very low temperatures. As shown in Table 3, Tonset (onset temperature of degradation) and Tmax (temperature at maximum weight loss rate) of IOS dropped from 210 °C and 364 °C for OS to 126 °C and 198 °C for IOS (0.5, 9 h), to 127 °C and 191 °C for IOS (1, 9 h) and to 113 °C and 188 °C for IOS (1.5, 9 h), respectively. Compared to raw OS which pyrolysis range was from 217 °C to 407 °C, the active pyrolysis for IOS (1.5, 9 h) occurs in the range 113 °C to 230 °C. It seems that the end temperature of the main degradation stage (TOffset) of IOS corresponds to start temperature of degradation (Tonset) of the raw OS. Dobele et al. [62] found that Toffset of the main degradation of cellulose decreases by increasing the H3PO4 rate from 260 °C for raw cellulose to 160 °C for impregnated sample. These findings can be explained by the fact that H3PO4 acts as catalyst to promote the degradation of biopolymers, principally hemicellulose, cellulose and lignin [62, 63]. Similar results were obtained for KOH-impregnated pine wood, Tonset and TOffset decrease with increasing of impregnation rate [64].
Main decomposition of untreated and treated olive stones (10 °C/min)
| Sample | Temperature range | T shoulder1 | R shoulder1 | T peak1 | R peak1 | T peak2 | R peak2 | Char (%) | Char (%) |
|---|---|---|---|---|---|---|---|---|---|
| (Tonset–Toffset) | 450 °C | 750 °C | |||||||
| OS | 217–407 | 288.54 | 0.95 | 364.11 | 1.6 | - | - | 25.3 | 20.7 |
| IOS (1.5, 3 h) | 121–310 | - | - | 187.26 | 1.05 | - | - | 55.15 | 46.25 |
| IOS (1.5, 6 h) | 146.3–335 | - | - | 183.65 | 0.84 | - | - | 44.11 | 32.94 |
| IOS (1.5, 9 h) | 113–230 | - | - | 188.25 | 0.48 | - | - | 63.85 | 56.9 |
| IOS (0.5, 9 h) | 135–364 | 170 | 0.38 | 198.21 | 0.8 | - | - | 63.055 | 58.55 |
| IOS (1, 9 h) | 127–321 | 160 | 0.28 | 191.13 | 1.1 | - | - | 56.09 | 48.54 |
After the main decomposition, the mass loss starts to decrease promptly above 200 °C. The IOS has less observable evolution profiles between 250 and 500 °C, indicated by the non-zero value on DTG curve after the main peaks of pyrolysis.
Note that, the weight loss at 500 °C of raw olive stones were 76%, while only 37.5% of weight loss for IOS (1.5, 9 h) (Figure 4). It is anticipated that H3PO4reduced the mass loss of cellulose degradation [65]. In addition, residue was increased from 20% of OS to 57% of IOS (1.5, 9 h) (Table 3). It well knows that impregnation by H3PO4 enhance the yields of carbon. These results are similar to those found by Dobele [62] showing that yields of volatiles at 450 °C decrease from 91% for raw material to 64% for the highest rate of H3PO4 impregnation. This may have resulted from the catalytic effect of H3PO4 on the afore mentioned reactions [37] and the formation of polypyrophosphate compound hindering the diffusion of volatile products [37], which also demonstrates the excellence flame-retardant property of H3PO4.
On the other hand, the impregnation ratio has a significant effect on OS pyrolysis behaviour. From DTG profiles (Figure 5), the main decomposition presents different characteristics. That is, despite the fact that DTG curves of IOS (0.5, 9 h) doped with low concentration of phosphoric acid are similar to that of raw OS, it displays two peaks of main decomposition. However, when the concentration was higher than 0.5, the intensity of the shoulder attributed to hemicellulose decomposition, decreases for IOS (1; 9 h) until it disappears completely for IOS (1.5, 9 h). This means that phosphoric acid removed impregnated materials from their origin shape of lignocellulosic biomass.
Also, from Figure 5, the conversion rate curves indicate that the conversion rate of IOS (1.5; 9 h) is more significant than IOS (1; 9 h) and IOS (0.5; 9 h) at low temperatures (T < 200 °C). This shows that the kinetic of degradation is faster by increasing impregnation rate for temperatures below 200 °C. Above 200 °C, the conversion rate of IOS (1.5; 9 h) becomes lower than IOS (1; 9 h). In the other hand, IOS (1; 9 h) shows the lowest amount of solid residue at 450 and 750 °C compared to the other two samples (Figure 4, Table 3).
The amounts of char for IOS (0.5; 9 h), IOS (1; 9 h) and IOS (1.5; 9 h) are 58%, 48% and 57% respectively. The unspecified order of the samples in terms of the conversion rate seems to be related to phosphoric acid, since its behaviour varies from low temperatures to high temperatures [62].
As shown in Figure 6, time impregnation has a less significant effect than that of H3PO4 ratio. Nevertheless, the conversion rate at the first stage (below 190 °C) was improved with the increase of time impregnation, that is, the rate conversion at 125 °C of IOS (1.5, 3 h) is about 17% increase to 27% for IOS (1.5, 6 h) and to 29% for IOS (1.5, 9 h). Above 190 °C, the conversion rate profiles become similar for the three samples. Nevertheless, in the second stage, temperature of maximum weight loss rate (Tmax) is almost the same for different time of impregnation (≈185 °C) (Figure 6). As expected, this is due to reactivity of impregnated materials. H3PO4 accelerates the bond cleavage reactions, leading to the early evolution of volatiles [37, 66].
The amounts of char for IOS (1.5; 3 h), IOS (1.5; 6 h) and IOS (1.5; 9 h) are 46%, 33% and 57% respectively at 750 °C (Figure 4, Table 3). The unspecified order of the samples against the conversion rate could be related to behaviour of phosphoric acid varying from low temperatures to high temperatures [62]. It could be concluded that 3 h of impregnation is sufficient for production of activated carbon but is necessary to determine its surface characteristics to confirm the hypothesis.
3.4. Gas evolved analysis-TG-MS
We have also examined the evolution of the main volatile products derived from OS and IOS pyrolysis, based on their relative intensities within the temperature range of 30–750 °C and on their relevance. H2, CH4, H2O, CO, C2H6, O2 and CO2 assigned to ion/mass intensities (m∕z) 2, 16, 18, 28, 30, 32 and 44 respectively [45].
Evolution of gas products from OS pyrolysis at heating rate of 10 °C/min.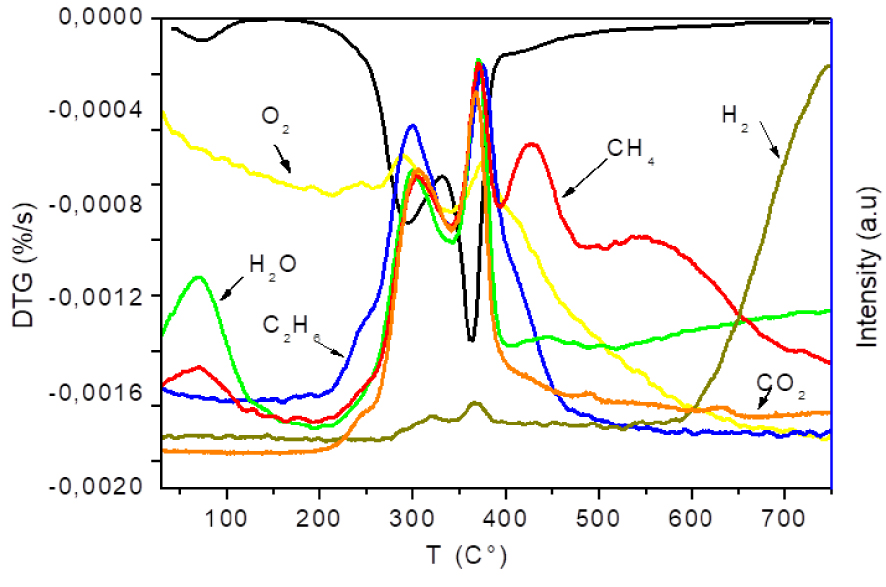
Figure 7 presents the evolution of gas products from raw OS pyrolysis. Table 4 shows the major gas-phase and gas–solid reactions during the pyrolysis of OS. It can be clearly seen that most of the gaseous emissions were mainly released at the temperature interval between 200 and 400 °C, simultaneously with mass degradation (DTG profile), except for CH4 and H2 which present different behaviour. Thus, accordingly to gas evolution, the overall temperature range that the TGA-MS preceded can be divided into four stages in contrast to mass degradation profile.
Major gas-phase and gas–solid reactions during the pyrolysis of olive stones
| Number Equation | Reaction | Equation |
|---|---|---|
| (1) | Decarboxylation | R − COOH→RH + CO2 |
| (2) | Decarbonylation | RCHO→RH + CO |
| (3) | Thermal cracking | CnHm→Cn−xHm−y + H2 + CH4 + C |
| (4) | Tar cracking | CnHmOp + 2n − pH2O→nCO2 + 1∕2m + 2n − pH2 |
| (5) | Methanation | C + 2H2→CH4 |
| (6) | Steam reforming of CH4 | CH4 + H2O→CO + 3H2 |
| (7) | Thermal cracking CH4 | CH4→C + 2H2 |
| (8) | Demethylation | RCH3→R + CH3 |
In the first stage, for temperatures below 200 °C, only H2O and traces of methyl groups were detected in the spectrums of the OS. According to the interpretation of mass spectra, a molecular weight of m∕z = 16 can be related to H2O. Nevertheless, most of the authors studying biomass pyrolysis have suggested that there was no CH4 release at this stage [46, 67, 68]. Subsequently, the weight loss observed at this stage could only be due to the removal of unbound water. Therefore, it can be assumed that there was no degradation of OS at this temperature range and this step could be designated as step zero.
In the second region (200 °C < T < 400 °C), associated to the major weight loss, the main volatiles produced were: H2O, CO, CO2, CH4 and C2H6. The evolution of the emitted gases reached two peaks as well as the DTG curve. The generation of CO2, CO and C2H6 were almost synchronous in the pyrolysis process, suggesting that the same pyrolysis pathway could be behind the production of these gases. Finally, decarboxylation (Equation (1)), decarbonylation (Equation (2)) and thermal cracking (Equation (3)) leading to the release of CO, CO2, and C2H6, respectively, were simultaneous reactions, during OS pyrolysis. The production of CH4 at these temperatures could be due to thermal cracking (Equation (3)) especially when one observes H2 evolution; two peaks with small intensity were observed at 314 °C and 367 °C, and correspond to CH4 peaks. This result proves that thermal cracking is certainly the responsible for H2 and CH4 release at this interval temperature.
In correspondence with the passive pyrolysis phase, two regions of gas release appeared according to MS results. The first shows the release of CH4, in addition to its appearance during active pyrolysis, is also detected at this stage and could be due to the carbonization process that takes place at T > 400 °C. At these temperatures, the main short substituting aromatic groups are –OH and –CH3. The carbon becomes more aromatic leading to reactions of demethylation (Equation (8)) producing methane. Above 550 °C, the second region shows the appearance of H2 and a decrease of the amount of CH4. The product distribution observed in the last stage suggested that secondary reactions took place. It has been shown that the liberation of H2 is related to secondary reactions such as tar cracking (Equation (4)) and/or steam reforming of methane (Equation (6)) [46]. These reactions are produced by CO2 and CO release. However, it is also clear from the figure that only H2 was detected. This fact reveals that H2 is mainly generated by thermal cracking of methane (Equation (7)) during OS pyrolysis. On the other hand, Collard and Blin [67] proposed that the emission of H2 at these high temperatures can be mainly related to the rearrangement of the aromatic groups in polycyclic structure.
It can concluded from MS analysis of OS that four stages of gaseous emissions were detected as opposed to TGA analysis indicating three stages of degradation. The release of CO2, CO, C2H6 were synchronous suggesting that these gases were produced with the same pathway of pyrolysis.
Figure 8 shows the mass spectra of IOS (1.5, 9 h). As mentioned above, pyrolysis process via profile of mass degradation was divided into three stages (Figure 5). However, the gas release occurs in four stages which are shown in IOS (1.5, 9 h).
Evolution of gas products from IOS (1.5, 9 h) pyrolysis at heating rate of 10 °C/min.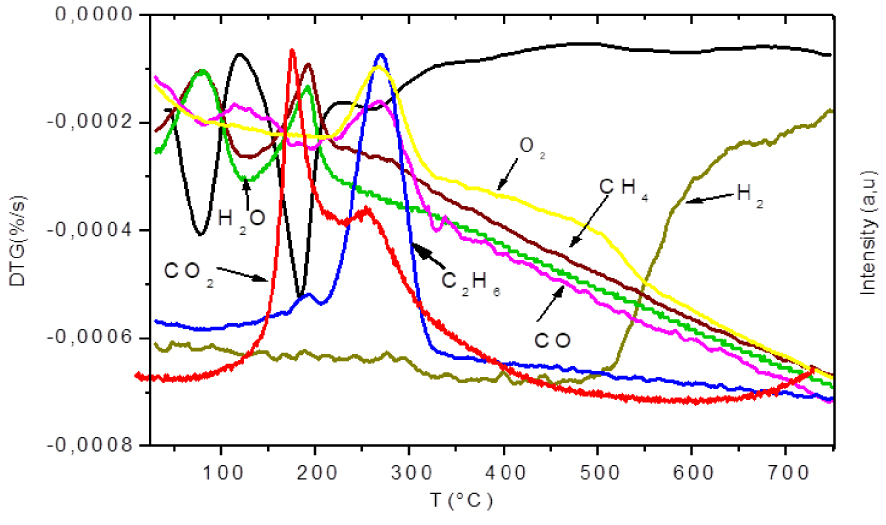
In the first stage (<130 °C), which corresponds to the first peak on DTG curve, only H2O and CH4 were observed. These gases were generated on a similar process. The appearance of CH4 at this temperature range indicated an early degradation promoted by impregnation. It should be said that the first peak of derivative mass loss DTG does not correspond only to dehydration. These results are consistent with those found by Jagtoyen and Derbyshire [11] showing a release of CH4 at temperatures below 100 °C for pyrolysis of H3PO4 impregnated biomass. Early CH4 emission indicates that the rupture of the alkylated chains becomes easier in the presence of H3PO4.
In the second zone (130 °C to 200 °C), associated to the major mass loss, the main detected products were CH4, H2O and CO2. These results show that the decarboxylation (Equation (1)) and thermal cracking (Equation (3)), leading to the formation of CH4 and CO2, were simultaneous reactions. It has been reported that the primary effects of H3PO4 attack are the hydrolysis of glycoside bonds in polysaccarids (hemicellulose and cellulose). These reactions could explain CH4 and H2O emissions in significant amounts.
A third stage was indicated by the release of CO and C2H6, occurred in the temperature range of 200–330 °C. Traces of CO2 were also produced at this stage. Peaks of CO and C2H6 emissions were reached at 266 °C and 269 °C simultaneously with the peak already observed in the DTG profile at 263 °C. Although the intensity of this peak was low, reflecting a small mass loss, a significant release of both gases was observed. This could be explained by the incorporation of phosphoric acid in cellulose which allows a slowing down of mass loss and then maximizing gaseous release contributing to the development of mesoporosity [11]. It was also reported that phosphoric acid impregnation enhances the formation of levoglucosenone [62] which was reactive due to its carbonyl and olefinic bonds. This may explain intense C2H6 and CO emissions. These gases could be attributed to decarbonylation reaction (Equation (2)). The release of C2H6 may also be due to ruptures of aliphatic chains producing light hydrocarbons. Such result reveals that the reaction of dehydration, decarboxylation and decarbonylation during IOS pyrolysis were consecutive and not competitive reactions. However, in the absence of phosphoric acid for raw OS, CO2 and CO evolved with the same pyrolysis pathway. Therefore, it can be deduced that the presence of H3PO4 modifies the kinetic scenario of OS degradation.
Above 330 °C, gaseous emissions begin to decrease until the apparition of H2 at 500 °C indicating the fourth stage. H2 product is probably caused by hydrocarbons thermal cracking (Equation (7)). These reactions most likely were catalysed by the impregnation with phosphoric acid given reduction of the onset temperature of release of H2 for impregnated sample.
For more evaluate the effect of impregnation on gaseous emissions, Figure 9 shows the evolution of H2, CH4, C2H6, CO and CO2 of raw and impregnated samples with different concentrations.
Evolution of gas products from OS and IOS for different rate impregnations (10 °C/min).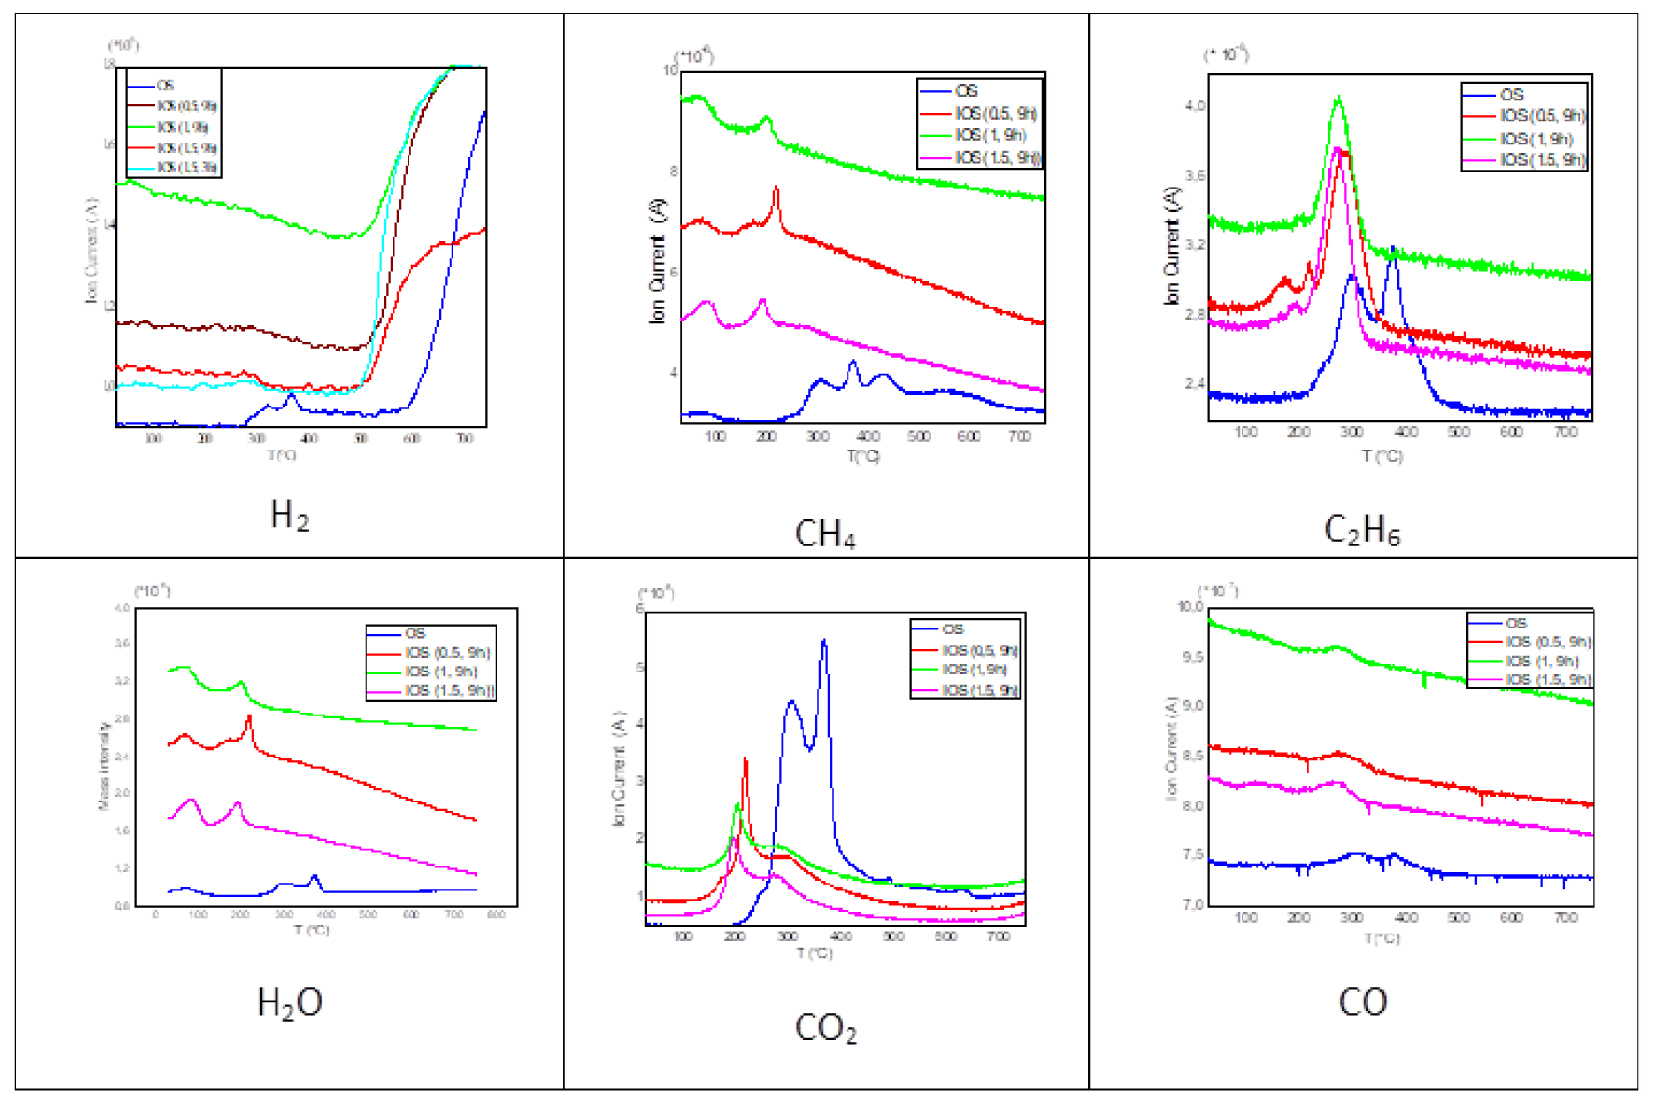
It can be seen that the temperature of appearance of the released gases, was appreciably reduced after the addition of H3PO4 as was the case of mass loss.
The amounts of CH4, H2O, C2H6 and CO emissions are appreciably higher when H3PO4 was added, while that of CO2 significantly decreases in the presence of H3PO4, explaining the higher char yields of impregnated material.
CH4 release was attributed to thermal cracking reaction. Early CH4 emission showed that the rupture of the alkylated chains becomes easier in the presence of H3PO4. It has been reported that the primary effects of H3PO4 attack are the hydrolysis of glycoside bonds in polysaccarids (hemicellulose and cellulose). These reactions can explain significant amounts of CH4 and H2O emissions. The release of C2H6 may also be due to ruptures of aliphatic chains producing light hydrocarbons.
However, the decrease of CO2 amount against the increase of CO reveal that H3PO4 promotes decarbonylation (Equation (2)) while inhibits decarboxylation (Equation (1)). It can be said that these two reactions were competing reactions during IOS pyrolysis. These results are not consistent with those found by Zuo et al. [63] showing that CO and CO2 are decreasing in presence of H3PO4. However, Jagtoyen and Derbyshire [11] found that both gases increased by acid treatment. In comparison to other activating agents such as KOH, found that the presence of KOH promotes all gaseous emissions (H2, CO, CO2, CH4) [64, 69].
Delaying a flame can also be responsible of reducing CO2 emissions. In fact, for temperatures below 200 °C, the phosphorus compounds can form ester functions with the OH– cellulose group. These bonds help to cross-link the polymer chains. The reaction with acid inhibits the formation of “cyclic levoglucosan” or so-called “active cellulose” which allows the degradation of cellulose due to its ease of becoming volatile. For raw OS, it has already been mentioned that cellulose is transformed into an intermediate during pyrolysis, resulting in two stages in the active pyrolysis phase.
Inhibition of the formation of this intermediate for IOS could explain the occurrence of a single peak during its main degradation and the reduction of emitted CO2. On the other hand, the increase in CO and C2H6 production may be due to the production of the levoglucosenone reinforced by acid impregnation, since it is reactive due to its carbonyl group and its olefinic connections. The levglucosenone is thermally stable up to 500 °C. However, above 550 °C, it also breaks down which explains the release of H2 [62]. Looking at the effect of the time and the rate of impregnation, it can be seen that increasing the H3PO4 rate from 0.5 to 1.5 lowers peak temperatures of approximately 20 °C. While this shift does not exceed 7 °C by increasing the impregnation time from 3 to 9 h. This proves the results already found in mass loss profiles showing that the effect of the impregnation rate is more significant than the impregnation time.
With regard to the amounts of emitted gases, it is clear that the total amount of evolved CO2 decreased by increasing the rate and time of impregnation. For this reason, it is found that IOS (1.5; 9 h) emit the lowest amount of CO2. This behaviour may be due to the formation of several phosphate groups between carboxylic groups and acid phosphoric and consequently the decarboxylation reaction was delayed and the evolution of CO2 was depressed. This result is similar to that found by Zuo et al. [63]. While from Chen et al. [69], CO2 decrease with increasing of KOH rate showing that KOH inhibit decarboxylation and in opposite promotes decarbonylation.
On the other hand, the increase in impregnation time from 3 to 9 h slightly increased the release of all gases (CH4, H2O, CO and C2H6) except H2, a time longer activation reduced its production.
4. Conclusions
In this study the thermal behaviour of raw and impregnated OS with different rate and time of impregnation during pyrolysis has been evaluated by means of TGA-MS. The thermal degradation was observed in three stages; dehydration, main degradation and slow pyrolysis. Two main degradation steps are detected for the raw OS in the temperature interval from 210 °C to 425 °C, whereas the H3PO4 impregnated OS involve a single step in the range 110 °C to 230 °C. The impregnation by H3PO4 reduces significantly the temperature onset of main decomposition about 100 °C due to its catalytic power. The presence of phosphoric acid appreciably accelerates activated carbon production. The impregnation rate effect is more significant than the time for pyrolysis. For activated carbon production, it was concluded that 3 h of impregnation is sufficient while impregnation rate effect need further information on surface characteristics.
The main products of gas emissions during pyrolysis were H2, H2O, CO, CO2, C2H6 and CH4. Acid activation favoured CH4, H2O, C2H6 and CO emissions while reducing CO2 emissions. The main gas products were generated between 200 °C and 400 °C for raw olive stones and in the range of 130 °C to 330 °C for impregnated olive stone (IOS (1.5, 9 h)). Mass degradation behaviour and analysis of evolved gas demonstrate that kinetic scenario of pyrolysis of raw olive stones are different from impregnated OS. The kinetic of main degradation of OS could be controlled by simultaneous reactions or competitive reactions while the kinetic of IOS could be controlled by consecutive reactions. These results should be used for kinetic study of OS and IOS pyrolysis by estimation of kinetic parameters especially activation energy.
Acknowledgments
The authors would like to thank, Faculty of Chemical Engineering and Universiti Teknologi MARA, Malaysia for accepting the research internship of AB.