

1 Introduction
Growing concern with the environmental impact of gaseous pollutants has motivated the identification of highly effective adsorbents for pollutant elimination from the exhaust gases of several industrial processes. Nitrogen oxides are the most threatening and widespread gaseous pollutants that lead to acid rain formation as well as the depletion of the ozone layer [1]. NOx are also involved in various secondary processes generating harmful molecules as ozone and acid compounds. Their release can be avoided directly at their emission sources or by treatment of exhaust gases.
Among the various purification processes, two catalytic techniques have been developed: NOx storage and reduction (NSR) and selective catalytic reduction (SCR). NSR adsorbents provided with alkaline oxides and noble metals deposited on an alumina support operate in a cyclic process. The NSR catalysts can oxidize NO to NO2, store nitrogen oxides as nitrates and reduce them [2]. The SCR catalyst is generally composed of a mixture of titanium dioxide, vanadium pentoxide, and tungsten trioxide. During the removal process, hydrogen, ammonia, or hydrocarbons are added as reducing agents [3]. The latter technique is the main exhaust treatment technology for the elimination of NOx emitted from power stations.
In spite of the promising results for the removal of NOx, these processes are very expensive and require a high operating temperature [300, 400 °C]. As an alternative to SCR, the “fast SCR” is also developed. Its advantage is that the reaction is faster than the SCR process depending on the catalyst used [4]. An economic alternative for lean NOx abatement is a combination of NSR and SCR catalysts [5]. But the issues of the catalyst's durability and of the decrease of its efficiency remain the main problems of these processes.
Recently, the removal of NO2 from low-temperature exhaust gas has received particular attention. Levasseur et al. have tested mesoporous silica materials (SBA-15) modified with metal oxides for the removal of NO2 at ambient temperature [6,7]. The authors have shown that NO2 adsorption capacities ranged between 88 mg/g and 102 mg/g for SBA-15 modified with copper oxide, while only 21 mg/g was retained on the non-modified SBA-15 [6]. A significant increase in the NO2 adsorption capacities was obtained by Levasseur et al. with cerium–zirconium mixed oxides supported on SBA-15. The highest NO2 breakthrough capacity of 318 mg/g was obtained with SBA-15 doped with Ce0.2Zr0.8O2. Moreover, the authors have noted a low amount of NO released during NO2 adsorption tests [7].
Although mesostructured silica materials have interesting adsorption capacities, their implementation on a large scale may be very difficult and very expensive. Hence, the use of carbonaceous materials for NO2 adsorption and reduction has interested several research teams. Various carbonaceous materials were evaluated, such as carbon black [8,9], diesel soot [9,10], activated carbon fibers [11], char [12], and modified cement pastes [13]. However, activated carbons showed the most interesting results for removing and minimizing NO2 emissions [14–17]. The adsorption performance of the activated carbon is attributed to its particular pore structure and surface chemistry [14].
Zhang et al. studied NO2 adsorption on three activated carbons at ambient temperature [18]. The used activated carbons were molecular sieves of a commercial carbon (SKC-AR), a SKC carbon treated under a flow of CO2 at 950 °C for 6 h (SKC-360), and commercial coconut shell-based activated carbon (PICA). The authors showed that SKC-360 has the highest NO2 adsorption capacity. The adsorption mechanism involves a weakly adsorbed NO2 on site 1 and or on site 2 as NO3 through the reduction of NO2 on the carbon surface and interaction with NO2. Such a mechanism was already established by Jeguirim et al. [8] and Shirahama et al. [11] during the investigation of NO2 interaction with carbonaceous materials. Authors have showed that the adsorption of NO2 on carbon can take place and leads to the formation of some surface complexes such as C–NO2, C–ONO, C–ONO2 and C–O [8,11]. Depending on their stability and environmental conditions, these complexes located at the outer surface lead to chemical transformations or new functional groups.
Pietrzak has examined the NO2 adsorption on activated carbons prepared from Polish bituminous coal through pyrolysis at 500–700 °C followed by KOH activation at 700 °C [19]. Adsorption of NO2 was carried out from dry and wet air (moisture of 70%). The author observed an increase of the NO2 adsorption capacities for the activated carbon treated at 700 °C from 0.5 and 0.7 mg/g (in the absence of KOH treatment) to 25.0 and 43.5 mg/g (with KOH treatment) in dry and wet conditions, respectively. Pietrzak attested that KOH activation generates an activated carbon with well-developed porous structure and micropores domination. However, the author noted that for all examined carbonaceous materials, a significant amount of NO2 was reduced to NO.
Gao et al. have obtained a higher NO2 adsorption capacity of a commercial AC at 50 °C with a value of 75.34 mg/g. The authors showed that further activation under CO2 has not a significant effect on NO2 adsorption capacity. They have confirmed the C–NO2 interaction mechanism already established by Jeguirim et al. [20].
Activated carbon derived from lignocellulosic biomass has also been investigated for the removal of NO2 pollutants. Nowicki and Pietrzak have developed carbonaceous adsorbents using physical CO2 activation for pine sawdust (PS) pellets [21,22]. Physical activation was achieved for different time periods (30, 60, 90, and 120 min) at 800 °C. These authors showed that the adsorption capacities increase with increasing the activation duration. They obtained a higher adsorption capacity of PS activated for 90 min with corresponding values of 18.6 and 45.3 mg/g, in dry and wet conditions, respectively.
Various activated carbons using a lignocellulosic biomass precursor were developed by the latter research team [23,24]. Hence, Nowicki et al. have prepared activated carbons from walnut shells by chemical and physical activation [23]. The carbonaceous adsorbents were prepared through a walnut shell carbonization from room temperature to 400 °C at 5 °C/min. The obtained carbon was then exposed to CO2 physical activation or KOH chemical activation at 500–800 °C. The highest NO2 adsorption capacities for KOH and CO2 activation were 66.3 and 58.1 mg/g, respectively. The analysis of activated carbon characteristics showed that KOH chemical activation contributes to microporosity development compared to CO2 physical activation. Such behavior was attributed to better textural parameters induced by KOH compared to CO2 activated samples. In fact, KOH activation leads to microporous activated carbons with a well–developed surface area of 2305 m2/g and a pore volume of 1.15 cm3/g compared to a surface area of 697 m2/g and a pore volume of 0.36 cm3/g for the activation with CO2. In another study, Nowicki et al. prepared activated carbon from plum stone using KOH chemical activation [16]. The authors obtained a highly microporous activated carbon with a surface area of 3228 m2/g and pore volume of 1.61 cm3/g. Adsorption tests under dry conditions revealed a NO2 adsorption capacity of 67 mg/g [16].
During the NO2 adsorption tests, a significant amount of undesirable NO was emitted. Therefore, several studies investigated various modifications of the carbon surface in order to increase NO2 adsorption capacities and decrease NO emissions. Bashkova and Bandosz have examined the impregnation of wood-based activated carbon by urea followed by a thermal treatment at 450 and 900 °C [24]. They found that urea impregnation promotes NO2 adsorption and NO retention, especially when it is followed by a heat treatment at 900 °C. The NO2 adsorption capacities were 66 and 140 mg/g under dry and wet conditions, respectively. These authors have mentioned that the formation of active centers on the carbon surface and the supermicropore volume increase during the high-temperature treatment may improve the NO2 removal processes [24]. Moreover, they have attributed the increase of the adsorption capacities in wet conditions to a catalytic effect of water on the carbon oxidation due to the formation of some amounts of nitric (HNO3) and nitrous (HNO2) acids, as previously shown in the literature [25]. Some authors confirmed the established mechanism of Jeguirim et al. during the C–NO2 reaction in the presence of water vapor [26].
Levasseur et al. have tested the NO2 adsorption on activated carbon impregnated with copper and then subjected to a reductive environment using hydrazine hydrate or heat treatment under nitrogen at 925 °C [27]. The highest adsorption capacities were obtained for AC doped with 15% wt copper and reduced under hydrazine, with a value equal to 206 mg/g. These authors showed that although copper deposition blocks some pores and leads to a decrease of porosity, NO2 adsorption capacities increased with increasing copper contents. They have attributed this benefit effect to a different NO2 adsorption mechanism, since the adsorption of NO2 on oxidized copper leads to the formation of stable copper nitrates compensating the decrease of porosity [27].
Kante et al. investigated NO2 removal using wood–based activated carbon impregnated with sodium, cerium and lanthanum chlorides [14]. Authors observed an increase in the NO2 adsorption capacities due to the introduction of these chemicals onto the activated carbon. The adsorption capacities were of 283, 213 and 143 mg/g for sodium, cerium, and lanthanum chlorides, respectively. Authors attributed the increase of NO2 interaction to the NO2 bound with the different metals in the form of nitrates (Ce, La, Na), carbon oxidation surface (for Ce) and the nitrosyl formation of chloride (for Na).
The preparation conditions and NO2 adsorption capacities of activated carbon obtained from the literature are summarized in Table 1.
Operating conditions used to prepare different activated carbons and their adsorption capacities of NO2.
| Material/Precursor | Activation/Modification conditions | Adsorption tests conditions | NO2 adsorption capacity (mg/g) | Refs. |
| Commercial AC (Tangshan Huaneng Technology Carbon, China) | Degassed in ultrapure Ar at 900 °C for 5 h | T = 50 °C, , 1.2 L/min | 75.34 | Gao et al. [20] |
| AC, pine sawdust pellets | CO2 activation at 800 °C for 90 min | Room temperature; 0.1% NO2, 0.450 L/min Dry conditions Wet conditions, moist air (70%) | 18.6 45.3 | Nowicki and Pietrzak [22] |
| AC/Polish bituminous coal | Pyrolyzed at 700 °C KOH at 700 °C | Room temperature; 0.1% NO2, 0.450 L/min Dry conditions Wet conditions, moist air (70%) | 25.5 43.5 | Pietrzak [19] |
| AC/Walnut shell | Pyrolyzed at 700 °C KOH activation at 800 °C | Room temperature; 0.1% NO2, 0.450 L/min, dry conditions | 66.3 | Nowicki et al. [23] |
| AC/Walnut shell | Pyrolyzed at 700 °C CO2 activation at 800 °C | 58.1 | Nowicki et al. [23] | |
| Wood-based activated carbon BAX–1500 | Copper impregnation + heat treatment at 950 °C + hydrazine reduction | Room temperature; 0.1% NO2, 0.450 L/min, dry conditions | 121 206 | Levasseur et al. [27] |
| Wood-based activated carbon BAX–1500 | Urea impregnation and heat treatment at 950 °C | Room temperature; 0.1% NO2, 0.450 L/min Dry conditions Wet conditions, moist air (70%) | 66 140 | Bashkova and Bandosz [24] |
| Wood-based activated carbon BAX–1500 | 2.3% Na, 10% Ce, or 10% La impregnation | Room temperature; 0.1% NO2, 0.450 L/min Dry condition | 283/215/143 | Kante et al. [14] |
| Wood-based activated carbon | BAX150, heat treatment (950 °C) | 0.1% NO2, tr = 0.4 s Moist air (70% Humidity) | 139.6 | Pietzrak and Bandosz [28] |
| BAX150, Impregnation with inorganic species, heat treatment (950 °C) | 0.1% NO2, tr = 0.4 s Wet air (moisture of 70%) | 66.0 | Pietzrak and Bandosz [28] |
As many developing countries, Tunisia is concerned with the increase of NOx emissions into the atmosphere due to several industrial activities and the throwing out of the urban traffic. Hence, starting from July 2010 in Bab Aliwa (Tunis), the daily average exceeds the limit value according to limit values NT 106.04 (source: “Agence nationale de protection de l’environnement” [ANPE]).
Therefore, a possible solution is to develop a specific efficient activated carbon from a local precursor. In order to reach this objective, an evaluation of the performance of the activated carbon prepared from a local raw material, namely olive stones, is performed. Several studies have used activated carbon from olive stones in many processes, either as catalyst support or as an adsorbent in liquid phase, e.g. for the removal of phenol, methylene blue and dyes from aqueous solutions [29]. Moreover, these activated carbons were effectively used as the adsorption material for gas storage, such as that of methane [30,31]. Hence, the purpose of this work is to develop for the first time an efficient carbonaceous adsorbent from olive stones by water vapor activation for the removal of NO2. The effects of operating conditions such as temperature and inlet gas composition on the adsorption performance of the activated carbon are also analyzed.
2 Materials and methods
2.1 Precursor characterization
Olive stones (OS) were used as a raw precursor in this present study. They are a by-product of Tunisian olive oil factories. The elemental composition of the olive stones shown in Table 2 was determined by CHONS-NA 2100 protein CE instruments analyzer.
Elementary analysis of olive stones (dry basis).
| Element | C | H | N | S | Oa | Ash |
| Content (%wt) | 43.1 | 7.1 | 0.4 | 0.8 | 47.4 | 1.8 |
a Value obtained by difference.
2.2 Activated carbon preparation
The activated carbon was prepared from olive stones. The precursor was washed with deionized water to remove the impurities, and then dried. Drying is realized at room temperature for 24 h. The preparation process of activated carbon consists in the carbonization of the olive stone under nitrogen atmosphere followed by physical activation using water vapor. This physical process applied to the olive stones precursor was studied and optimized by Ouederni et al. [32].
Carbonization and activation steps were carried out in a fixed bed reactor in a stainless steel reactor placed in a vertical automated furnace equipped with a temperature controller, with an initial mass of biomass equal to 2 g.
Carbonization was performed in the presence of a continuous flow of purified nitrogen gas with a flow rate of 10 nL/h. The precursor is heated from room temperature to 600 °C (5 °C/min) and maintained at this final temperature during 60 min. The activation of the obtained char is then realized at 750 °C (the ramp used is 15 °C/min) under 70 vol. % H2O in N2 during 360 min, with a total gas flow rate equal to 10 NL/h. An activated carbon referred to as OSAC_PW360 was obtained with a global yield of 25% wt.
2.3 Activated carbon characterization
2.3.1 Pore structure and morphology characterization
The characterization of the textural properties of the activated carbon was carried out by measurement of N2 adsorption at 77 K using a Micromeritics (ASAP 2020) gas adsorption analyzer, after outgassing the sample for 16 h at 623 K. The specific surface area was calculated from the N2 adsorption isotherms applying the Brunauer–Emmett–Teller (BET) equation and yielded important information about structural features. The t-plot method was applied to calculate the micropore surface area and the micropore volume. The pore size distribution of the micropores was determined by the Horvath–Kawazoe method.
Scanning electron microscopy (Philips model FEI model Quanta 400 SEM) and energy dispersive X–ray spectrometry (EDX) were used to observe the morphology and to determine the elemental analysis of the activated carbons, which allowed us to determine the elemental mapping of the samples.
2.3.2 Characterization of carbon surface chemistry
Fourier transform infrared spectroscopy (FTIR) was used to characterize the main functional groups of the activated carbon surface using a FTIR spectrometer (Jasco FTIR 4100 series spectrophotometer with a diffuse reflectance accessory manufactured by PIKE Technologies); samples of activated carbon were mixed with finely divided spectroscopic-grade KBr. All the spectra were recorded at a spectral resolution of 16 cm−1 using a minimum of 30 scans.
Qualitative and quantitative information concerning the functionalities of the carbon surface was assessed by temperature-programmed desorption coupled with spectrometry (TPD–MS). The sample weighting 10 mg was placed in a quartz tube in a furnace and heat–treated with a linear heating rate of 5 °C/min in vacuum. The carbon surface chemistry was evaluated in the temperature range 25–900 °C using a homemade TPD–MS setup [33].
The gases that evolved during the heating process (CO, CO2, H2 and H2O) were continuously analyzed by a mass spectrometer. The desorption rate of each gas as a function of temperature was determined from TPD analysis. Prior to the measurements, the mass spectrometer was calibrated with N2, CO, CO2, H2, and H2O. The total amount of each gas released was computed by time integration of the TPD curves.
In addition to TPD–MS and FTIR analyses, the surface oxide functional groups were determined by the Boehm method [34].
2.4 NO2 adsorption tests
NO2 adsorption experiments were performed in a fixed bed reactor, shown in Fig. 1.
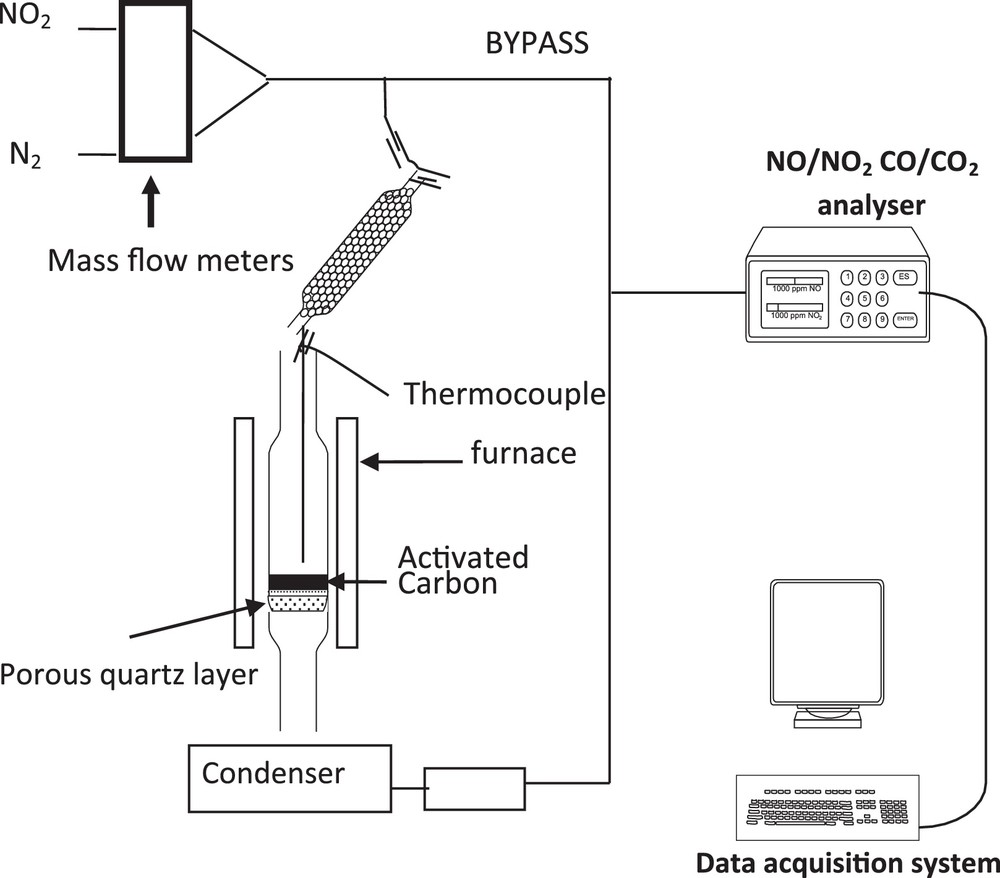
Scheme of the setup for the fixed bed experiments.
In each experiment, 100 mg of activated carbon is deposited on a fused silica frit placed in a vertical quartz reactor (with an internal diameter of 6 mm). The bed temperature is measured by a thermocouple located 1 mm above the activated carbon (AC) sample. A gas stream mixture of NO2 (500 ppm by volume), with various percentages of oxygen and carbon dioxide in nitrogen, at different temperatures, is injected and passes through the column of the adsorbent. A constant gas flow rate of 20 NL·h−1 is fixed by Brooks 5850 mass flow controllers. The outlet NO and NO2 as well as CO and CO2 gas concentrations are continuously measured by a Rosemount NGA 2000 device. The outlet gas composition is recorded every 2 s.
After exposure of the sample to the NO2 flow, the reactor was cooled down to room temperature and TPD was performed up to 600 °C at a heating rate of 5 °C/min. The obtained curves showed the peaks assigned to the decomposition of each component adsorbed on the activated carbon. The gas composition was recorded every 2 s.
3 Results and discussion
3.1 Adsorbents characterization
3.1.1 SEM–EDX characterization
Scanning electron micrographs of activated carbon particles are displayed in Fig. 2. The activated carbon shows a high and a heterogeneous macroporosity on the surface, with pore sizes between 10 to less than 1 μm. The different EDX analyzes performed on different particles also show that the surface is recovered by located mineral particles (clear small particles on the SEM micrograph) corresponding to Ca, which is consequently separated from the carbon structure.
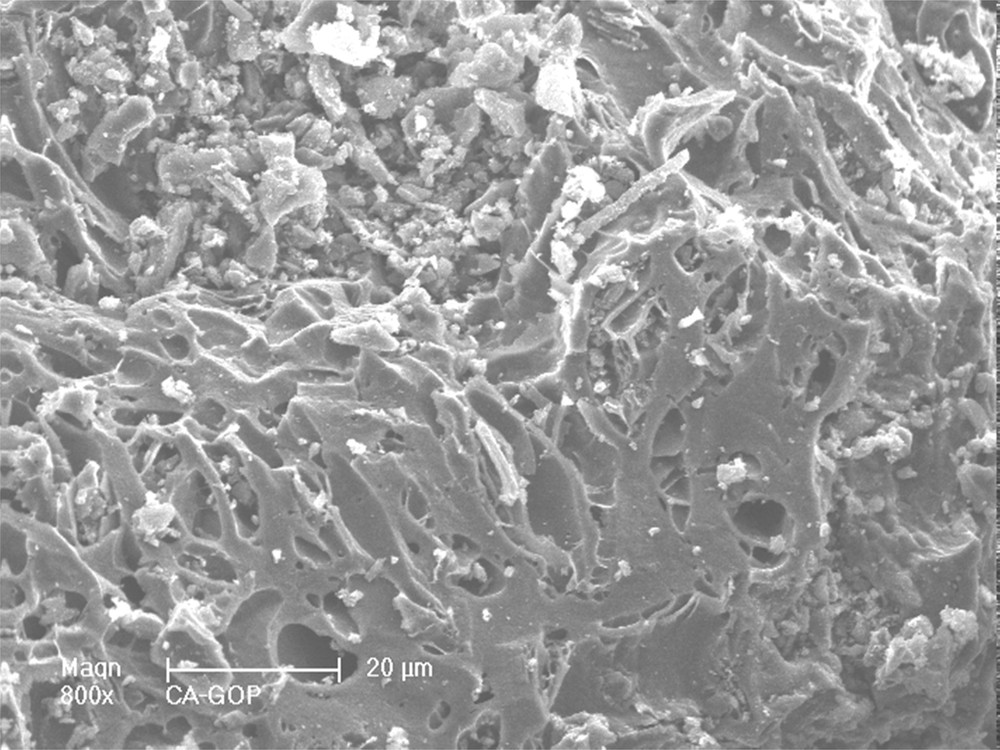
SEM observation of an olive stone char particle after activation with water vapor at 750 °C: presence of C, K, Ca and O, and of small amounts of Na, Mg, P, S and Si.
At the opposite, K, Si, Mg, Na, S and P are detected all over the surface of the different particles observed, which induces an occlusion in the carbon structure of the activated carbon. K and Si are the main mineral products present in the carbon structure, while Mg, Na, S and P are present at lower concentrations. All these mineral impurities are initially present in raw materials where the ashes content is 1.8 wt. %.
3.1.2 Adsorption of nitrogen
The textural properties of the activated carbon are reported in Table 3. The nitrogen adsorption–desorption isotherms are shown in Fig. 3. The relatively high values of the specific surface area and of the micropores’ volume prove that the activation of olive stones with water vapor leads to an activated carbon characterized by a well-developed porous structure where micropores predominate.
Textural properties of the activated carbon.
| Label | SBET (m2/g) | Vmicropores (cm3/g) | Vmesopores (cm3/g) |
| OSAC_PW360 | 807 | 0.30 | 0.41 |
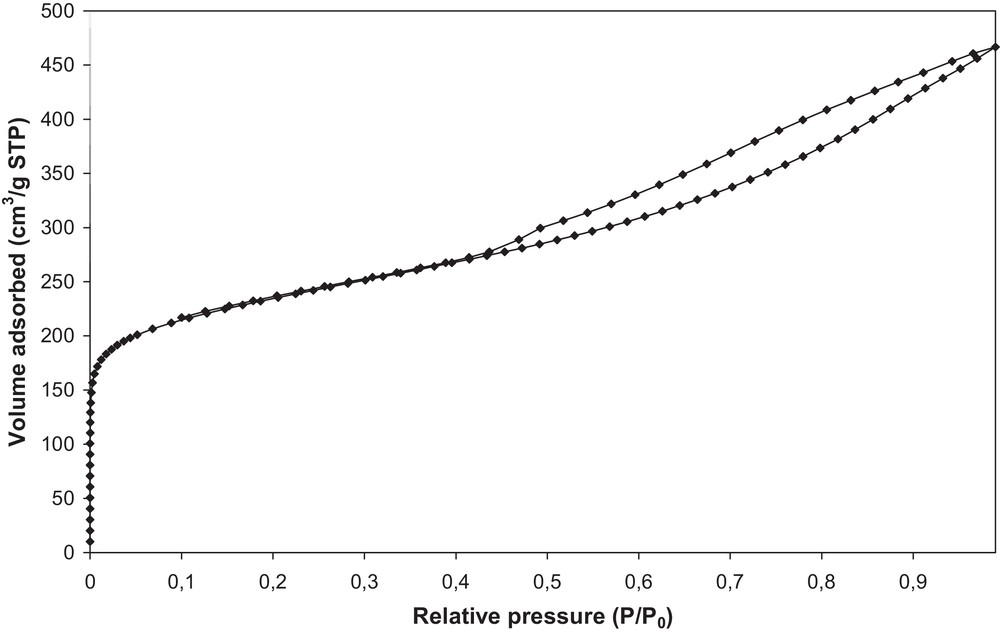
Nitrogen adsorption–desorption isotherms of activated carbon OSAC_PW360.
A micropore volume of 0.30 cm3/g is estimated by the t-plot method, as well as a surface area of 807 m2/g. These textural results confirm the characteristics measured previously for the same AC [32]. These properties offer a good potential for the activated carbon to adsorb high amounts of small molecules.
While SEM characterizations indicate that the activated carbon presents a high surface rugosity and also macropores, nitrogen adsorption experiments reveal the presence of microporosity and mesoporosity from the isotherm type (Fig. 3). Indeed the presence of a hysteresis loop also proves the presence of a mesoporosity that is not well defined in the material, according to the form of the hysteresis loop. The capillary condensation could take place in a non-rigid structure, due to the presence of aggregates in the activated carbon.
3.1.3 FTIR analysis
The interpretation of the FTIR spectra is based on the chemical structure of olive stones and the different stages of the pyrolysis process. The main components of the olive stones are hemicellulose, cellulose, and lignin. Contrary to the other polymers, lignin has an aromatic character. Fig. 4 illustrates the FTIR spectrum of OSAC_PW360 sample. This spectrum presents mainly two stretching peaks, the first located at 879 cm−1, which can be attributed to C–H bending and the second located at 1462 cm−1 assigned to the aromatic ring stretching. Otherwise, a large band located between 1100 cm−1 and 1300 cm−1 was assigned to C–O, present in the aromatic rings. A second band between 3020 and 3300 corresponds to the C–H stretching. The spectrum of the sample shows the absence of significant peaks for the bands corresponding to O–H, CO and C–O–C groups. This behavior suggests that the activated carbon is mainly an aromatic polymer of carbon atoms.
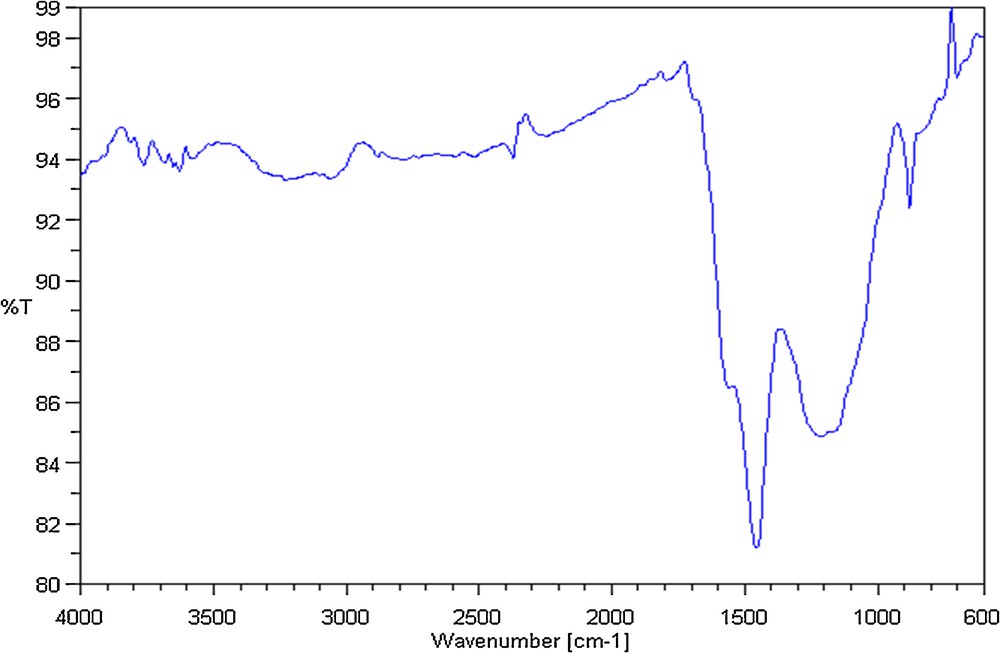
FTIR spectra of activated carbon OSAC_PW360.
3.1.4 TPD–MS Analysis
The type and quantities of oxygenated groups present on the carbon surface are key factors for adsorption-related phenomena, as they can play an important role in the interactions with the adsorbed molecules [33,35].
Thus, the activated carbon surface functionality was analyzed by the TPD–MS technique and the desorption rates of each gas evolved during the thermal treatment is plotted versus temperature, as shown in Fig. 5.
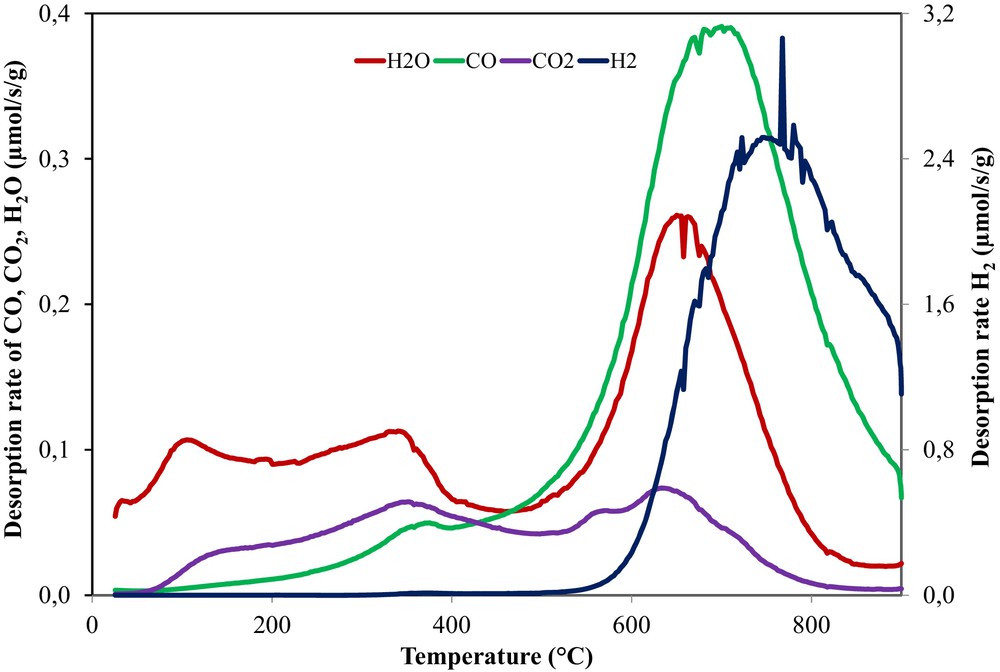
(Color online.) H2, H2O, CO and CO2 desorption rates as a function of the applied temperature during a TPD–MS analysis of OSAC_PW360 activated carbon.
During the heating of the activated carbon, the decomposition of the functional oxygenated groups occurs, leading to the formation of gases such as CO and CO2. The type of COx groups released and their temperature give an indication about their nature. Typically, the CO2 derives from carboxyl or anhydride groups, while CO from carbonyl, ether, and quinone groups [36].
For the activated carbon, an intense and large peak of CO is observed at high desorption temperatures (500–900 °C), suggesting the existence of basic or neutral functional oxygenated groups stable at high temperatures such as ethers, phenols, and quinones [35–37].
Conversely, the CO2 peak specific to acidic groups has a significant lower intensity than the CO peak. However, the small peak detected is located in a large temperature interval (100–800 °C) and two desorption peaks can be distinguished around 350 °C and 650 °C, indicating the presence of carboxyl and anhydride groups [33,37,38].
Beside CO and CO2 desorption, peaks related to water and H2 are also detected. The water profile exhibits two small peaks (100 and 350 °C) and a very intense one placed around 700 °C. The first peak can be assigned to physisorbed water, and the second one to chemisorbed water. The peak at 350 °C could be an indication of water desorbed due to the dehydration reactions of neighbor hydroxyl groups, leading to the formation of anhydrides, which decompose at higher temperature to CO and CO2. The more intense peak from 700 °C can be assigned to the chemisorbed water induced by the activation with the water steam at 750 °C. Furthermore, a great peak of hydrogen is observed at high temperature (∼800 °C), which is typical for the cleavage of the C–H bonds.
The integration of the desorption peaks (between 25 and 950 °C) allows us to quantify the amounts of oxygenated groups as showed in Table 4. According to Table 4, which reports the total amount of CO, CO2, H2 and H2O desorbed, the amount of CO evolved is higher than CO2, in good agreement with the desorption profiles intensity. The water quantity is comparable to that of CO, while the H2 quantity is five times superior to the other desorbed groups. This can be also ascribed to the lower thermal treatment temperature of the activated carbon (750 °C) than the one used for the TPD–MS measurements (900 °C). In this case, the reorganization of carbon from structural point of view takes place in situ during the TPD–MS experiment.
Amount of CO, CO2, H2O and H2 obtained by integration of the TPD–MS peaks for activated carbon.
| Material | CO (mmol/g) | CO2 (mmol/g) | H2O (mmol/g) | H2 (mmol/g) |
| OSAC_PW360 | 1.25 | 0.39 | 1.06 | 6.76 |
3.1.5 Surface group analysis
Volumetric analysis by the Boehm method was used to quantify the principal acidic and basic surface groups. The results confirm that our activated carbon contains essentially basic groups, and the total basicity is 1.86 mmol/g; however, the total acidity is 0.42 mmol/g.
The isolectric point pHpzs was determined in aqueous solution and found to be 10.8. All these values have been obtained in water suspensions and they have more importance in wet processes, but these pieces of information give important tools in adsorption processes, even in the gas phase.
3.2 Adsorption tests
3.2.1 Adsorption of NO2 on activated carbon
Fig. 6 shows the outlet concentrations of NO and NO2 recorded during the exposure of 500 ppm NO2 to 100 mg of OSAC_PW360 at ambient temperature. The NOx curve represents the sum of NO and NO2. This typical result was already observed for various carbonaceous materials [8,9,20].
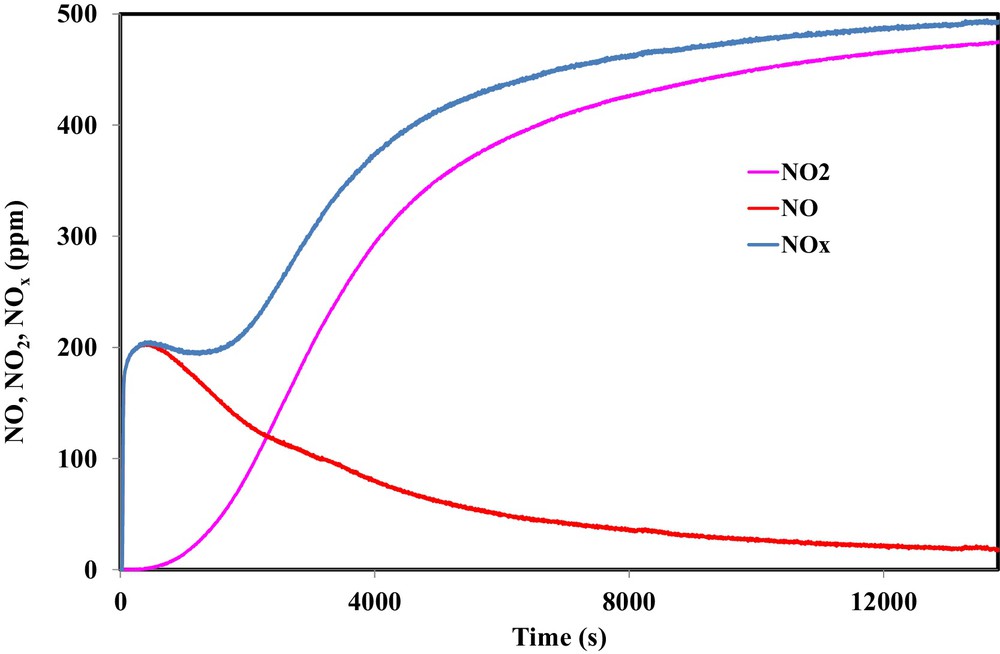
(Color online.) Outlet concentrations of NO2, NO and NOx during the adsorption of 500 ppm NO2 on OSAC-PW360 at room temperature.
During the first instant of the adsorption test, a sharp increase of NO emission was observed, reaching a constant value of 200 ppm, until NO2 appeared from the reactor 500 s later when NO started decreasing. In the first 500 s, it is evident that N and O species were adsorbed on the activated carbon. Hence, the emission of NO suggests that oxygen is partly fixed on the carbon surface in the form of surface complexes. The comparison of the NOx curve with the NO2 inlet concentration shows that a significant amount of NO2 is adsorbed on the activated carbon surface. Moreover, the analysis of the evolution of the ratio between the NO emitted and the adsorbed NO2 shows that the obtained values ranged from 0.47 to 0.7 during the first 4000 s. Such values confirmed that NO2 may adsorb directly on the oxygenated surface groups of the activated carbon surface or on the oxygen complexes formed during the reduction of NO2 into NO.
The nitrogen/oxygen balance shows that, during the adsorption test, 2.85 mmol/g of NO2 were adsorbed on the carbon surface, while 2.0 mmol/g of O were deposited on the activated carbon surface. The discrepancy between both values confirms that NO2 may adsorb two different adsorption sites, i.e., on the oxygen surface functional groups obtained during physical activation or on the oxygen surface formed by NO2 reduction. From these values, the obtained NO2 adsorption capacity is 131 mg/g and the NO/NO2 ratio is equal to 0.7. The NO2 adsorption capacity of OSAC_PW360 is higher than the values found in the literature for an activated carbon prepared from lignocellulosic biomass by CO2 physical activation or by KOH chemical activation [17,22,23]. Although a higher specific area and microporous volume were obtained for activated carbon prepared from walnut shell by KOH chemical activation compared to OSAC_PW360, NO2 adsorption capacity is higher for the latter activated carbon. Consequently, the microporous volume in activated carbon is not the most important parameter for NO2 adsorption. Such results indicate that the chemical character of the activated carbons surface may play an important role in the interaction of the AC with nitrogen dioxide. In particular, Pietzrak identified a correlation between the sorption capacities with the adsorbent basicity. Hence, the basic character of OSAC_PW360 highlighted by the TPD–MS analysis may explain the increase of NO2 adsorption capacities. Moreover, previous investigations on the surface oxide functional groups estimated by Boehm method showed that the OSAC_PW360 contains a higher content of surface oxygen basic groups (1.86 mmol/g) [32]. This latter value may explain the higher adsorption capacity for OSAC_PW360 compared to activated carbon prepared from sawdust pellets. In fact, Pietzrak found a NO2 adsorption capacity of 43.1 mg/g for an activated carbon containing 0.72 mmol/g of surface oxygen basic groups. This hypothesis is also confirmed by the results of Nowicki et al. during NO2 removal using an activated carbon prepared by KOH chemical and CO2 physical wastes from coffee industry [17]. These authors found a NO2 adsorption capacity of 44.5 mg/g for an activated carbon containing 0.9 mmol/g of surface oxygen basic groups. In contrast, Nowicki et al. found a lower adsorption capacity for the physical CO2 activated carbon although a higher amount of basic groups are present (11.32 mmol/g). Such results may be attributed to the absence of micropores. Hence, one may conclude that both micropores and surface oxygen basic groups play an important role in NO2 adsorption on the activated carbon.
At the end of the adsorption test, a temperature-programmed desorption analysis was performed under a nitrogen flow by heating the sample from room temperature to 600 °C at a 5 °C/min heating rate. NO2, NO, CO2 and CO emissions were recorded as a function of temperature and shown in Fig. 7. The obtained results are compared with the results obtained during the TPD–MS analysis in order to assess the different species formed on the activated carbon surface.
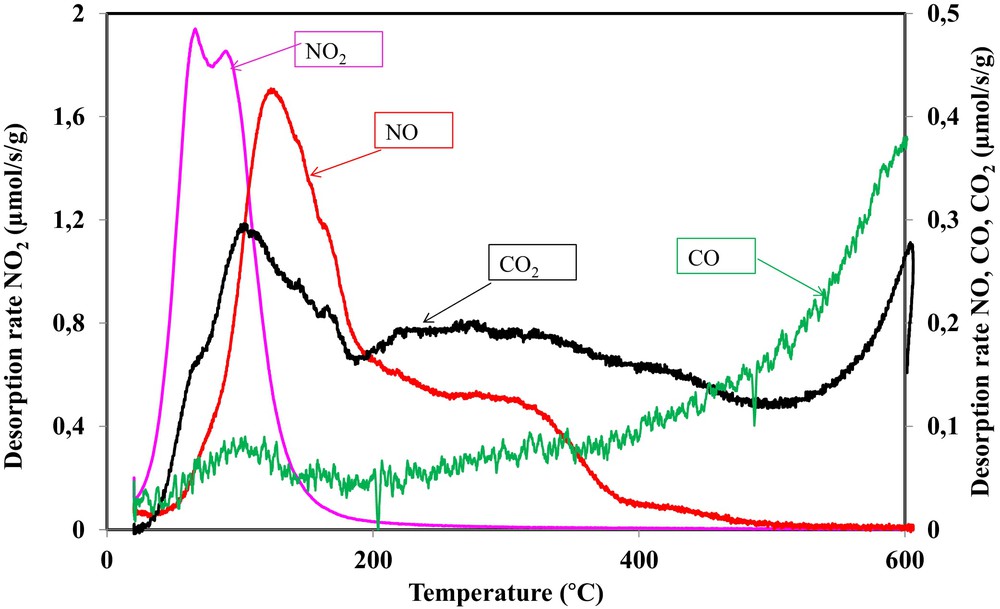
(Color online.) NO2, NO, CO and CO2 desorption rates as a function of the applied temperature during a TPD of OSAC_PW360 activated carbon after exposure to 500 ppm NO2.
During TPD experiments, several peaks at different temperature intervals were observed. Such behavior confirms that various surface groups are formed during the adsorption of NO2. Fig. 7 shows that NO2 desorption occurred earlier, starting from 25 °C and finishing at 200 °C. Two NO2 desorption peaks were observed at 68 °C and 93 °C, respectively. This indicates a weak interaction (physisorption) between the carbon surface and NO2. NO desorption started later than that of NO2 at temperatures close to 50 °C. The NO desorption curve may be divided into three steps. A first step occurred between 50 and 200 °C with a desorption peak at 120 °C. A second step of NO desorption consisted of a shoulder occurring between 200 and 390 °C. The last step consisted also of a shoulder with a low desorption rate occurring between 390 and 500 °C.
In a similar way, the CO2 desorption curve may be divided into three zones. A first step occurred between 30 and 190 °C, characterized by a shoulder at 68 °C and a peak at 102 °C. This step was not observed during the TPD–MS analysis of the activated carbon before NO2 treatment. The second zone of CO2 desorption occurred in a large temperature interval between 190 °C and 500 °C. This decomposition step was already observed during TPD–MS analysis, but at a lower desorption rate. The third decomposition step, already observed in our TPD–MS analysis, occurred above 500 °C.
The CO desorption curve may be divided into two steps. A first step, not observed during TPD–MS analysis, between 30 and 200 °C occurred at a low desorption rate. Above 200 °C, a second step, characterized by a continuous increase of the desorption rate, is observed.
In order to assess the different surface groups during NO2 adsorption, the curves of the various emitted gas are compared. Hence, it is observed that the first peak of NO2 occurred simultaneously with the CO2 shoulder. Therefore, in addition to the physisorbed NO2, a decomposition of the –C(O2NO2) complex occurs at lower temperatures according to:
| (1) |
Such a surface group was already mentioned by Shirahama et al. [8]. Moreover, the second peak of NO2 occurred simultaneously with a CO peak that indicates the decomposition of a small amount of –C(ONO2) complex according to:
| (2) |
The analysis of the amount emitted between 80 and 200 °C showed 83 μmol/g of CO, 321 μmol/g of CO2 and 406 μmol/g of NO. Hence, the amount of NO emitted is very close to the sum of CO and CO2 amounts. Therefore, below 200 °C, the following reactions occurred:
| (3) |
| (4) |
These reactions also occurred between 200 and 390 °C. However, the difference between the sum of CO and CO2 emitted amounts (CO = 152 μmol/g, CO2 = 412 μmol/g) and NO emitted (NO = 250 μmol/g) is higher than the amount of CO and CO2 during the TPD–MS analysis in the same temperature interval (CO = 66 μmol/g, CO2 = 115 μmol/g). Such calculations showed that some carboxyl and anhydrides groups are formed from the interaction of NO2 with the activated carbon surface [33,37,38].
Above 390 °C, CO2 desorption occurred from the decomposition of lactone and anhydride groups, while CO desorption occurred from the decomposition of ether, phenol and quinone groups. These different groups were initially present in the activated carbon surface or formed during the interaction of NO2 with OSAC_PW360.
3.2.2 Effect of the inlet gas composition on the activated carbon–NO2 interaction
In order to understand the effect of oxygen in the adsorption mechanism of NO2 on activated carbon, adsorption tests were performed in the presence of 500 ppm of NO2 and different concentrations of oxygen (0, 10, 15 and 20% vol.). Fig. 8a and b show NO, NO2 and NOx outlet concentrations as a function of time.
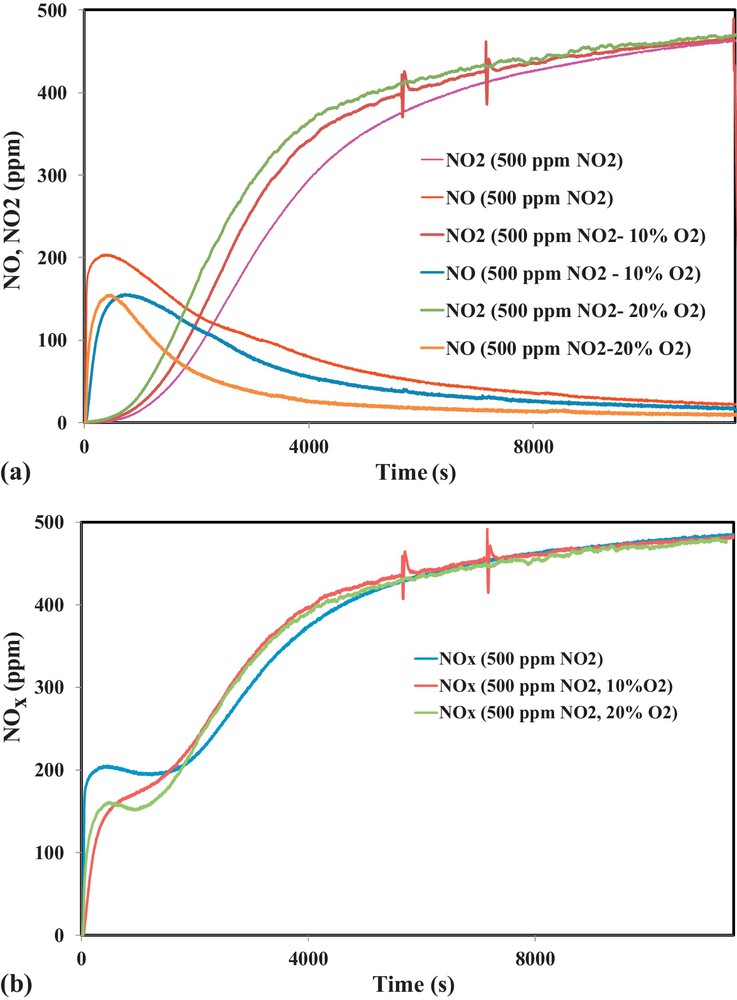
(Color online.) a. Outlet concentrations of NO2 and NO during NO2 adsorption on OSAC-PW360 in the presence of different oxygen concentrations. b. Outlet concentrations of NOx during NO2 adsorption on OSAC-PW360 in the presence of different oxygen concentrations.
Fig. 8a and b show that the shape of NO and NO2 curves are quite similar for the different tested oxygen concentrations. However, it is clearly shown that the addition of oxygen leads to the decrease of NO2 reduction into NO. Moreover, comparison of the adsorbed NO2 through NOx curves in Fig. 8b shows that increase in oxygen amount induces an increase in the amount of NO2 adsorbed during the first 1750 s. Above 1750 s, the amount of NO2 adsorbed in the absence of oxygen increases and reaches the same value as in the presence of oxygen in the inlet gas. The calculated NO2 adsorption capacities and NO/NO2ads ratios are displayed in Table 5 for different inlet gas compositions.
NO2 adsorption capacities and NO/NO2ads ratio observed during the adsorption of NO2 with different concentrations of O2.
| Operating conditions | NO2 adsorption capacity (mg NO2/g) | Ratio NO/NO2ads |
| 500 ppm NO2 | 131.1 | 0.68 |
| 500 ppm NO2 + 10% O2 | 130.1 | 0.47 |
| 500 ppm NO2 + 15% O2 | 129.8 | 0.38 |
| 500 ppm NO2 + 20% O2 | 130.8 | 0.31 |
Table 5 shows that the adsorption capacities are not significantly affected by the presence of oxygen. However, it is evident that the amount of NO emitted decreases when increasing O2 inlet concentration.
Due to the presence of CO2 in the exhaust gas of several industrial flues containing NO2, the effect of the presence of 10% CO2 on the adsorption performance of OSAC_PW360 is examined. Fig. 9 shows a comparison between the NOx concentrations for different inlet gas compositions.
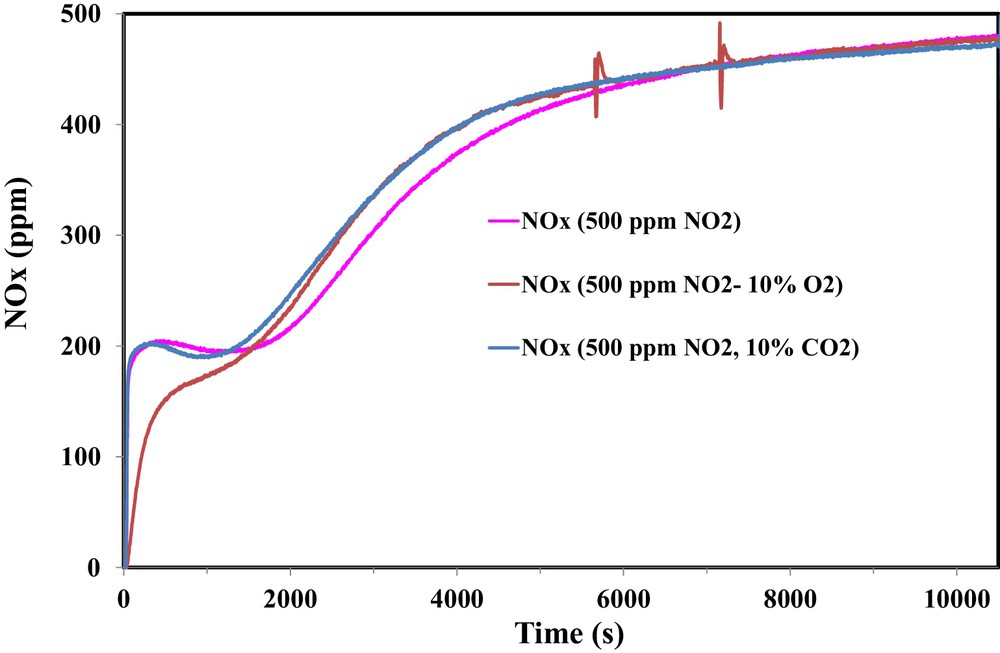
(Color online.) Effect of the presence of 10% CO2 on the adsorption of NO2 on OSAC-PW360 at room temperature.
Fig. 9 shows different behaviors on the NOx profiles. Hence, during the first 1500 s, the adsorbed amount of NO2 is higher in the presence of 10% O2 than in the presence of 10% CO2. One can note also that, during this first period, quite similar NOx profiles for the adsorption test in the presence of 500 ppm NO2 and 500 ppm NO2/10% CO2. However, above 1500 s, there is no significant difference between both outlet gas compositions in the presence of 10% O2 or 10% CO2. Therefore, NO2 adsorption capacity decreases slightly from 131.1 mg/g in the presence of 500 ppm NO2 to 120.9 mg/g in the presence of 500 ppm NO2–10% CO2. Moreover, it is observed that the presence of CO2 inhibits the reduction of NO2 into NO and the NO/NO2ads ratio decreases from 0.68 to 0.54.
3.2.3 Effect of the temperature on the activated carbon–NO2 interaction
The effect of the temperature on the NO2 adsorption was examined. Hence, the adsorption test was performed with 500 ppm NO2 at 50 °C. The comparison between outlet NO and NO2 concentrations at 50 °C and ambient temperature is shown in Fig. 10.
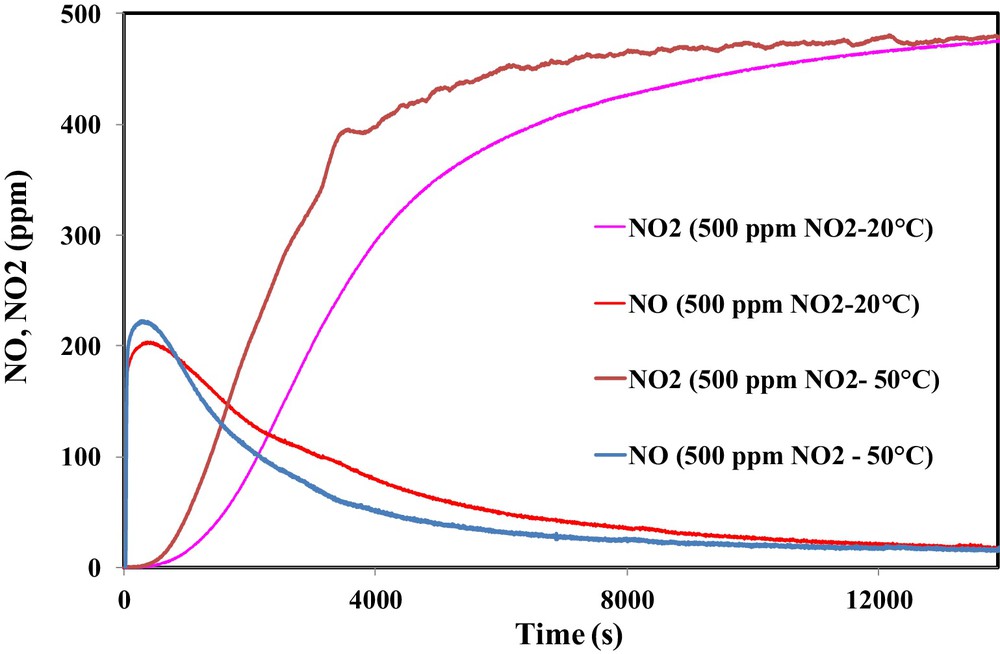
(Color online.) Effect of the temperature on the outlet concentrations of NO2 and NO during the adsorption of NO2 on OSAC-PW360.
It is clearly shown that increasing the inlet gas temperature leads to a significant decrease in the adsorbed NO2 amount. However, an increase of the emitted NO is observed. Hence, NO2 adsorption capacity decreases from 131.1 mg/g at 20 °C to 79.8 mg/g at 50 °C. The latter value is close to that obtained by Guo et al. during the adsorption of 500 ppm NO2 on a commercial activated carbon at 50 °C [20]. In contrast, a temperature rise leads to an increase of NO emission and therefore the ratio NO/NO2ads increases from 0.68 to 0.94.
4 Conclusion
The aim of this research was to investigate the performance of an activated carbon, prepared from olive stones, on NO2 adsorption. Hence, physical activation of olive stones by water vapor was performed at 750 °C for 360 min. Adsorption of nitrogen, scanning electron microscopy (SEM) in combination with energy dispersive X-ray spectroscopy (EDX), Fourier transform infrared (FTIR) and temperature-programmed desorption coupled with mass spectroscopy (TPD–MS) were used for the characterization of the texture, the morphology and the surface chemistry of the activated carbon. NO2 adsorption tests were performed for different inlet gas compositions and temperatures.
Characterization analysis shows that a porous material is obtained with a surface area of 807 m2/g and a microporous volume of 0.30 cm3/g. However, a heterogeneous macroporosity was observed with pore sizes between 10 to less than 1 μm. EDX analysis shows the presence of Ca on the surface separated from the carbon structure while K, Si, Mg, Na, S and P are blocked in the carbon structure. TPD–MS and FTIR analyses show the presence of different surface groups on the activated carbon such as carboxyl, anhydride carbonyl, ether and quinone groups.
The NO2 adsorption tests show that the developed activated carbon has interesting adsorption capacities higher than the different activated carbon available in the literature and generally prepared from lignocellulosic biomass by KOH chemical and CO2 physical activations (without doped metals). It was observed that the NO2 adsorption capacity is not only related to the microporosity, but also to its surface functional groups. The oxygenated surface groups initially present or formed by NO2 reduction may play a significant role in the interaction mechanism of NO2 with the activated carbon. Moreover, physisorbed water may also have an important role for NO2 adsorption. However, further investigations are necessary to identify the contribution of each activated carbon characteristics as well as the type of oxygen groups that is more beneficial to NO2 adsorption abilities.
Acknowledgments
The authors are grateful to Mrs. Damaris Kehrli (laboratoire “Gestion des risques et environnement”) and to Mr. Yassine Elmay (Institut de science des matériaux de Mulhouse) for carrying out some experiments.