


 CC-BY 4.0
1. Introduction
During the past decades, the increasing availability of synchrotron radiation facilities such as synchrotron SOLEIL (the French national facility) have allowed the physician to develop a completely new set of characterization techniques. These are based on radiation-matter interactions, and include X-ray absorption spectroscopy (XAS) [1, 2, 3], anomalous wide angle X-ray scattering (AWAXS) [4, 5, 6, 7], anomalous small angle X-ray scattering (ASAXS) [4, 5, 6] or diffraction anomalous fine structure (DAFS) [8]. Among this family of techniques, X-ray Absorption Near Edge Structure (XANES) constitutes one aspect of XAS [1, 2, 3], the other being Extended X-ray Absorption Fine Structure (EXAFS); both play pivotal roles in medical [9] as well as in biological [10, 11, 12] research.
Some of the valuable information yielded by XANES spectroscopy may be exemplified by another characterization technique, namely X-ray fluorescence (XRF), discussed previously [13, 14, 15]. XRF is one of the techniques able to identify and quantify the different elements present in a biological sample [16, 17, 18] and map them at the submicrometer scale. This elementary composition of the sample may be sufficient to establish a clinical diagnosis. This is the case for lead, the toxicity of which is intimately linked to the condition saturnism. For, the electronic state of other elements, such as chromium, can determine their toxicity. While Cr(III) is physiologically essential in sugar and lipid metabolism, Cr(VI) compounds can induce DNA damage and have potential cellular mutagenic effects [19]. XANES spectroscopy can not only establish the electronic state of Cr but also additional structural information regarding the local order around Cr atoms. The present paper will thus show how XANES spectroscopy represents an exceptional tool to investigate local structure in samples encompassing those without long range order such as molecular [20, 21, 22, 23, 24, 25, 26] and nanometer scale clusters [27, 28, 29, 30, 31, 32], or amorphous compounds [33, 34, 35]. Such micrometer scale structural information allows significant correlation with the anatomical structures and thus with normal or pathological biological functions.
To this end, we will present key elements of the theory, the data analysis procedure, two experimental set ups available on the synchrotron SOLEIL (the DiffAbs and LUCIA (Line for Ultimate Characterisation by Imaging and Absorption) beamlines), and finally selected case studies which exemplify the various opportunities offered by XANES spectroscopy in medicine. These results should show clinicians how such spectroscopy can be inserted into their research, supplementing currently used vibrational spectroscopies such as μFourier Transform—InfraRed spectroscopy (μFTIR) [36, 37, 38, 39, 40, 41, 42] or Raman spectroscopy [43, 44, 45]. Finally, we will discuss the advantages and limitations of XANES spectroscopy relative to other techniques, namely Energy Loss Near Edge Structure (ELNES) and X-Ray Photoelectron Spectroscopy (XPS) which have yielded useful biomedical information [46, 47, 48, 49, 50, 51, 52].
2. Basic features of XANES spectroscopy
2.1. Theoretical elements of XANES
The theory of XAS can be found in several excellent publications (see for example Refs [53, 54, 55, 56, 57, 58, 59]). Some basic notions regarding this technique are summarized here to better understand its usefulness.
X-ray photons passing through matter interact with it through scattering and absorption. The absorbed intensity decreases exponentially with penetration thickness (x) (Figure 1a), as expressed by Lambert–Beer’s law:
(a) Schematic representation of Lambert–Beer’s law. (b) Discontinuity of the absorption edge observed at 9673 eV for Zn atoms. (c) A photon (1) is absorbed by the atom inducing the ejection (2) of an electron from an inner atomic shell.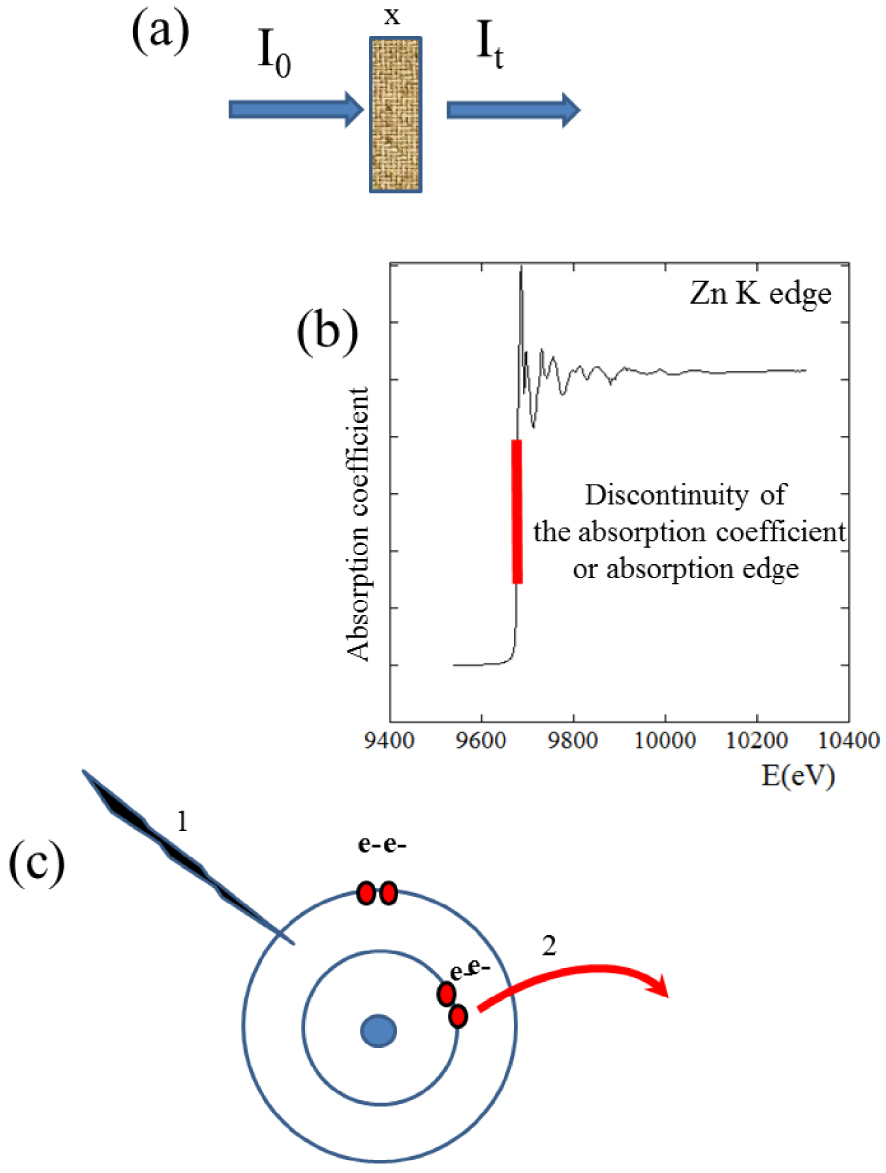
XAS spectroscopy studies absorption coefficient modulations as a function of the energy of incident photons near an abrupt discontinuity (Figure 1b), referred to as “absorption edge”. This edge corresponds to the energy of incoming photons sufficient to eject electrons from the inner atomic shells i.e. equal to the binding energy of core-shell electrons. The discrete energies corresponding to the inner shell electrons [60] makes XAS atomically specific (Table 1), allowing the clinician to study a given element by selecting the photon energy. The edge corresponding to 1s electron ejection is referred to as K, and so on for higher electron shells: LI for 2s electrons, LII for 2p1∕2, and LIII for 2p3∕2. This so-called “absorption edge” is sometimes also referred to as the “white line” [61, 62]. XANES spectra can be collected for all elements, from very light, e.g. nitrogen [63, 64] or sulphur [65, 66, 67], and from transition metals such as Fe [68, 69] to the heaviest, e.g. Pt [70, 71, 72, 73, 74].
X-ray absorption edges of selected elements (keV)
| Element | K-edge | LI-edge | LII-edge | LIII-edge |
|---|---|---|---|---|
| C | 0.282 | |||
| N | 0.397 | |||
| O | 0.533 | |||
| F | 0.692 | |||
| Na | 1.080 | |||
| Mg | 1.309 | |||
| Al | 1.562 | 0.087 | 0.076 | 0.075 |
| Si | 1.840 | 0.118 | 0.101 | 0.100 |
| P | 2.143 | 0.153 | 0.130 | 0.129 |
| S | 2.471 | 0.193 | 0.164 | 0.163 |
| Cl | 2.824 | 0.237 | 0.204 | 0.202 |
| Ca | 4.034 | 0.403 | 0.346 | 0.342 |
| Ti | 4.965 | 0.529 | 0.460 | 0.454 |
| Cr | 5.987 | 0.694 | 0.582 | 0.572 |
| Fe | 7.112 | 0.846 | 0.721 | 0.708 |
| Co | 7.712 | 0.929 | 0.797 | 0.782 |
| Ni | 8.339 | 1.016 | 0.878 | 0.861 |
| Cu | 8.993 | 1.109 | 0.965 | 0.945 |
| Zn | 9.673 | 1.208 | 1.057 | 1.034 |
| As | 11.877 | 1.536 | 1.368 | 1.333 |
| Pt | 78.400 | 13.880 | 13.277 | 11.568 |
After ejection, the photo-electron transits towards empty localized and continuum electronic levels, depending on its excess energy above the binding energy. On the one hand, the local symmetry in which the atom is embedded (tetrahedron, octahedron, square planar…) and the electronic structure of the atom influence the relative position and occupancy of the localized levels and thus the number and energies of the near-edge XAS signals [53, 54, 55, 56, 57, 58, 59]. On the other hand, a free photoelectron can be scattered by the surrounding atoms in a train of scattering events. The modulation of the oscillation coefficient is then sensitive to the number, chemical nature, distance, and local arrangement of the neighbouring atomic environment.
Repartition of the XANES (green part) and EXAFS (yellow part) parts of a XAS spectrum in the case of Zincite (NZnO = 4 R = 1.92 Å, R = 1.99 Å) and Smithsonite (NZnO = 6 R = 2.11 Å) (bold).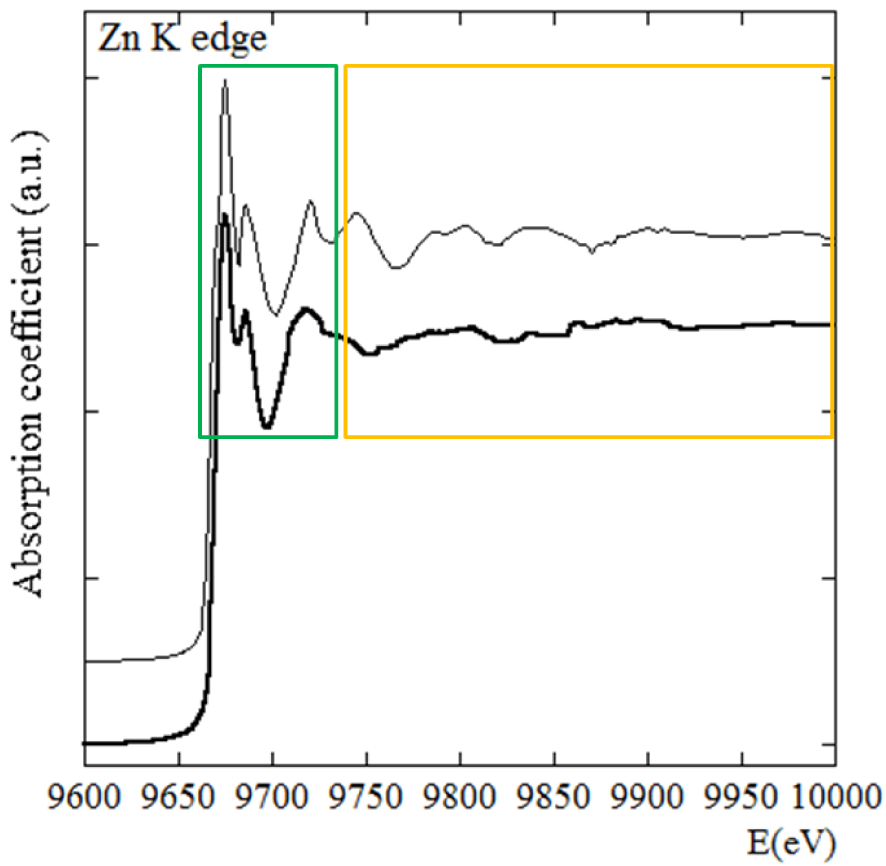
Figure 2 clearly shows the difference between XANES and EXAFS of Smithsonite (ZnCO3), and Zincite (ZnO) and highlights the sensitivity of XANES spectroscopy: these two compounds corresponding to two very different Zn atomic coordination environments; Zn coordination in Smithsonite corresponds to (N = 6, R = 2.11 Å) while in Zincite it is described as (N = 4, R = 1.92 Å, R = 1.99 Å).
2.2. Data analysis procedures
Two different approaches to data treatment can be considered. As discussed by Guda et al. [59], the very first analysis of a XANES spectrum was performed in 1960 by Van Nordsthand [75] who carried out a systematic study on the spectra of many transition metal compounds and classified their XANES spectra according to the atomic structure and valence of the metal element in the compound. Thus, a simple way to analyse the XANES data is to use a set of XANES spectra which correspond to reference compounds and compare them with the XANES spectra of the samples (direct comparison as fingerprint or linear combination of references). Another way to analyse the data is through numerical simulations. These methods are explained below.
2.2.1. XANES data analysis: comparison with reference compounds
In physiological and pathological calcifications, Ca occurs in numerous chemical phases, such as calcium oxalate, calcium phosphate, calcium carbonate, etc. as highlighted in Table 2 [76]. Ca phosphate compounds play key roles in different medical fields such as rheumatology and nephrology. Various articles [77, 78, 79] describe experiments based on fluorescence induced by electrons ejected from higher energy levels filling the core “hole” associated with photoelectron creation, to determine the chemical compound present in the sample based on the Ca/P ratio. Unfortunately, the ratio thus determined (Table 2) is not sufficient to differentiate between calcium phosphate compounds.
Different calcium phosphate compounds with their stoichiometry and their Ca/P ratio
| Name | Stoichiometry | Ca/P ratio |
|---|---|---|
| Monocalcium phosphate | ||
| Anhydrate | Ca(H2PO4)2 | 0.5 |
| Monohydrate—MCPM | Ca(H2PO4)2H2O | 0.5 |
| Dicalcium phosphate | ||
| Anhydrous—DCPA—Monetite | CaHPO4 | 1.0 |
| Dihydrate—DCPD—Brushite | CaHPO4 2H2O | 1.0 |
| Octacalcium phosphate—OCP | ||
| Triclinic | Ca8(PO4)4(HPO4)2 5H2O | 1.33 |
| Apatitic | Ca8(PO4)2.5(HPO4)3.5 (OH)0.5 | 1.33 |
| Amorphous | Ca8(PO4)4(HPO4)2 nH2O | 1.33 |
| Tricalcium phosphate | ||
| 𝛼 (𝛼-TCP)or 𝛽 (𝛽-TCP) | Ca3(PO4)2 | 1.5 |
| Apatitic | Ca9(PO4)5(HPO4)(OH) | 1.5 |
| Amorphous Calcium phosphate—ACP | Ca9(PO4)6 nH2O | 1.5 |
| μCrystallized Synthetic Hydroxyapatite—HA | Ca10(PO4)6(OH)2 | 1.67 |
| Biologic (Carbonated calcium phosphate apatite or CA) | Ca10-x+u □x-u(PO4)6-x(CO3)x(OH)2-x+2u with □ corresponding to vacancy, x⩽2 and u⩽x∕2) | 1.33–1.67 |
| Tetracalcium phosphate TTCP | Ca4(PO4)2O | 2.00 |
Biological hydroxyapatite characteristic of bone [80, 81, 82, 83, 84] as well as pathologies of different organs such as kidney [85, 86, 87, 88], breast [89, 90], prostate [91, 92] or thyroid [93, 94] represents a challenging test case for chemical characterization via the Ca/P ratio. Biological apatites (CA or carbonated calcium phosphate apatite) are carbonated, and calcium- and OH-deficient [95, 96, 97]. Thus the Ca/P ratio is always less than 1.67 and photoelectron induced fluorescence is inefficient at precise determination of the chemical composition. X-Ray diffraction may yield interesting information but cannot detect the commonly occurring amorphous calcium phosphate.
In this respect, the sensitivity of XANES offers an interesting opportunity to differentiate several calcium phosphate compounds through the acquisition of spectra at the P [98] or Ca K-edges [99, 100, 101]: the shape of the absorption edge and associated features varies significantly with the crystallographic structure of the compound (Figure 3).
XANES spectra at the Ca K-edge of different non-apatitic calcium phosphate compounds (after Eicher et al. [100]).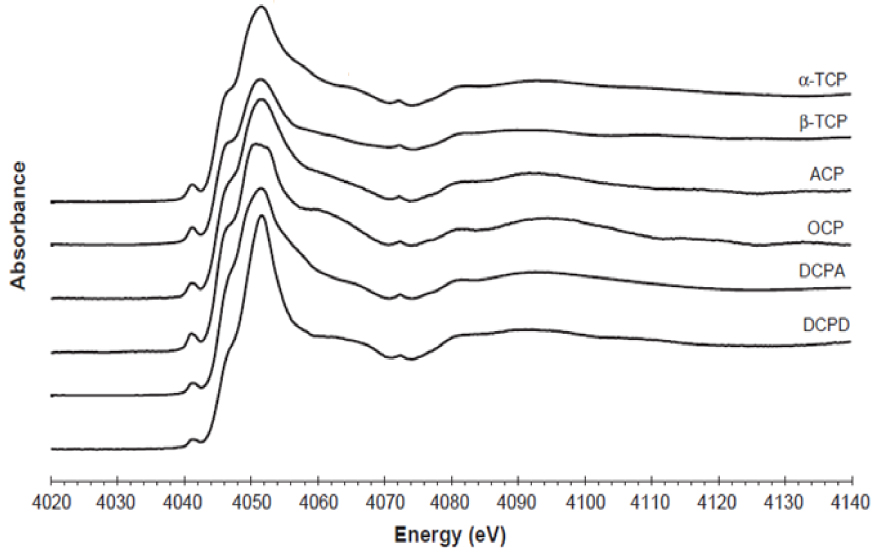
Moreover, in the case of calcium phosphate apatite, XANES at the Ca K-edge can provide information regarding long range order. As shown on Figure 4, XANES is not the same for well crystallized synthetic apatite (here, micrometre scale crystallised), biological apatite (nanometer scale crystallised) and amorphous biological calcium phosphate [34].
At this point, it is worth pointing out that quite similar results can be obtained by FTIR spectroscopy [36, 37, 38, 39, 40, 41, 42]. So why use XANES as a probe? In fact, as far as formation of Ca phosphate apatites is concerned, the amorphous surface component can be significantly altered by drying processes [102, 103, 104, 105, 106]. More precisely, the drying process before FTIR may alter the physicochemical integrity of a biological sample via transformation of the initial amorphous phase into CA. By limiting the element interrogated, XANES spectroscopy is compatible with various environments, including, in the case of Ca, hydrated samples. Thus for example sections of kidney can be inserted into the beam without preparation [34]. Moreover, taking advantages of the small dimensions of the probe, 2D XANES Ca K-edge distribution maps can be constructed [107].
XANES spectra of different compounds: references (in red, HAP, well crystallized synthetic apatite; in blue, CA, biological apatite; in black, ACCP, amorphous carbonated calcium phosphate) and kidney biopsies (1) and (2) (after Carpentier et al. [34]).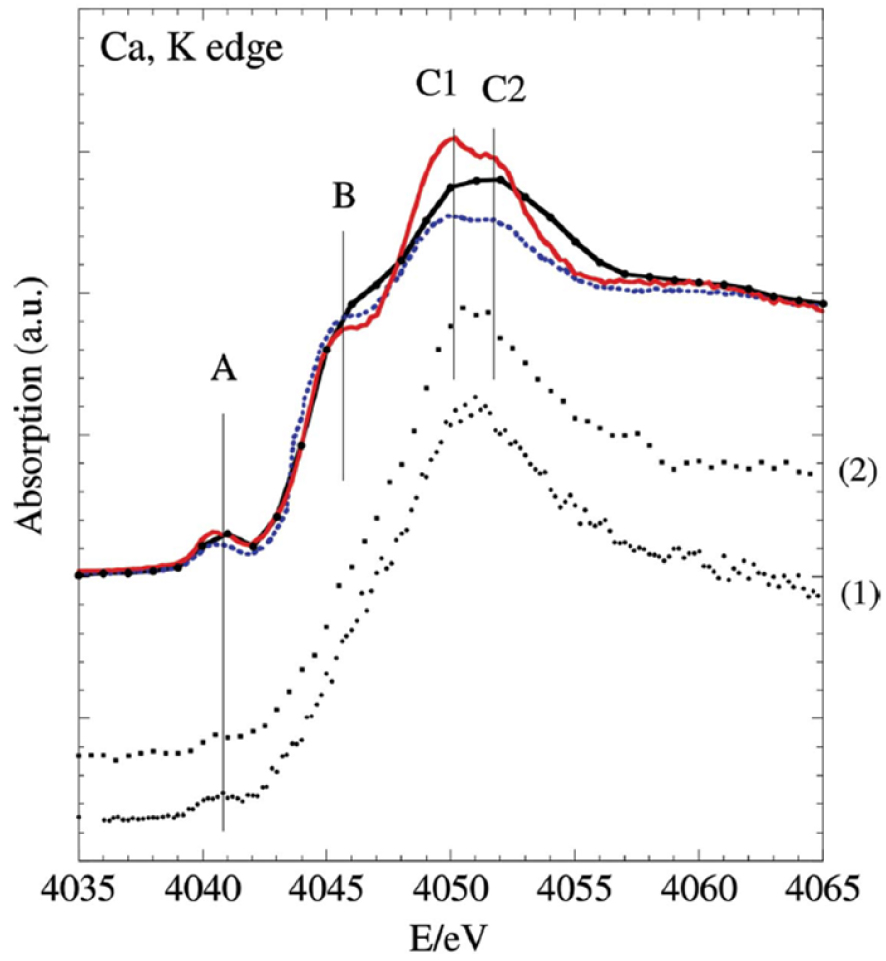
In Figure 4, the feature labelled A reflects the effective charge and the site symmetry of Ca2+ ions (3d0 outer shell electron configuration), and can be attributed to a 1s → 3d transition or O 2p molecular orbital. At higher energy above the “pre-peak” A, we find the most intense resonance, the “white line” [61, 62], which includes a shoulder-like structure (feature B; transition 1s → 4s) and a double peak (features C1 and C2; transition 1s → 4p) the relative intensities of which depend on the crystallographic position of Ca involved (Ca(I) or Ca(II)) [99, 100, 108].
The L-edge of Ca [109, 110, 111, 112, 113] and the K-edge of P [114, 115, 116] are also sensitive to the same factors. Figure 5 shows significant differences between XANES spectra at Ca L-edge for different Ca phosphate compounds [109].
XANES spectra at the Ca-LII,III-edges of several Ca-phosphate reference compounds (PP: polyphosphate). Vertical dotted lines correspond to the peak energies of HA (after Cosmidis et al. [109]).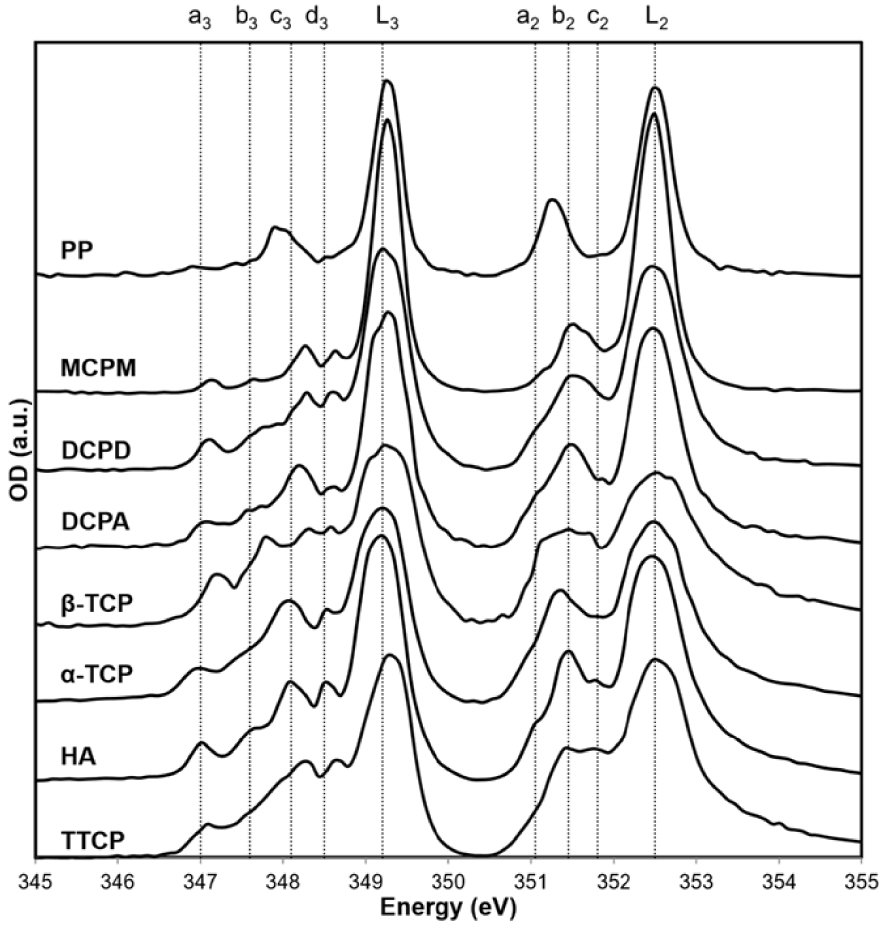
2.2.2. XANES data analysis through numerical simulations
There are several codes, such as Feff, FDMNES, Quantum-Espresso, CP2K [117], to simulate the XANES component [118, 119], and K [120] and L [121, 122, 123, 124, 125] edges. It is possible to simulate various crystallographic structures, calculate the corresponding XANES spectra, and compare them to experimental data. This approach was used to precisely localize Sr2+ cations in a crystal of calcium phosphate apatite [126, 127]. For that purpose, three structural configurations were simulated. In the first (hypothesis 1 in Figure 6), Sr2+ cations are surrounded only by oxygen atoms adsorbed at the surface of collagen or amorphous calcium phosphate. In the second configuration (hypothesis 2 in Figure 6), Sr2+ cations are engaged in the hydrated poorly crystalline apatite region present at the surface of calcium phosphate nanocrystals. Finally, a substitution of Sr2+ for Ca2+ cations can occur within Ca phosphate nanocrystals in either crystallographic site (I) or (II) (hypothesis 3 in Figure 6).
Schematic representation of the three structural hypotheses (Hypothesis 1, Hypothesis 2 and Hypothesis 3) regarding the localization of Sr2+ cations in a crystal of calcium phosphate apatite.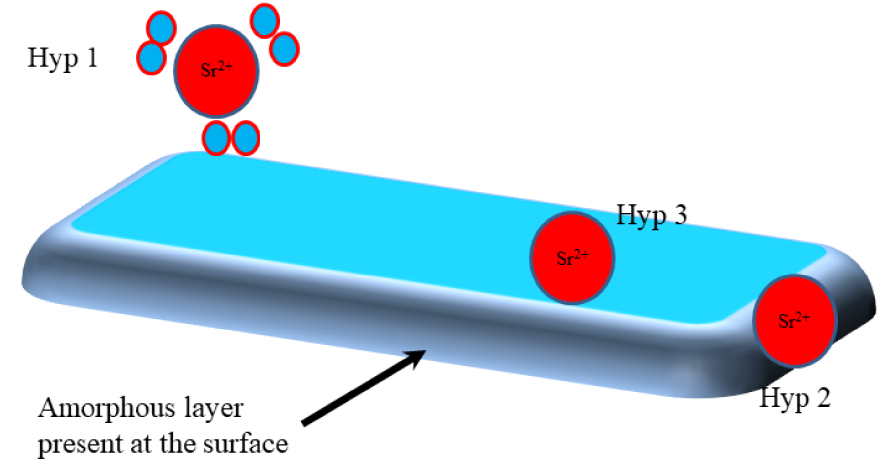
Figure 7 shows XANES simulations corresponding to each structural hypothesis in which some significant differences appear. The final data analysis step is a comparison with experimental data, from physiological and pathological calcium phosphate apatites (Figure 8). Because calcium and strontium are congeners in the periodic table, they are likely to exhibit similar chemistry and mechanistic biology, possibly explaining why physiological and pathological calcium phosphate apatites can contain Sr2+.
XANES numerical simulations for the different structural hypotheses (differences between the 3 hypotheses are supported by black arrows). Sr2+(I) refers to Sr2+ cations in the Ca2+(I) site (after Bazin et al. [127]).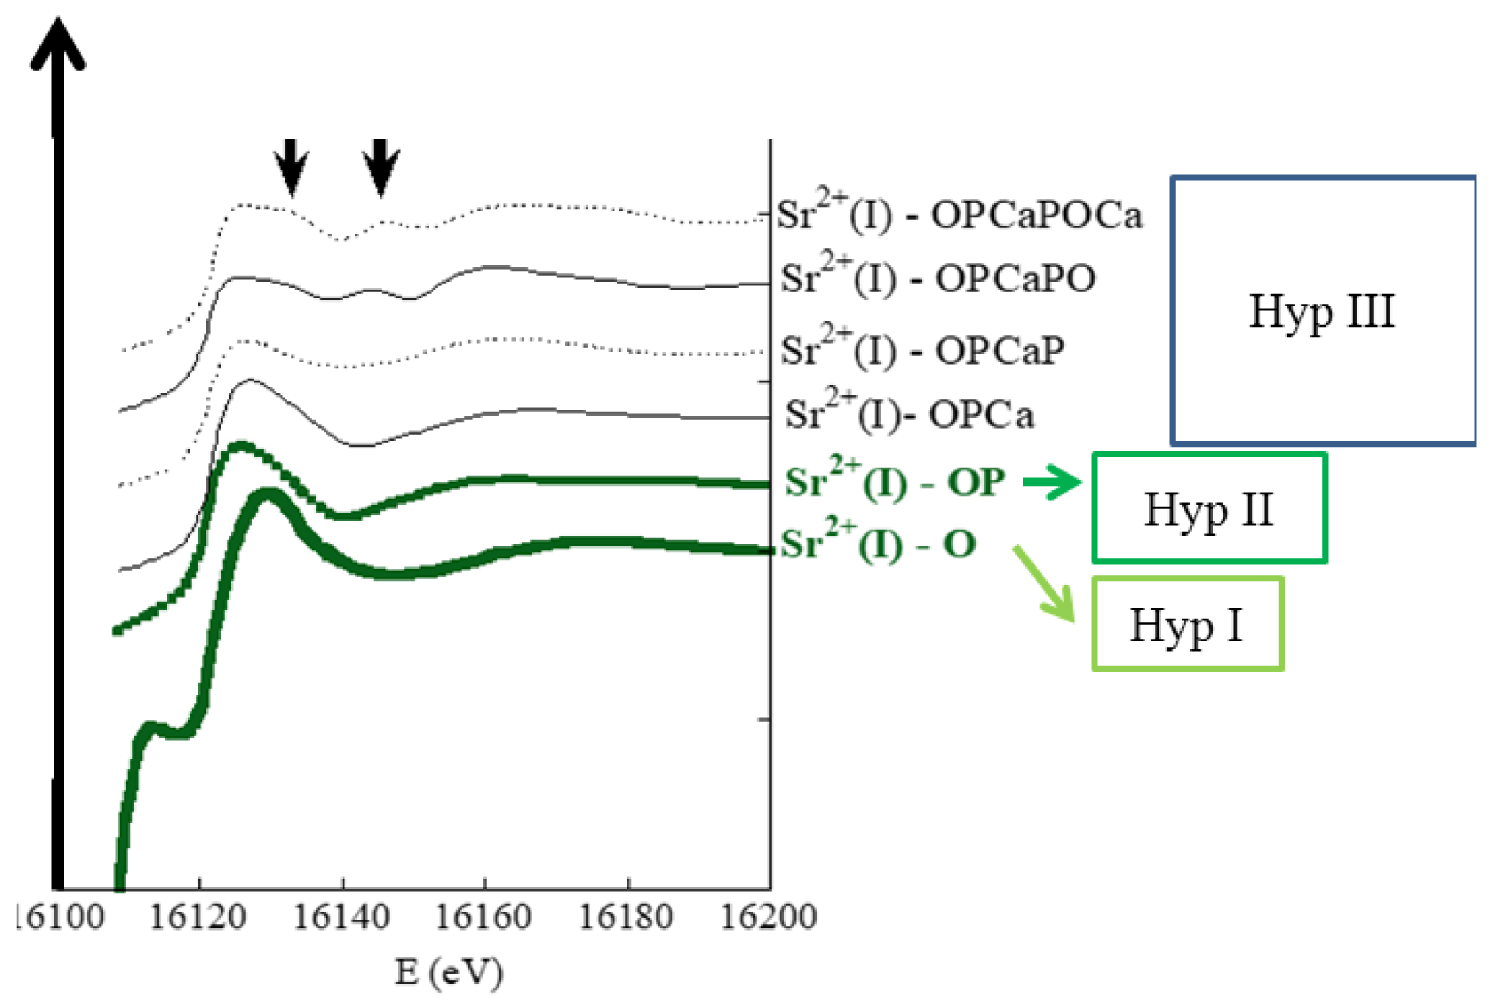
XANES part of X-ray absorption spectra collected at the Sr K-edge for different physiological (in red) and pathological (in blue) calcifications (after Bazin et al. [127]).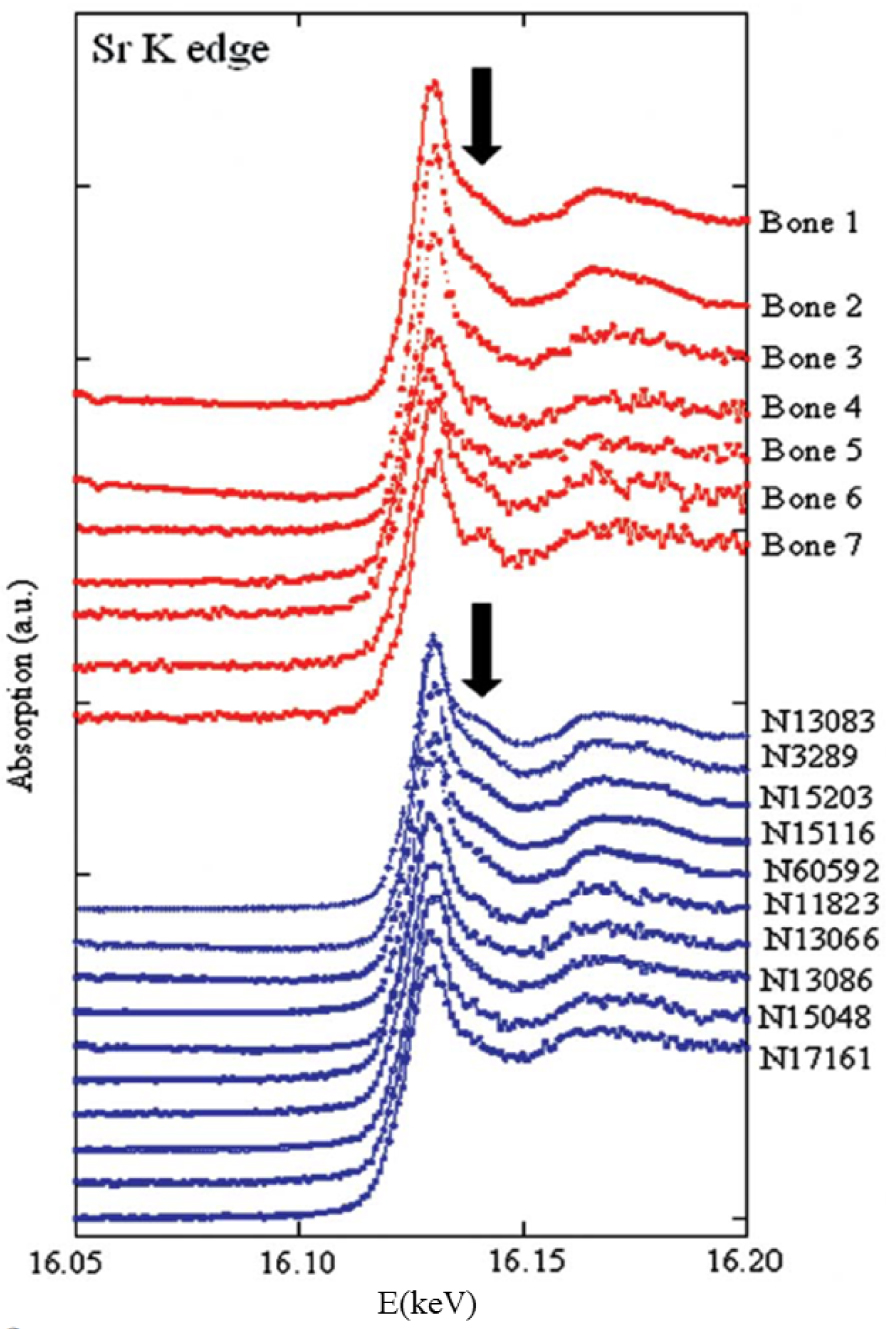
As a preliminary conclusion, XANES spectroscopy constitutes a powerful high sensitivity biomedical tool able to discriminate even closely related compounds such as calcium carbonate or calcium oxalate [128, 129, 130, 131], or to localize heterocations such Sr2+ in a calcium phosphate apatite matrix [132, 133, 134].
3. Experimental considerations
Proposals to use the synchrotron facility have to be submitted while proposal calls are open (usually twice a year). Feasibility and technical issues have to be addressed with the beamline scientists prior to the submission, to select the most appropriate beamline, to formulate the proposal optimally, to anticipate the experimental trajectory, define the number of samples and their preparation and observation conditions, the time needed for measurements (from a few seconds to one hour for one XANES spectrum depending on target substance concentration), and any safety considerations.
Indeed, samples may vary widely and may take the form of powders, tissues, biopsies etc. The preparation and measurement of any sample must preserve its integrity. The beamline scientists may propose various sample environments and measurement conditions to achieve this, for example, to prevent sample desiccation or beam damage. In this respect, cryo-cooling is increasingly being considered as an effective preparation technique.
Several synchrotron radiation facilities are equipped to perform XAS measurements (see for example experiments implemented on the European Synchrotron Radiation Facility (ESRF)) [135, 136]. The clinician has to select the most appropriate energy range and detection limit, according to the element to be probed, its concentration, the beam characteristics, and sample heterogeneity. The SOLEIL synchrotron can acquire XANES spectra on several beamlines. Some offer very fast acquisition capabilities (less than one second, compared to conventional XANES which usually takes several minutes) allowing phase transitions or chemical reactions to be followed using quick-EXAFS, as on ROCK (Rocking Optics for Chemical Kinetics) which operates between 4.5 and 40 keV [137], and ODE (Optique Dispersive EXAFS), using dispersive EXAFS which operates between 3.5 and 25 keV [138]. Up to now, most biomedical research has been based on XANES spectroscopy performed on the DiffAbs beamline [139], where experiments can be performed using a macro (300 μm) or micro beam size (10 × 10 μm2) and an energy range between 3 and 19 keV. The relevant experiments were performed at Ca [34, 140], Zn [127, 141], and Sr [126, 127] K-edges (at about 4.086 keV, 7.112 keV, 9.659 keV and 16.104 keV respectively). Such research can be extended by XANES measurements at lower energy. On the LUCIA beamline, (Figure 9), XRF as well as XAS experiments at micrometric scale can be performed with photon energy between 0.8 and 8 keV and a beam size ranging from 2 mm to 2 μm [142, 143]. LUCIA allows XAS experiments at the K edge of elements from Na to Fe, L edges from Ni to Gd, and M edges of rare earths and actinides. After training under the supervision of the beamline scientists, clinical teams can conduct experiments on their own.
LUCIA experimental set-up A. 1 Synchrotron beam entry, 2 Chamber containing the final focusing mirrors and 3 Sample chamber; B Interior of the experimental chamber containing, among other apparatus, a sample holder (1) and a fluorescence detector (2). The arrow indicates the incident beam direction.
4. Selected case studies
There are several investigations of physiological and pathological calcifications in the literature [144, 145, 146], three of which are described below. The first concerns metabolic disorders that can be studied by experiments at the K edge of metals (here, Fe) [69]. The second involves drugs developed for different purposes, namely cancer and infection, and characterizes the speciation of both light (C) and heavy (Ag and Pt) elements [147, 148]. The third shows how K-edge XANES (Zn) can provide valuable clinical information about patients developing skin reactions to tattooing.
4.1. The iron oxidation states in the substantia nigra
Iron is essential in many human tissues (around 4 g for 70 kg body mass) and its quantity in different locations is very important [149], explaining why numerous investigations, in breast [150], prostate [151, 152] and brain [153], have been published.
Brain metal homeostasis is altered in neurodegenerative diseases and the concentration, the localization and/or the chemical speciation of the elements can be modified relative to healthy individuals. These changes are often specific to the brain region affected by the neurodegenerative process. For example, iron concentration is increased in the substantia nigra (SN) of Parkinson’s disease patients, although the role of metal speciation modifications in the etiological processes is still not well understood.
To determine if modification of iron speciation is involved in Parkinson’s pathogenesis, Carmona et al. [69] have developed a methodology based on chemical element imaging and speciation, using correlative immunohistochemistry. Collecting μXRF images provided a quantitative distribution of metals in specific brain regions (Figures 10a and b). Micro- XANES defined the chemical speciation of iron in the region of interest. To produce accurate information about elemental changes in specific brain areas, these chemical imaging methods were correlated to brain tissue histology. Then, applying this methodology to the study of 6-hydroxydopamine (6-OHDA) lesioned rats (an animal model of Parkinson’s disease), they showed that iron and manganese distribution differs according to the brain region mapped, although it does not differ between lesioned and non-lesioned animals (Figure 11). Additionally, iron always occurs as ferritin without any distinction between lesioned or non-lesioned animals.
Representative μ-XRF distribution maps of Fe in the substantia nigra pars compacta (SNpc), appearing at the left side of the images, and substantia nigra pars reticulate (SNpr), right side of the images. (a) In the contralateral (ContraL) side of sham rat brain. (b) In the ContraL side of a 6-OHDA injured rat. x and y axis in μm; z axis in number of XRF counts (after Carmona et al. [69]).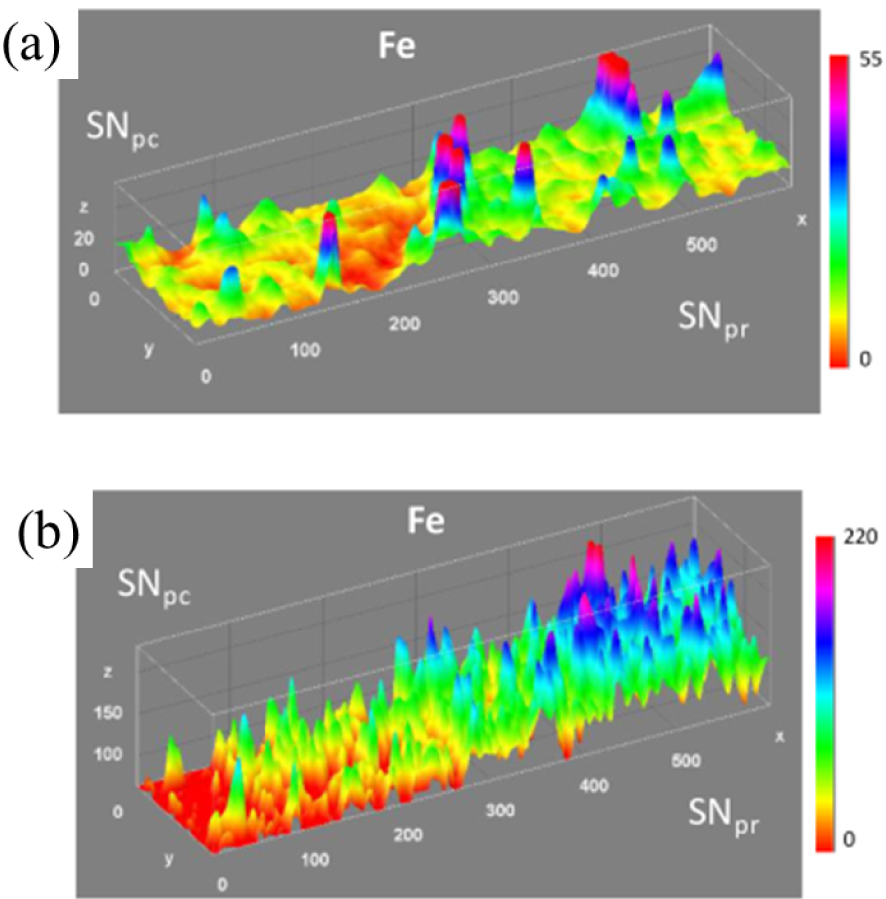
Fe K-edge XANES spectra for FeO, Fe2O3, ferritin standards and in the SNpc and SNpr for the ContraL and IpsiL brain sides of 6-OHDA injured and sham animals. All the measured spectra on brain samples show the same shape as ferritin standard (after Carmona et al. [69]).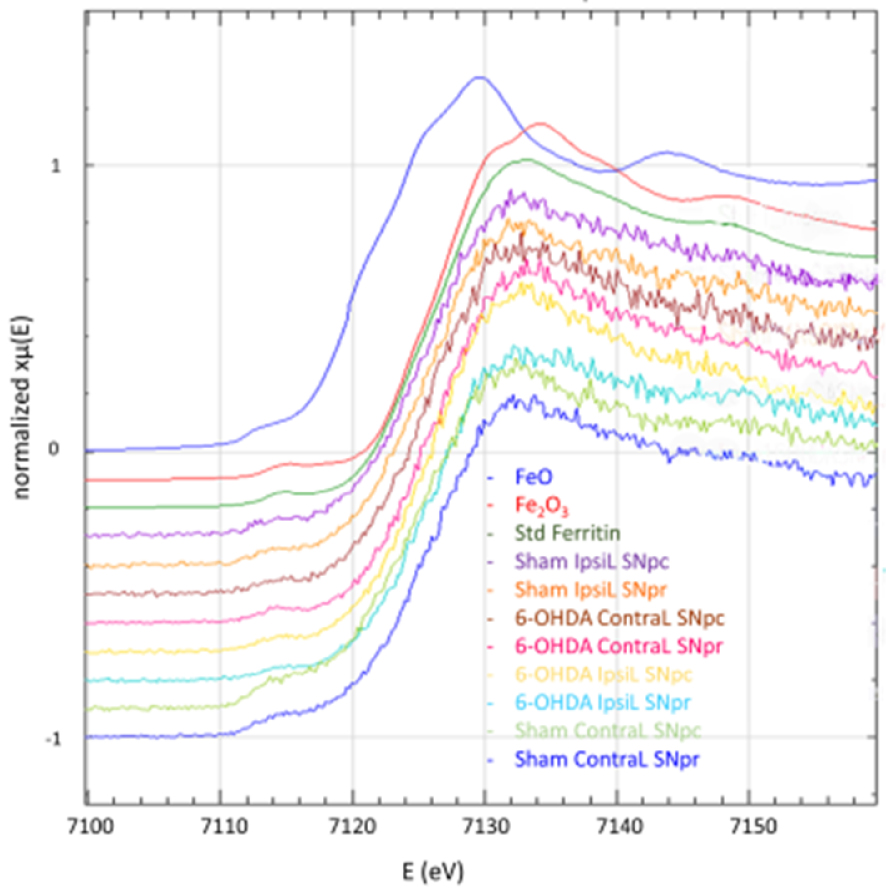
Therefore, this spatially resolved study shows that iron increase in the substancia nigra might not be involved in the neurodegenerative process induced by 6-OHDA. Furthermore, it illustrates the ability to correlate immunohistochemistry and chemical element imaging at the brain level. This methodology should in a near future be successfully applied to other studies of metal dyshomeostasis in neurology.
4.2. XANES investigations focusing on drugs
In the following section, we discuss three studies selected because they have been performed at the absorption edge of elements from light (C) to heavy (Ag and Pt), showing the large range of XANES capabilities.
Drug delivery is the method or process of administering a pharmaceutical compound to optimize a therapeutic effect in humans or animals [154]. It is very important clinically clinically to preserve the chemical integrity of the drug and to be sure that the drug is inside the carrier. We can define drug carriers as biocompatible tools for the transport of molecules for pharmaceutical, cosmetic, and nutraceutical applications [155]. Guo et al. [147, 148] highlighted that numerous pharmaceuticals including antibiotics [156], anticancer [157] and anti-inflammatory drugs [158] etc. have been successfully loaded into bioceramic drug carriers. The first case study [147, 148] relates to the incorporation of drugs in calcium silicate hydrate and is based on XANES collected at the C K-edge (Figure 12).
C K-edge XANES comparisons before and after the loading of IBU, ALN, and GS into CSH mesoporous microspheres. Feature “a” at 290.3 eV is for CO2 adsorption in CSH; “b” at 285.2 eV is the feature of aryl ring of IBU; “c” at 288.5 eV is the 1s–π∗ transition from carboxylic acid as in the case of IBU; “d” and “e” at around 289 eV are from C 1s–𝜎∗ (C–OH/C–NH2) of ALN and GS drug molecules, respectively (after Guo et al. [147, 148]).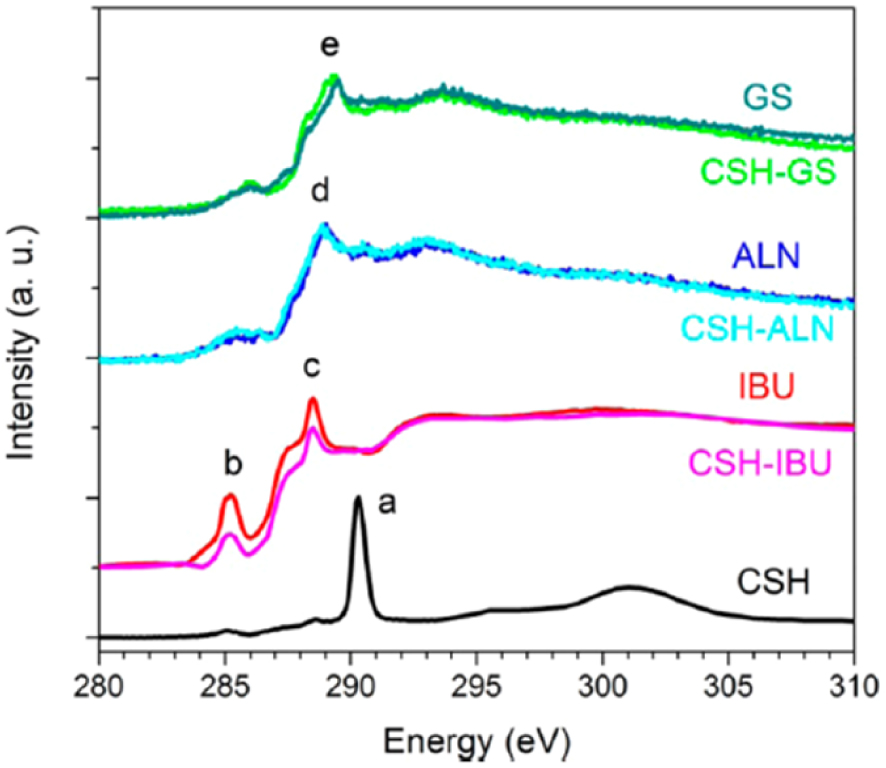
Guo et al. [147, 148] considered three drug molecules, ibuprofen (IBU), alendronate sodium (ALN) and gentamicin sulfate (GS) incorporated into mesoporous spheres of calcium silicate hydrate (CSH). These three drugs display specific XANES spectra at the C–K edge (Figure 12). Because it is possible to perform XANES experiments with high signal-to-noise ratio at the C K-edge even if the content of drug is low, this spectroscopy allows the clinician to ensure that the chemical state of the drug is preserved during incorporation into mesoporous CSH spheres Additionally, Transmission Electron Microscopy (TEM) images of CSH before/after drug loading indicated that the drug was incorporated in the carrier.
In the 2nd example, experiments were carried out at the Ag LIII (E = 3351 eV), S K (E = 2472 eV), and P K (E = 2145 eV) edges to study the interaction between silver ions used as antibacterial agents, and bacteria [158]. This approach reveals those chemical forms of silver which can interact with Staphylococcus aureus and Escherichia coli. The Ag LIII-edge XANES spectra of the bacteria are all slightly different and very different from the spectra of silver ions (silver nitrate and silver acetate) which confirms that an interaction has taken place (Figure 13). XANES thus offers the clinician a means of focusing on the interaction between Ag and bacteria at the atomic level, paving the way to optimize antibacterial agents containing Ag.
Silver LIII-edge XANES spectra of (a) silver nitrate solution (—), (b) silver acetate solution (—), (c) E. coli cells treated with silver nitrate (∙∙∙) and with silver acetate (– – –), and (d) Staphylococcus aureus cells treated with silver nitrate (∙∙∙) and with silver acetate (– – –), (e) Linear Combination Fit (LCF) of E. coli cells treated with silver nitrate (– – –) and the experimental results (—), and (f) LCF of S. aureus cells treated with silver nitrate (– – –) and the experimental results (—) (g) LCF of Listeria monocytogenes cells treated with silver nitrate (– – –) and the experimental results (—) (after Bovenkamp et al. [158]).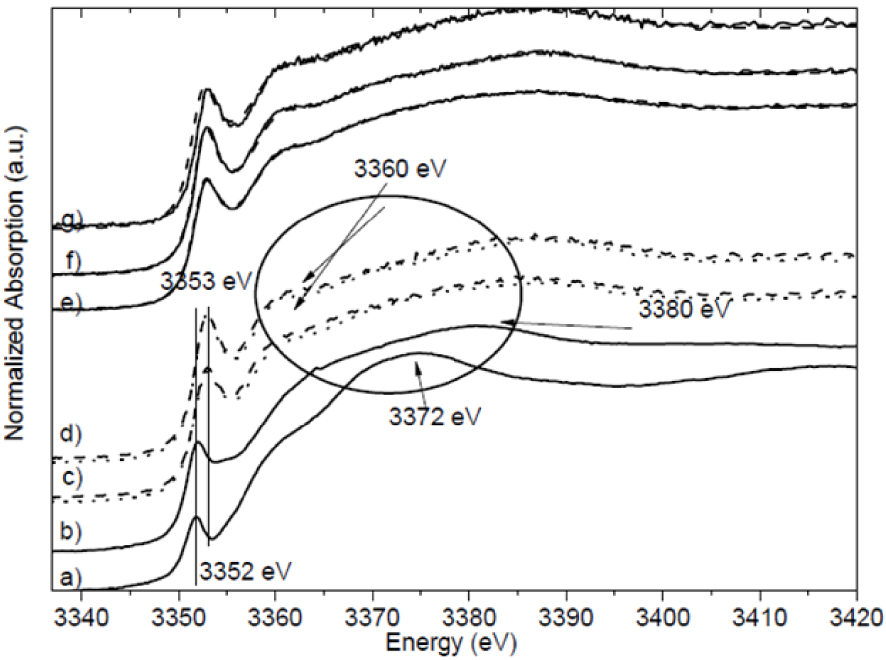
The final example considers platinum-based antitumor drugs [159, 160]. We have followed two stages in our clinical investigation [70, 71]. Firstly, we want to demonstrate that XRF data helps the clinician to understand the mechanisms of the nephrotoxicity which is a major limiting side effect [161] of these drugs. To this end, XRF measurements were performed on mice kidneys and on two kidney biopsies of patients treated with Pt-based anti-cancer drugs [70, 71]. To the best of our knowledge, it was the first time that Pt was detected in kidney biopsies. Note that in one clinical case, the Pt contribution to the XRF spectrum is observed even 6 days after the last oxaliplatin infusion.
Secondly, we wish to show that XANES provides the clinician with the possibility of characterising the interactions between antitumor Pt-based drugs and sulfur. Wang and Guo [162] have pointed out that endogenous sulfur-containing molecules such as cysteine, methionine, glutathione, metallothionein. and albumin, affect the metabolism of platinum drugs and degrade therapeutic efficacy. It is well known in heterogeneous catalysis that XANES can probe the co-ordination of sulfur by platinum [163], and determine the Pt electronic state even only present as a trace element [163, 164, 165, 166, 167, 168, 169, 170, 171]. Figure 14 shows the first XANES data collected at the LIII edge of Pt in a human biopsy. Even if such data have ultimately to be analyzed by numerical simulations to confirm S–Pt interactions, initial impressions of our complete mouse, and human biopsy, datasets seem to indicate an unchanged Pt environment.
XANES spectra collected at the Pt-LIII edge for mice treated with CisPt (red), for mice treated with CarboPt (blue), and of a patient treated with Erbitux, Cisplatin and 5-Flurouracil.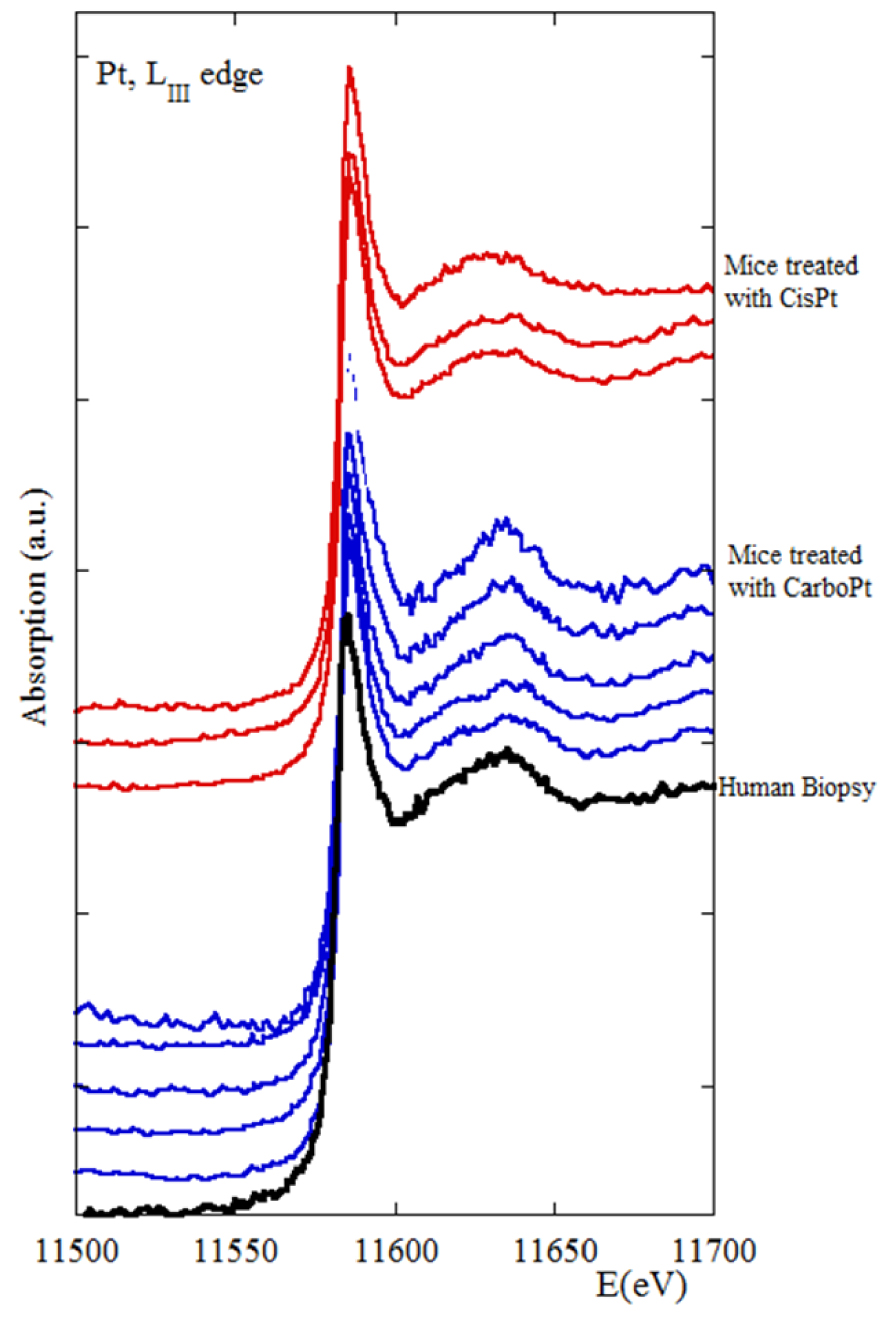
4.3. XANES investigation of tattoos
The facts that tattooing has become a pervasive social phenomenon [172] and that tattoo inks contain various potentially toxic organic and inorganic substances [173, 174] explain the significant increase of the prevalence of skin diseases related to tattoos. Among the metals which have been identified in skin tattoos, we focus here on Zn [175]. Quite recently, Vandebriel and De Jong [176] published a review on mammalian toxicity of ZnO nanoparticles based on published investigations between 2009 and 2011. These authors have reported that ZnO nanoparticles at most barely penetrate human skin, but they do affect skin cells in vitro. Short-term exposure results in apoptosis but not an inflammatory response, while long-term exposure shows increased reactive oxygen species generation, decreased mitochondrial activity, and the formation of tubular intercellular structures.
One of the challenges regarding the presence of Zn is discriminating between endogenous and exogenous origens. The Zn content of a 70 kg human body is around 2 g [177]. In dermatology, ZnO as well as TiO2 minerals are utilized in sunscreens as inorganic physical sun blockers, and as a white pigment in tattoos. In contrast to TiO2, Raman spectroscopy is not enough sensitive to the presence of ZnO [178], while XANES, performed at the Zn K edge, provides valuable information:
ZnO can adopt three crystal structures: Wurtzite, zinc blende and rocksalt [179]. Under ambient conditions, the thermodynamically stable phase is zincite which displays a wurtzite (hexagonal P63mc space group) structure, in which every zinc atom is tetrahedrally coordinated with four oxygen atoms [180]. We have thus regarded zincite as an appropriate reference compound for Zn in pigments.
Knowing the spatial distribution of Zn in the skin (Figure 15a) is necessary to define points of interest (POI) for probing Zn speciation. Such information is given by XRF mapping and we can see such spatial distribution of Zn on Figure 15. Comparing XANES spectra of the four POIs with that of zincite indicates the presence or absence of the pigment (Figure 15a). As we can see POI1 (1 on Figure 15b) and POI2 (2 on Figure 15b) indicate the presence of the ZnO (i.e. exogenous Zn) pigment while POI3 (3 on Figure 15b) and POI4 (4 on Figure 15b) indicate Zn2+ cations bound to metalloproteins (i.e. endogenous Zn) [181]. This information localises ink derived ZnO in the tissue quite precisely.
(a) Optical microscopy, identifying a skin cancer developed on a tattoo, Hematoxylin Eosin Saffron staining × 25. (b) Corresponding image of the spatial distribution of Zn obtained by μXRF spectroscopy in this skin cancer. Points of interest (POI) probed by Zn K-edge XANES are labelled 1 to 4. (c) XANES spectra collected at the Zn K edge for the different POIs, 1 to 4, of the skin cancer and for zincite (ZnO).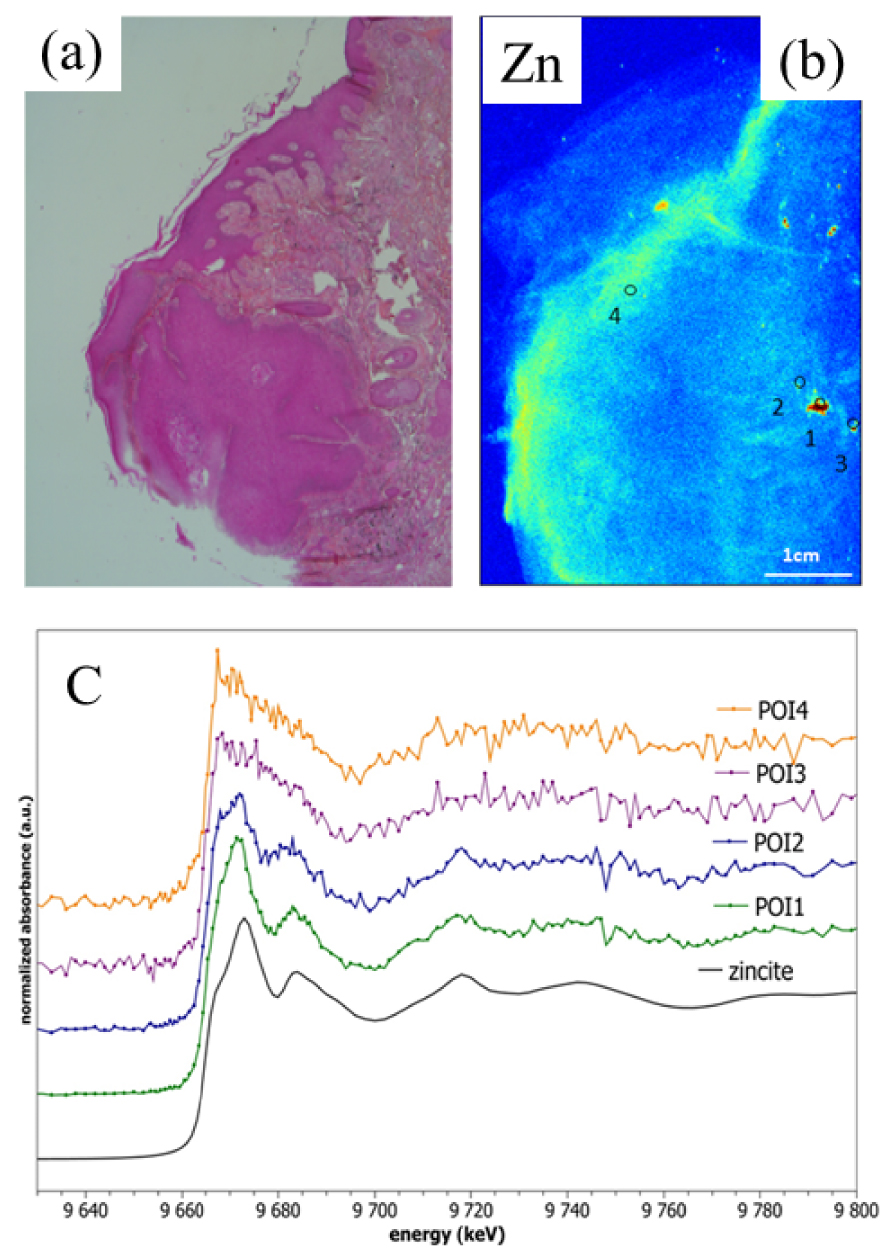
In a recent publication, we have combined XANES and Raman data to elucidate both the complex organic and inorganic chemical composition of tattoo inks in cases of keratoacanthoma. The common feature between the different clinical cases appears to be not the presence of zincite ZnO particles but the presence of a red azo pigment (PR170). Such result raises the question of the carcinogenicity of this substance which interestingly is not listed by the European Council as a carcinogenic azo-colorant [182].
5. Other techniques to probe biological roles of metals
This is a suitable point to consider the tools able to define the role of metals in biological systems to assist diagnosis and therapy. The complementarity, adaptations, and output of each modality must be considered for each scientific case. These considerations are exemplified by a comparison of XANES spectroscopy, Energy Loss Near Edge Structure (ELNES) and XPS, which are all able to define the atomic environment around a probed atom, yielding valuable chemical, structural, and co-ordination information.
A XANES and ELNES data are subsets of XAS and EELS (electron energy-loss spectroscopy) spectra. Briefly, ELNES has higher spatial resolution (around 1 nm compared to 100 nm for XANES) while XPS is more sensitive to surface properties. ELNES and XANES have a common theoretical basis in an electron transition from a core orbital to unoccupied states and follow an electron dipole transition rule [183, 184, 185, 186]. Thus, ELNES and XANES features provide information on the local coordination and chemical bonding of selected elements in the illuminated area [187]. Measurements of ELNES with a sufficient signal-to-noise ratio is limited up to about 1000 eV while XANES can be observed across all energies, effectively including almost all elements in the periodic table [188, 189, 190, 191] which creates a natural complementarity. Both ELNES and XANES data can be analyzed either by comparison with spectra of reference compounds, or by using theoretical tools [192, 193].
Major instrumental advances mean that ELNES can be used with success to investigate biomineral formation mechanisms [34, 35, 36, 37, 38, 39, 40]. Because ELNES uses electrons as a probe it must be an ultra-high vacuum technique. Using electrons as probes also means that the spatial resolution, generally governed by the diameter of the incident focused probe beam, is around one nanometre. Note that samples must be thin, i.e. <50–100 nm for such microanalysis.
Typical EELS spectrum acquired from a calcium phosphate concretion (Ca and P LII,III edges are visible). Carbon and nitrogen (K-edges) due to biological organic material are also detected, while U, and some C and N, arises from the preparation protocol (after Gay et al. [51]).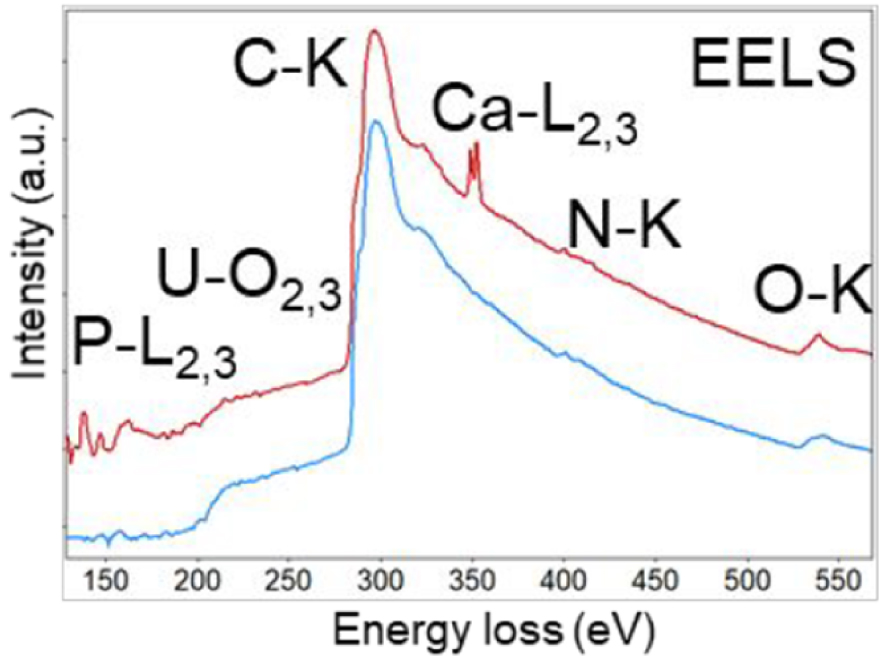
Smith and McCartney [194] point out that a typical ELNES spectrum contains a monotonically decreasing background and several broad superimposed peaks, each of which has an energy that is directly related to a particular inelastic scattering process. Figure 16 shows a typical spectrum from an investigation of Randall’s plaque [195], an ectopic calcification which forms at the tip of the kidney papilla [196, 197, 198]. The contribution of different elements within the sample (Ca, C, P, O, N), or arising from the preparation protocol, (P, U, C, Ca, N, O) are clearly visible.
Payne et al. [199] use such an approach to precisely identify the calcium phosphate compound in the biological sample (Figure 17). It is quite clear that a description of the structural characteristics of biominerals at the nanometre scale gives essential information concerning their formation mechanisms [200].
Energy Loss Function spectra of in-situ HAP clay, HAP, 𝛽-TCP, and modified clay. Peak A corresponds to the plasmon peak, and peaks B and B* correspond to the calcium M2,3 edge. The spectra are separated vertically for clarity and bars denote peak position (after Payne et al. [199]).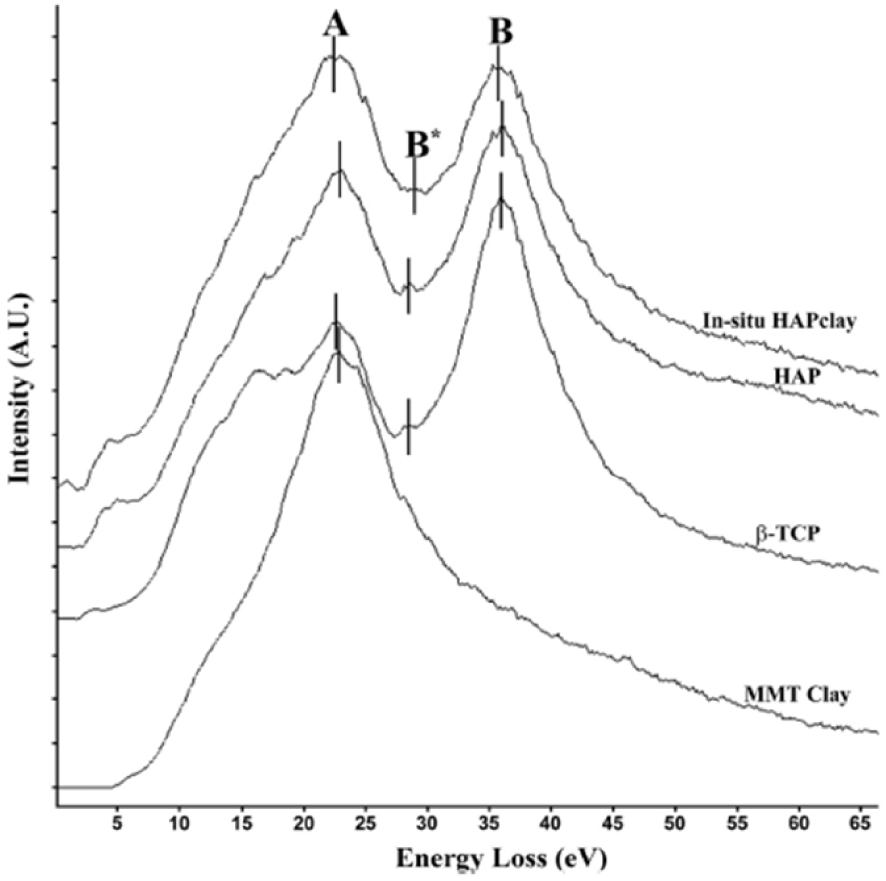
Even if structural information is less direct than from XANES analysis, XPS spectroscopy or electron spectroscopy can be valuable for chemical analysis. Like XANES, this spectroscopy uses photons as probes [201, 202]. It measures the kinetic energy of electrons emitted from the very top (1–10 nm) of any solid surface, giving information on the electronic states of the surface region [203]. Because XPS can detect all elements, except hydrogen and helium, by their photoelectron binding energies, it is possible to obtain a precise quantitative map of surface composition. XPS thus plays major role in identification and quantification of surface contaminants of biomaterials, which has long been recognized as a significant factor in predicting biocompatibility and rate of healing of implantable devices [204, 205, 206]. Also, significant recent developments in XPS allow hydrated samples to be studied, which is often essential to avoid cellular collapse [207].
Figure 18 shows a typical XPS spectrum in which it is possible to identify all the elements at the very top surface of the sample (see [208] for detection limits). Figure 19 shows that each oxidation state of Ti corresponds to a specific energy in the XPS spectra [209] which enables their discrimination (Bharti et al. [210]).
XPS spectrum of a titanium implant surface revealing its elementary composition at the surface (after Lach et al. [209].
XPS spectrum of a titanium implant surface. Information on the electronic state of Ti is available (after Lach et al. [209]).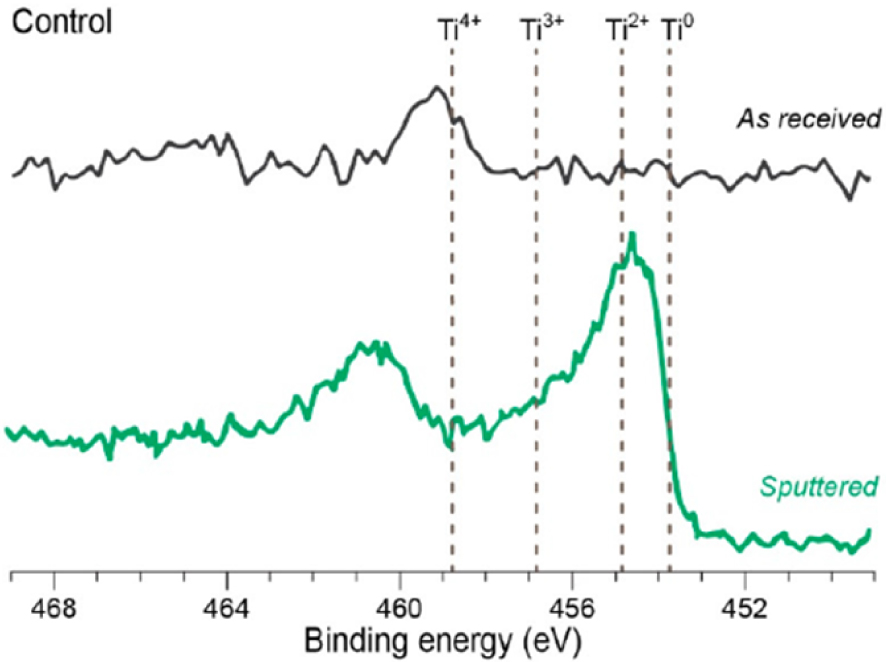
Finally, we would like to underline the complementarity between μFTIR [36, 37, 38, 39, 40, 41, 42] spectroscopy, considered the gold standard for chemical analysis of kidney stones, and XANES spectroscopy. Note that μFTIR spectroscopy informs on the major organic and mineral components of biological concretions, but not on trace elements. As we have described, XANES requires synchrotron facilities, so it is often convenient to characterize trace elements in the host laboratory by for example XRF (Figure 20).
μSpectroscopy approaches to assess the role of metal trace elements in a biological sample.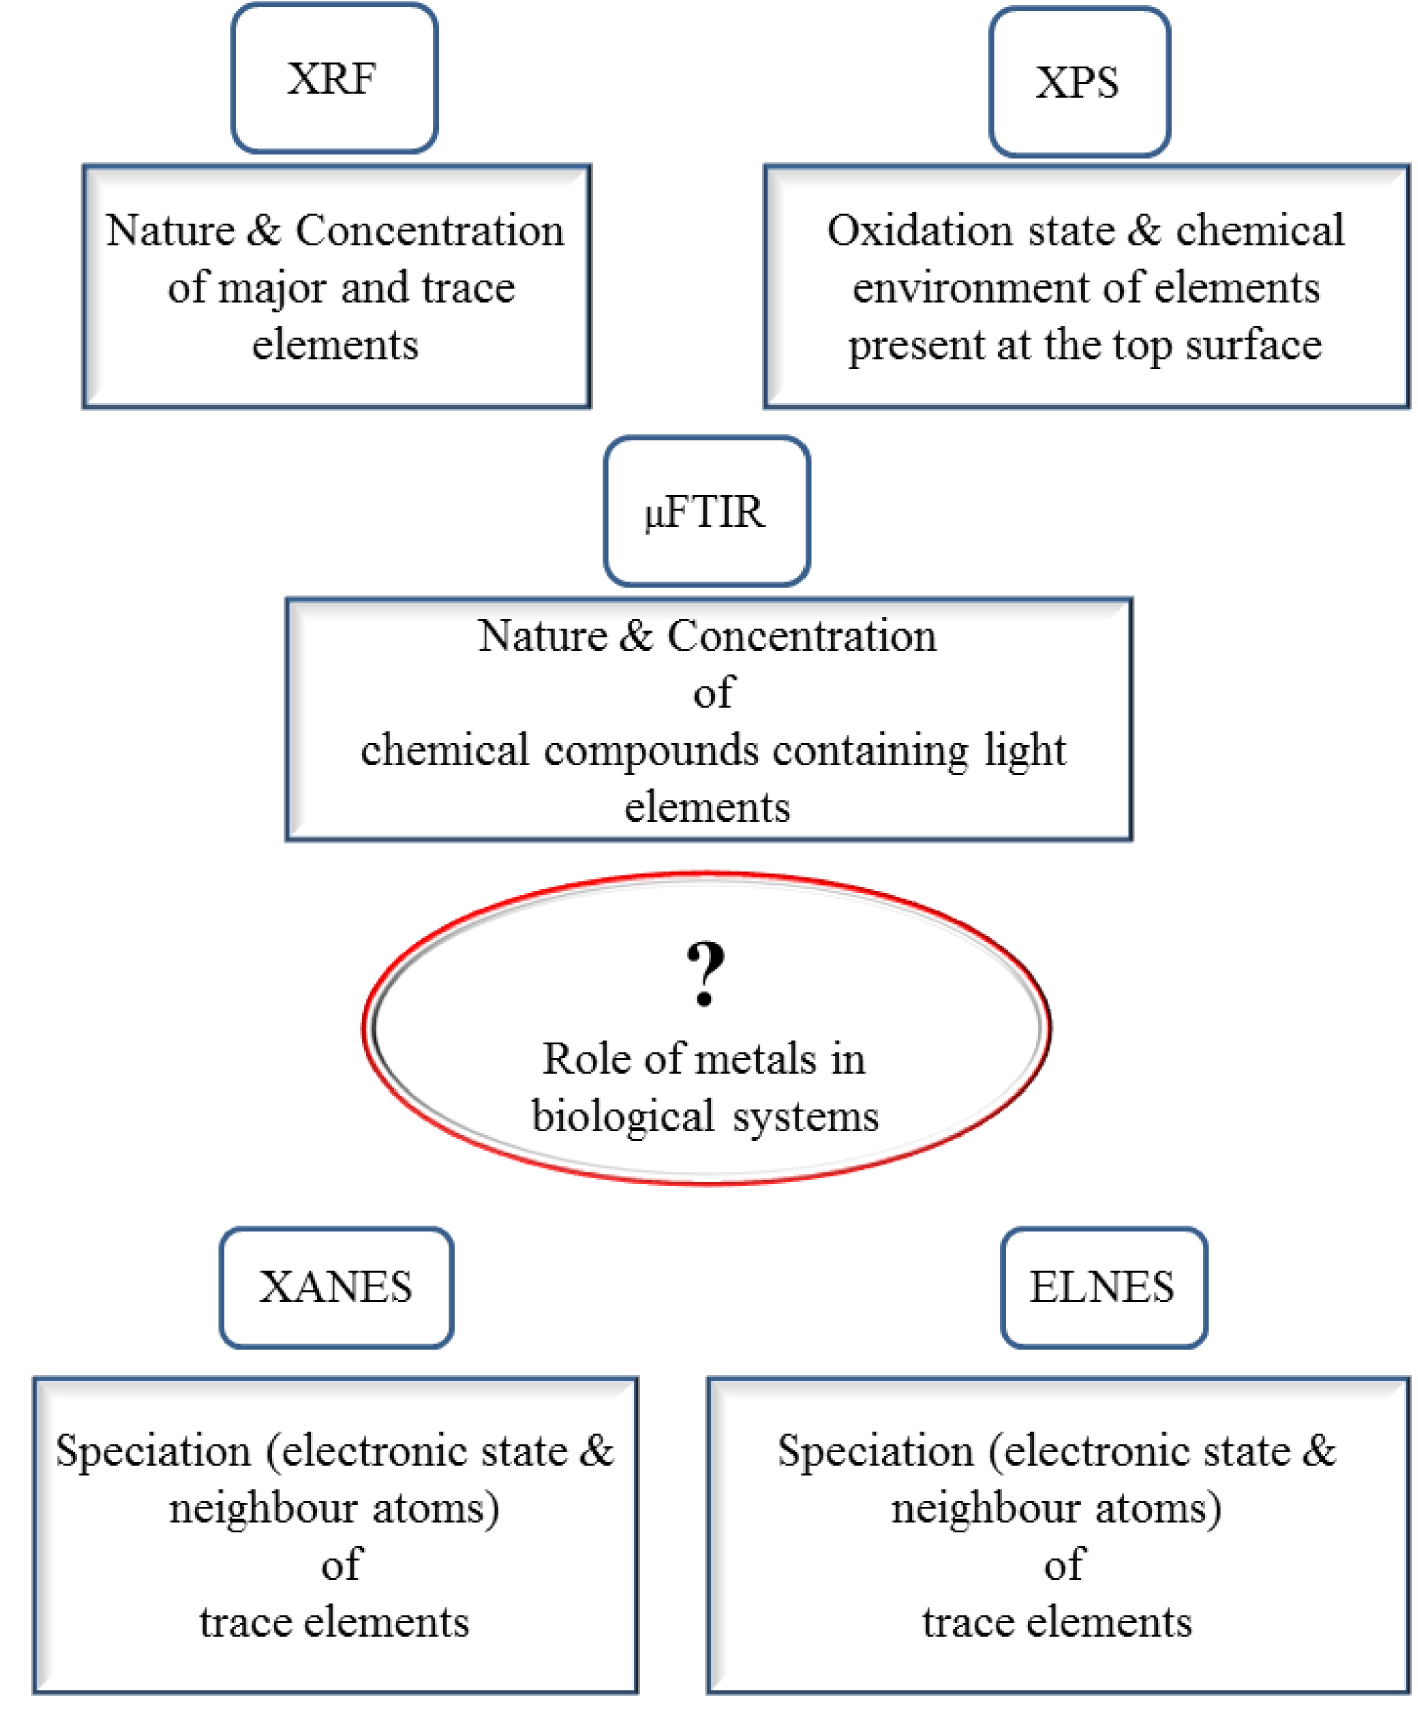
In fact, for completely unknown samples, X-ray fluorescence may be the first choice analytical technique, followed by vibrational spectroscopy such μFTIR or Raman to determine more detailed chemistry, while XANES can be applied to describe the electronic state as well as the first coordination sphere of trace elements selected by their edge absorption. As emphasized by Bohic et al. [211], such combinations of synchrotron-based X-ray and FTIR microspectroscopies are ideal for assessing the nature and role of trace elements in biology and medicine.
6. Conclusion
While XRF spectroscopy identifies only the elements present in a biological sample, the various publications we have selected in this contribution show clearly that XANES spectroscopy offers substantial information about the local structure of biological samples, including those without long range order such as single molecules, nanometre scale particles, or amorphous compounds. XANES spectroscopy thus offers opportunities to localise and assess the metabolism of metallodrugs such as Pt based anticancer molecules, to localise nanometer scale materials such as gold nanoparticles confined in mesoporous silica (proposed to improve prognosis), and to more precisely describe the structural characteristics of pathological calcifications.
Its subcellular spatial resolution as well as its capacity to operate at room temperature and pressure constitute major advantages for biomedical research meaning, for instance, that paraffin embedded biopsies can be interrogated without any further sample manipulation. In many investigations, such a capability to directly investigate biological samples in a near native state constitutes a major advantage relative to other techniques such as EELS or XPS which require very thin samples and therefore preparation procedures which may disrupt the physicochemical and structural integrity of any pathological calcifications within a tissue.
Acknowledgments
This work was supported by the Physics and Chemistry Institutes of CNRS and by contracts ANR-09-BLAN-0120-02, ANR-12-BS08-0022, ANR13JSV10010-01, convergence UPMC CVG1205, Labex Matisse, Labex Michem and CORDDIM-2013-COD130042. This work was partially funded via the CNRS-CEA “METSA” French network (FR CNRS 3507) and the EU grant No. 312483-ESTEEM2. The authors are grateful to the SOLEIL Synchrotron Facility for beam time allocation and would like to very much thank the support group of SOLEIL for their help during experiment.