


 CC-BY 4.0
1. Introduction
The accumulation of toxic compounds derived from human activities in the natural waters is unfortunately in a continuous expanding nowadays. Since the spread-out of different chemicals (dyes, medicines, pesticides) in the aqueous medium is practically impossible to avoid nowadays in the context of economic activities and health care, alternatives for advanced water cleaning are more than necessary [1, 2]. Adsorption on various solids dealing with the pollutants immobilization on different solid supports, is widely applied for the water cleaning. However, the pollutants removal problem is only half-solved, since the management of the solids after the process requires supplementary procedures to neutralize the fouled adsorbents. The conditioning of the natural materials to be transformed into performant adsorbents often use thermal procedures, acid and/or alkaline treatments, which makes less green in some extent the overall procedure. Together with the adsorption alternatives, the advanced oxidation processes (AOPs) are an interesting and promising procedure and challenging technologies for waste water treatment [3, 4, 5]. Therefore, the AOPs are sometimes preferred against the adsorption, provided in finding the best possible technical system at affordable costs.
The main oxidizing strategies typically involved in AOPs include the activation of the pollutants oxidation by using UV light and/or photocatalytic materials, ozone, hydrogen peroxide, and combinations thereof. It is generally accepted that the key species in the oxidation is the HO∙ radical, very active in promoting chain reactions, resulting in persistent organic pollutant (POP) molecules gradual oxidation up to mineralization to CO2 and H2O [6]. Sometimes, the effects of the fore-mentioned oxidizers are highly increased by using certain catalysts as iron ions (Fenton oxidation) of semiconducting oxides, able to capture the energy of UV and/or visible light and easy generate HO∙ radicals, even at ambient temperatures [7, 8, 9].
Crystal violet (CV) is a dye with triarylmethane structure (Scheme 1), widely used for health laboratory purpose as a stain for highlighting the Gram positive bacteria, as well in the formulations for fibers (silk, cotton, nylon) painting, as well as in the formula of coloring waxes, plastics, fat, gasoline and printing inks in violet.
The Crystal Violet dye structure.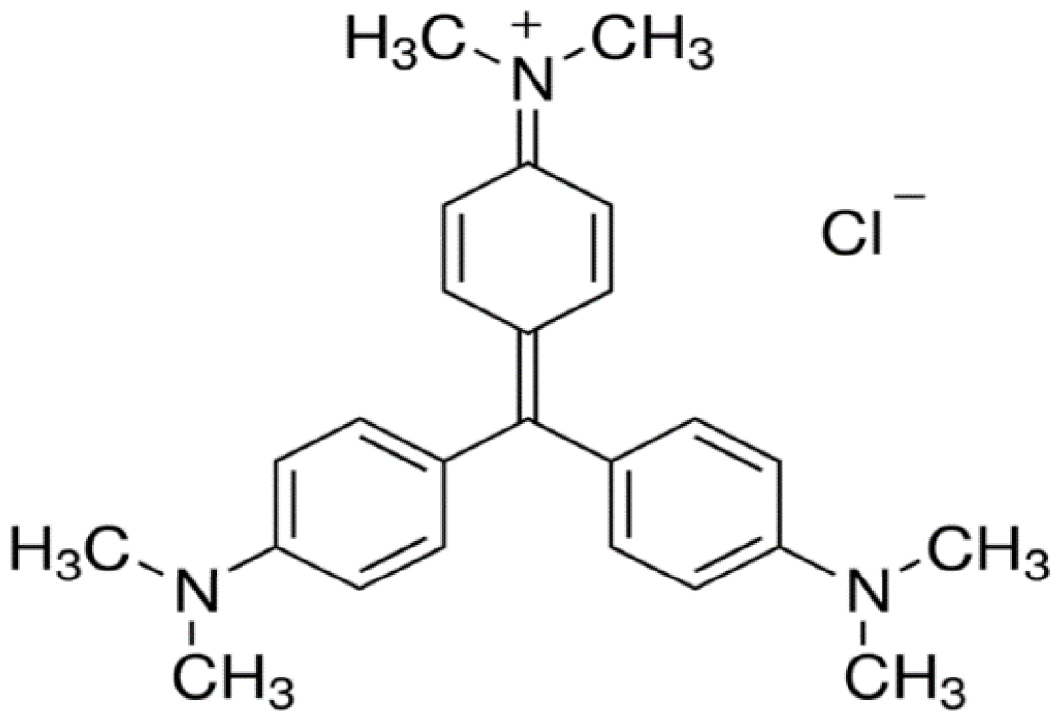
The dye has antibacterial, antifungal and vermicide properties and used to be included in formulations as external use antiseptic. However, more recent studies warn about CV toxicity, therefore concern should be raised about its large-scale use. It is reported to cause eye irritation and injury, act as highly toxic to mammalian cells, cause skin and digestive tract irritation [10]. The kidney failure is another health concern. If present even in low amounts in waters, CV was notified as an eel fish contaminant [11].
The multiple water contamination sources and the high stability of CV has drawn the researchers’ interest in finding possibilities for its advanced removal from wastewater. Many papers deal with CV capture by adsorption on very diverse materials, most of them being vegetal waste resulted from the processing of coconut, rice, coffee beans and other materials, further processed to become performant as adsorbents [12, 13, 14, 15, 16, 17].
The use of AOP methods for the total elimination of CV from wastewater had been widely studied: many papers communicate the use of photocatalytic active solids working in the presence of UV or visible light to degrade or even better, mineralize the dye. As in other photocatalytic reactions, titanium dioxide-based solids proved to be effective in the CV removal from diluted aqueous solutions [18, 19, 20, 21]. Senthilkumaar and Porkodi [22] investigated the CV photodegradation using an open reactor equipped with a 125 W lamp, by using P-25 and titania prepared by the sol-gel method. The removal yield of CV was reported to be 100% after 6 hours of irradiation on P-25 and only 30 min on the sample prepared by sol-gel technique. They also confirmed the validity of Langmuir-Hinshelwood kinetic model for the dye degradation. Ju et al. [23] used P-25 irradiated with microwave-powered electrodeless discharge lamps to degrade CV and investigated the detailed reaction pathway, by using LC–MS analysis. They concluded that the de-methylation at the amino groups was followed by adduct reactions, loss of benzene rings and ring-opening reactions. Between the intermediate products, phenol, aniline, o-nitrophenol, methyl-terephtalate, ethyl-terephtalate, benzophenone derivatives were confirmed; this could explain the toxicity of the intermediate solutions derived from the CV photocatalytic degradation.
The process is highly favored when hydrogen peroxide is added in the reaction medium. Diesen and Jonsson [24] prove that hydrogen peroxide is an advantageous species in the photocatalytic oxidation medium. Under the irradiation of the semiconductive photocatalyst and under no addition of hydrogen peroxide, some of the HO∙ radicals resulted from the water split in the presence of the hole resulted after the electron promotion from the valence band to the conduction band of the solid, will unite to each other and form H2O2. In turn, hydrogen peroxide delivered in the reaction medium adsorbed on the photocatalyst surface acts as a rich source of HO∙ radicals, active in the oxidation. Hirakawa et al. investigated the mechanism of ethanol oxidation in a photocatalytic system based on TiO2 in a hydrogen peroxide added medium [25, 26]. They found interesting correlations between the dissolved oxygen concentration, hydrogen peroxide concentration and the production of oxidized products from ethanol (acetaldehyde and formaldehyde), as well as on the mineralization yield. Also, the reaction mechanism seems to shift to some extent if the organic matter is present in low or in high concentrations. Other works also prove the enhancement of the overall reaction yield when hydrogen peroxide is used in photocatalytic systems together with the photocatalyst solid in the degradation of amoxicillin [27] or of methylene blue [28]. Comprehensive reviews can also be found in literature in this respect [29, 30, 31]. The biodegradability assessment in the treated waters is an important pole in the appreciation of the advanced cleaning performance. A relatively simple probe is possible by employing the Vibrio fischeri microorganism. Its use is a standardized toxicity test (ISO 11348) to determine the inhibitory effect of water samples. The name of test procedure is Microtox® and despite it is not a real standard toxicity test, it is a good first approach of toxicity of chemical compounds, being fast, simple and quite cheap [32]. The test is useful in the investigation of the efficiency of the photocatalytic abatement of toxic organic matter from water, if the initial molecule is fragmented, but not mineralized. Obviously, it is very important to check the overall toxicity of the treated water after the photocatalytic transformation.
In the present work, the CV degradation by photocatalysis was performed using two commercial titanium dioxide samples, largely available, P-25 and Kronos 7000. A parametric study concerning the influence of the dye concentration and photocatalyst dose revealed that P-25 was from far superior to Kronos 7000. On this photocatalyst, the influence of the reaction batch pH was studied. Since the performance of the photocatalysts were not enough high for a potential practical application, hydrogen peroxide was added in the reaction medium in doses of 15–200 ppm. The degradation yields after 90 min of photocatalytic reaction were over 90% for all the experiments performed in the presence of P-25. The addition of 100 ppm H2O2 shortened almost two times the time needed to reach the same (87%) mineralization extent. If time durations of more than 150 min are employed, the photocatalytic removal expressed by TOC measurements was also high, even without added hydrogen peroxide. Toxicity measurements after selected experiments were performed by using the bioluminescence ecotoxicity test, using Vibrio fischeri. The primary CV fragmentation led to a toxic medium: even if the CV conversion was 87%, the inhibition was practically the same with that of the initial dye.
2. Experimental part
2.1. Materials
P-25 (Degussa) and Kronos 7000 were used as photoactive solids. P-25 is the most extensively used titania-based photocatalyst, consisting of 70% anatase and 30% rutile. It has the band gap value of 3.2 eV, therefore it could be used in both UV exposure and visible (solar) light. Kronos 7000 contains about 87% anatase and has a specific surface area over 200 m2⋅g−1. The Crystal Violet dye of analytical purity was delivered by Sigma-Aldrich, hydrogen peroxide (30% in water) was a Chemical Company (Iasi, Romania) product. Distilled water was used for all preparations. Stock solutions of 150 ppm CV were prepared by dissolving the due mass of solid dye in a volumetric flask of 250 mL. The working solutions were obtained by applying the due dilution factor to the stock solution.
2.2. Photocatalytic reaction setup
The photocatalytic experiments were performed in a tubular glass reactor covered with a lid, with a working volume of 250 mL and functioning under internal UV light irradiation. The light was generated by an Osram UV-A lamp of 9W (wavelength range 350–400 nm, maximum at 370 nm), connected to a AC source, placed in a quartz cylinder inserted in the center of the photoreactor. The agitation was made by using a magnetic stirrer. The zero timing was the moment of the UV lamp switch on. Prior to the photocatalytic experiment, the photocatalyst powder was stirred for 30 min in dye solution in the dark, to reach the adsorption–desorption equilibrium; this duration was marked as −30 min on the graphs. The pH values chose for several experiments occurring at other values but the native dye solutions (5.2) were settled by using H2SO4 (2 N) for acidulation and NaOH (0.5 N) for alkalinizing. The experimental setup used for the photocatalytic degradation is shown in Figure 1.
At the purposed time values comprised between 0–300 min, samples were collected from the reactor, filtered through 0.45 μm pore size syringe filter and the dye measured.
Experimental setup used in the photocatalytic CV degradation 1: glass reactor; 2: lid; 3: UV lamp; 4: electric power supply; 5: quartz tube; 6: magnetic stirrer.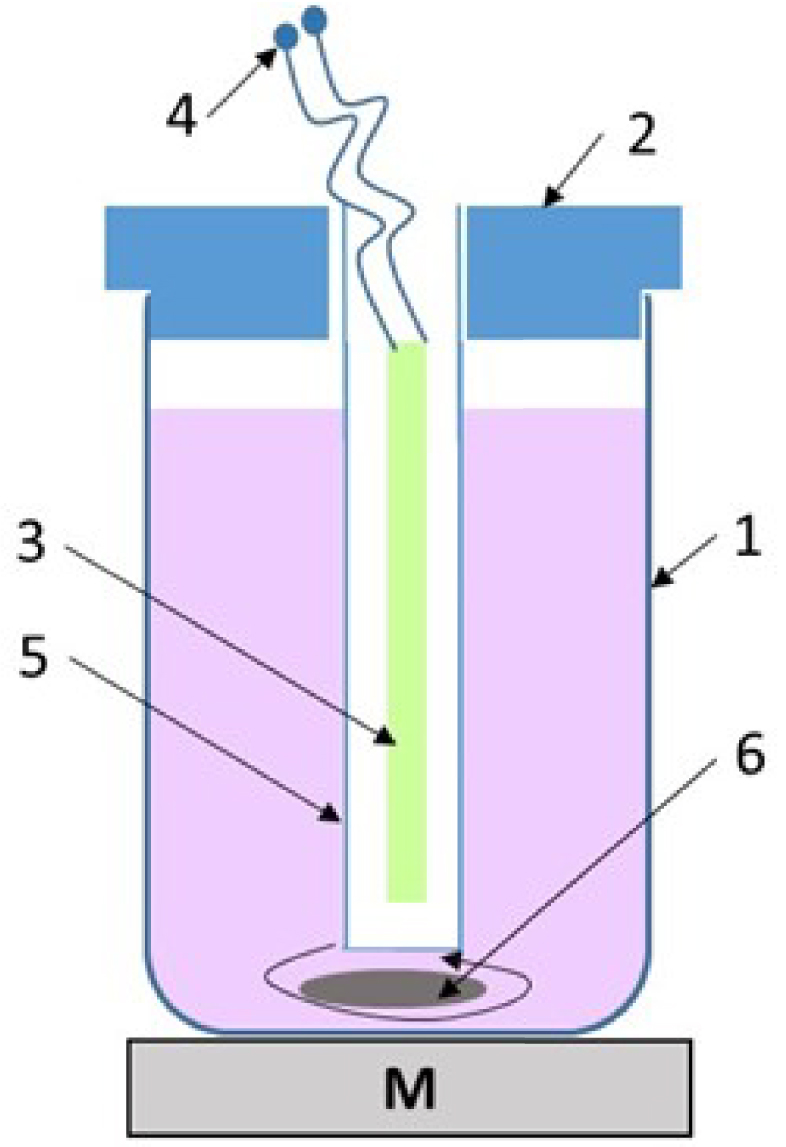
2.3. Measurement of the reaction advancement
The reaction mass after the photocatalytic reaction was analyzed by UV–Vis spectroscopy, TOC analysis and ion chromatography. The spectrophotometric analysis in the visible spectrum range was performed on a Shimadzu 2401PC spectrophotometer, by measuring the changes of the absorbance at the specific wavelength (590 nm) of CV and data conversion in dye concentration, through a calibration curve (R2 = 0.9991), based on Lambert–Beer law. The rate of the photocatalytic degradation was also calculated using the following relation:
| (1) |
The pH values of the dye solutions were measured with a Mettler Toledo pH—meter.
The measurement of the overall organic matter from the solutions was made by evaluating the dissolved organic carbon content on a TOC (Total Organic Carbon) analyzer (Shimandzu VCSH 5000). The degradation extent in terms of TOC was calculated using the similar relation:
| (2) |
The detection of the released ions during the photocatalytic degradation was made by ion chromatography. A Shimadzu system consisting of a LC-10 AD pump, a CDD-6A conductometric detector (0.25 μL flow-cell) and a CTO-10A column oven were used. The cations were separated on an Alltech Universal Cation column (100 mm × 4.6 mm) preceded by a guard column (7.5 mm × 4.6 mm) of the same material using 3 mM methanesulfonic acid, at a 1.5 mL⋅min−1 constant flow. The anions were separated on an Alltech Allsep Anion column (100 mm × 4.6 mm) preceded by a guard column (7.5 mm × 4.6 mm) of the same material using a phthalic acid and lithium hydroxide mixture of 4 mM (pH 4.00) at 1.5 mL⋅min−1 constant flow. The column and conductivity cell temperatures were held constant at 35 °C and 38 °C, respectively. The mobile phases were degassed with helium stream before IC analyses. The calibration curves (0.01–10 mg⋅L−1) were performed for each ion. The method detection limits were 0.03 mg⋅L−1 for and 0.003 mg⋅L−1 for .
For toxicity assessing of the water containing partially degraded CV was made by using the Microtox® test using Vibrio fisheri microscopic species. The test consisted in measuring the bioluminescence inhibition of the microorganism. The light production is proportional with the metabolic activity of the bacterial population and implicitly, the inhibition caused by the pollutants from water decreases the bioluminescence. The test was performed in a medium containing 2% w/v NaCl solution (pH values comprised between 6.5–8.5). The evaluation was made in a Microtox Model 500 Analyzer (Azur Environmental). Freeze-dried bacteria, reconstitution solution, diluter (2% w/v NaCl) and adjustment solution (non-toxic 22% w/v NaCl) were obtained from Azur. The luminescence was recorded after 15 min of incubation and its inhibition was compared with that of a toxic-free control sample, by expressing as the percent of inhibition, calculated following the specific protocol by applying the Microtox calculation software.
3. Results and discussions
The CV dye stability upon exposure to UV irradiation and the extent of removal by adsorption onto the photocatalyst surface were evaluated by performing “blank” experiments. In this respect, when a 15 ppm CV solution was exposed for 90 min to UV light, the removal yield was of 4.7%. When the solid was contacted with CV solution of 10 ppm of dye, during the settlement of the adsorption–desorption equilibrium (90 min) at a solid dose of 1 g⋅L−1, 6% of the CV has been removed from the solution.
3.1. Influence of the initial dye concentration
The CV concentration range used for the tests showing its influence on the photocatalysts performance was between 2.5 to 15 ppm. The wide concentrations range was used to allow investigating better the effects of the adsorption and saturation of the solid with dye in the adsorptive process, in balance with the overall removal yield, by the subsequent photocatalytic decomposition. For the species having high light absorption capacity, the maximum limits of concentration taken in the tests must be established such to allow enough UV light to reach the photocatalyst surface, in order to activate the photocatalyst. As stated in the exposure of the general photocatalysis mechanism, the photons emitted by the light source promote the migration of some electrons from the valence band to the conduction band, generating an electron–hole pair. If these electrical charges remain separated for an enough long duration, they will interact with the water and the dissolved oxygen from the reaction medium generating radical particles (HO∙ being the most numerous and active), which promote the oxidation reactions of the organic species readily adsorbed on the photocatalyst surface. Moreover, the dye layer adsorbed on the photocatalyst surface must remain enough thin to be permissive for the radiation to reach the active photoactive sites [4, 6].
Influence of the dye concentration on the photocatalytic conversion of CV on (a) P-25, (b) Kronos 7000 (0.1 g⋅L−1 photocatalyst dose, UV irradiation).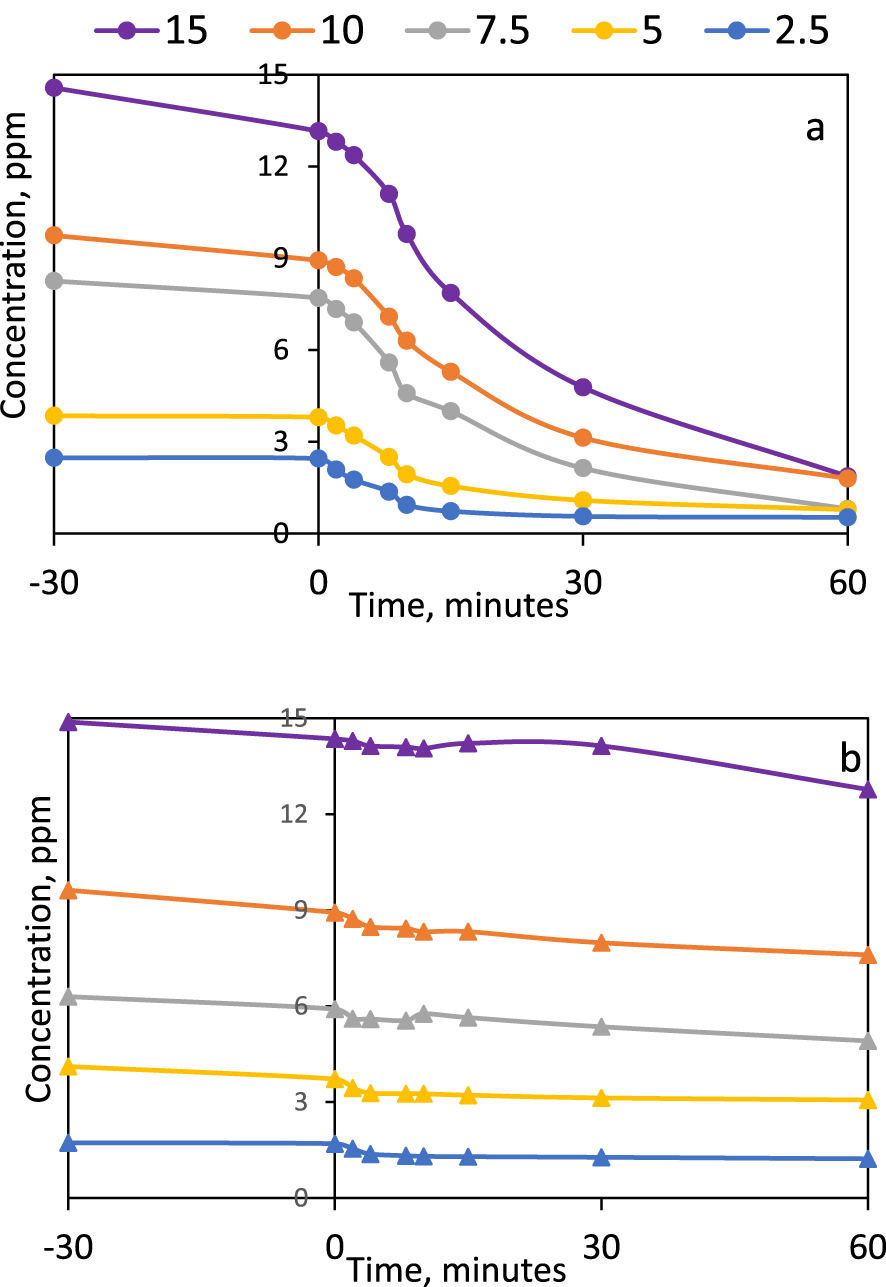
The comparison between the two commercial titanium dioxide samples (Figure 2) reveals a much better behavior of P-25 than Kronos 7000, despite the fact that the specific surface area (i.e., adsorption potential) is much higher for the second solid. It was interesting to notice that in the case of P-25, the adsorption yields at different initial concentration values during the settlement of the adsorption–desorption equilibrium were significantly higher for the 15 ppm solution (about 9.5%) and that they decreased for each lower concentration of the initial dye solution, reaching only 1% for the initially 2.5 ppm solution.
This behavior is due to the low interaction forces between the dye and the adsorption sites and seems to be rather promoted by the larger amounts of molecules available for the adsorption. When a high number of dye molecules are anchored on the photocatalyst surface, they also suffer quite high extents of photocatalytic degradation. After 60 min of UV exposure, about 87% from the dye was decolorized from the 15 ppm initial solution. The highest yield in this respect, 90.3%, was obtained at the initial solution of 7.5 ppm. It seems that at this concentration value, there is the best fit between the rates of dye delivery to the adsorption sites by diffusion, the adsorption on the solid and the photocatalytic reaction. This behavior is different from results obtained in similar systems, but using other organic species [29, 31, 33], suggesting that the large availability of dye (higher concentrations of the initial solutions), were beneficial on the overall dye removal efficiency. In the case of Kronos 7000 use, neither adsorption or photocatalytic reactions gave encouraging results. The yields in dye removal were situated between 14% (at initial dye concentration of 15 ppm) and 29% (at initial dye concentration of 2.5 ppm).
3.2. Influence of the photocatalyst dose
The very different texture of the two photocatalytic solids motivated us to explore their performance at different doses. The employed dose values were: 0.1; 0.25; 0.5; 0.75 and 1 g/L for P-25. Two additional levels, 1.5 and 2 g⋅L−1, were employed for Kronos 7000. The decolorization yields at time zero (dye immobilization from the measured liquid by adsorption) as well as 30 and 60 min under irradiation are gathered in Figure 3.
Influence of the photocatalyst dose on the CV degradation (P-25 and Kronos 7000; the numbers indicate the irradiation time duration in minutes).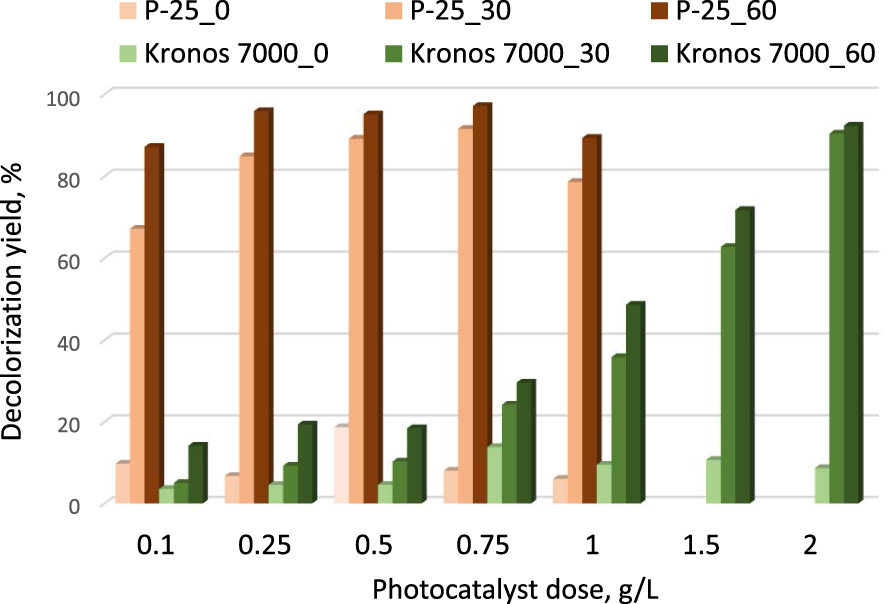
Strong differences could be noticed again between P-25 and Kronos 7000, despite the chemical composition and crystallographic similarities between the solids. The optimal dose when P-25 was situated between 0.5–0.75 g/L. While the weaker effect of the solids used in low doses could be associated to the small number of photocatalytic sites available on the solid surface, the decrease of the photocatalytic degradation efficiency at higher doses is related to the UV light dispersion due to the high number of particles in suspension in the medium, and consequently, to the decrease of the number of particles reached by the UV irradiation. On the contrary, the photocatalytic action of Kronos 7000 continuously increases with the dose, indicating that the particles have different sizes and do not hinder the light penetration through the suspension, on one part, and that the number of sites which could be activated by the UV light is quite low in comparison with the case of P-25, on another part.
The clear superiority of P-25 solid in comparison with Kronos could be assessed to its better avoidance of the electron–hole recombination. This fact is due to both anatase to rutile ratio and to the co-crystallization of the two phases. When the two phases are closely packed, the electrons and holes of a phase can migrate to the other phase and thus, the recombination is bypassed. Mi and Weng [34] applied the transient infrared absorption–excitation energy scanning spectra (TIRA-ESS) technique to determine the alignment of the gap energy levels for anatase and rutile nanoparticles and concluded that an important contribution in enhancing the charge separation is ensured by the migration of the hole from anatase to the hole level of rutile. Favier et al. [33] also proved the superiority of P-25 in comparison with Kronos in the degradation of clofibric acid in a similar testing setup.
Inhibition of Vibrio fisheri growth after 15 min exposure to the reaction mass after different durations of photocatalytic reaction (initial CV: 15 ppm, photocatalyst dose 0.1 g⋅L−1).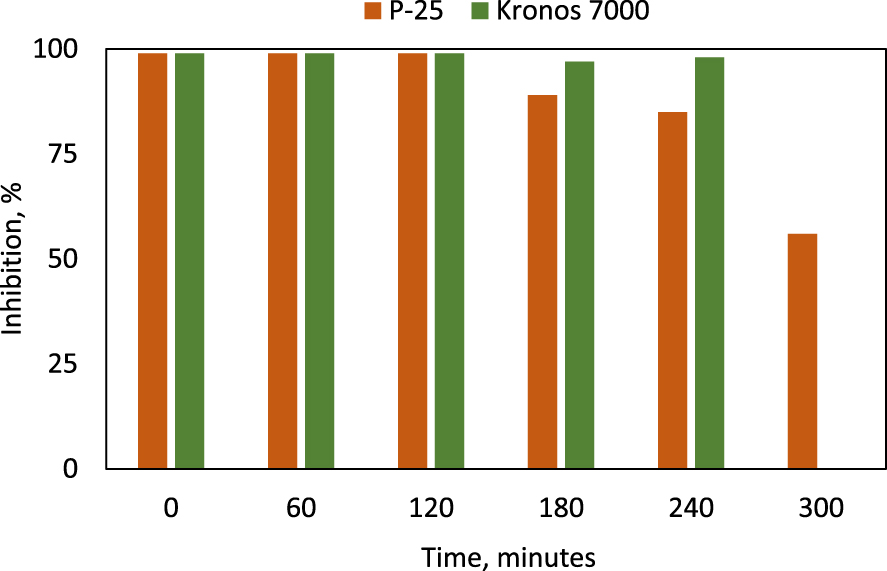
3.3. Toxicity assessments
The high decolorization yield (87.12%) obtained after 60 min for the CV highest concentration (15 ppm) at a dose as low as 0.1 g/L P-25, motivated us to test if the toxicity of the system decreases in the meantime with color disappearance. For the sake of comparison, the toxicity was also investigated for the Kronos 7000 photocatalyst, at a dose of 1 g/L (about 50% decolorization). In this respect, tests using the Vibrio fisheri gram-negative bacterium were performed on dye solutions after running the photocatalytic reaction for time durations up to 300 min. The results are displayed in Figure 4. The toxicity was expressed as the percent of bacteria Vibrio Fisheri growth inhibition after 15 min of incubation. The toxicity profile of the irradiated mixtures showed that the toxicity is relatively constant: 99% for a quite long photocatalytic exposure (120 min for P-25 and 240 min for Kronos 7000), indicating that the CV fragmentation did not contribute to a significant decrease the reaction mass toxicity. Only after 300 min of photocatalytic run on P-25, the Vibrio Fisheri growth inhibition decreased to 56%. These results motivated us to run a wider parametric study, in order to find more proper reaction conditions to mineralize the organic matter to a higher degree, and thus reduce the toxicity.
An explanation of this behavior is delivered by the composition analysis of the intermediate stages of photocatalytic treatment. According to Ju et al. [23], several products resulted from the initial stages of photodegradation are quite toxic. For photocatalytic exposure times longer than 180 min, the products formed on P-25 are gradually mineralized (as shown in detail in Section 3.6) and in consequence, the toxicity level also drops. Since this process is rather slow, a different strategy (addition of H2O2) was applied to improve the efficiency of the total removal of organic matter.
3.4. Influence of pH in the photocatalytic degradation process
In the perspective of a practical application of a photocatalytic process, the performance of the process under a certain pH range is interesting to investigate: the real polluted waters could have different acid-base character. For this parametric study, the experiments were carried out at four pH values: 3, 5.2 (natural pH of the dye), 7 and 10. An initial dye concentration of 15 ppm and a dose of 0.1 g/L P-25 were used in the experiments. The concentration ratios between the initial value and that at time t over the reaction is displayed in Figure 5.
Dye degradation at different pH values (0.1 g⋅L−1 TiO2-P25, 15 ppm of CV).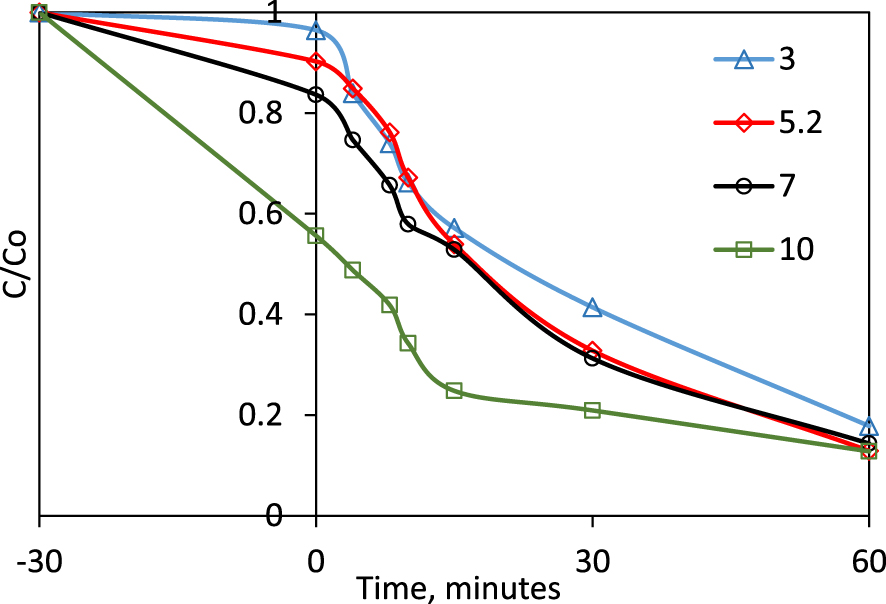
The behavior of the dye removal from aqueous solutions strongly depends on the pH value. The dye structure contains three amine groups, one being in ammonium form salt at the natural pH, pairing with a chlorine ion. In acid medium, the two amine groups will also be transformed in quaternary ammonium salts, while in alkaline medium, all three nitrogen atoms are in the form of free amine groups. TiO2 records the zero charge point in solution pH 6.8 [22, 35]. At higher pH values, the negative charge at the surface of TiO2 increases and the TiO2 surface in alkaline medium favors the amine adsorption on its surface. This behavior was also noticed by Kusic et al. [32] and Favier et al. [33]. It explains the strong CV removal during the adsorption–desorption equilibrium settlement: almost 45% of the initial amount during the period of contact in the dark between the solid and the solution. However, after the UV light exposure for 60 min, the degradation yields are essentially the same for all conditions, between 82% at pH = 3 and 87% at pH = 10.
3.5. Contribution of H2O2 in promoting the photocatalytic degradation
The formation of the electron–hole pair in the semiconductive photocatalysts due to the energy delivery by the photons emitted by the light and their interaction with water leads to the formation of certain amounts of hydrogen peroxide in the reaction mass, as proven by Diesen and Jonsson [20]. They claim after a detailed study that H2O2 is a key species in the photocatalytic reactions. Moreover, the increase of the number of HO∙ radicals when H2O2 is added in low amounts in the photocatalytic system has been proved by Hirakawa et al. [25, 26, 36]. They also explain the startup of chain reactions including oxidative processes, leading to the degradation and even mineralization of aqueous solutions containing organic matter. Therefore, we have tested the effect of various amounts of H2O2 comprised between 15–200 ppm in the presence of the two photocatalysts, P-25 and Kronos 7000 on the photocatalytic reaction progress. A blank experiment without H2O2 was also performed as a reference and only 4% of the dye was decolorized. The results in terms of decolorizing on P25 and Kronos 7000 catalyst are gathered in Figure 6.
Degradation yields of CV (15 ppm) using 0.1 g⋅L−1 photocatalysts (K series—Kronos 7000 and P series—P-25) and precised concentration of H2O2 (ppm), after 15, 60 and 90 min of photocatalytic reaction.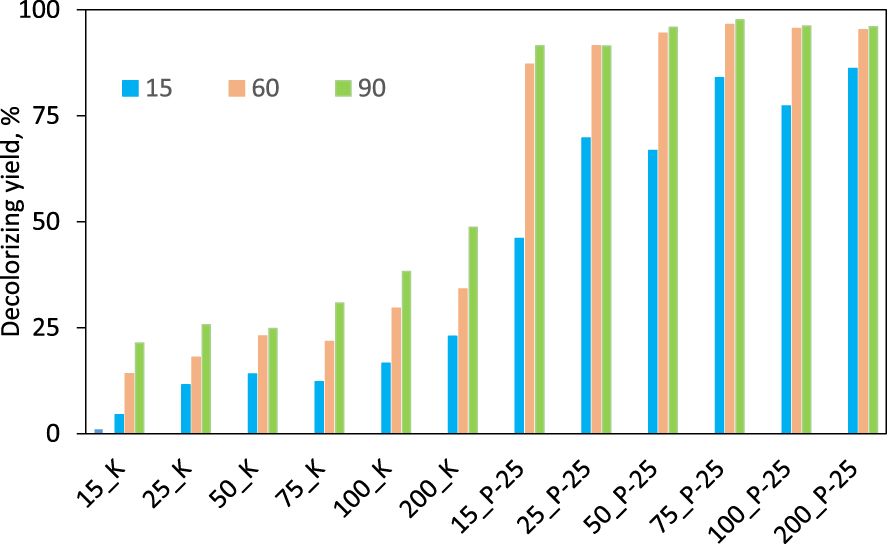
The overwhelming superiority of the P-25 sample results from the high decolorization degrees after 90 and even after only 60 min of photocatalytic reaction: yields comprised between 87–97% were obtained. Even more important, the effect of the H2O2 concentration has a quite minor role if its values rises over 25 ppm. In the case of Kronos 7000, the benefice brought by using hydrogen peroxide is somehow evident, but the decolorization yields remain under 50%, even when 200 ppm H2O2 was added in the reaction system.
In terms of photocatalytic process rate, for both solids (P-25 and Kronos), linear dependences of H2O2 concentrations were found (Figure 7). The data processing showed similar R2 values (over 95%) and the corresponding equations between the reaction rates (y) and H2O2 concentration in ppm (x) were, respectively:
| (3) |
| (4) |
3.6. Investigation of reaction advancement by TOC measurements
The investigation of the deepness of the photodegradation, aiming to prove the extent of elimination of the toxic organic compounds from the dye solutions could be solved by measuring the content of dissolved organic matter from the reaction mass, by determining the Total Organic Content (TOC). Sometimes, the decomposition of an organic species generated fragments still dangerous for the environment, and this fact was proven in detail [22, 23, 32]. The aim of an ideal degradation is reaching a high mineralization level of the pollutant.
Initial reaction rates for CV (15 ppm) decolorization ( photocatalysts, P-25 and Kronos 7000) and different H2O2 concentrations.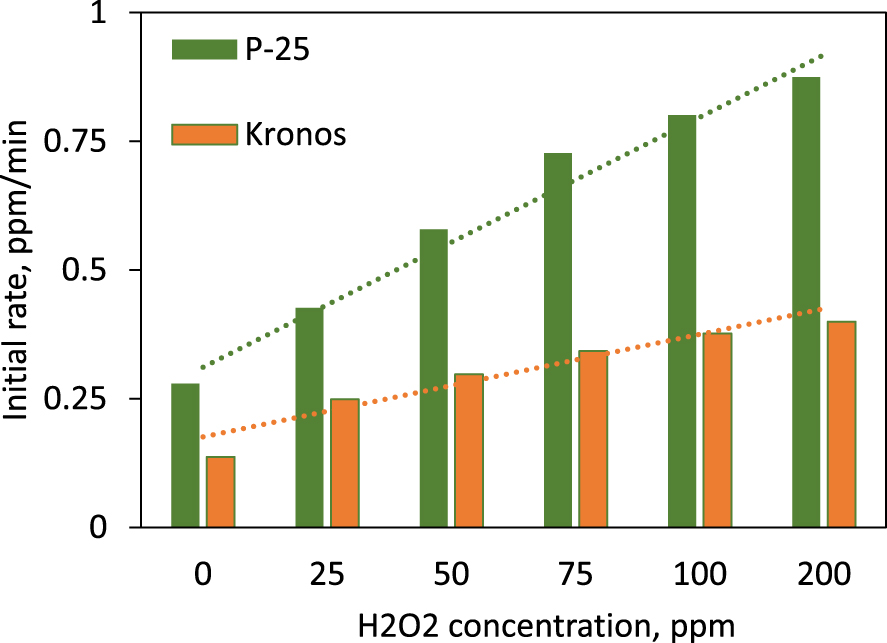
The TOC measurements were performed for four selected experiments, all of them made by using P-25 photocatalyst. Two photocatalyst dose values were employed, 0.1 g⋅L−1 and 1 g⋅L−1. Two experiments were performed only in the presence of the photocatalyst and other two were made by adding 100 ppm H2O2. The results collected after time durations comprised between 30–180 min are shown in Figure 8.
CV removal yields deduced from TOC values (photocatalytic degradation of 15 ppm CV in the presence of P-25 and 100 ppm H2O2).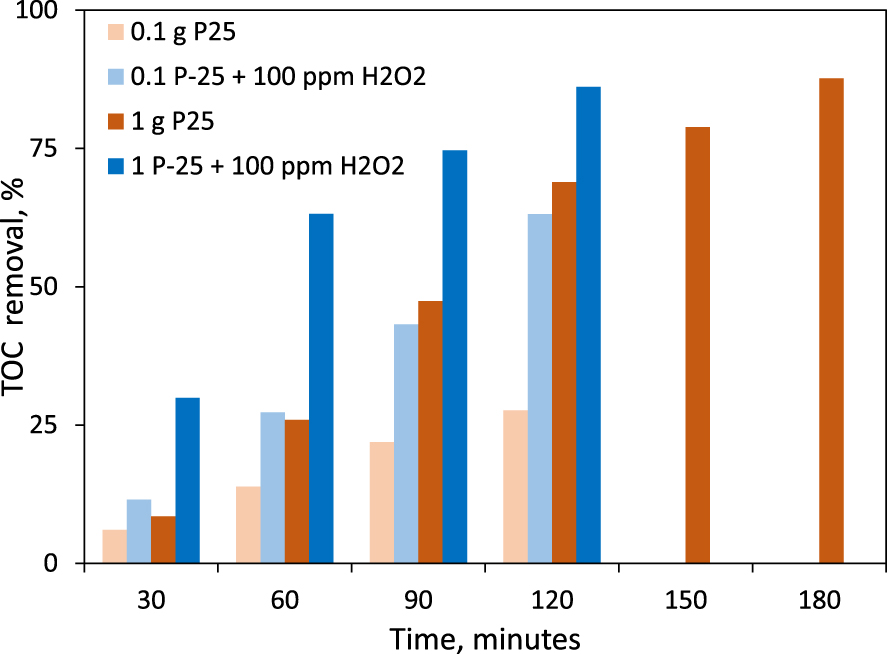
Measured nitrogen-containing ions and calculations for the balance sheet (ppm)
| Time (min) | N from | N from | Sum | |||
|---|---|---|---|---|---|---|
| 0.1 g P-25 | 30 | 0.03 | 0.12 | 0.0068 | 0.0933 | 0.1001 |
| 60 | 0.04 | 0.21 | 0.0090 | 0.1633 | 0.1724 | |
| 120 | 0.04 | 0.37 | 0.0090 | 0.2878 | 0.2968 | |
| 0.1 P-25 + 100 ppm H2O2 | 30 | 0.09 | 0.12 | 0.0203 | 0.0933 | 0.1137 |
| 60 | 0.09 | 0.29 | 0.0203 | 0.2256 | 0.2459 | |
| 120 | 0.28 | 0.41 | 0.0632 | 0.3189 | 0.3821 |
The synergetic beneficial effect of H2O2 in the reaction mass is very well highlighted especially comparing the values of the CV mineralization, when the P-25 dose was of 0.1 L−1: the mineralization degree is, for all the time values chose for sampling, more than two times higher when the oxidizer was added. The advantage revealed when the photocatalyst dose was of 1 g⋅L−1 consisted in a high mineralization yield (86%) after 120 min of reaction. It is interesting to note however that the mineralization also reaches 87% when the reaction time was extended to 180 min, without the addition of H2O2. In the perspective of the practical application of the system, an optimization must be considered between the cost of H2O2 and the energy consumption during one extra hour of photocatalytic reaction, for reaching the same mineralization level.
3.7. Analysis of the ions from the reaction mass
The mineralization process was also followed by measuring the ions from the mixture resulted after the reaction. In this respect, the measurements of nitrate, nitrite, ammonium and chlorine ions were monitored.
Chlorine ions arise from the hydrochloric acid bonded to one of the nitrogen atoms from the CV molecule and thereof amounts released in time in the water coarsely followed the ratios of CV decomposed, in correlation with the total amounts from the initial CV (values not shown). Nitrite ion was not detected in the samples.
In what concerns the release of nitrates and ammonium ions, they are products issued by the progressive decomposition of CV, from the three amine groups of the dye. The ions measurements were performed for reaction mass samples taken after 30, 60 and 120 min, for the reactions performed under 0.1 g⋅L−1 P-25 only and 0.1 g⋅L−1 P-25 + 100 ppm H2O2, respectively. The results are shown in Table 1.
The data in Table 1 were used to check the nitrogen balance sheet. The amounts of nitrogen from nitrate and ammonium were and converted to nitrogen and their sum was noted in the last column of the table. On another part, the amount of nitrogen from the initial dye was calculated by considering that one mole of CV (408 g) contains 42 g of nitrogen. Thus, the 250 mL of 15 ppm dye solution include 0.386 mg of nitrogen. The values highlighted in bold face in Table 1 show that the amounts of nitrogen found in the ions from measured solutions of reaction mass after 120 min and are in excellent correlation with the nitrogen from the initial CV and with the mineralization data.
The toxicity test performed for these two solutions using the Vibrio fischeri Microtox® method revealed an inhibition of 39% for the 0.1 P-25 + 100 ppm H2O2 system, showing that the toxicity of the treated medium depends only partially on the organic matter contained and that the inhibition could be assessed also to the ammonium and nitrate species.
4. Conclusions
The advanced degradation of crystal violet (CV) dye by applying a photocatalytic reaction in the presence of P-25 and Kronos 7000 commercial products containing titanium dioxide was studied. The results show the net superiority of P-25 in terms of decolorization, mineralization and dose of photocatalyst in comparison with Kronos 7000. The decolorization extents reach after 60 min of reaction values over 67% on P-25 at a photocatalyst dose of 0.1 g⋅L−1 and over 90% at doses comprised between 0.25–0.75 g⋅L−1. The pH of the photocatalytic reaction has a quite strong influence on the dye adsorption on the photocatalyst surface, but not on the yield of photocatalytic process.
The use of various amounts of hydrogen peroxide situated between 15–200 ppm in the photocatalytic reaction reveals that the reaction is strongly accelerated and has a beneficial role in the mineralization of crystal violet dye. At a 0.1 g⋅L−1 P-25 dose, the mineralization efficiency doubles when 100 ppm H2O2 was added in comparison to the photocatalytic process only. In turn, when the P-25 dose was 1 g⋅L−1, essential same results were obtained when 100 ppm H2O2 was added after 120 min of reaction or without H2O2 after 180 min (86% versus 87% mineralization degree). Important toxicity decrease after the photocatalytic transformation was assessed by using the Microtox® method, by using Vibrio fischeri microorganisms.
These results open the horizon of defining an optimal cheap and easy available system for CV advanced removal, either by accelerating the process by the use of 15 ppm or more hydrogen peroxide to reach a high yield in 120 min or adopt a photocatalytic reaction time of 180 min.
Conflicts of interest
Authors have no conflict of interest to declare.
Dedication
This work is a tribute paid to Professor Emil Dumitriu from the Faculty of Chemical Engineering and Environmental Protection, “Gheorghe Asachi” Technical University of Iaşi, Romania on his 75th anniversary, as a modest acknowledgement for his essential and competent mentoring to the authors in the first steps of scientific research.