


 CC-BY 4.0
1. Introduction
Plant species represent a rich source of bioactive compounds, such as secondary metabolites which are unique to individual plant species, are not essential to plant cell live and occur in low concentrations; primary metabolites are vital for the life of plants and are directly involved in their growth, development and reproduction. Floristic analysis shown that about 120,000 plant species can be used to create novel chemical entities (NCE) which could be implemented in treatment of many diseases [1]. Nowadays, scientists from various fields are interested in advanced vibrational spectroscopic methods in fingerprinting secondary metabolites from plants which can either positively or negatively affect human health [2, 3].
For identification, isolation and characterization of these bioactive compounds from vegetal biomass extract, extremely valuable are non-chromatographic techniques. The use of these techniques can provide information to identify the compounds of interest in a less time-consuming, simple mod, fast and reliable methods. Several studies were obtained regarding spectroscopic methods, especially Fourier-transform infrared spectroscopy (FTIR) to obtain and facilitate the identification of bioactive compounds from plants [4, 5, 6, 7].
The fluorescence spectroscopy offers a simple, rapid and easy-to-use technique to identify and quantify the main phytochemicals. These techniques are considered to be 100–1000 times more sensitive than other spectrophotometric techniques [8, 9]. Fourier transform infrared spectroscopy (FTIR) provides a rapid, versatile, relatively inexpensive tool and non-destructive investigation, easy to use to fingerprint herbal extracts or powders. The use of attenuated total reflectance (ATR) device evolved rapid FTIR measurements of liquids allowing the identification and quantification of valuable plant phytochemicals from plant extracts [2, 8, 10].
Datura innoxia originates from Central America, is part of the nine plant species which belong to the Solanaceae family. It is an annual ornamental plant with beautiful flowers and is foreign of Romania growing in the gardens for decorative purposes and also is present as wild population on the side of the roads [11]. Nowadays, is becoming important for medicine for its rich tropane alkaloids content, especially hyoscine (scopolamine) [12].
During the last few years, a number of papers describing the application of several analytical techniques to the qualitative and quantitative analysis of bioactive compounds have been published. However, little information is available on spectroscopy techniques which have been reported as simple, fast, and reliable methods in different fields [13, 14]. In genus Datura, several phytochemical compounds were screened in Datura innoxia solvent leaves extracts from India such as alkaloid, terpenes, phenolic compounds, phytosterol, flavonoids, tannins, saponins, glycosides, steroids, proteins [15, 16, 17] and seeds extracts, alkaloids, carbohydrates, tannins, flavonoids, saponins and sterols [18]. Other studies reported some results from other countries regarding the identification in Datura innoxia leaves and seeds extracts from Mali of alkaloids, polyphenols, triterpenes, flavonoids, coumarins and tannins [19] and also phenolic compounds in Datura innoxia areal parts from Turkey [11].
The present study presented the application of spectroscopic methods, such as fluorescence study and attenuated total reflection Fourier transform infrared (ATR-FTIR) analysis for identification and detection of secondary metabolite specially, hyoscine tropane alkaloid, and organic functional groups, and also provide the information about qualitative (characteristic fingerprint peaks) and quantitative composition (concentration of hyoscine) from Datura innoxia structural units extracts from Romania. Dry biomass of different Datura innoxia structural units (leaves, flowers, seeds, stem and root) were subjected to extraction in solid–liquid system according to Soxhlet method, using two appropriate solvents (1-butanol and ethanol).
2. Materials and methods
2.1. Vegetal materials and preparation of the extracts
Datura innoxia biomass samples (leaves, flowers, seeds, stem and root), were collected in the maturity periods from Romania and were air-dried at room temperature in the laboratory for several days. The dry samples with sample solvent-ratio as 3:50 w/v (leaves), 1:30 w/v (flowers), 3:50 w/v (seeds), 2:30 w/v (stem) and 1:30 w/v (root) of the dried powder, were subjected to extraction in solid–liquid system according to Soxhlet method, using two appropriate solvents (1-butanol and ethanol). The extracts obtained from evaporation of the solvents were transferred to volumetric flasks and a dilution as made with the extracting solvent. From this extract’s solution, 10 and 50 μL was transferred into a 20 mL volumetric flask, also diluted and stored until were used for fluorescence analysis. It is mention that the protocol of sample preparation and extraction is in according to [20, 21, 22].
2.2. FTIR analysis
FTIR-ATR spectrophotometric analysis was used to determinate the functional group present in the Datura innoxia dry biomass in liquid state. The spectra were collected using a DIGILAB-FTS 2000 spectrometer with a horizontal plate ATR sampling accessory which allows direct sample application of liquids. For liquid sampling on the top of the plate it was used a zinc selenide (ZnSe) crystal trough plate at 45°. The data were collected in absorbance mode and the wavelength ranged from 4000 to 400 cm−1. A spectral resolution of 4 cm−1 was used. Based on the peak value in the region of IR and compared with previously reported, the detection was done.
2.3. Fluorescence analysis
The fluorescence spectra for Datura innoxia dry biomass extracts were recorded using PERKIN-ELMER LS 50B fluorescence spectrophotometer and determined in prescan mode. The excitation wavelength was fixed at 280 nm, and the emission wavelength was from 200 (slits set at 5 nm) to 700 nm (slits set at 10 nm). Number of accumulations was 3 and scan speed, 500 (nm/mm). For quantification of hyoscine stock solution of hyoscine (800 mg/L) was prepared in ethanol. Fluorescence spectra of hyoscine intermediate standard solution were recorded in same condition.
3. Results and disscution
3.1. FTIR-ATR fingerprints of Datura innoxia dry biomass
Attenuated total reflectance (ATR) is the most common techniques among infrared spectroscopy methods because doesn’t require sample grinding or heating and saving time to avoiding the modification that could lead to undesired chemical structural changes of the sample [10, 23].
The functional groups and chemical compounds detected by FTIR-ATR analysis of the ethanol and 1-butanol extracts of the Datura innoxia dry biomass
| Functional groups | Wave numbers range (cm−1) | Leaves | Flowers | Seeds | Stem | Root | |||||
|---|---|---|---|---|---|---|---|---|---|---|---|
| Etanol | 1-Butanol | Etanol | 1-Butanol | Etanol | 1-Butanol | Etanol | 1-Butanol | Etanol | 1-Butanol | ||
| Alcohols, phenols,carbohydrates | 3327–3700 | X | X | X | X | X | X | X | X | X | X |
| Lipids, metoxyderivatives,aldehydes | 2800–2974 | X | X | X | X | X | X | X | X | X | X |
| Alkanes | 2850–3000 | X | X | X | X | X | X | X | X | X | X |
| Aldehydes | 2695–2830 | — | X | — | — | X | X | X | — | — | X |
| Ester fatty acidgroup andglycerides | 1730–1775 | — | — | — | — | X | X | X | — | — | — |
| Fatty acid group | 1700–1715 | — | — | — | — | X | X | — | — | — | — |
| Glycoproteins | 1659 and 1549 | X | X | X | X | X | X | X | — | — | X |
| Alcohol | 1452 | X | — | X | — | X | — | X | — | X | — |
| Aromatics | 1462 | X | X | X | X | X | X | X | X | X | X |
| Alkane | 1400 | X | X | X | X | X | X | X | X | X | X |
| Cellulose | 1325–1379 | X | X | X | X | X | X | X | X | X | X |
| Crboxilic acids | 1150–1270 | X | X | X | X | X | X | X | X | X | X |
| Glicozide | 997–1130 | X | X | X | X | X | X | X | X | X | X |
| Carbohydrates | 900–1185 | X | X | X | X | X | X | X | X | X | X |
| Tropane alkaloids(hyoscine) | 847 and 880 | X | X | X | X | X | X | X | X | X | X |
| Terpenes | <1000 | X | X | X | X | X | X | X | X | X | X |
| Alchene | 650 | X | — | X | — | X | X | X | — | X | — |
The IR spectra of ethanolic and 1-butanolic plant extracts (Datura innoxia) were registered, and show the presence of various functional groups and chemical compounds, such us primary and secondary metabolites. The results of the functional groups and the chemical composition detected by FTIR-ATR are presented in Table 1, and the spectra are illustrated in Figure 1.
FTIR-ATR fingerprint spectrum of dry biomass extracts of Datura innoxia in ethanol and 1-butanol. LV leaves, FL flowers, SD seeds, SM stem, RT root. h: 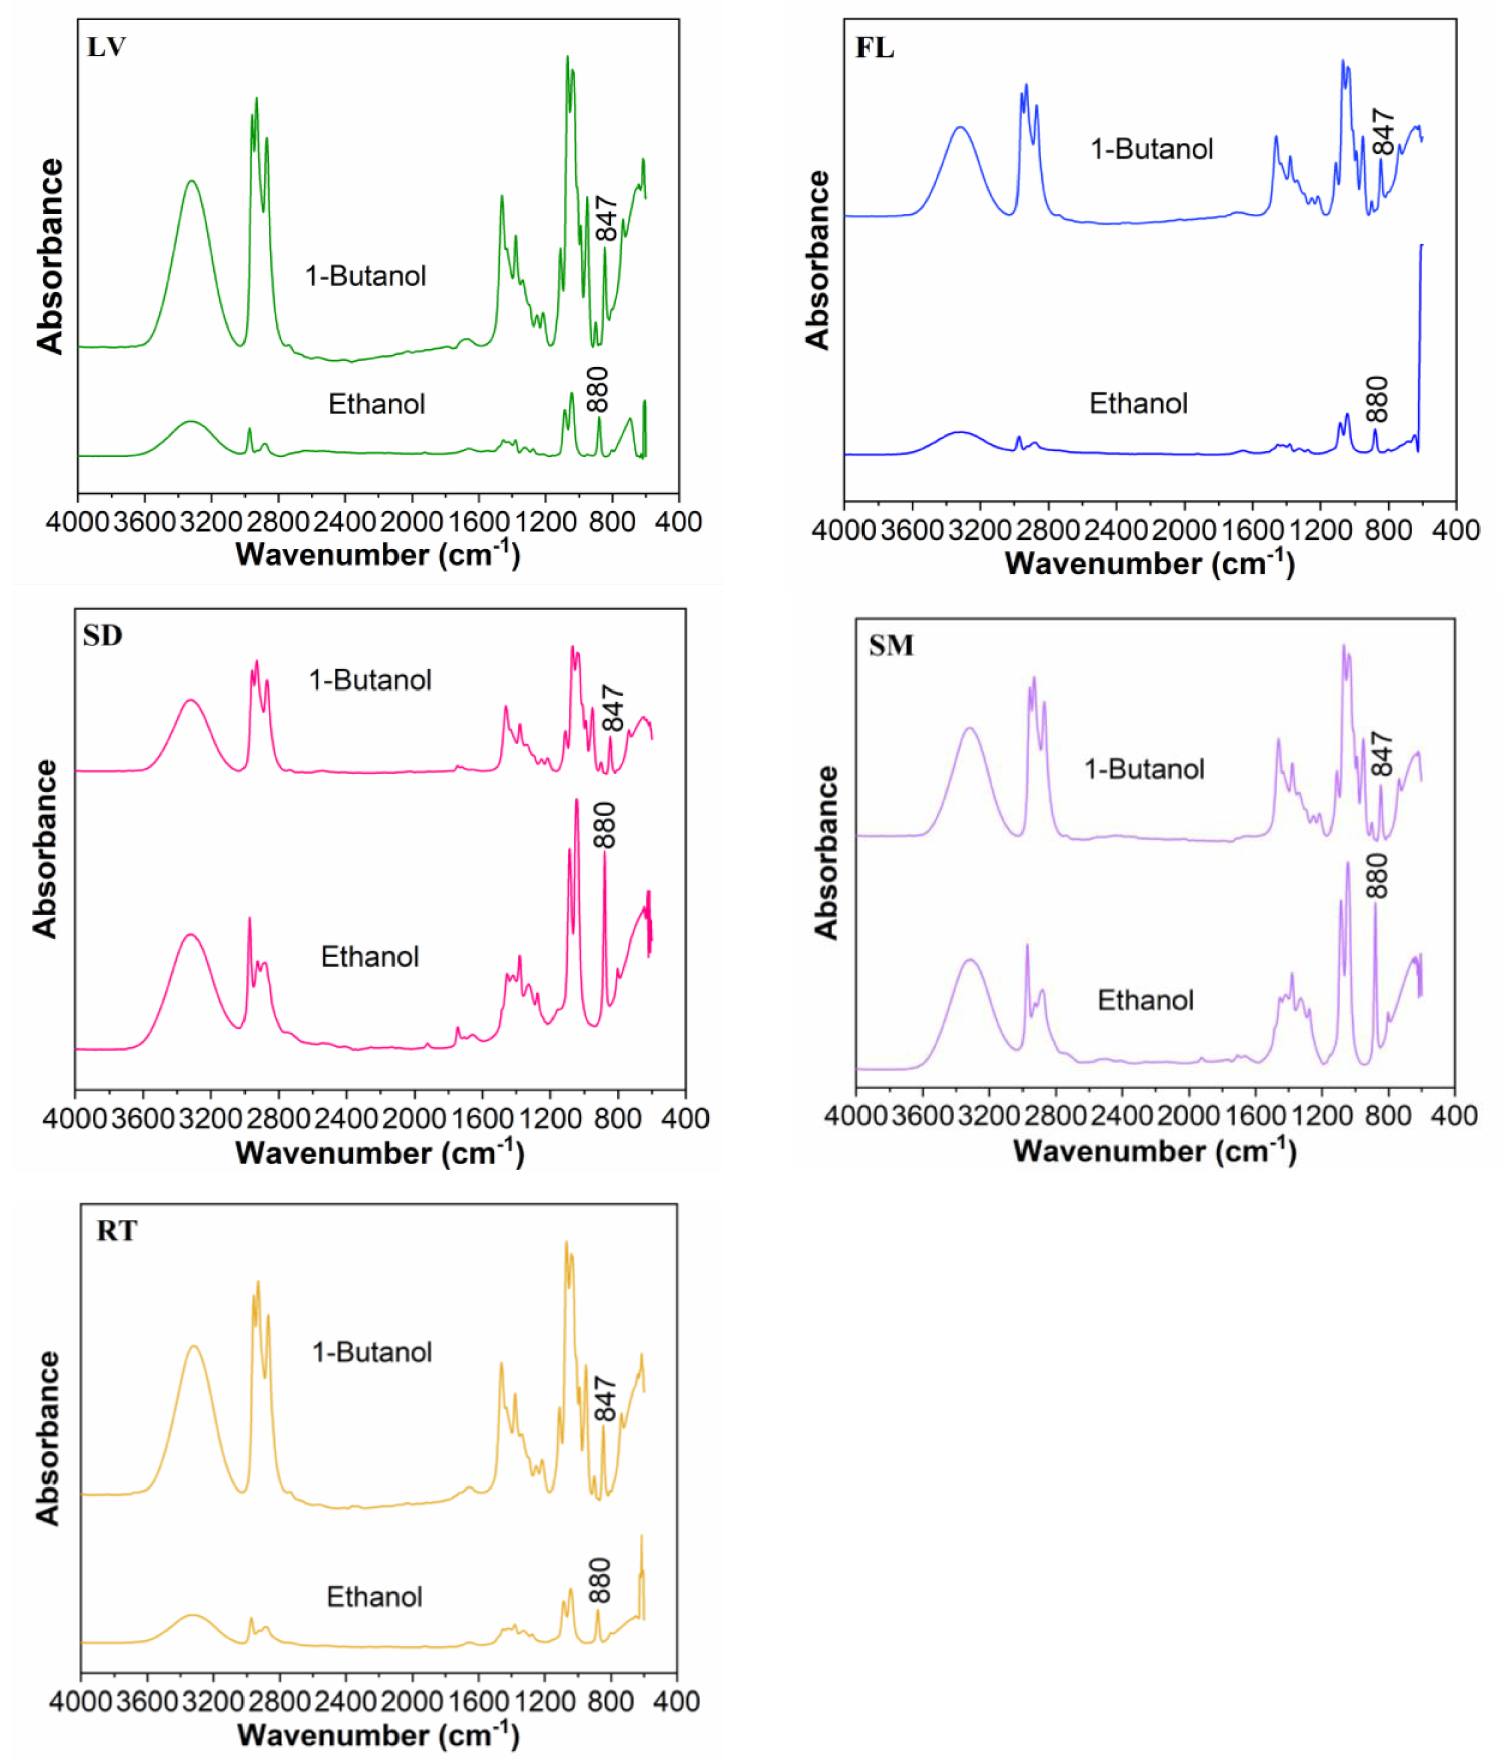
 stretching vibration of epoxide ring, ether.
The IR characteristic wave numbers range and bending vibrations (Table 1) were compared with literature data [2, 6, 24, 25, 26, 27, 28]. Referring to the literature [25], the IR characteristic fingerprint peaks region for Datura innoxia biomass samples are in the range of 1800–600 cm−1.
From the FTIR spectra were observed variations in the peaks of all the extracts. The functional groups identification was based on the FTIR peaks attributed to stretching and bending vibrations.
Each of the IR spectra insured absorption of bands in the region of (3000–3700 cm−1) which corresponds to stretching vibrations of OH groups (from water, alcohols, phenols, carbohydrates, peroxides) or the presence of NH functional group from amides (3650 cm−1). The region (2800–2974 cm−1) corresponds to C–H stretching vibrations specific to CH3 and CH2 from lipids, metoxy derivatives, C–H (aldehydes), including cis double bonds. Wave numbers range (1600–1760 cm−1) is a complex one, corresponding to bending vibrations N–H (amino acids), C=O stretching (aldehydes, ketones, esters, carboxylic acids), free fatty acids (1710 cm−1) as well to ester fatty acid group (1730–1740 cm−1) and glycerides (1740 cm−1). The next region (1540–1600 cm−1) corresponding to aromatic domain and N–H bending vibrations (amines), while (1300–1450 cm−1) correspond to stretching vibrations C–O (amide) and C–C stretching from phenyl groups. Region (1150–1270 cm−1) corresponds to stretching vibrations of carbonyl C–O or O–H bandings, while wave numbers range (997–1130 cm−1) to stretching vibrations C–O of mono-, oligo- and carbohydrates [26]. The final wave numbers range ( <1000 cm−1) corresponds to C–H bending vibrations from terpenes and isoprenoids. C–H bending vibrations 900–650 cm−1 are diagnostic of substitutions of the aromatic ring [26].
In ethanolic and 1-butanolic extracts of Datura innoxia dry biomass (leaves, flowers, seeds, stem and root the IR characteristic fingerprint peaks are mostly in the range of 1800–600 cm−1 (Figure 1). The spectra were analyzed and some structural features can be extracted, such as the peak at 1707 cm−1 corresponding to the fatty acid group, such as oleic acid [29] and 1722 cm−1 corresponding to the aldehyde of a saturated fatty acid [25]. Oleic acid was identified only in seeds extracts in ethanol).
Aldehydes of a saturated fatty acid were identified also in seed (1-butanol) and stem (ethanol) [30]. The signals at 1659 and 1549 cm−1 coincide to amide I band (carbonyl group) and amide II (stretching 𝜈CN + bending 𝛿NH) found in glycoproteins which is not corresponding to stem extract in 1-btanol and root extract in ethanol [8, 27]. The peak at 1452 cm−1 is very characteristic for an alcohol C–OH within the bending vibration absorption [25]. Another characteristic peak (1325 and 1379 cm−1) is corresponding to cellulose, which is found in all dry biomass extracts (ethanol and 1-butanol) [10]. The peak 1070 cm−1 is attributed to the stretching vibrations of C–O and the C–OH deformation vibration [25]. C–H bending vibrations 900–650 cm−1 is diagnostic of substitutions of the aromatic ring [26] and is corresponding to terpenes [8] which are identified in all Datura innoxia dry biomass extracts. The peaks between 652–685 cm−1 corresponds to the vibration absorption of alkenes [25]. The primary and secondary metabolites present much complexity and diversity, as shown in Figure 1.
Taking into account this complexity and diversity, the most important secondary metabolites from Datura innoxia are tropane alkaloids.
In general alkaloids show a broad range of different chemical structures only a few vibrational measurements of these chemical constituents have been published, like piperine from Piper nigrum L., morphine, codeine, papaverine, thebaine and noscapine occurring in poppy plant material, caffeine, theophylline and theobromine from guarana seeds [2] scopolamine or hyoscyamine from Datura stramonium [6].
Referring to the literature, the FTIR spectrum of tropane alkaloids is characterized by absorption peaks for the stretching vibrations of various functional groups; 3700–3000 cm−1 (O–H alcohol, N–H amine), 3104 cm−1 (aromatic C–H), 1738 cm−1 (C=O ester), 1650 cm−1 (N–H bending), 1496 cm−1 (C=C aromatic), 1600–1300 cm−1 (C–H bending alkane), 1200 cm−1 (C–O ester), 1050 cm−1 (C–O primary alcohol), 900–700 cm−1 (C–H aromatic bending vibrations) [28].
For hyoscine the FTIR-ATR spectrum is characterized by absorption peaks at 880 cm−1 in ethanol end 847 cm−1 in 1-butanol which corresponds to epoxide ring, ether  . These bands of absorption represent the fingerprint for identification of hyoscine in all vegetative organs from Datura innoxia plant (only for hyoscine) [6].
Moreover, for bring more evidence, in Figure 2 is represented the FTIR-ATR spectra of pure hyoscine, also known as scopolamine, revealing the absorption peaks at 880 cm−1.
FTIR spectrum of pure hyoscine revealing the absorption peaks at 880 cm−1.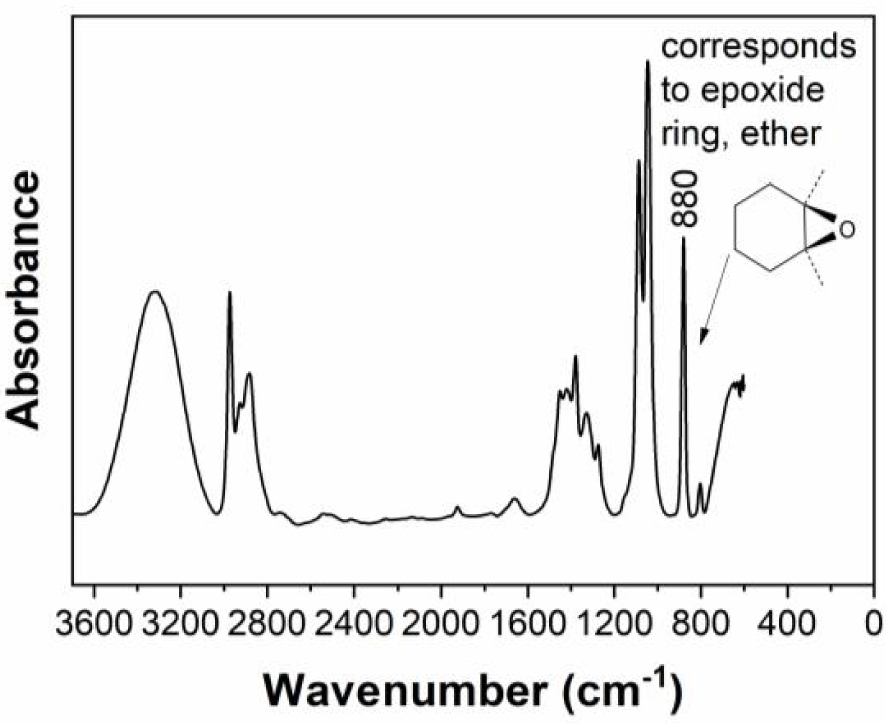
Based on this information it can observed from Figure 2 that hyoscine was identified in all vegetative organs of Datura innoxia dry biomass extracts (leaves, flowers, seeds, stem and root).
3.2. Fluorescence detection
Analytical techniques based on fluorescence detection are very popular because of their high sensitivity, rapidity and selectivity. When a phytochemical compound is fluorescent, especially aromatic hydrocarbons, direct fluorometric detection is possible. This detection is happening in the case of crude oils, proteins, some drugs (e.g., morphine), foods, etc. Moreover, a large number of fields applications have been reported, such as analysis of air and water pollutants; monitoring of industrial processes; monitoring of species of clinical relevance; criminology; etc. [9, 31]. Aromatic containing compounds (benzene ring systems) are the most common fluorescent structure that the chemist is likely to work with in the laboratory [14, 32].
Results presented in this paper show the ability to analyze tropane alkaloids, with a rapid and easy method based on fluorescence spectroscopy. We have performed to recorded fluorescence spectra for leaves, flowers, seeds, stem and root from Datura innoxia dry biomass in ethanol and 1-butanol at excitation wavelength 𝜆ex = 280 nm. After deconvolution, and identification of the bands forming the spectra, a normalization of the intensities was made relative to the hyoscine band with 𝜆ex = 345 nm taken as reference standard.
Figures 3 and 4 shows the fluorescence excitation spectra of hyoscine in the ethanol extracts and 1-butanol extracts respectively, of Datura innoxia biomass (leaves, flowers, seeds, stem and root) and hyoscine standard solution. In both cases the peaks are observed near 345 nm. It is obvious that the fluorescence spectra show a strong dependence on the nature of the solvent. Compared to ethanol, the fluorescence intensity is enhanced significantly in 1-butanol [33].
Fluorescence excitation spectra of hyoscine in the ethanol extract of Datura innoxia biomass. LV leaves, FL flowers, SD seeds, SM stem, RT root, HS hyoscine standard.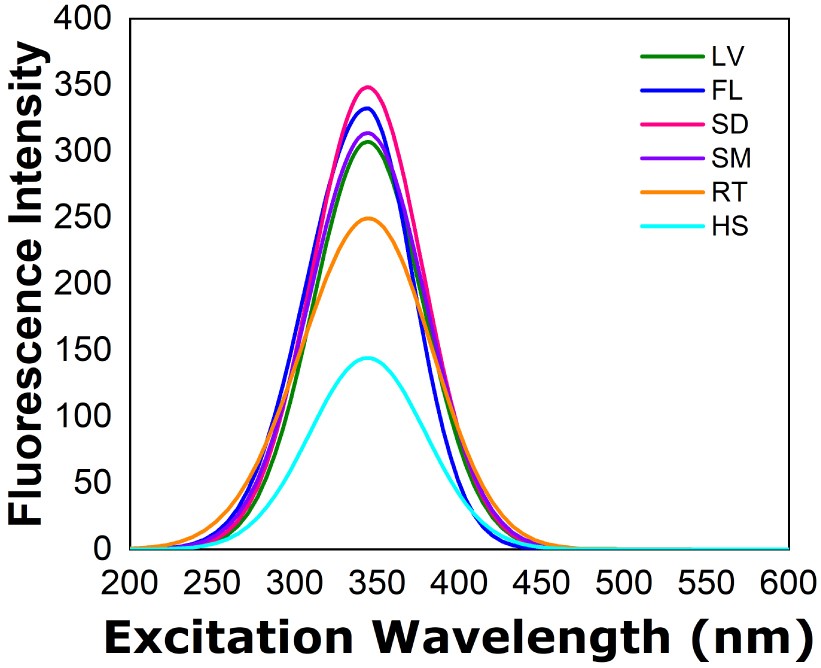
Fluorescence excitation spectra of hyoscine in the 1-butanol extract of Datura innoxia biomass. LV leaves, FL flowers, SD seeds, SM stem, RT root, HS hyoscine standard.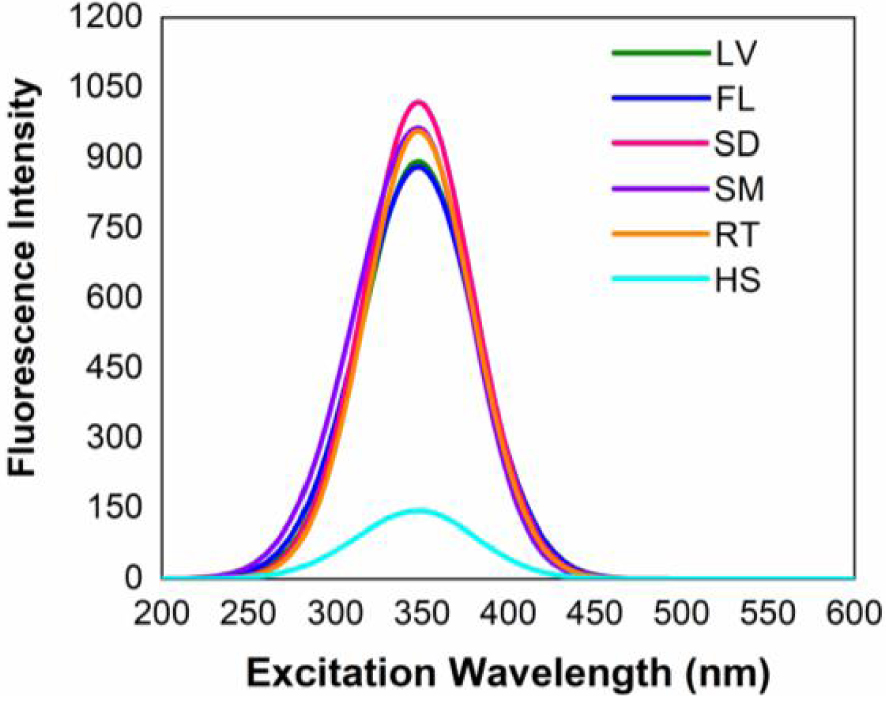
For deconvolution spectra we select for example seeds matrix extracts to identify the best Gaussian peaks for matching experimental data. Figures 5 and 6 shows the average emission spectra of seeds extracts from Datura innoxia from ethanol (Figure 5) and 1-butanol (Figure 6) using excitation of the outer face at 280 nm with fitting using four Gaussians.
Deconvolution of the fluorescence spectra for the seeds extracts of Datura innoxia dry biomass in ethanol.
Deconvolution of the fluorescence spectra for the seeds extracts of Datura innoxia dry biomass in 1-butanol.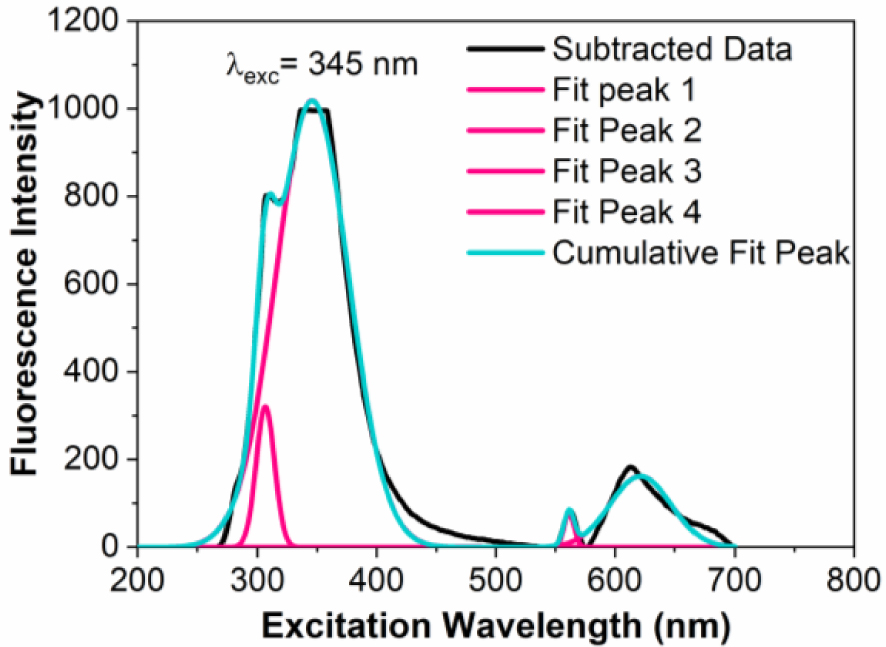
For quantification of hyoscine, measurement of its fluorescence intensity in ethanol solutions is used. The standard and sample solutions were scanned in 4 replicates in the fluorescence excitation spectral acquisition mode. The calibration curves for the developed method were linear with calibration equations of y = 14.136x + 29.863 where, y indicate fluorescence excitation intensity and x represents concentration in mg/L. The linearity of the calibration curves were evaluated based on the coefficient of determination (R2 = 0.919).
The amount of hyoscine solvents extracts was determined by diluting the sample solution and the concentration of the hyoscine was determined using the calibration equations. The highest hyoscine content was found in the 1-butanol extracts versus ethanol extracts. Dry biomass (mg/kg dry weight) from leaves (434.9 ± 11.9), flowers (325.2 ± 6.1), seeds (249.6 ± 0.7), stem (178.3 ± 29.2) end root (348.8 ± 6.4) extracted in 1-butanol have highest alkaloid content as compared with the same matrices extracted in ethanol, such leaves (67.0 ± 37.5), flowers (113.7 ± 11.3), seeds (79.3 ± 8.7), stem (53.1 ± 3.0) end root (81.8 ± 3.2).
Moreover, it can be observed that the concentration of hyoscine depends on the plant tissues, the geographical origin of samples and other factors influenced by their environment, age, time of harvesting, drying and storage, as well the solvent used to obtain extracts [8, 21, 33].
The amount of hyoscine expressed as mg/kg, dry weight in Datura innoxia leaves, flowers, seeds, stem and roots matrix extracts in ethanol and 1-butanol solvents using Soxhlet extraction technique.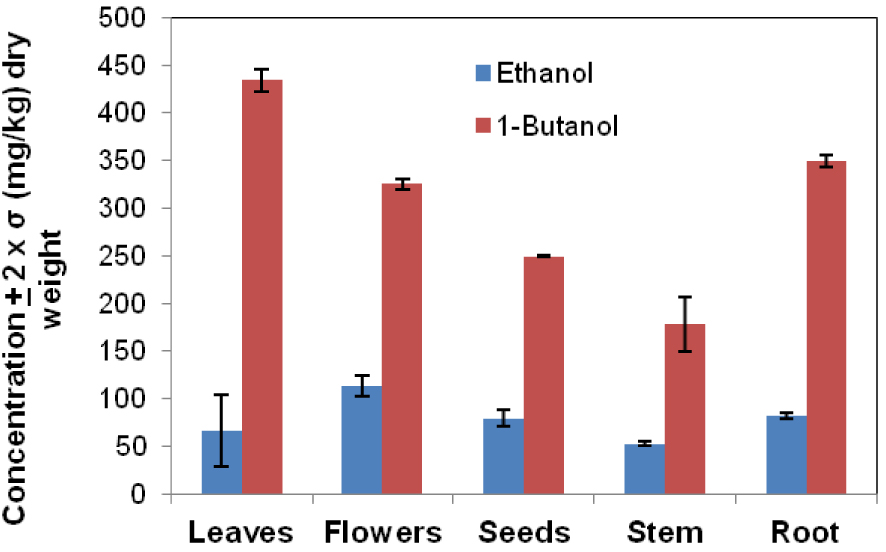
Figure 7 indicate a comparative estimation of the concentration for hyoscine in Datura innoxia biomass extracts (ethanol, 1-butanol) using the conventional method, Soxhlet extraction technique. It can be observed that the highest hyoscine content was found in the leaves (434.9 ± 11.9 mg/kg dry weight) extracted in 1-butanol. The error bars given as ±2× standard deviation for 4 replicate measurements at the 95% confidence interval.
A sensitive, rapid and easy fluorescence method it was presented in this study for determination of hyoscine in the ethanol and 1-butanol extracts of Datura innoxia dry biomass. Compared to the reported methods the detection and quantification of the developed method with respect to the compound was lower. This confirms the better sensitivity of the method which can make it to be applicable for the same routine analysis [34].
4. Conclusions
Fluorescence study and FTIR-ATR spectroscopy are proper techniques to fingerprint comparatively and to determinate the concentration of tropane alkaloids, especially hyoscine from Datura innoxia dry biomass. Based on fluorescence spectroscopy, the Soxhlet extraction efficiency was superior in 1-butanol comparative to ethanol, increased in fatty acids, alkaloids comparative to glycoproteins. Based on the differences of polarity between the two solvents used, higher concentration was obtained for hyoscine in 1-butanol than ethanol. Based on the FTIR-ATR spectroscopy, for each vegetative organ plant extracts it was determined the fingerprint region to be located between 1800 and 600 cm−1 and it has been identified the characteristic functional groups.
The experimental results confirm the fact that this plant posse’s important classes of secondary metabolites useful in medicine domain, such as alkaloids e.g., hyoscine, amine, alcohols, phenolic compounds, alkanes, carboxylic acids, aldehydes, ketones, sterols, terpenes, nitrogen compounds, alcohols, carbohydrates e.g., cellulose, hemicelluloses. So further scientific investigation for intensification of extraction by nonconventional methods is needed. Moreover, the results showed the presence of hyoscine in all vegetative organs which is in according with other studies from literature. Regarding fluorescence study, the excitation and emission spectra were measured. Maximum excitation was found to be 345 (1-butanol and ethanol) and, also in this case hyoscine was determinate in all parts of the Datura innoxia plant.
Conflicts of interest
Authors have no conflict of interest to declare.