


 CC-BY 4.0
1. Introduction
Transportation and industrial sectors are now using lubricants based on plant oils as its renewable resource [1]. Since products based on plant oil are less toxic and friendly to the environment, their waste disposal will less delinquent to the surrounding. Erhan et al. [2], Salimon et al. [3], Srivastava and Sahai [4] noted that plant oils could not be used on its own as a base stock for lubricants, as they were thermally and cold-flow naturally unstable. Therefore, plant oil-based oleochemical esters could be improved upon these characteristics or to be converted into plant oils-based polyolesters. Trimethylolpropane (TMP) and pentaerythritol (PE) are the examples of the polyhydric alcohols used to produce polyolesters for the industrial green biolubricants application [5, 6, 7, 8]. The advantages of these polyolesters for biolubricants application are due to the good lubrication properties such as excellent fluidity at low temperatures, high in thermal oxidation stability, viscosity index and volatility. Although they are not meant for extremely high temperatures biolubrication application, they can still be used in more moderate conditions [9, 10, 11].
Monounsaturated fatty acid-based biolubricants have advantages over the saturated fatty acid-based lubricants in terms of low cloud point and pour point, better wear protection performance and moderate viscosity index [3, 12]. Plant oils in the same sense, high degree of unsaturation poses a better pour point compare to the plant oils with less degree of unsaturation [13]. Therefore, fatty acid composition of specific interested plant oil being used as raw materials in the production of biolubricants should be “know-how” selected. Non-edible oils and waste oils are among researchers of interest to be known prior the production and formulating of good green biolubricants.
The refining process of crude palm oil (CPO) produces by-product or waste known as palm fatty acid distillate (PFAD). PFAD is a semi-solid at room temperature and turn to liquid on mild heating. It colours change from light brown to darker brown liquid upon melt. PFAD comprises mixtures of palm fatty acid (PFAs) (>80%), nonlipids and impurities. These large amounts of PFAs in PFAD were recovered from the deodorization process. Oleochemical industries have used PFAD as the raw materials for an intermediate product to make plastic, animal feed, and for medium-grade cleaners. Some researchers have reported the promising PFAs extracted from PFAD for biodiesel production [14, 15, 16, 17, 18].
PFAD comprises palmitic acid and oleic acid as the major saturated and unsaturated FAs composition, respectively. Its major fatty acids are the same as the major fatty acid composition in CPO. The remaining components are partial glycerol and nonlipids substances such as unsaponifiable matters, vitamin E, sterols, squalene, and volatile substances [19, 20, 21]. Numerous researchers have analysed the chemical composition of PFAD. Malaysian PFAD samples showed the major fatty acid composition were 45.7 ± 1.3% of palmitic (C16:0) and 40.2 ± 1.2% of oleic (C18:1) acids, respectively [22, 23]. Surveys on the characteristics and properties of PFAD from Malaysia refineries have been conducted by Ping and Yusof (2009) [24] and the results show PFAD consist of more than 80% fatty acids comprises of myristic; C14:0 (1.2%), palmitic; C16:0 (46.9%), palmitoleic; C16:1 (0.15%), stearic; C18:0 (4.3%), oleic; C18:1 (36.7%), linoleic; C18:2 (9.1%), linolenic; C18:3 (0.3%), arachidic; C20:0 (0.2%) and others (0.1%). This study seems to be in line with the findings by Jumaah et al. [25] and Baharudin et al. [26], who noted that palmitic acid (47.1%) was the dominant fatty acid in the Malaysian PFAD, followed by oleic acid (36.6%) and linoleic acid (9.6%), respectively. Beside that PFAD consists of 14.4% glycerol, 0.5% vitamin E, 0.8% squalene, 0.4% sterols and 2.2% others [27, 28].
The development of specific biolubricants industrial application has attracted many researchers to isolate and separate saturated palm fatty acids distillate (SFA-PFAD) and unsaturated palm fatty acids distillate (USFA-PFAD). For example, the separation of USFA-PFAD from PFAD through low temperature methanol solvent recrystallization (LTSC) has produced significant difference in unsaturated fatty acids composition in its liquid fraction. Under the optimum separation conditions, the percentage of USFA-PFAD in liquid fraction was determined to be 93% and 7% of SFA-PFAD with 48% yields. Oleic acid as the main unsaturated fatty acid constituent surged from 37.6% in PFAD to 76% in USFA-PFAD, while main constituent of saturated palmitic acid declined from 49% in PFAD to 6.2% in USFA-PFAD [25].
To date, there was no single work has been reported the use of USFA-PFAD to produce available or high-end oleochemical products such as polyol ester based biolubricant. Therefore, our aim of the research was to utilize the USFA-PFAD obtained from the separation process by using LTSC technique, in the synthesis of green biodegradable biolubricants base stock oil production through the esterification process. The unsaturated oleic acid was chosen as the representative of USFA-PFAD due to its major composition (76%) with the ratio of 4.4:1 to linoleic acid (17%). In this paper, the esterification reactions between the USFA-PFAD with selected polyhydric alcohol of trimethylolpropane (TMP) to produce polyol ester, USFA-trimethylolpropane (USFA-TMP) as potential base stock for green biodegradable biolubricants. Polyol ester-based TMP biolubricants has been reported as highly potential versatile green product for the replacement of the petroleum-based lubricants [1, 7, 17]. The process was optimized by using Response Surface Methodology (RSM) of D-optimal design software to produce high yield and tri-ester selectivity of the final polyol ester product, USFA-TMP. The effects of different reaction parameter conditions toward the reaction responses of the percent yields and the tri-ester selectivity were optimized and resolute by using D-optimal design approach. The results of this study could portray that the high-end USFA-PFAD based polyol ester biolubricant can be produced through conventional esterification strategy to large-scale esters production, which is an encouraging approach to achieve cost-effective polyol ester production from palm oil processing by-product of palm oil processing.
2. Materials and method
2.1. Materials
Unsaturated palm fatty acid distillate (USFA-PFAD) represented by oleic acid (76%) was obtained from PFAD separation by low-temperature methanol crystallization [25]. Alcohol used was trimethylolpropane (TMP) purchased from Sigma Aldrich. All analytical grade chemicals, e.g., sulfuric acid, methanol and sodium hydrogen carbonate were used without further purification.
2.2. Structural characterization analysis
The structure of synthesized ester was determined and confirmed by using Nuclear Magnetic Resonance (FT-NMR) and Fourier Transform infrared spectroscopy (FTIR). FT-NMR JEOL-ECP 400 spectrometer (1H and 13C NMR) was used for molecular structural analysis. The spectra were recorded by using CDCl3 solvent. Perkin Elmer Infrared Spectrophotometer was used to record the FTIR spectra between wavenumber of 700 and 4000 cm−1. The ester composition was analyzed by Shimadzu GC-17A Gas Chromatography furnished with Flame Ionization Detector. High temperature column of DB-5HT (30 m × 0.25 mm × 0.25 μm) was used to separate the sample eluent. In a vial of 10 mL, 0.5 mL ester sample was diluted with 5 mL GC grade ethyl acetate solvent prior to the GC injection. The GC oven was first set at initial temperature of 100 °C for 1 min. The oven temperature was then increased by a step increment of 5 °C/min to 380 °C and allowed constant for 25 min. The GC column temperature was then attuned at 100 °C and amplified to 380 °C with a 5 °C/min temperature rate increments. The column temperature was kept constant at 380 °C for 20 min. The injector and detector temperatures were set at 380 and 400 °C, respectively. Helium was used as the GC carrier gas system at a flow rate of 1ml/min. The ester sample (1 μL) was used for the GC-FID analysis according to Nowicki et al. [28]. The ester peaks were recognized by the retention times comparison to the authentic standards.
2.3. Lubrication characterization analysis
The lubrication characteristics of the esters were determined according the American Society for Testing Materials standards (ASTM). The ASTM D-97 was used for pour point [29] and ASTM D-93 for flash point determination [30]. The pressurized Differential Scanning Calorimeter was used for thermal oxidative stability determination [31]. A controlled DSC822e Metter Toledo Differential Scanning Calorimeter was used to determine the oxidative property. The instrument was set with a temperature sensitivity of 0.2 mV⋅cm−1 and maximum sensitivity of 5 mV⋅cm−1. A hermetically sealed type aluminum pan was used to place a 3.0 mg sample with a pinhole lid for sample interaction with the reactant gas (dry air). The hole greatly restricts the volatilization of the ester sample by controlled diffusion of the gas through while still allowing for saturation of the liquid phase with air. Less than 1 mm film thickness was required to warrant appropriate ester-air interaction and to eradicate any inconsistency in the result due to gas diffusion limitations. The unit was first temperature calibrated using indium metal (melting point of 156.6 °C) at 10 °C⋅min−1 heating rate. Dry air was harried in the unit at a persistent pressure of 3450 kPa with a scanning rate of 10 °C⋅min−1 throughout the experiment. The peak onset (To) temperature and height (Tp) were calculated from the exotherm plots whereas the induction time (It) was restrained from an isothermal scanning rate. Kinematic viscosity was measured by using Anton Paar Physical MCR 301 Rheometer Instruments (Germany). The kinematic viscosity and viscosity index (VI) were premeditated according to ASTM D 2270-93 method [32]. In a hot plate heater set at 40 and 100 °C, 1 ml of sample was used for the measurement. According to ASTM reference table, the L and H values were calculated by using the kinematic viscosity value at 100 °C. The viscosity index of USFA-TMP ester was then calculated from the L and H values, and the kinematic viscosity at 40 °C (U) by using (1):
| (1) |
2.4. Esterification reaction
Biolubricant was synthesized from the esterification reaction between USFA with high degree polyhydric alcohols, TMP according to Jumaah et al. [15]. In a flask with a reflux condenser and three necks, USFA-PFAD (0.037 mol, 104.7 g) was mixed with 1 mole trimethylolpropane (0.037 mol, 5 g) at molar ratio of 3.5:1 in Dean-Stark distillation unit. The esterification was carried out in oil bath equipped with stirrer magnetic heater at reaction temperature between 110–160 °C. At required temperature, 2% concentrated H2SO4 (as weight percentage of USFA-PFAD) was added at specific reaction time. About 20–30 mL of toluene as azeotrope distillation agent was then slowly added to the mixture during the esterification process. After the reaction end, the flask was allowed to cool at room temperature, followed with the removal of toluene by using rotary evaporator at 100 °C. The reaction product was dissolved into 100 ml of ethyl acetate and transferred into a 150 ml separation funnel. About 30 ml of saturated sodium bicarbonate (NaHCO3) was added to the separation funnel and shaken for neutralization of the remaining USFA-PFAD and acid catalyst. The funnel separator was left until two layers formed. The aqueous layer at the bottom was removed, leaving the organic layer. The organic layer was further cleaned three times with NaHCO3 solution. Subsequently, the organic layer was further washed with 20 ml of 26% saturated sodium chloride (NaCl) and 20 ml of distilled water twice to avoid formation of emulsion. Once the two layers were formed, the bottom aqueous layer was removed. The washing process was repeated until the organic layer with pH7 was obtained. Then, the sample was poured into a round flask and connected to a rotary evaporator apparatus (90–100 °C) to remove any excess toluene and unreacted alcohol. The remaining water in the sample was absorbed by sodium sulfate (Na2SO4) over night and filtered off. The ethyl acetate solvent was then removed by rotary-evaporator at 80 °C, producing a yellowish viscous liquid polyol ester product.
2.5. Experimental design and statistical analysis
Many studies used response surface methodology (RSM) to optimize of the intended procedure such as in the esterification process of the polyhydric alcohols with fatty acids. D-optimal design is one of the reliable common RSM mode of optimization. It is generated for both quantitative and qualitative factors with multi-factor experiments. It is constructed to diminish the total comprehensive variance of the predictable regression constants. As a result, the “optimality” of a specified D-optimal design is model reliant on. In this study, the optimization of esterification reactions of USFA-PFAD with TMP by using D-optimal design will be cost operative by reducing the amount of experimentation numbers. To assess the esterification reaction, the D-optimal design was applied with the Design-Expert version 11 (Stat-Ease, USA) software. Three independent variables, acid catalyst (X1), esterification time (X2), and esterification temperature (X3), The self-determining variables denoted as X1 for H2SO4 (%) concentration (as a percentage of the weight of USFA-PFAD), X2 for esterification time (h) and X3 for esterification temperature (°C) were used to conduct the RSM. This is because these variables affected the reaction response of yield % and tri-ester %. On the other hand, through the manual one factor optimization has shown that the molar ratio of reactants was insignificant affect toward the reaction responses (unpublished data). The low value ( − 1) and high value ( + 1) of X1,X2 and X3 as can be realised from Table 1 were comparable with the series set of each parameter: 1–5% for X1, 2–6 h for X2 and 110–150 °C for X3. The ester yield, Y1 (%) and composition of triester Y2 (%) as (2) and (3) were determined.
| (2) |
| (3) |
Parameters and levels for D-optimal design for the esterification reaction of the synthesized USFA-TMP
| Independent variables | Factor | Variable levels | ||
|---|---|---|---|---|
| − 1 | 0 | + 1 | ||
| H2SO4 catalyst amount (%) | X1 | 1 | 3.20 | 5 |
| Reaction time (h) | X2 | 3 | 4.38 | 6 |
| Reaction temperature (°C) | X3 | 110 | 130 | 150 |
Design of experiment runs parameters and response of the USFA-TMP synthesis of Biolubricant base stocks
| Experiment run | Variables levels, X | Responses, Y | ||||
|---|---|---|---|---|---|---|
| X1 | X2 | X3 | Y1 | Y2 | ||
| 1 | 5.00 | 4.00 | 150.00 | 92 | 89 | |
| 2 | 5.00 | 2.00 | 150.00 | 56 | 82 | |
| 3 | 1.00 | 6.00 | 110.00 | 70 | 67 | |
| 4 | 5.00 | 2.00 | 110.00 | 49 | 59 | |
| 5 | 1.00 | 6.00 | 150.00 | 91 | 94 | |
| 6 | 3.00 | 4.00 | 110.00 | 67 | 72 | |
| 7 | 5.00 | 6.00 | 110.00 | 90 | 90 | |
| 8 | 1.00 | 2.00 | 150.00 | 56 | 61 | |
| 9 | 3.00 | 6.00 | 130.00 | 82 | 75 | |
| 10 | 1.00 | 2.00 | 110.00 | 43 | 28 | |
| 11 | 4.00 | 3.00 | 130.00 | 64 | 55 | |
| 12 | 5.00 | 6.00 | 150.00 | 96 | 99 | |
| 13 | 1.00 | 4.00 | 130.00 | 69 | 40 | |
| 14 | 3.00 | 2.00 | 150.00 | 51 | 66 | |
| 15 | 1.00 | 6.00 | 110.00 | 75 | 47 | |
| 16 | 5.00 | 6.00 | 110.00 | 91 | 90 | |
| 17 | 1.00 | 6.00 | 150.00 | 93 | 93 | |
| 18 | 1.00 | 2.00 | 110.00 | 44 | 30 | |
Notes: X1 = Acid catalyst (%); X2 = Time (h); X3 = Temprature (°C); Y1 = Yield (%); Y2 = Tri-ester (%).
3. Results and discussion
3.1. Esterification reaction of USFA
Varieties of acid catalysts have been used for the esterification of plant oils/fatty acids to biodiesel or fatty acid-based esters. Heterogenous acid catalysts such as hydrophilic sulfonated silica (SiO2–SO3H) [29], heterogeneous magnetic acid catalyst of MoO3/ SrFe2O4 [30], propyl sulfonic acid-functionalized silica, SiO2–Pr–SO3H [31, 32, 33], Lewis acids such as scandium(III) triflate [34] and quaternary ammonium salts, Aliquat 336 (ionic liquid) or [
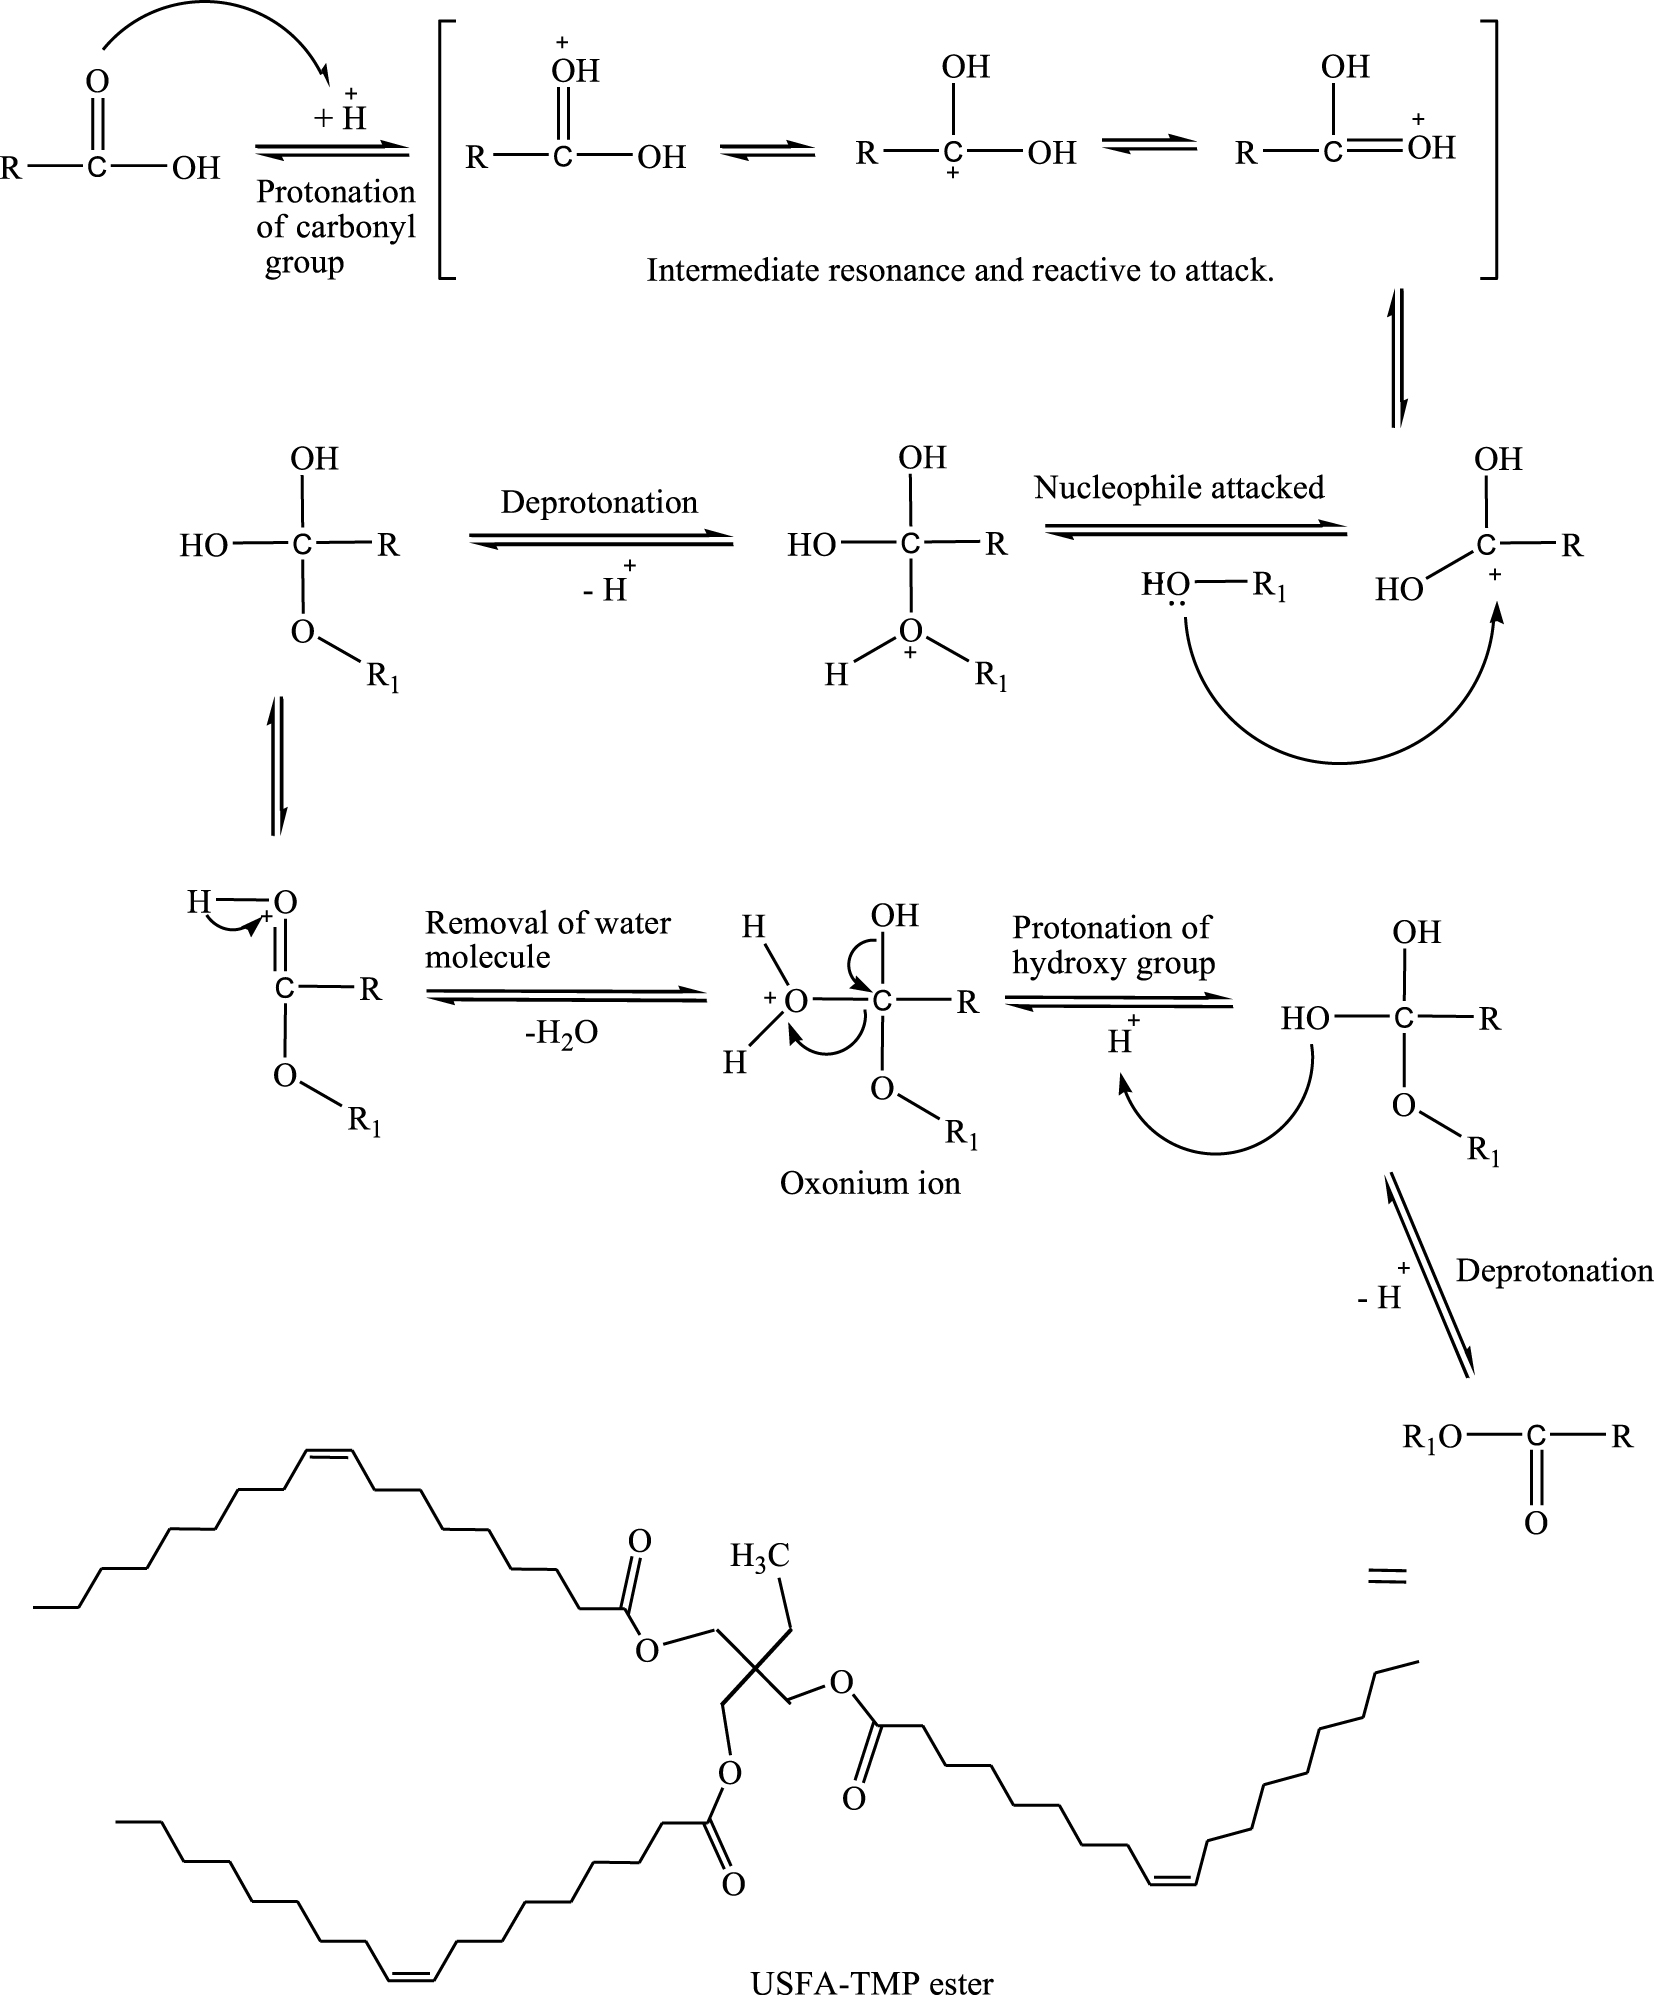
Schematic reaction of esterification to synthesis and molecular structure of USFA-TMP ester.
3.2. Response surface methodology optimization
The esterification reaction of USFA-PFAD with TMP to synthesize biolubricant was optimized by using D-optimal design of Response Surface Methodology (RSM). The percent yields (Y1) of resultant USFA-TMP ester and the percentage or selectivity (Y2) of tri-ester in the product were investigated. The possessions of dissimilar progression conditions on the responses were also optimized and determined. The response factors and values were determined via initial screening steps. In this step, parameters of acid catalyst (X1), reaction time (X2), and reaction temperature (X3) were used to represent the experimental variables, respectively. Each variable was evaluated by fluctuating their values within a lowest and highest value, as presented in Table 1. The reaction responses experimental data of the reaction yield (Y1) and tri-ester selectivity percentage (Y2) of the sample are shown in Table 2.
3.3. D-optimal design model fitting
A quadratic polynomial model signifies the relationship between the self-determining variables and the percentage of the yield of ester and percentage of tri-ester selectivity in USFA-TMP ester. The D-optimal model using the 18 experimental results data has calculated and produced basis correlation equation to estimate the variable coefficients toward the reaction responses of ester yield and ester selectivity as quote in (4) and (5).
| (4) |
| (5) |
The regression coefficients and the model’s analysis of variance (ANOVA) for the yield percent (Y1), and tri-ester selectivity percent (Y2) are shown in Tables 3 and 4, respectively. The R-squared values, which assess the response variability reduction, were based on the independent variables; a model with good fit has a high R2 correlation value. The fit of a regression model can also be assessed using the adjusted R-squared correlation [36]. The model was significant concerning Y1 and Y2, with R-squared values of 0.9522 and 0.9354, respectively. R-squared values for all responses show a respectable connection among the predicted values and the actual outcomes of the dependent variable’s resultant from the model [37].
ANOVA analysis data and a regression model for synthesis of USFA-TMP
| Responses | ANOVA value | Factors and their interaction | |||||||||||
|---|---|---|---|---|---|---|---|---|---|---|---|---|---|
| Model | X1 | X2 | X3 | X1X2 | X1X3 | X2X3 | Lack of fit | ||||||
| USFA-TMP yield | Sum of squares | 5691.4 | 232.0 | 4399.7 | 529.2 | 54.1 | 49.8 | 12.4 | 46.4 | 202.7 | 19.9 | 58.1 | |
| df | 9 | 1 | 1 | 1 | 1 | 1 | 1 | 1 | 1 | 1 | 4 | ||
| Mean square | 632.4 | 232.0 | 4399.7 | 529.2 | 54.1 | 49.8 | 12.4 | 46.4 | 202.7 | 19.9 | 14.5 | ||
| F-value | 68.76 | 25.23 | 478.40 | 57.55 | 5.88 | 5.4 | 1.35 | 5.04 | 22.04 | 2.17 | 3.75 | ||
| P-value | <0.0001 | 0.0010 | <0.0001 | <0.0001 | 0.0415 | 0.0484 | 0.2784 | 0.0549 | 0.0016 | 0.1786 | 0.1144 | ||
| Status | ∗∗∗ | ∗∗∗ | ∗∗∗ | ∗∗∗ | ∗∗∗ | ∗∗∗ | ∗∗∗ | ∗∗∗ | |||||
| R2 = 0.9522, adjusted R2 = 0.8985, predicted R2 = 0.9904, adequate precision = 14.768 | |||||||||||||
| Regression model | USFA-TMP yield | (6) | |||||||||||
| USFA-TMP selectivity | Sum of squares | 8110.8 | 1622.1 | 2770.1 | 1775.6 | 68.2 | 9.6 | 650.9 | 16.4 | 315.9 | 0.514 | 182.3 | |
| df | 9 | 1 | 1 | 1 | 1 | 1 | 1 | 1 | 1 | 1 | 4 | ||
| Mean square | 901.2 | 1622.1 | 2770.1 | 1775.6 | 68.2 | 9.6 | 650.9 | 16.4 | 315.9 | 0.514 | 45.6 | ||
| F-value | 18.74 | 33.72 | 57.59 | 36.92 | 1.42 | 0.1999 | 13.53 | 0.3400 | 6.57 | 0.0107 | 9.01 | ||
| P-value | 0.0002 | 0.0004 | <0.0001 | 0.0003 | 0.2679 | 0.6667 | 0.0062 | 0.5759 | 0.0335 | 0.9202 | 0.1539 | ||
| Status | ∗∗∗ | ∗∗∗ | ∗∗∗ | ∗∗∗ | ∗∗∗ | ∗∗∗ | |||||||
| R2 = 0.9354, Adjusted R2 = 0.8628, Predicted R2 = 0.9803, adequate precision = 11.331 | |||||||||||||
| Regression model | USFA-TMP selectivity | (7) | |||||||||||
Note X1: Catalyst amount, X2: Reaction time, X3: Reaction temperature, ∗∗∗: Significant at P < 0.05% level.
Furthermore, as regards the percentage of reaction yield (Y1), the 0.9522 R-squared value indicates that about 95% of the dissimilarity on the response can be explicated by the model, and the model did not describe only 5% of the variations. The adjusted R-squared value (adj. R-squared = 0.8985) shows that the model is noteworthy, and its value is slightly adjacent to the R-squared value of 0.9522. Also, regarding the percentage of tri-ester selectivity (Y2), the 0.9354 R-squared value indicates that 93.5% of the variation on the response can be explained by the model leaving only 6.5% of response variations not described. Meanwhile, 0.8628 was the adjusted R-squared value, showing that the model is important, and its value is somewhat close to the R-squared value of 0.9354.
The quadratic regression constant was accomplished by using a nominal squares method to envisage quadratic polynomial models for the USFA-TMP tri-ester yield (Y1) and selectivity of USFA-TMP tri-ester (Y2) as shown in Table 3. Table 3 presents the combined ANOVA data of yield of USFA-TMP tri-ester and Selectivity of USFA-TMP tri-ester. The model with sum of square value of 5691.37 for the yield (Y1) and of 8110.83 for tri-ester (Y2) showed reasonable variance to the mean value with adequate mean square of 632 and 901, respectively. The respective model F-values of 68 for yield (Y1) and 18 tri-ester % (Y2), implied that the model is highly significant. These indicated that the model can be used to elaborate on the synthesis of USFA-based trimethylolpropane tri-ester with an adequate precision of 14.768 and 11.331. The lack of fit for all models shown by F-values of 3.75 for ester yield (Y1) and 9.01 for tri-ester (Y2) that showed about 11.4% and 15.4% chance for the lack of fit due to the noise, respectively [36]. These indicate the models are insignificant relative to the pure error. Analysis of variance (ANOVA) was further achieved to determine the consequence and the fitness of the quadratic model. The final equations for yield of USFA-TMP tri-ester (Y1) and selectivity of USFA-TMP tri-ester (Y2) in a quadratic model as shown in (6) and (7), respectively. It is known that the numerical simulations have been proved to be useful to find safe and efficient operating conditions through a Pareto chart approach and tested with some laboratory experiments [38]. However, D-optimal model design used in this study use probability of seeing the observed F-value (Prob > F value) if the null hypothesis is true (there are no factor effects). Small probability values call for rejection of the null hypothesis. The probability equals the integral under the curve of the F-distribution that lies beyond the observed F-value. Prob > F value is very small (less than 0.05 by default) then the source has tested significant. Significant model terms probably have a real effect on the response. Significant lack of fit, on the other hand, indicates the model does not fit the data within the observed replicate variation.
A Prob-test was focussed to evaluate the coefficients. Vastly significant values of P (P < 0.01) were attained for the percentage yield (Y1) and (X1), (X2), and (X3), which represent the linear and quadratic forms of an acid catalyst, reaction time and reaction temperature, respectively. Meanwhile, all the variables (X1, X2, and X3) in linear and quadratic forms were also initiated to have a significant connection (P < 0.01) with the tri-ester (Y2), as shown in Table 3. Comparative to the pure error, the lack of fit of all models showed F-values of 0.1144 and 0.5394, and so is predictable insignificant [36]. Therefore, the experimental values had a respectable fit with the regression model [39].
3.4. Model adequacy check
An adequacy check was employed to check the model accuracy. This is important because a valid mathematical model with high accuracy would enhance the real process while an inaccurate model may give poor or false results [40]. The plot of adequacy check of studentized residuals against the predicted percentage of the yields of ester and the percentage tri-ester can be seen in Figure 2a and b, respectively. The studentized plots of residuals against values of fitted response show catered random distribution of points around the boundary of 0 ± 4. This earning that for all response values, the discrepancy is constant. It can, therefore, be established that the models are appropriate for application without any alterations to decrease the scatter [38].
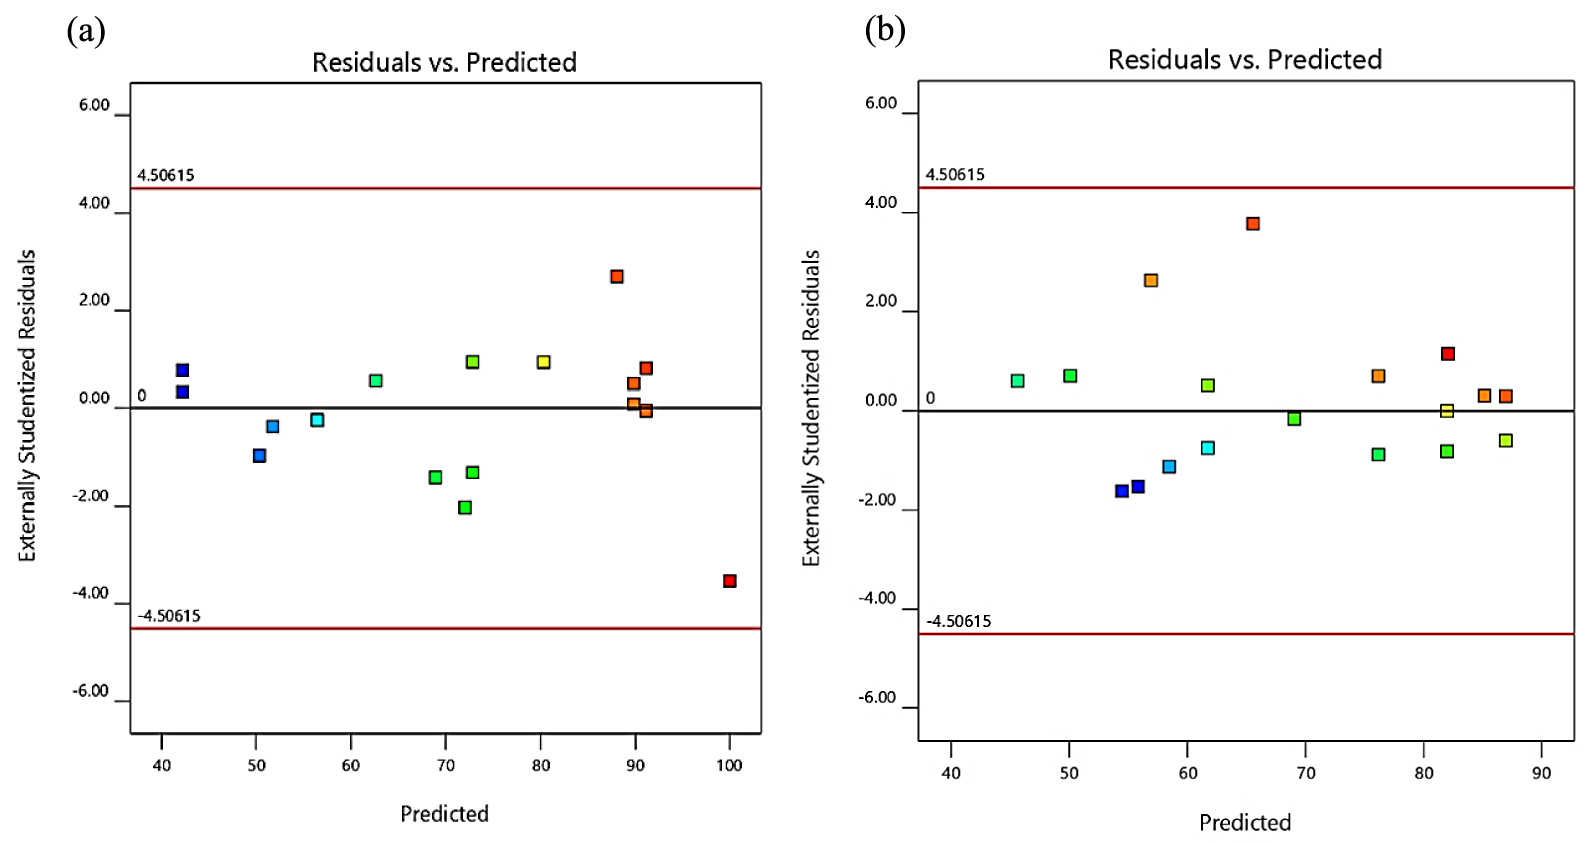
Studentized residuals against predicted value for the USFA-TMP ester percentages of the yield (a) and tri-ester (b).
Instead, the distribution of plots of the actual data compared to the predicted values of the yields of ester, and percentages of tri-ester are shown in Figure 3a and b, respectively. The preliminary experimental results in Table 2 were used as actual data, while the model provided the predicated data. It is discernible that all data points gathering around the line, which designates the models fit with the empirical data. Therefore, the models should be able to predict ester yields and the percentages of tri-ester that concur curiously with the real experimental values. This was statistically confirmed by the values of R2 and R2adj, as shown in Table 3, indicating a reliable prediction of results. Later, it was required to progress to the next stage of investigation using the optimization tool.
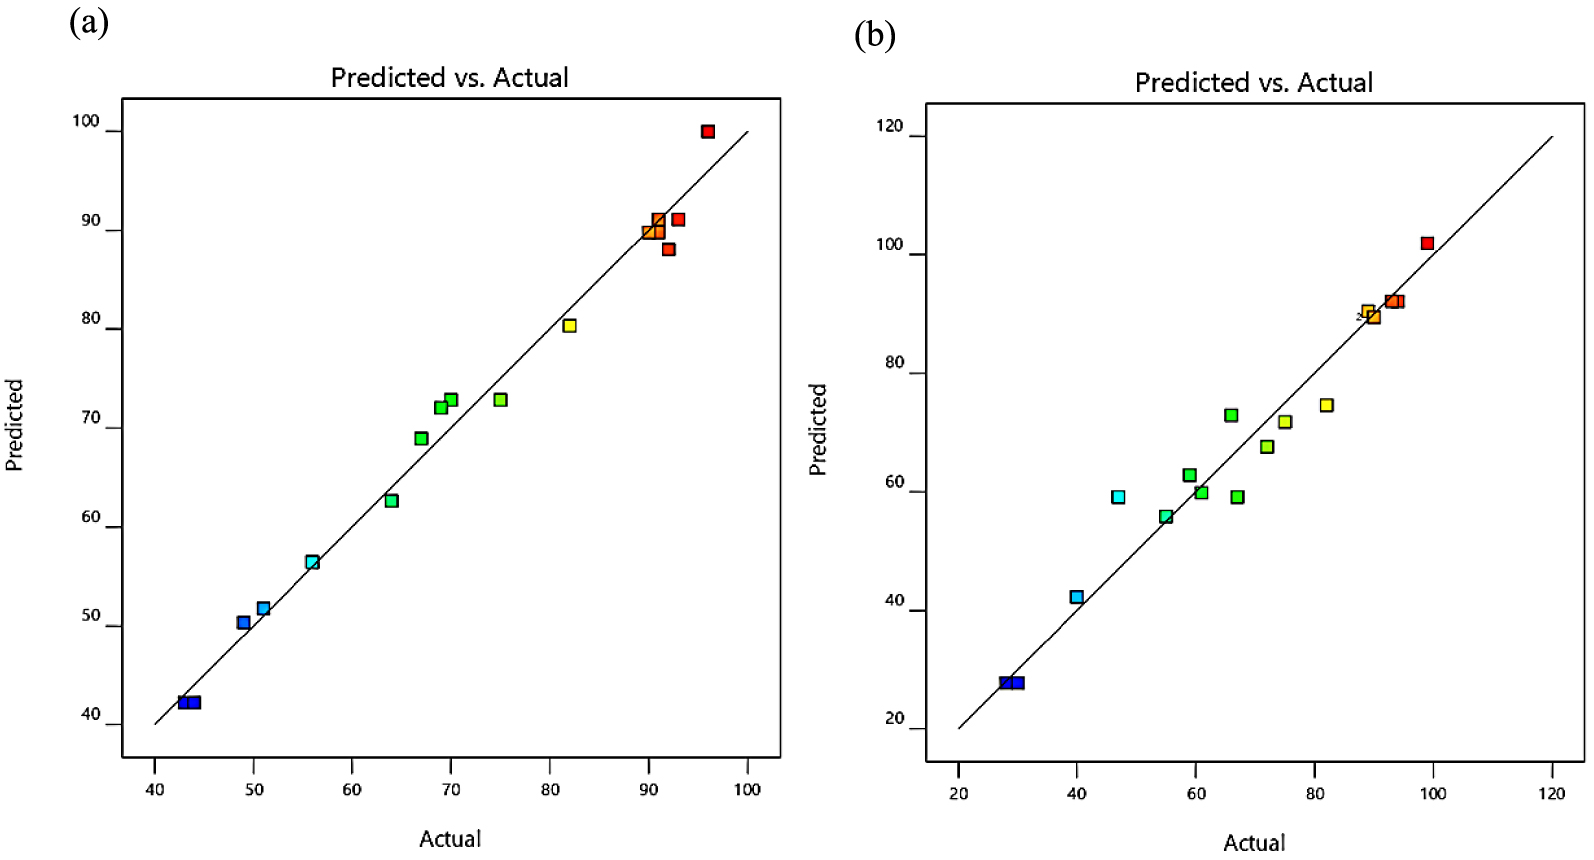
Regression plot of predicted values versus actual data of USFA-TMP ester percentages of the yield (a) and tri-ester (b).
3.5. Optimization conditions and response surface analysis
The esterification of USFA-PFAD with TMP to produce USFA-TMP ester involves many variables, the interaction of which is investigated using 3-D response surfaces and contour graphs. The response surfaces of the consequence of an acid catalyst, esterification time, and esterification temperature on the proliferation of yield percentages of ester shown in Figure 4a, b, and c and the same factor in the tri-ester as shown in Figure 5a, b, and c.
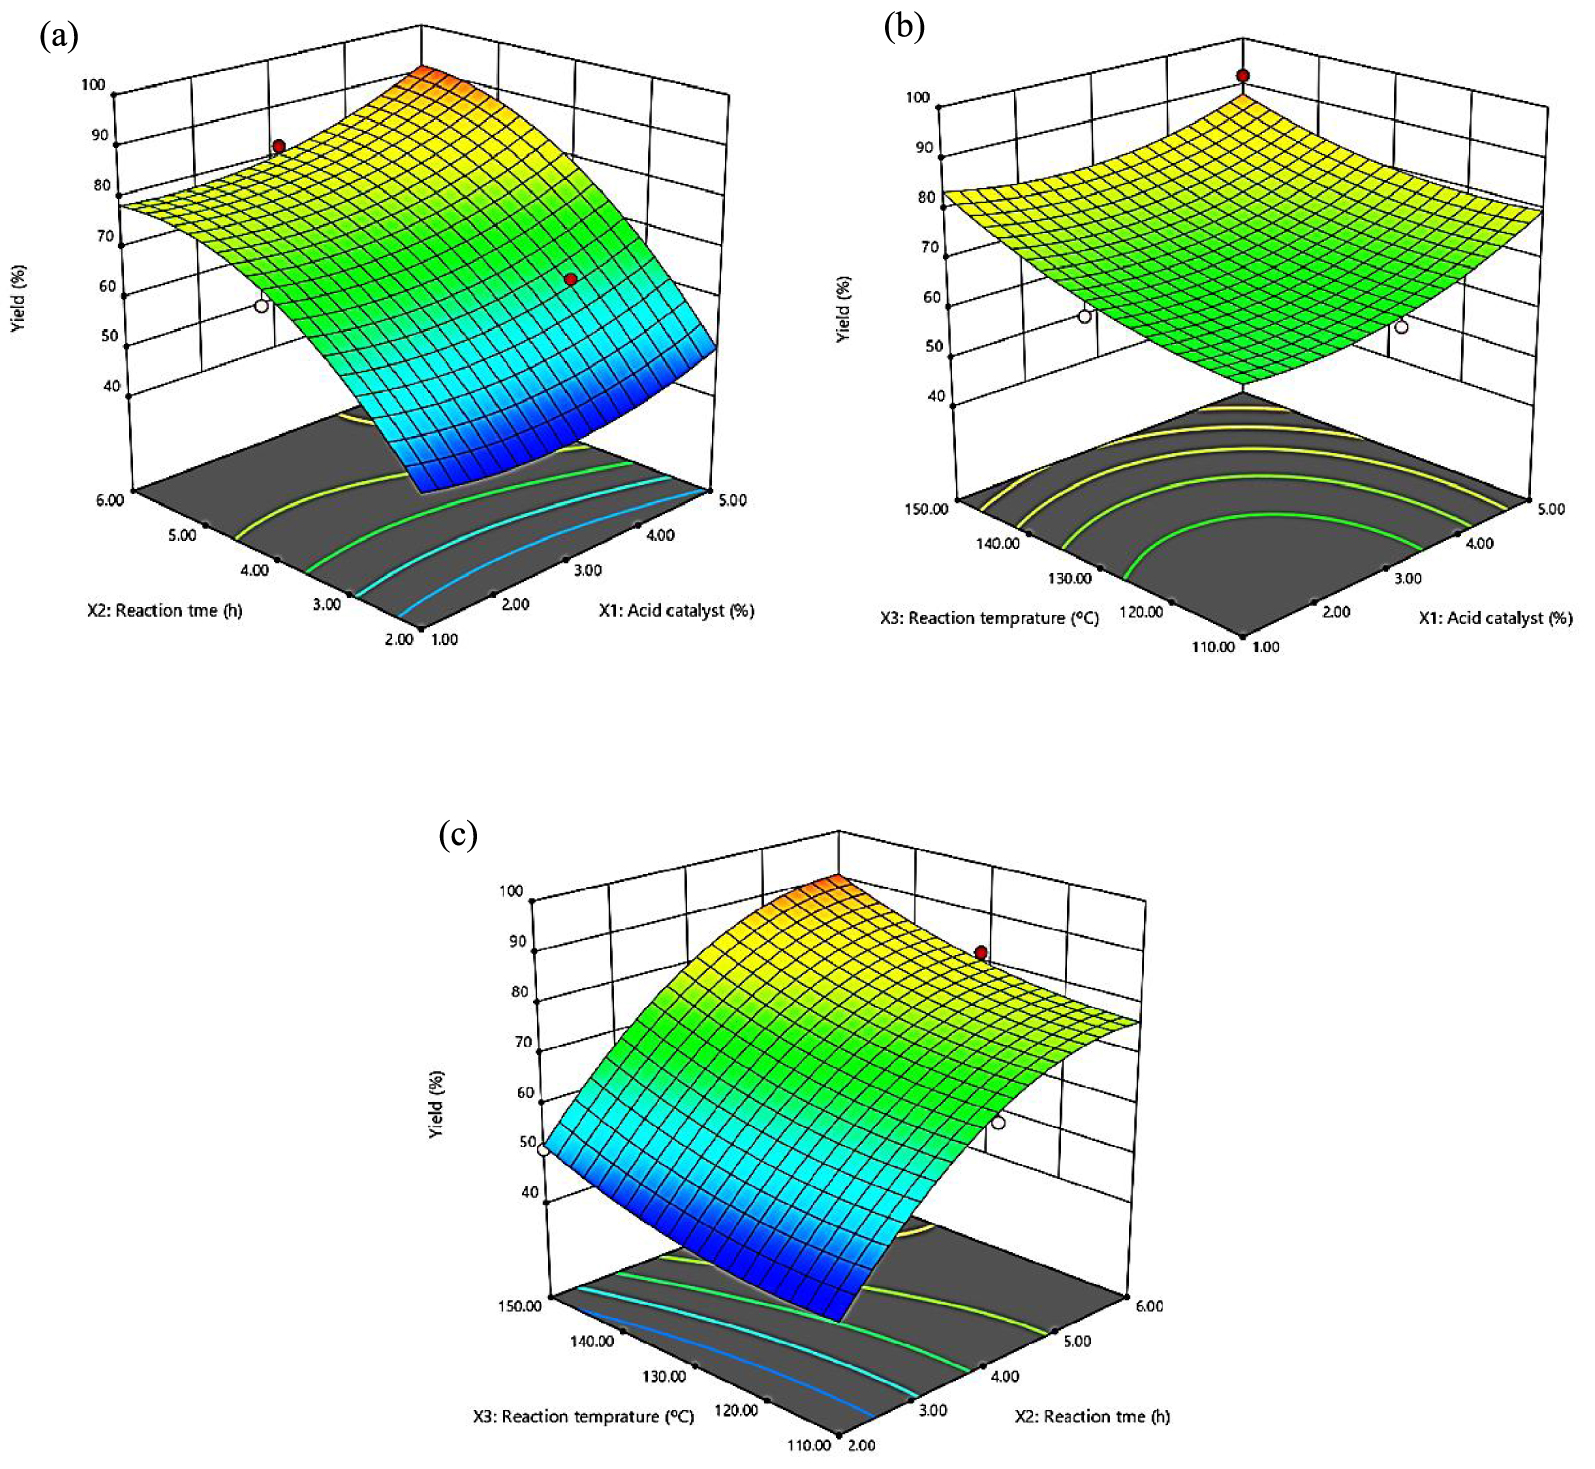
Three-dimensional response surface (3D) of yield (%) (Y1) as a function of acid catalyst (X1, %) and time (X2, h) (a), acid catalyst (X1, %) and temperature (X3, °C) (b), time (X2, h) and temperature (X3, °C) (c).
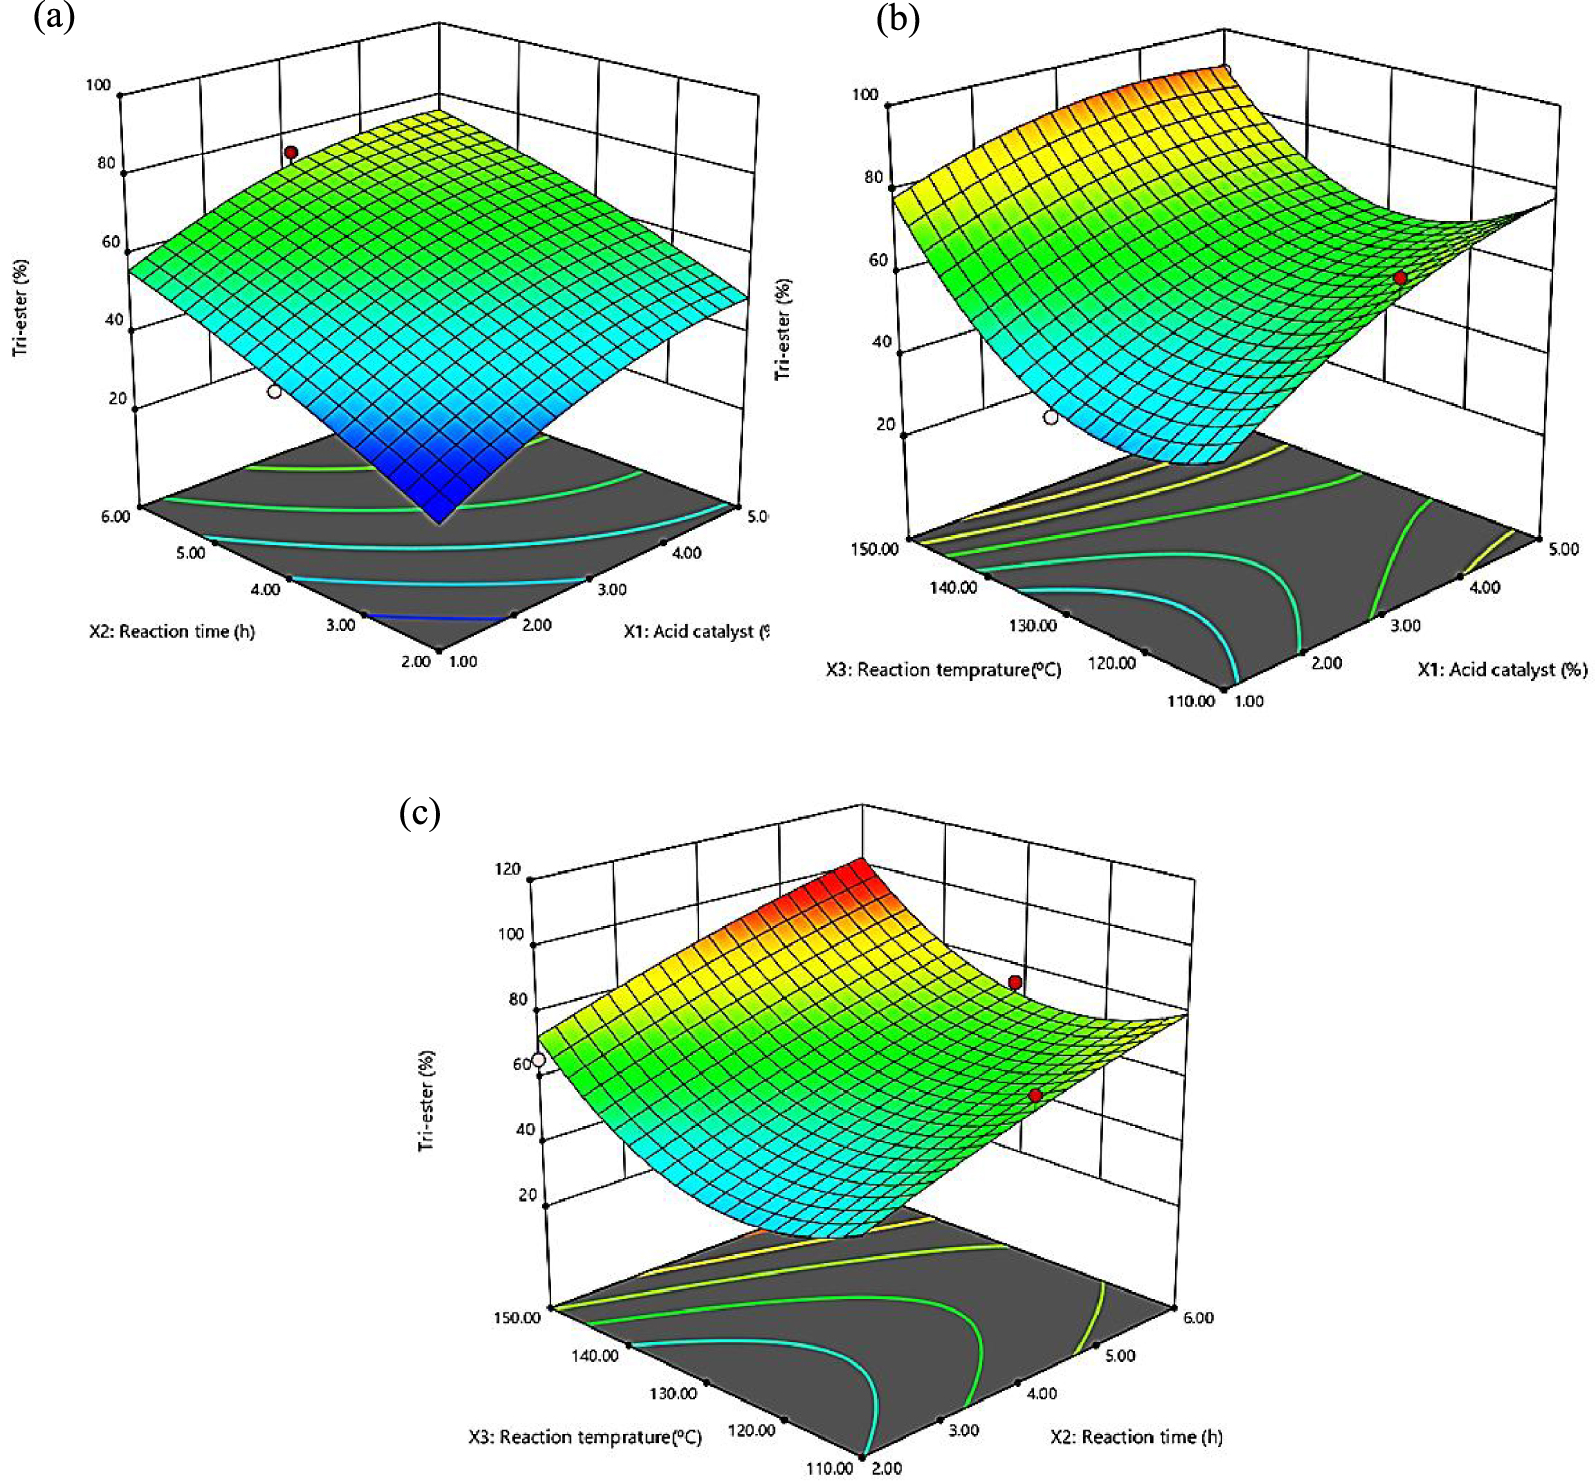
Three-dimensional response surface (3D) of tri-ester percentage (Y2) as a function of acid catalyst (X1, %) and time (X2, h) (a), acid catalyst (X1, %) and temperature (X3, °C) (b), time (X2, h) and temperature (X3, °C) (c).
The interaction effect between the acid catalyst and reaction time is presented in Figure 4a. The plot demonstrated that the ester yield % was increased from 44 to 96% with an increase in acid catalyst amount from 1 to 5%. The 3D graph shows that thoroughgoing yields % was attained at an acid catalyst of 5% and a temperature of 150 °C (Figure 4b). The combined effect of the reaction time and temperature demonstrated that the ester yield % was improved with an increase in time (Figure 4c). The results demonstrated that the determining reaction variable of both acid catalyst amount and reaction were significantly affect the ester yield %. This is in agreement with finding for di-TMP tetraester CPKO [41]. It was observed that the maximum yield at 96% was obtained at an acid catalyst amount of 5% and reaction time of 6 h.
The interaction consequence among acid catalyst and time towards the tri-ester selectivity is revealed in Figure 5a. The 3D plot displays that increasing tri-ester selectivity from 28% to nearly optimum in relation of increasing acid catalyst from 1% to 5%. In essence, the tri-ester selectivity composition percentage of USFA-TMP ester continuously improved up to 78% at 5% acid catalyst. The outcome of acid catalyst and temperature relation directed to slight increase of tri-ester % with an increase in acid catalyst and temperature (Figure 5b). The impact of reaction time and temperature also occasioned in an increase of tri-ester % up to 99.9% with an increase in the reaction time and temperature (Figure 5c). The results demonstrated that the determining reaction variable of both reaction time and reaction temperature were significantly affect the tri-ester selectivity [15]. The highest tri-ester selectivity of 99.9% was observed for reaction time of 6 h at 150 °C and 5% acid catalyst.
3.6. Validation model and confirmation of experiment
The conditions for optimality for the response variables were found, which demands the predicted model be used, so the model was validated using a desirability function. The optimal conditions include yield of ester, and the percentage of tri-ester with maximum values, as shown in Table 4 and Figure 6. A justification test was carried out to approve the rationality of the predicted model. Optimum conditions were conducted in triplicate, comprising acid catalysts of 5%, esterification time 6 h, and esterification temperature of 150 °C. As shown in Table 5, the yield of approximately 96 ± 0.5% and tri-ester 99 ± 0.9% were obtained at the optimized condition for the esterification of USFA-PFAD with TMP.
Optimization criteria for dependent variables
| Variables | Goal | Lower limits | Upper limits |
|---|---|---|---|
| Acid catalyst (%) (X1) | In the range | 1 | 5 |
| Esterification time (h) (X2) | In the range | 2 | 6 |
| Esterification temperature (°C) (X3) | In the range | 110 | 150 |
| Yield (%), (Y1) | Maximize | 43 | 96.2 |
| Tri-ester (%), (Y2) | Maximize | 28 | 99.9 |
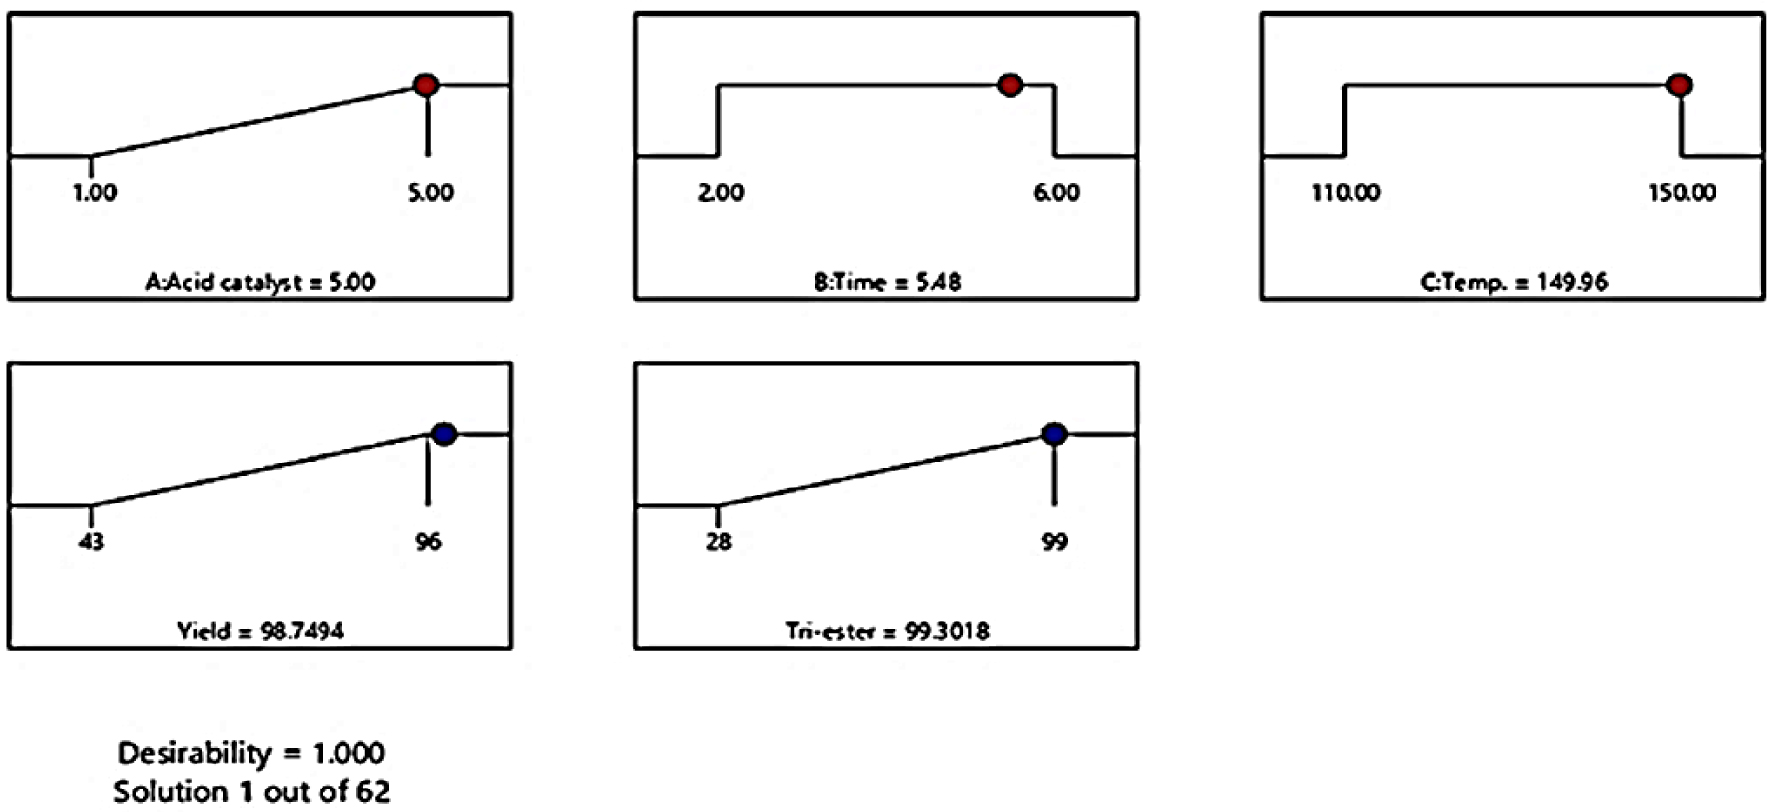
Predicted conditions to produce desirable results of dependent variables using D-optimal design.
Result of model validation at the experimental optimum condition (verification test)
| Factors | Acid catalyst, (X1) (%) | Esterification time, (X2) (h) | Esterification temperature, (X3) (°C) | Yield (Y1) (%) | Tri-ester, (Y2) (%) |
|---|---|---|---|---|---|
| Predicted | 5 | 6 | 150 | 98.1 | 99.3 |
| Actual | 5 | 6 | 150 | 96 ± 0.3 | 99 ± 0.7 |
| Manual/classical optimization | 2 | 6 | 150 | 91 ± 0.5 | 87 ± 0.5 |
Results from the study showed that the RSM optimization by using D-optimal design has high efficiency to predict and select an optimum condition for the esterification reaction between USFA-PFAD and TMP. The resultant ester yield was increased up to 96 ± 0.5% and tri-ester composition selectivity was increased up to 99 ± 0.9%. These results were par better as compare to manual optimization method where gave tri-ester yields of 91% with 87% tri-ester selectivity, respectively, as shown in Table 5.
3.7. USFA-TMP ester structural characterization
The chemical structure of optimized synthesized USFA-TMP ester was analysed and verified by using FTIR, NMR (1H and 13C) spectroscopy and GC-FID chromatography. FTIR functional group analysis was conducted to approve the accomplishment of the esterification reaction. Mainly FTIR was used to verify the existence of ester carbonyl functional group and the disappearance of acid carbonyl functional group (mainly from oleic and linoleic acids). Due to the resemblance of ester chemical structure, the FTIR spectrum of each of the carbonyl ester exhibits a similar pattern at the same wave number.
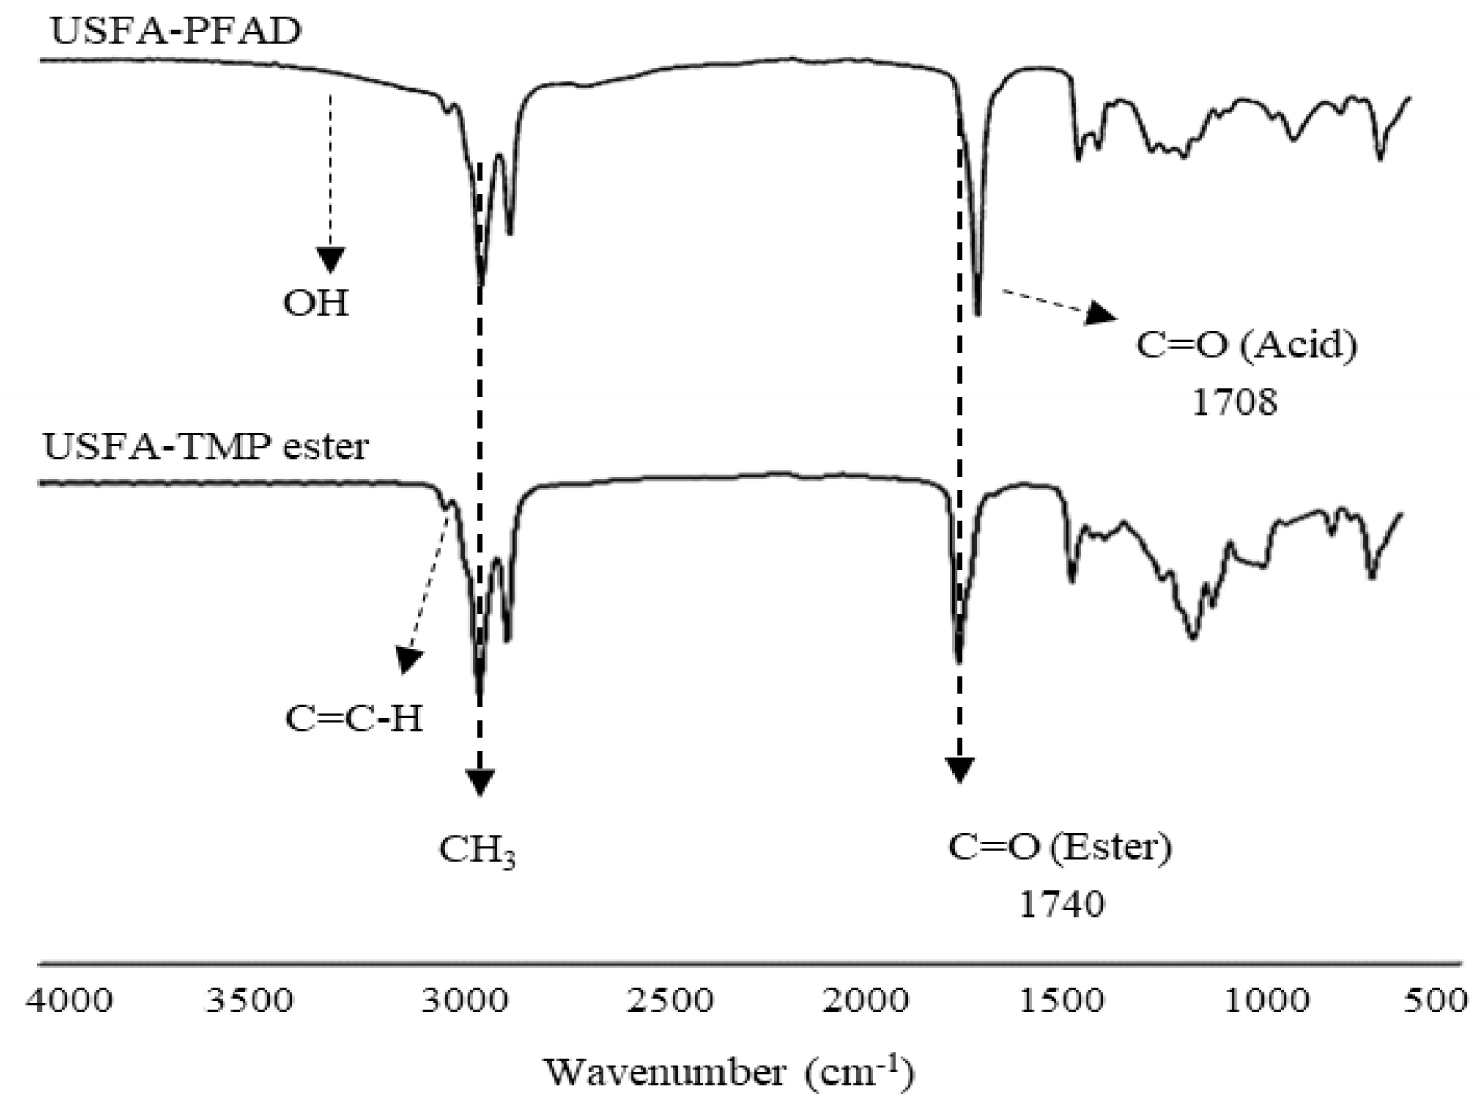
FTIR spectra of USFA-PFAD and synthesized USFA-TMP ester.
Figure 7 displays the FTIR spectra of USFA-TMP ester and USFA-PFAD starting material. The unsaturated aliphatic carbon atoms of fatty acid or ester manifest peaks at 3003–3010 cm−1. The unsaturated alkene carbon atoms of USFA-PFAD and USFA-TMP ester are manifested the peak at 3008 cm−1 correlating to the unsaturation −C=C–H bond. The acid carbonyl group (C=Oacid) of USFA-PFAD displayed a peak that appeared at 1704 cm−1. As the USFA-PFAD underwent esterification, the resultant product USFA-TMP ester produced a peak at 1740 cm−1 of the ester carbonyl group stretching vibrations (C=Oester). It can be observed that the unreacted alcohol and acids had disappeared from the final product (ester). The ester spectrum showing that there were no peaks for stretching vibrations of alcohol (OH) and stretching vibrations of acids (–COOH). This distinguishable difference (complete disappearance peak at 1704 cm−1 and the appearance peak at 1740 cm−1) verifies that the given reaction conditions have resulted in a complete esterification process toward USFA-PFAD production. Meanwhile, the visible bands at 1237–1161 cm−1 and 2921–2852 cm−1 represent the stretching vibration of C–O and the −CH3 groups, respectively.
Highly valuable techniques of 1H and 13C NMR spectra analysis have great advantage and benefit toward the chemical structure prediction. The combination of the outcomes from FTIR with 1H and 13C NMR spectra analysis further prove the success of the esterification reaction. The 1H and 13C NMR spectra of USFA-TMP ester are indicated by Figures 8 and 9, respectively. The disappearance of the 1H chemical shift of the proton (H) of the carboxylic acid group (–COOH) at 11.0 ppm, and for the alcohol group (–OH) at 4.7 ppm [42], confirmed the success of the esterification reaction. 1H chemical shift ranges for aliphatic protons ( −CH2) was detected, normally at about 1.25–1.56 ppm. However, the two protons of the −CH2–O–C=O ester group shift appeared at about 3.80 to 4.0 ppm [43].
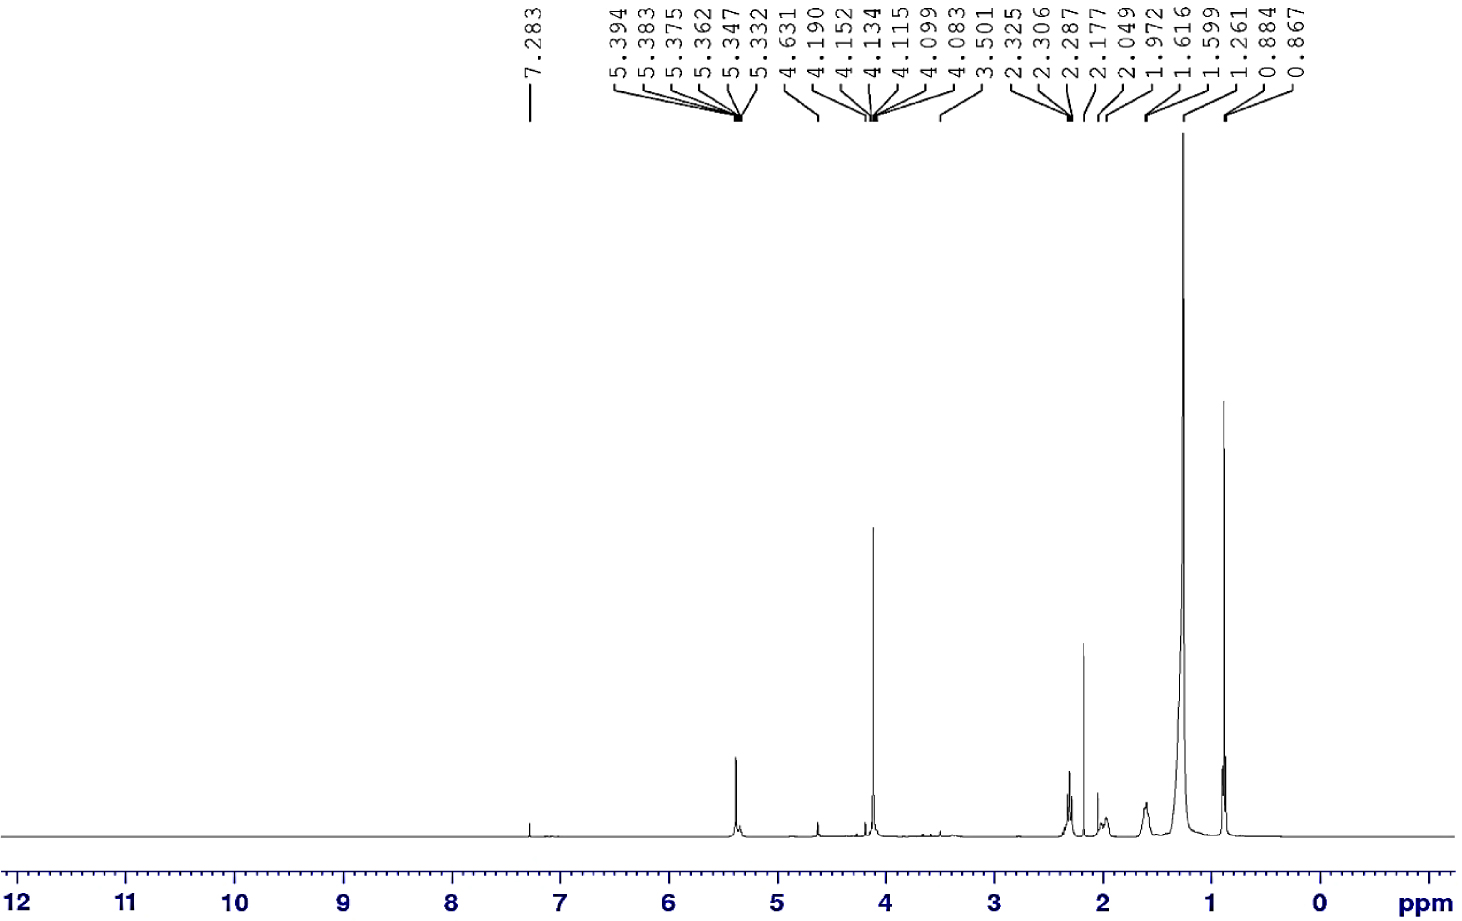
1H NMR spectrum of USFA-TMP ester.
13C NMR spectrum of USFA-TMP ester.
The fatty acids of USFA-PFAD mixture are dominated by oleic acid (76%) and linoleic acid (17%) [25]. It is plausible to predict that the same fatty acid acyls groups recompose in USFA-TMP ester as shown in Table 6. Alkene functional groups can be identified to determine the present of unsaturated fatty acids. The methylene proton signal (–CH–CH–) was lifted to lower frequency at 5.32–5.38 ppm, representing the unsaturated fatty acids in USFA-TMP ester [44].
The fatty acids composition of USFA and USFA-TMP ester
| Fatty acids | USFA | USFA-TMP ester |
|---|---|---|
| Myristic acid C14:0 | 0.5 | 0.2 |
| Palmitic acid C16:0 | 6.2 | 6.0 |
| Stearic acid C18:0 | 0.5 | 0.3 |
| Oleic acid C18:1 | 75.6 | 76.5 |
| Linoleic acid C18:2 | 17.2 | 17 |
| ∑ Saturated fatty acid | 7.2 | 6.5 |
| ∑ Unsaturated fatty acid | 92.8 | 93.5 |
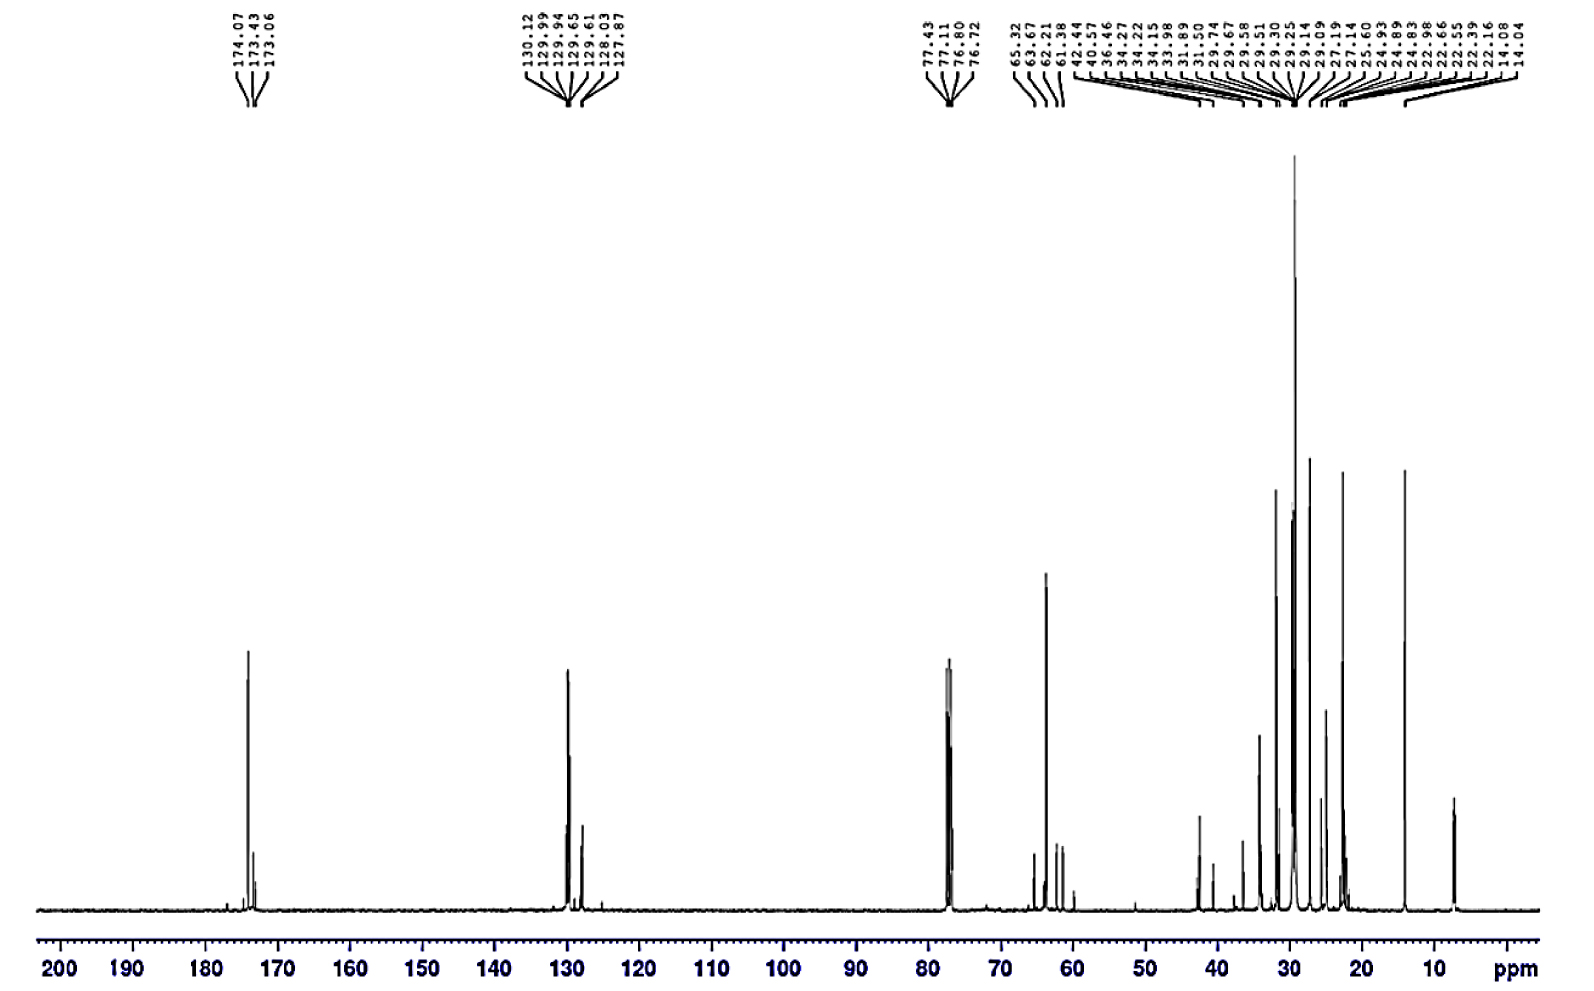
The 13C NMR spectrum of USFA-TMP ester is shown in Figure 9. The signal at 171.09–174.07 ppm designates the ester carbonyl (C=Oester) in USFA-TMP ester. A comparable result assigning a chemical shift of 170–185 ppm to ester carbonyl (C=O) at palm-based polyurethane Awang et al. [42]. A peak at 60.32–64.14 ppm, signalling −CH2–O–CO–R for carbon atom devoted to the TMP alcohol. Another characteristic signal was observed at 127.87–130.12 ppm, which denotes to the unsaturated carbon atoms (C=C) of unsaturated fatty acids in USFA-TMP ester. Furthermore, a signal at 40.57–42.44 ppm was found to resemble to the quaternary carbon atom of TMP [45]. The aliphatic carbon chain atoms of −CH2 peaks were identified from 22.16–36.46 ppm. It is denoting common saturated alkyl chain presence in organic compounds [46]. The terminal methyl ( −CH3) peak appeared at 14.04–14.08 ppm.
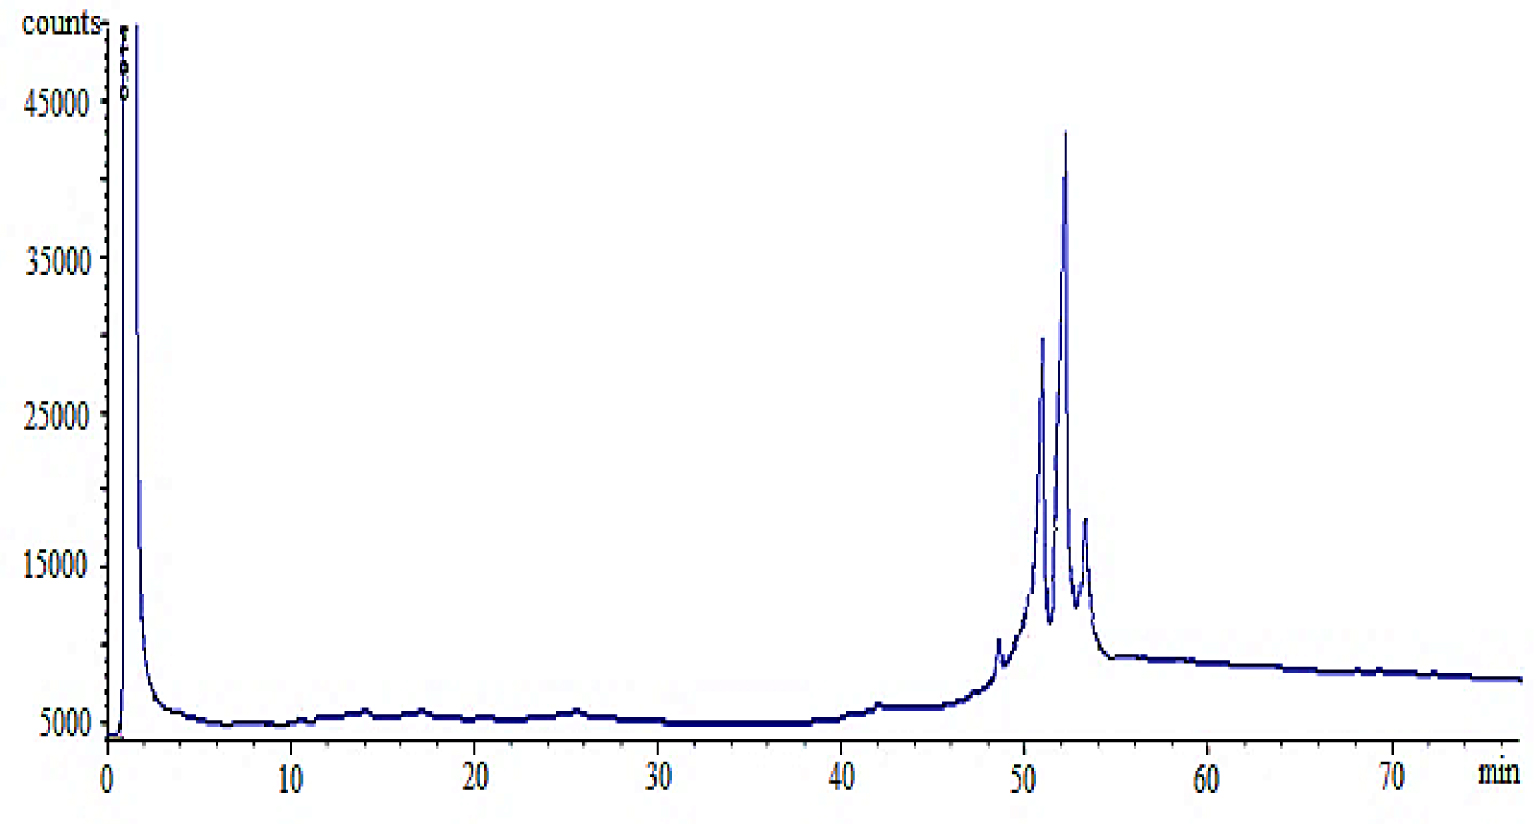
High temperature column GC-FID Chromatography of USFA-TMP ester.
In this study, USFA-TMP ester was synthesized and ester chemical composition was identified. Three advanced reactions have happened throughout the esterification of USFA-PFAD with TMP that elaborate the intermediate establishment of mono-ester, di-ester and tri-ester, which was associated to the three –OH groups in TMP. The final tri-ester composition was determined by using high-temperature column GC-FID analysis. Figure 10 shows the GC chromatogram of resultant USFA-TMP ester. The tri-ester peaks starting to appear at 51.20 min retention time (Rt) up to Rt 72 min. The results show a 99.9% major tri-ester composition indicating the successful conversion of the three OH functional groups in TMP to USFA-TMP ester group [48].
3.8. USFA-TMP ester lubrication properties
3.8.1. Viscosity and viscosity index
The viscosity index was attained according to ASTM D 2270 where the kinematic viscosity at 100 °C was used to find the L and H values right from the ASTM reference table [49]. The viscosity index was then calculated on the source of L and H. As shown in Table 7, USFA-TMP ester has a kinematic viscosity of 43.7 cSt at 40 and 100 °C, USFA-TMP ester has 9.83 cSt kinematic viscosity. These values would remark USFA-TMP in the range of ISO viscosity grade (VG) 46 mineral oil, those obligatory for high-temperature applications such as hydraulic oil and compressor oil [50]. It is intriguing to find that USFA-TMP ester possess viscosity index (VI) of 163 that similar to a commercial Mobil hydraulic ISO 46, but higher than other commercial lubricants such as Polyalphaolefin 8 (PAO8) of 136, Paraffin ISO VG 46 of 102, and ISO VG 32 of >90 [51]. The higher the viscosity index, the better the lubricant. So far, USFA-TMP can be perceived as high-quality biolubricant with regards to the viscosity index.
Lubrication properties of USFA-TMP ester and commercial lubricants
| Esters/Lubricants | KV @ 40 °C (cSt) | KV @ 100 °C (cSt) | VI | OST, °C | PP, °C | FP, °C | ISO VG | FC @ 40 °C | FC @ 100 °C |
|---|---|---|---|---|---|---|---|---|---|
| USFA-TMP | 43.7 ± 0.5 | 9.13 ± 0.6 | 163 | 215 ± 3 | − 42 ± 2 | 298 ± 2 | 46 | 0.22 | 0.20 |
| TMP triolate∗ | 68.0 ± 0.6 | 12.5 ± 0.3 | 189 | 213 ± 2 | − 41 ± 3 | 300 ± 2 | 68 | 0.25 | 0.21 |
| PE tetraolate∗ | 65.0 ± 0.3 | 14 ± 0.6 | 185 | 252 ± 4 | − 30 ± 2 | >300 | 68 | N/A | N/A |
| Mobil hydraulic ISO VG 68 | 68.4 ± 0.6 | 11.7 ± 0.5 | 135 | N/A | − 38 ± 5 | 241 ± 6 | 68 | N/A | N/A |
| Mobil hydraulic ISO VG 46 | 45.6 ± 0.5 | 8.45 ± 0.5 | 165 | N/A | − 43 ± 4 | 232 ± 5 | 46 | N/A | N/A |
| SubsTech hydraulic oil ISO VG 46 | 46.3 ± 0.7 | 6.94 ± 0.6 | 106 | N/A | − 38 ± 2 | 241 ± 2 | 46 | 0.31 | 0.28 |
| Denicol compressor oil ISO VG 46 | 45.7 ± 0.6 | 6.8 ± 0.7 | 103 | 198 ± 3 | − 23 ± 3 | 237 ± 4 | 46 | 0.40 | 0.31 |
| Maxoline turbine oil R&O, ISO 46 | 46 ± 0.4 | 6.7 ± 0.5 | 98 | 210 ± 4 | − 30 ± 2 | 213 ± 2 | 46 | 0.25 | 0.23 |
∗Source [47].
Notes: KV = Kinematic viscosity; VI = Viscosity index; PP = Pour point; FP = Flash point; OST = Oxidative stability temperature; ISO VG no. = International standards organization viscosity grade number; FC = Friction coefficient.
The lubricants kinematic viscosity in the range of 5–15 cSt at 100 °C is obligatory for industrial applications usage. Generally, most polyol esters hold kinematic viscosities in the range between 5 and 225 cSt at 40 °C and 2–20 cSt at 100 °C to give a good viscosity index [52]. The viscosity index also be contingent on the length of the fatty acids in their molecular structure. It upsurges with longer linear C-chain length and higher degree of unsaturation, but less branched in the structure [53].
3.8.2. Pour point
The pour point is the utmost vital low-temperature property of any polyol ester used as a lubricant. It is demarcated as the lowest temperature at which a liquid polyol ester remains pourable (i.e., the ester liquid performs as a fluid) [54]. The pour point of USFA-TMP ester was restrained in accordance with ASTM D97 and are brief in Table 7. The obtained pour point of USFA-TMP was −42 °C. The low pour point was probably due the molecular structure of the polyol esters, which composes about 94% unsaturated fatty acids. However, the pour point of USFA-TMP with high degree of unsaturation was lower compared to many commercial lubricants as shown in Table 7. This could be due to more effective interruption of the close-fitting molecular padding at low temperature. Polyol esters with short-chained saturated fatty acids (C4–C12), high unsaturated fatty acids, and high number branching are exceedingly good and appropriate for application in low functioning temperatures, predominantly as winter automotive engine oils [50, 55]. Polyol esters with low pour points are best suited for hydraulic systems and machine device applications [56].
3.8.3. Flash point
The flash point should be high enough to warrant safe operation with high fire resistance and lowest volatilization at the extreme operational temperature [57]. The flash point of USFA-TMP is relatively high, 298 °C compare to other commercial lubricants such as SubsTech hydraulic oil ISO VG 46 and Mobil hydraulic ISO VG 68 (Table 7). This is owing to its high molecular weight of carbon chain C18 fatty acids and number of ester functional groups [47]. The high flash point (298 °C) would make USFA-TMP ester practical to be used as engine oil at high temperature. Esters with a flash point of ⩾165 °C are suitable as hydraulic oils [58].
3.8.4. Oxidative stability
Another important property of biolubricants is the ability of a constituent to resist oxidative degradation. The oxidative stability of USFA-TMP ester was screened to measure it’s an onset (To) exothermic peak corresponding to oxidation stability temperature (OST) by using PDSC. To was premeditated from a plot of heat flow (W/g) versus temperature generated by the sample upon degradation [5]. Higher OST temperature reflects a greater degree to sustain against oxidation and evaporation [58]. The effects of evaporation designated by tailing, split peaks, and change in baseline were due to loss of sample mass in the DSC thermogram. These effects were apparent at temperatures higher than the initial oxidation peak. The OST temperature indicating the thermal oxidation degradation of USFA-TMP was observed starting at temperature of 215 °C. This remark is in agreement with finding by Wu et al. for triolate-TMP (213 °C) [59]. This moderately low thermal oxidation stability compared to many commercial lubricants is due to USFA-TMP contains high unsaturated fatty acids about 94%. The esters with excellent oxidative stability have a tendency to work better under high temperatures and extreme environments [47]. However, the overall lubrication properties of USFA-TMP are excellent as shown in Table 7. These results indicated that USFA-TMP ester is suitable for biolubricant at moderate temperature operating condition and at high temperature operating with anti-oxidants addition.
In general, the results are indicative that the USFA-TMP ester has good lubrication properties. The comparison of USFA-TMP ester to its starting material USFA-PFAD creating them as a good contender for the green biolubricant. The results showed that the separation of USFA-PFAD and followed by the esterification reaction with TMP are the modification process that might appreciably adopted to produce high-end product such as biolubricant base stocks. USFA-TMP ester is thus of plausible to be used in formulating a suitable green biolubricants for both cold and warm climates and tropical such as Malaysia, South East countries etc.
4. Tribological analysis
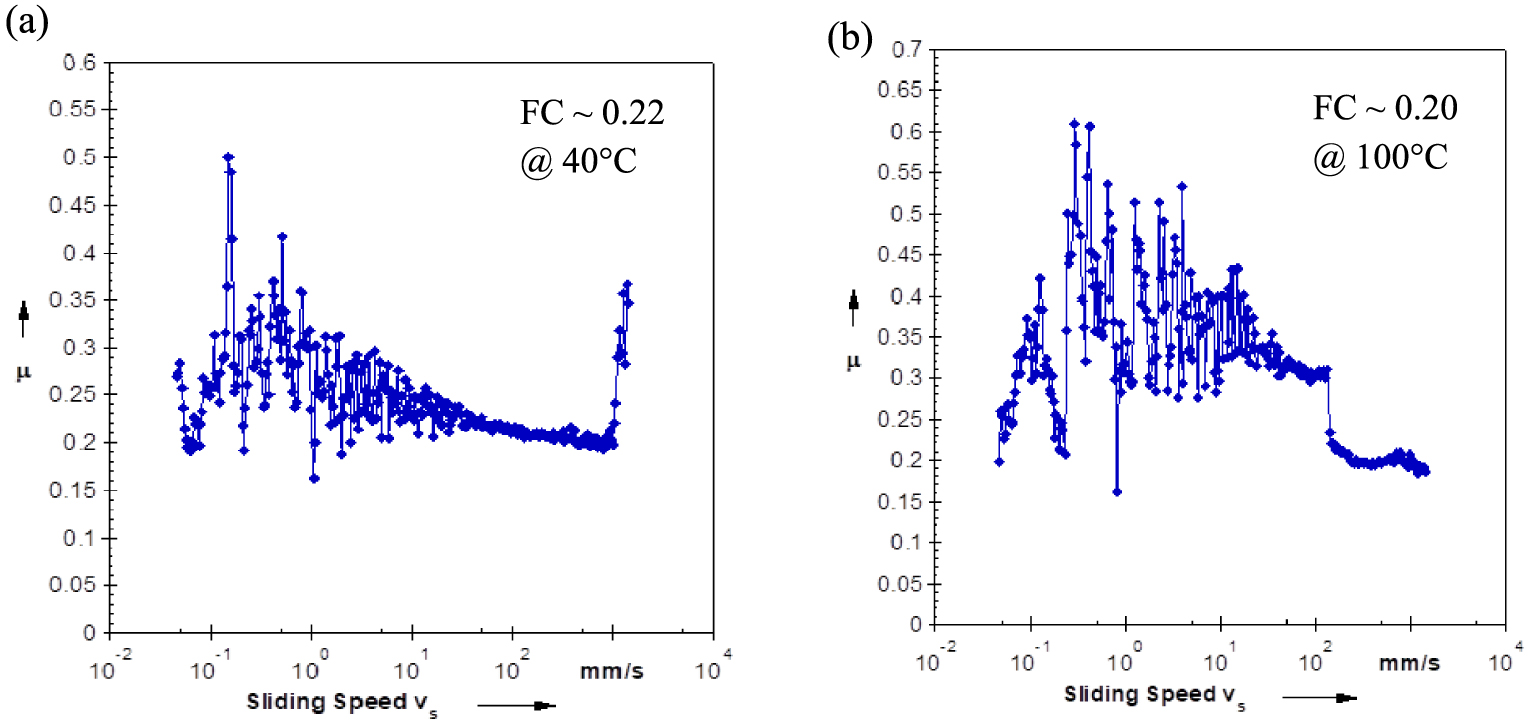
Effect of the sliding speed on the FC at 40 and 100 °C of USFA-TMP ester.
The interactions of the biolubricant with any moving metal surfaces are depend on the its tribological performances. The biolubricants performance of under boundary or hydrodynamic lubrication environments highly count on their chemical composition and molecular structures. The existence of polar head and nonpolar straight-chain carbon tail groups in their molecular structure of the synthesized esters ended them amphiphilic characteristic in nature. Therefore, most esters can be worked as boundary lubrication condition. Adsorption of the polar head groups on a metal surface will minimize the surface energy and causes a decrease of the friction coefficient (FC) [60]. In turn, polarity of the biolubricant upsurges its effectiveness in reducing wear. The results of this study showed that USFA-TMP ester designated a minimum FC for the hydrodynamic conditions at 40 °C of 0.22 whereas at 100 °C was 0.20 as shown in Figure 11. It exhibited lower coefficient of friction values compared to of SubsTech Hydraulic Oil ISO 46, Denicol Compressor Oil ISO 46 and Maxoline Turbine Oil R&O, ISO 46 lubricants (Table 7). The biolubricant USFA-TMP ester logged a low friction coefficient below 0.5 at 40 and 100 °C as recommended for commercial lubricants [61]. The chemical composition and molecular structure of USFA-TMP ester with high polarity has high propensity to form an adsorbed shielding layer on the metal surfaces. This is good characteristic quality of tribological properties and is able to participate with many commercial lubricants in the market.
5. Rheological properties
The rheological property of the USFA-TMP ester was identified through its connection between shear stress and shear rate. The classification either as Newtonian or non-Newtonian fluids depends on their viscosity behaviour when shear rate increase. The ester is classified as Newtonian fluid when the relationship is linear as shear rate increase. On the other hand, non-linear or inconstant viscosity when shear rate increase is known as non-Newtonian [61, 62, 63]. Figure 12 shows a linear relationship between shear stress and shear rate (a) and a constant viscosity against shear rate (b) at regions of 10–100 s−1. This indicates that USFA-TMP ester shows a Newtonian fluid characteristic. The viscosity of USFA-TMP ester will not change as the shear stress increases and would be working well in the hydrodynamic lubrication environment.
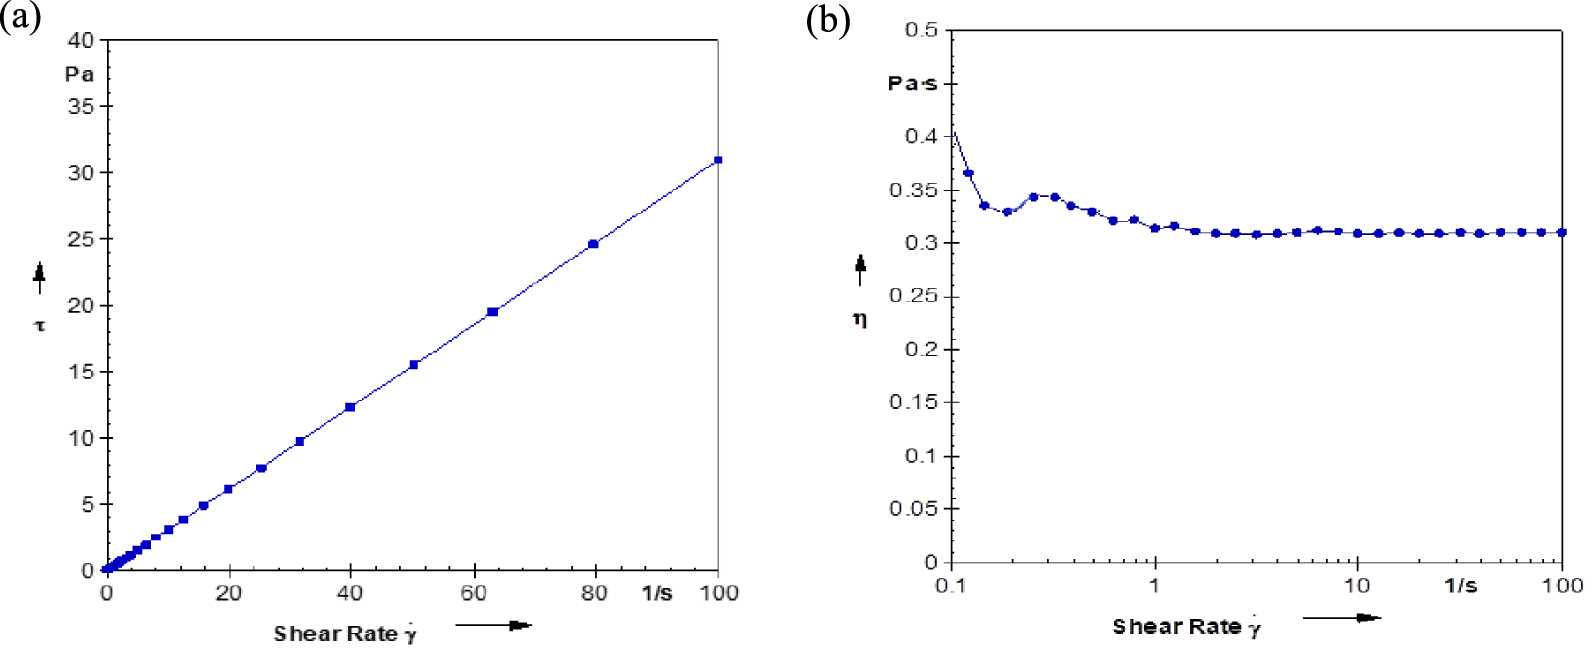
Shear rate plot versus (a) shear stress (b) viscosity of USFA-TMP ester at 25 °C.
6. Conclusions
The D-optimal approach was successfully used for optimization of the esterification of USFA PFAD with TMP to produce resultant polyol ester of USFA-TMP. The possessions of the interactions between self-determining variables on the USFA PFAD with TMP esterification were successfully investigated. The ANOVA results confirming a constancy among the predictions results from the model and the experimental data. The study results established that the determining reaction variable of both acid catalyst amount and reaction were significantly affected the ester yield % whereas both reaction time and reaction temperature were significantly affected the tri-ester selectivity. The optimal condition for the esterification was obtained at reaction temperature of 150 °C for 6 h and with 5% H2SO4. The USFA-TMP was successfully produced in high yields (96 ± 0.5%) with high selectivity of tri-esters (99 ± 0.9%). The resultant USFA-TMP ester shows good lubrication properties such as high VI, low PP, high FP as well as good thermal oxidative stability. It is classified as a Newtonian fluid with viscosity grade lubricant ISO VG 46. The resultant USFA-TMP ester is credible to be used as green biolubricant in many industrial applications.
Conflicts of interest
Authors have no conflict of interest to declare.
Acknowledgments
The authors would like to thank the Universiti Kebangsaan Malaysia for providing laboratory facilities and the financial support through the research grant no. GUP-2016-058 and Sime Darby ST-2014-019.