


 CC-BY 4.0
1. Introduction
An analysis of the medical literature indicates clearly an ubiquity of microcrystalline pathologies [1, 2, 3, 4, 5, 6, 7] in human which encompass several major diseases such as cancer [8, 9, 10], cardiovascular [11, 12, 13], infection [14, 15, 16, 17, 18, 19] as well as genetic [20, 21, 22, 23, 24, 25, 26] disorders. It should be kept in mind that abnormal deposits in human tissues may have endogenous as well as exogenous origin [27, 28, 29].
Among the different microcristalline pathologies [1, 2, 3, 4, 5, 6, 7], urolithiasis is probably the most popular. Epidemiological surveys of urolithiasis have shown that in economically developed countries the prevalence rate ranged between 4% and 20% [30, 31, 32, 33]. As noticed by Trinchieri [34], in the latter part of the 20th century prevalence and incidence of upper urinary tract stones were still increasing in Western countries probably resulting from improvements in clinical-diagnostic procedures and changes in nutritional and environmental factors.
In the service des explorations fonctionnelles of the Tenon hospital, 3000 kidney stones are analyzed each year following the morpho-constitutional stone analysis described four decades ago [35, 36, 37, 38, 39, 40, 41]. In short, the standardized protocol comprises two steps:
- First, a stereomicroscope (magnification ×10–40) is used to examine the surface and section of the calculus, with the identification of the nucleus (or core) and to observe the inner organization. For each stone, the size, the form, the color, the aspect (smooth, rough or spiky) of the surface, the presence of a papillary imprint (umbilication), the presence of Randall’s plaque, the aspect of the section (well organized with concentric layers and/or radiating organization, or poorly organized and loose structure) and location and aspect of the nucleus is considered.
- Second, an analysis is performed by Fourier Transform InfraRed (FTIR) [42, 43, 44, 45] of a sample of each part of the calculus (nucleus, mid-section and surface), whenever allowed by the size of the stone, and in all cases, the determination of the global proportion of components in a powdered sample of the whole stone [46, 47, 48, 49].
Biopsy from a graft kidney in a patient suffering from primary hyperoxaluria (B274). (a) Optical photography, and (b) spatial distribution of calcium oxalate monohydrate (COM) deposits in the biopsy as given by the intensity of the infrared spectrum (c) at 780 cm−1. The red cross in (b) represents the biopsy point analyzed in (c) by μFTIR. We have indicated the lateral resolution (RL) at the beginning and the end of the IR spectrum.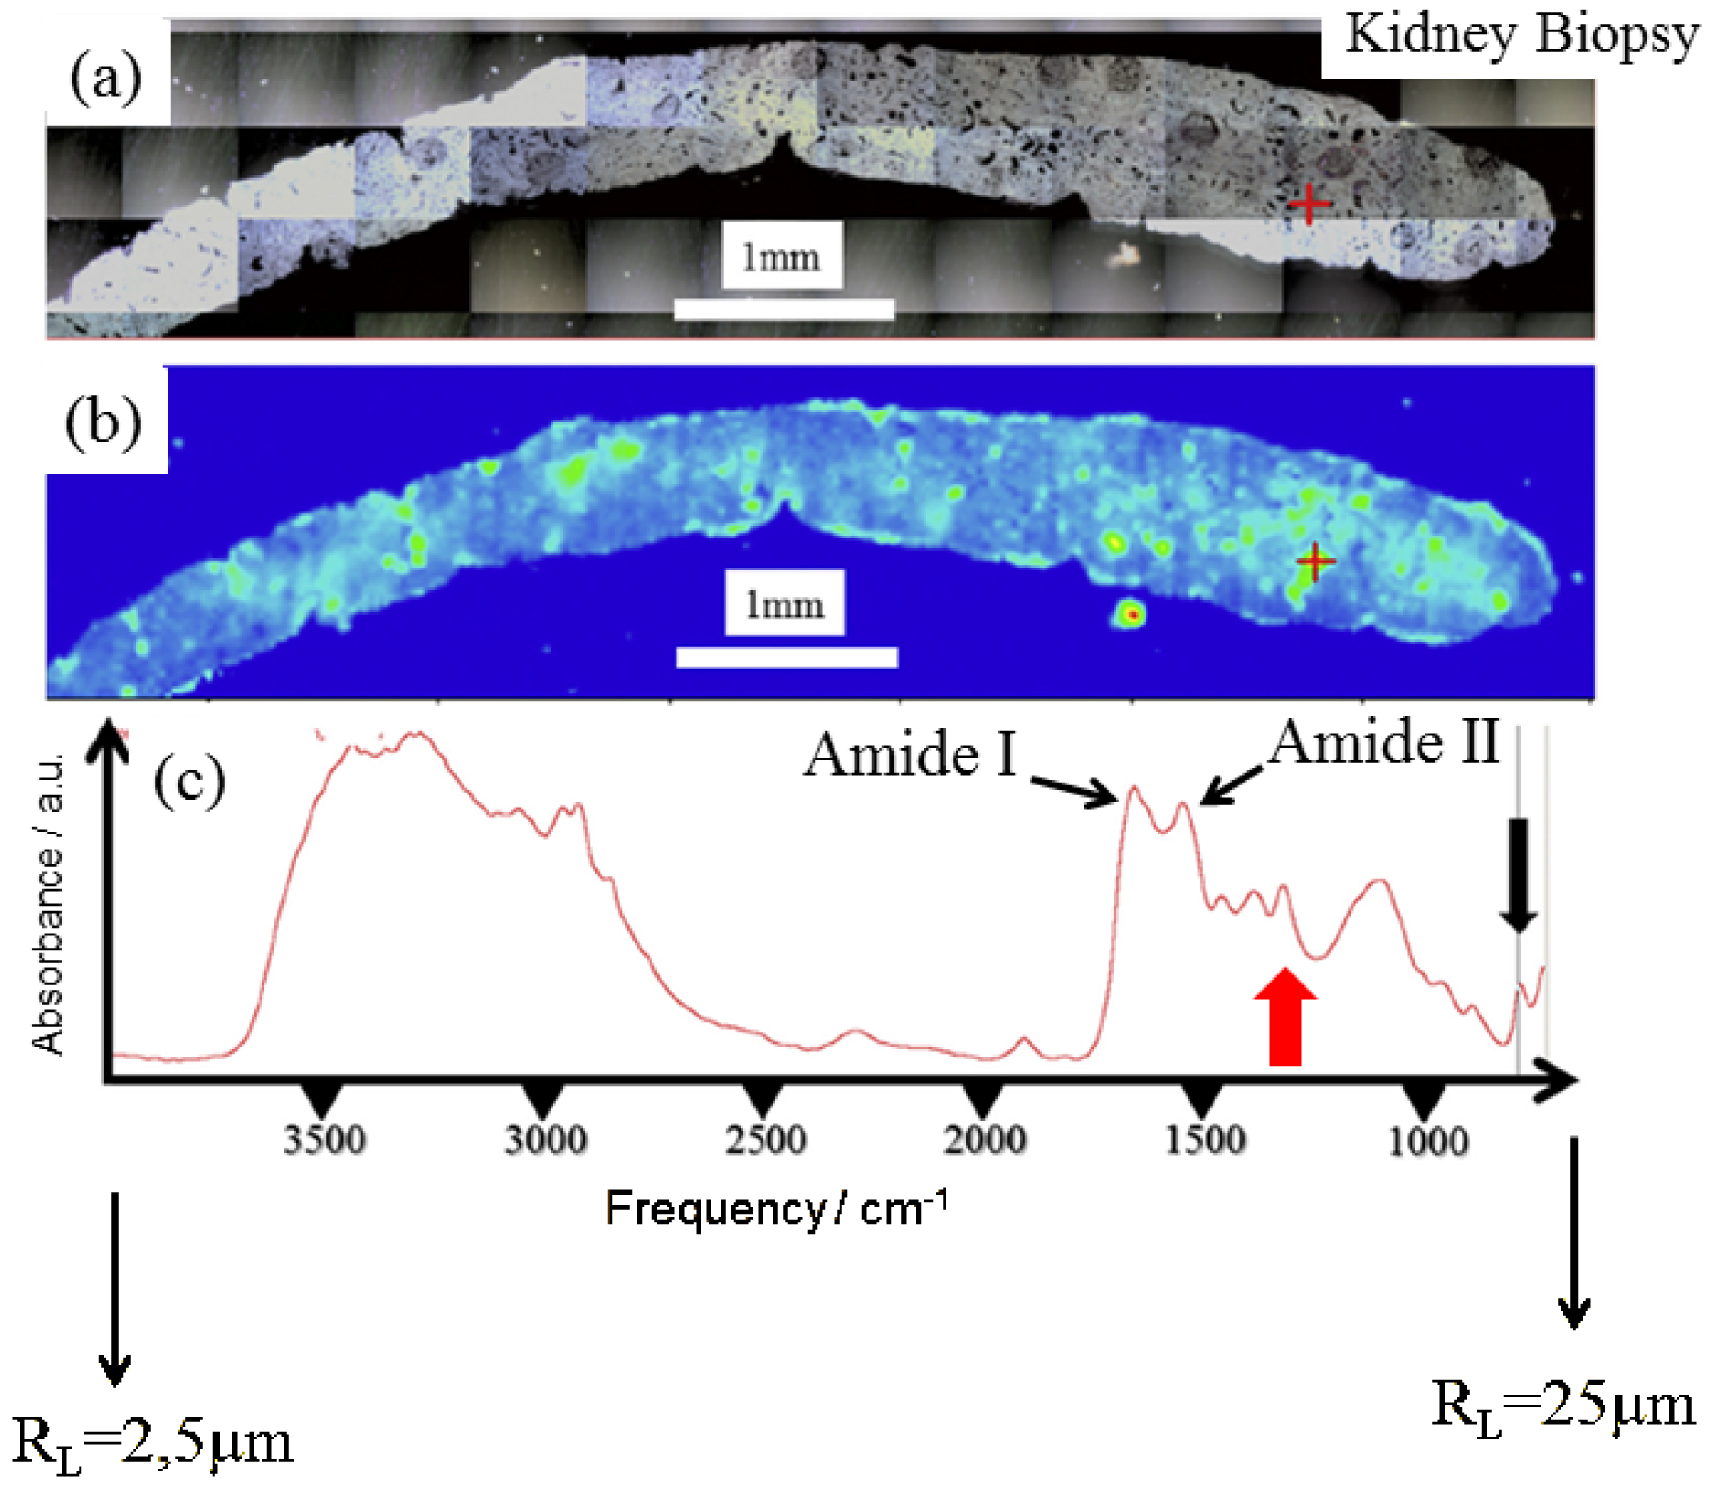
Such physicochemical information leads to a medical diagnosis for the clinician. For kidney stones, the amount of samples is sufficient to perform classical FTIR experiments. Also, other parameters have to be considered such as the price of the apparatus as well as the facility to handle experiments. All these points lead to the fact that for kidney stones, it is not necessary to use micro and nano IR spectroscopies.
The challenge lies in the identification of chemical compounds present in pathological microcrystalline deposits (PMCD). It is of clinical importance to accurately identify crystals found in the tissue as soon as possible. Figure 1 presents a typical set of data which can be obtained through classical μFTIR spectroscopy. Here, FTIR hyperspectral images were recorded with a Spectrum Spotlight 400 FTIR imaging system (Perkin Elmer Life Sciences, France), with a spectral resolution of 8 cm−1. Each spectral image, covering the biopsy, consisted of about 30,000 spectra. A precise identification of PMCD is straightforward through the position of characteristic IR absorption bands.
The two primary features due to proteins (Figure 1c), are the amide I (1600–1700 cm−1) and amide II (1500–1560 cm−1) bands, which arise primarily from the C–O and C–N stretching vibrations of the peptide bond, respectively [14]. Apart from these contributions, IR absorption bands of calcium oxalate monohydrate (COM) positioned at 780 cm−1 (black arrow in Figure 1c) or at 1314 cm−1 (red arrow in Figure 1c) may be selected to obtain the spatial distribution of COM crystallites within the biopsy.
One drawback is that IR spectroscopy needs a data bank in which spectra of chemical compounds are gathered to compare them to the IR spectra collected from the sample [50]. In the case of the presence of a chemical compound with unknown crystallographic structure in the chemical composition of an abnormal deposit, X-ray scattering constitutes a more valuable technique [51, 52, 53].
In most clinical cases, μFTIR spectroscopy is able to characterize microcristals present in kidney biopsies [49, 54]. Such measurements are also performed at Tenon hospital. Let’s just recall that at the Tenon Hospital, more than 85,000 kidney stones have been analysed by FTIR spectroscopy, as well as more than 2000 biological tissues, including more than 1600 kidney biopsies [4, 54, 55].
Unfortunately, one limitation of μFTIR lies in its lateral spatial resolution. The diffraction of the long mid-IR wavelengths (2.5 μm–25 μm) limits the lateral resolution of IR microscopy to several micrometers [56, 57]. More precisely, this lateral resolution RL is given by the relationship:
Using mid IR as a diagnostic tool at the hospital [35, 36, 37, 38, 39, 40, 41] or to assess more deeply the biochemical parameters responsible to the genesis of PMCD [6] led us to consider techniques able to characterize nanometer scale PMCD. For the clinician, an early characterization of a disease is a key factor to efficiently treat the patient with specific drugs [19, 20].
At least two possibilities exist to perform IR spectroscopy beyond the diffraction limit i.e., to bridge the resolving power gap between the micrometer and nanometer ranges. The first one is a combination of atomic force microscopes (AFM) and IR spectroscopy (AFM-IR) [61, 62]. The second one is the Optical PhotoThermal IR (OPT-IR) spectroscopy [63]. The first one has been already applied in the case of abnormal deposit of a widely prescribed antibiotic, vancomycin [64], in kidney tissue [65]. The complete set of experiments including μFTIR as well as AFM-IR spectroscopies has given valuable information regarding the exact nature of vancomycin-associated nephrotoxicity [64, 65, 66] and of PMCD in the case of cystinosis [25].
In this contribution, we assess the advantages and limitations of OPT-IR spectroscopy for chemical investigation of PMCD in different kinds of human tissues, mostly in kidney and also in breast. In the case of kidney biopsies, we used kidney stones as reference compounds. In the case on breast biopsies, we show that other organs can be considered and that for breast tissues we assess the discrimination through OPT-IR experiments between different calcium phosphate namely amorphous carbonated calcium phosphate (ACCP), calcium phosphate apatite (CA) and whitlockite (Wk) which constitutes a key point for medical diagnostic. The ultimate goal is to evaluate if OPT-IR offers a better balance between chemical specificity and spatial resolution than μFTIR [56, 57], Raman [67, 68, 69] for the identification of nanoPMCD.
2. Methods
The very first photothermal deflection experiments were published three and four decades ago [63, 70]. Basically, such an experiment is based on a pump-probe architecture using two laser sources, one for mid-infrared excitation (the pump) and the other one for measuring the photothermal effect (the probe). These two lasers are collinearly combined by a dichroic mirror. Such architecture is associated with a better spatial resolution through a (visible) optical probe beam that can be focused much smaller than the IR beam. While, as previously mentioned, the lateral resolution of IR microscopy is equal to several micrometers, the lateral resolution of an OPT-IR microscope is around with 500 nm [71].
Another major advantage is that an OPT-IR microscope is a non-contact technique. It offers thus the opportunity to investigate thick samples (even several centimeters) i.e., surfaces without the contact limitations of an ATR (attenuated total reflection) device. This is of primary importance because the presence of pathological deposits in tissue constitutes a significant difficulty to obtain very thin samples. In this contribution, we have made the choice to collect OPT-IR on samples which have been previously studied by μFTIR and Field emission Scanning Electron Microscopy coupled with energy-dispersive X-ray analysis (FE-SEM-EDX) [72]. We have already shown that the possibility to perform different experiments on the same sample led to more significant information for the clinician [54, 73, 74]. Note that regarding the samples, ethical approval was obtained by the ethical committee of Tenon Hospital for this study. Each sample was only named by a study number, without indication of the name of the patient or potential identification data.
Experimental set up used for the characterization of pathological deposits. (a) Sample visualization with an optical microscope. (b) Schwarzschild objective for the acquisition of the IR spectrum.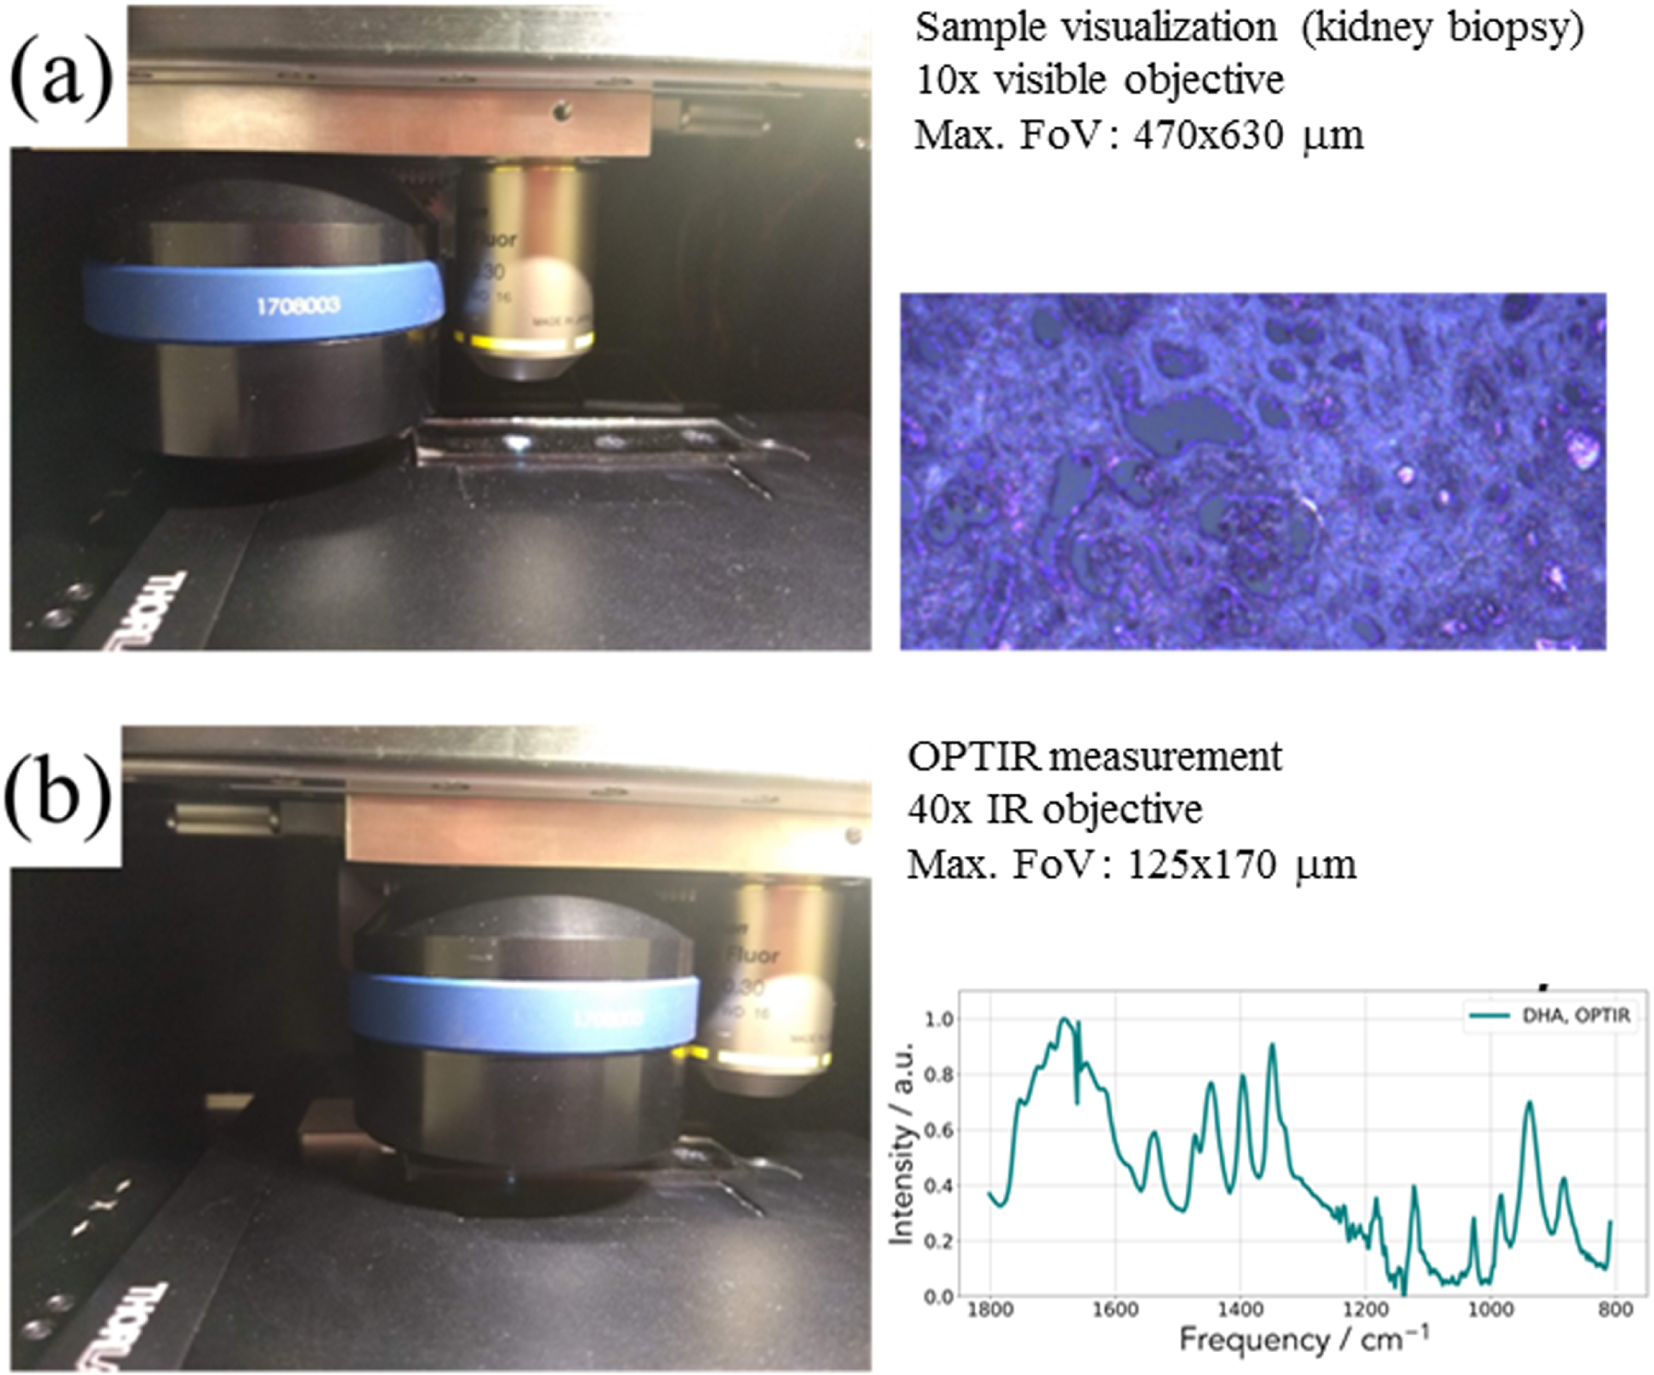
In the case of our experiments (Figure 2), OPT-IR measurements (spectra and images) were acquired on the mIRage™ Infrared Microscope (Photothermal Spectroscopy Corp., Santa Barbara, CA, USA). Spectra were performed in reflection mode, 2 cm−1 spectral data point spacing, through a 40×, 0.78 NA, 8 mm working distance Schwarzschild objective. The pump IR sources were two pulsed, tunable four-stage Quantum Cascade Laser (QCL) devices, scanning from 800 to 1900 cm−1 or 920–3050 cm−1 (with a gap between 1800–2600 cm−1). Regarding the probe, we used a CW 532 nm visible variable power laser.
Our biological samples were placed either on a CaF2 substrate or on low-e reflective microscope slides (MirrIR, Kevley Technologies, Tienta Sciences, Indianapolis). In our case, we have not remove artifacts potentially arising due to imperfect switching between neighboring QCL laser stage (Figure 3). We used the open-source Quasar software (https://quasar.codes) and the Orange Spectroscopy toolbox for multivariate statistical analysis [75]. To generate data of high signal-to-noise ratio, 20–50 spectra were collected. In Figure 2, we can see a typical IR spectrum corresponding to the DHA compound. Two configurations have been used (Figure 3). In the first configuration, the transitions between the different IR sources are clearly visible and are positioned at 1663 cm−1, 1359 cm−1 and 995 cm−1. In the second configuration, the transitions between the different IR sources are clearly visible and are positioned at 1520 cm−1 and 1205 cm−1 (Figure 3).
Typical IR spectrum corresponding of the incident beam. Dashed magenta lines show the laser stage transition frequencies.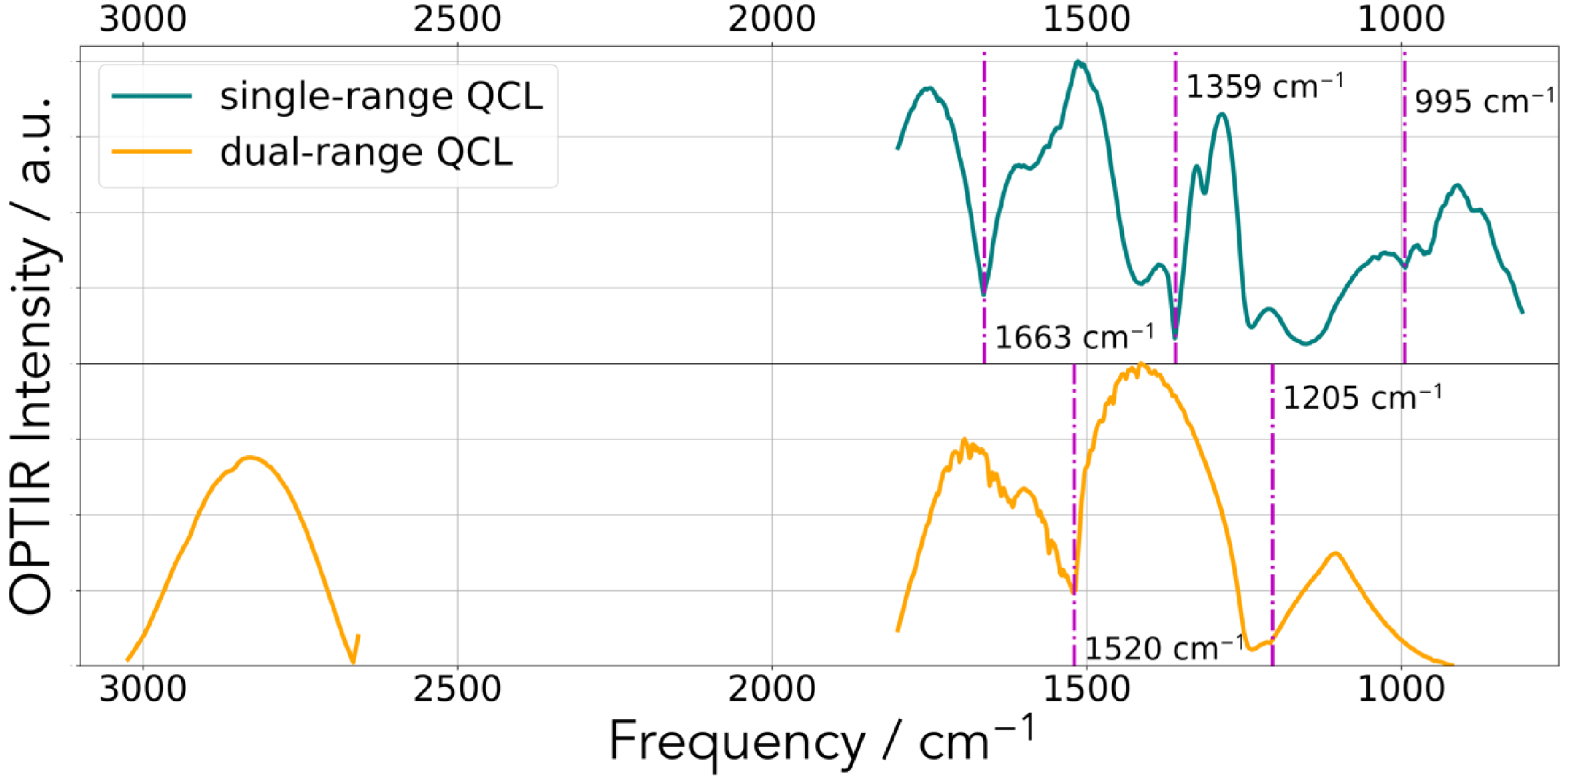
Regarding classical FTIR spectroscopy [46, 47], each kidney stone was analyzed in absorbance mode on a Bruker Vector 22 spectrometer by accumulation of 32 spectra between 4000 and 400 cm−1, with resolution 4 cm−1 and time acquisition 1 s/spectrum. For the biopsy, FTIR hyperspectral images were recorded with a Spectrum Spotlight 400 FTIR imaging system (Perkin Elmer Life Sciences, France).
3. Results and discussion
Thanks to the opportunity offered by a commercial experimental set up device, numerous kinds of samples have been already investigated through OPT-IR spectroscopy encompassing submicrometer atmospheric particles [76], polymers [77], fragments from a historical painting [78] or nanocomposites [79]. Several exciting research works have also been published on biological samples [80, 81, 82, 83, 84, 85, 86, 87, 88, 89]. Among them we can quote the possibility to discriminate different types of lung cells on histopathology glass slides [80], to determine relevant molecular structures directly in neurons [81] as well as the orientation of collagen in tendon [82].
In all these publications, the OPT-IR technique provides an elegant non-contact way to chemically identify different kind of compounds with higher spatial resolution than conventional IR microscopes, while maintaining the advantages of an optical microscope-based platform. We would like to show different microcrystalline pathologies on which OPT-IR can bring valuable information to the clinician. To attain this goal, it is of primary importance to compare the IR spectrum acquired with a classical experimental set-up related to classical IR spectroscopy to IR spectrum collected with a OPT-IR one for different compounds namely calcium oxalate monohydrate, calcium oxalate dehydrate, calcium phosphate apatite and magnesium ammonium phosphate hexahydrate.
3.1. Biological reference compounds collected at the nanometer scale
In Figures 4 and 5, we have selected a set of reference compounds corresponding to different chemical phases identified in kidney stones and compared their IR spectra obtained with two experimental set up, namely μFTIR and OPT-IR configurations. In figure 5, we can see that some differences exist between μFTIR and OPT-IR for calcium oxalate monohydrate (COM) [89, 90, 91] (Figure 4a) and dihydrate (Figure 4b) [92] mainly due to the transition between the laser stages. In both cases, around 1200 cm−1, the incident IR signals by the mIRage™ experimental set up are quite noisy in line with weak intensity of the IR laser in this part of the spectra.
Comparison between the two experimental set up (OPT-IR and μFTIR) for two COM kidney stones (N48017 and N4815) (a) and two COD kidney stones (N7117 and N4651) (b).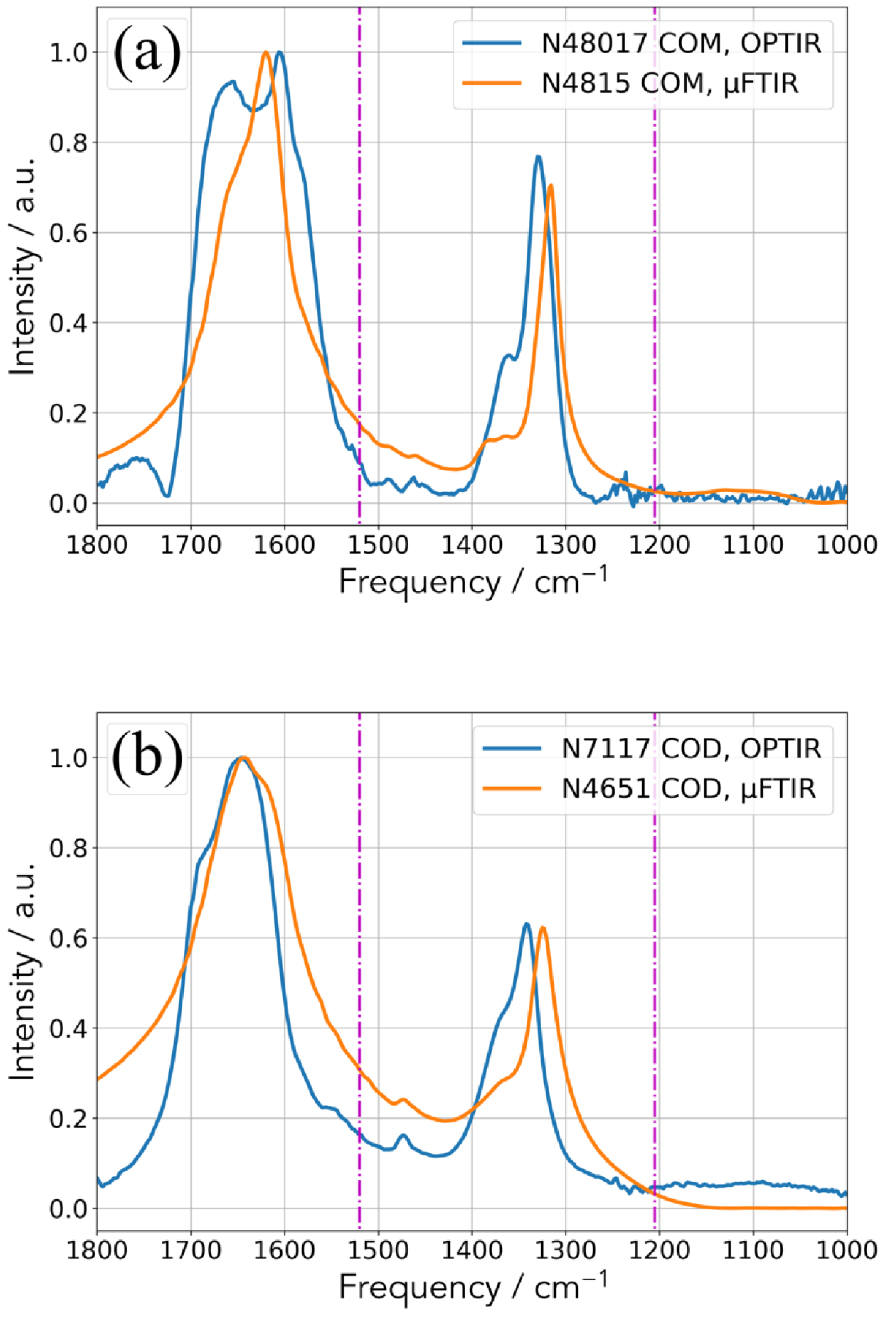
Regarding calcium oxalate monohydrate (Figure 4a), the assignment of the most intense IR bands (1618 cm−1, 1312 cm−1, 782 cm−1, 667 cm−1, 514 cm−1) is well known [89, 90, 91]. More precisely, high absorbance at 1618 and 1312 cm−1 belong to C =O and C–O, respectively. Regarding calcium oxalate dehydrated (COD) (Figure 4b), the most intense vibrations are shifted at 1643 cm−1 and 1325 cm−1 [91, 92].
Regarding the phosphate salts (Figure 5), we have considered two biological reference compounds: calcium phosphate apatite (CA) [93, 94, 95, 96] and struvite (magnesium ammonium phosphate hexahydrate, MAP) [16, 18].
Comparison between the two experimental set up (OPT-IR and μFTIR) for (a) two CA kidney stones and (b) two MAP kidney stones.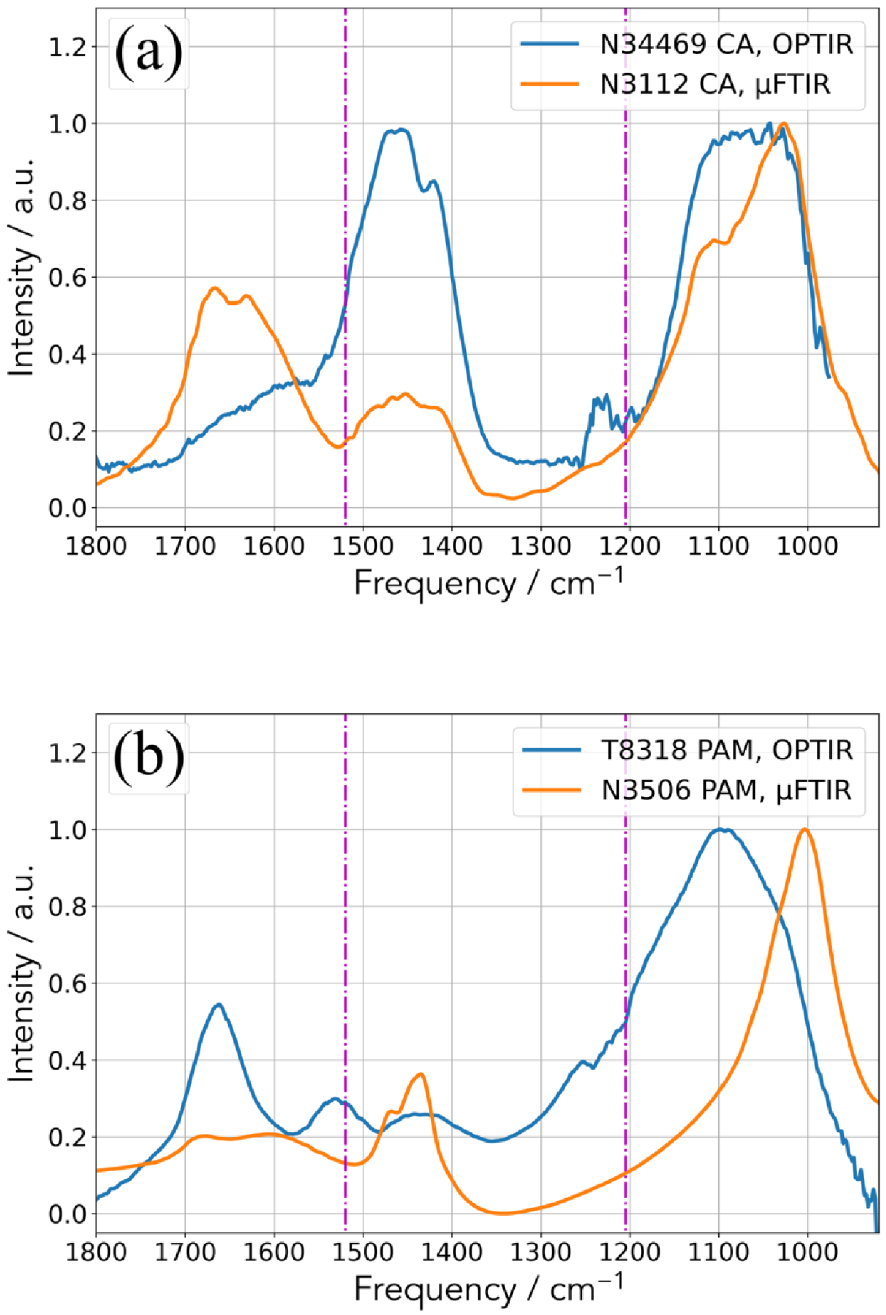
Clearly, some differences exist which may have different origins. The first one is related to the fact that μFTIR gives an average chemical composition (the quantity sample is around μg) while OPT-IR gives a local chemical composition (the size of the probe spot is 500 nm). Actually, biological samples have never made of only one component and always they contain at least some proportions of matrix compounds such as proteins. In addition, kidney stones are made of two or more crystalline species in more than 93% of cases. It is thus possible to collect an IR spectrum dominated by proteins with the OPT-IR experimental setup with a sample for which the chemical composition given by μFTIR is 99% COM and 1% proteins. Finally, the presence of amorphous calcium phosphate which is associated to a shoulder in the absorption band positioned at 1030 cm−1 FTIR spectra has to be considered.
Comparison of the FTIR microscopy spectrum (dashed line) and the AFM-IR spectrum (line) obtained on smectite powder (blue) and on forsterite polished sections (red). Both AFM-IR spectra are obtained in contact mode with top-down illumination and gold coated tip.
Moreover, a chemical analysis based on IR lasers at the nanometer scale still constitutes a challenge. For example, Mathurin et al. [97] shows experimental data which reveal significant differences in the agreement between AFM-IR and conventional FTIR data, depending on the studied mineral. More precisely, the spectra recorded in AFM-IR and FTIR microscopy are very similar in the case of the smectite (Figure 6a). But if they consider AFM-IR and FTIR spectra collected for forsterite single crystal, some band positions as well as some band ratios are drastically different (Figure 6b).
The origin of such huge spectral differences observed in the case of the forsterite crystal is multiple. Crystal orientation, the optical behavior of the sample as well as geometry of the experiments may have significant effects on the IR spectrum. Also, scattering processes of laser with wavelengths close to the dimensions of the crystals may have to be considered.
3.2. Hyperoxaluria and calcium oxalate monohydrate ectopic calcifications
As noticed recently by Alelign and Petros [98], despite considerable improvements in the development of new therapies, the incidence of urolithiasis increases worldwide affecting 12% of the world population at some stage in their lifetime. Calcium-based stones are predominant renal stones comprising about 80% of all urinary calculi [99]. Such high prevalence explains the fact that several studies have been dedicated to the crystallography and the chemistry of calcium oxalate compounds [100, 101, 102, 103, 104].
Crystalline calcium oxalate exists in three hydrated forms known as monoclinic whewellite (monohydrate, COM) [89, 91], tetragonal weddellite (dihydrate, COD), [91, 105, 106] and triclinic caoxite (trihydrate, COT) [91]. Recently, amorphous calcium oxalate has been synthetized [107, 108]. This compound constitutes a transition step during the chemical transition between COD and COM, the last one being the more stable [109, 110]. Regarding their prevalence, COM is the most frequent, while COD is about two to three times less common [111]. The trihydrate form is rarely observed [112]. Another significant clinical difference between COM and COD comes from the fact that in clinical practice COM is related to hyperoxaluria states while COD is associated to hypercalciuria ones [113, 114].
(a–c) Scanning electron microscopy at different magnifications of ectopic calcification present in a kidney biopsy. (d) FTIR spectra collected for the different locations of the IR beam as indicated in (b).
Regarding the presence of ectopic calcification made of calcium oxalate, as usual [4, 49, 115], we start by observations through a FE-SEM-EDX microscope (Figures 7a–c). In this contribution, we have used a Zeiss SUPRA 55VP FE-SEM. To preserve the structural and the chemical integrities, All the SEM observations are made at low voltage (1.4 keV) and without the usual deposits of carbon at the surface of the sample. Such observations allow us to localize precisely the PMCD in the kidney biopsy. In Figure 7d, we can see IR spectra collected on different points of interest (POI) defined in Figure 8b.
(a) Optical image collected by the OPT-IR microscope. (b) 20 OPT-IR spectra collected along the line defined in (a).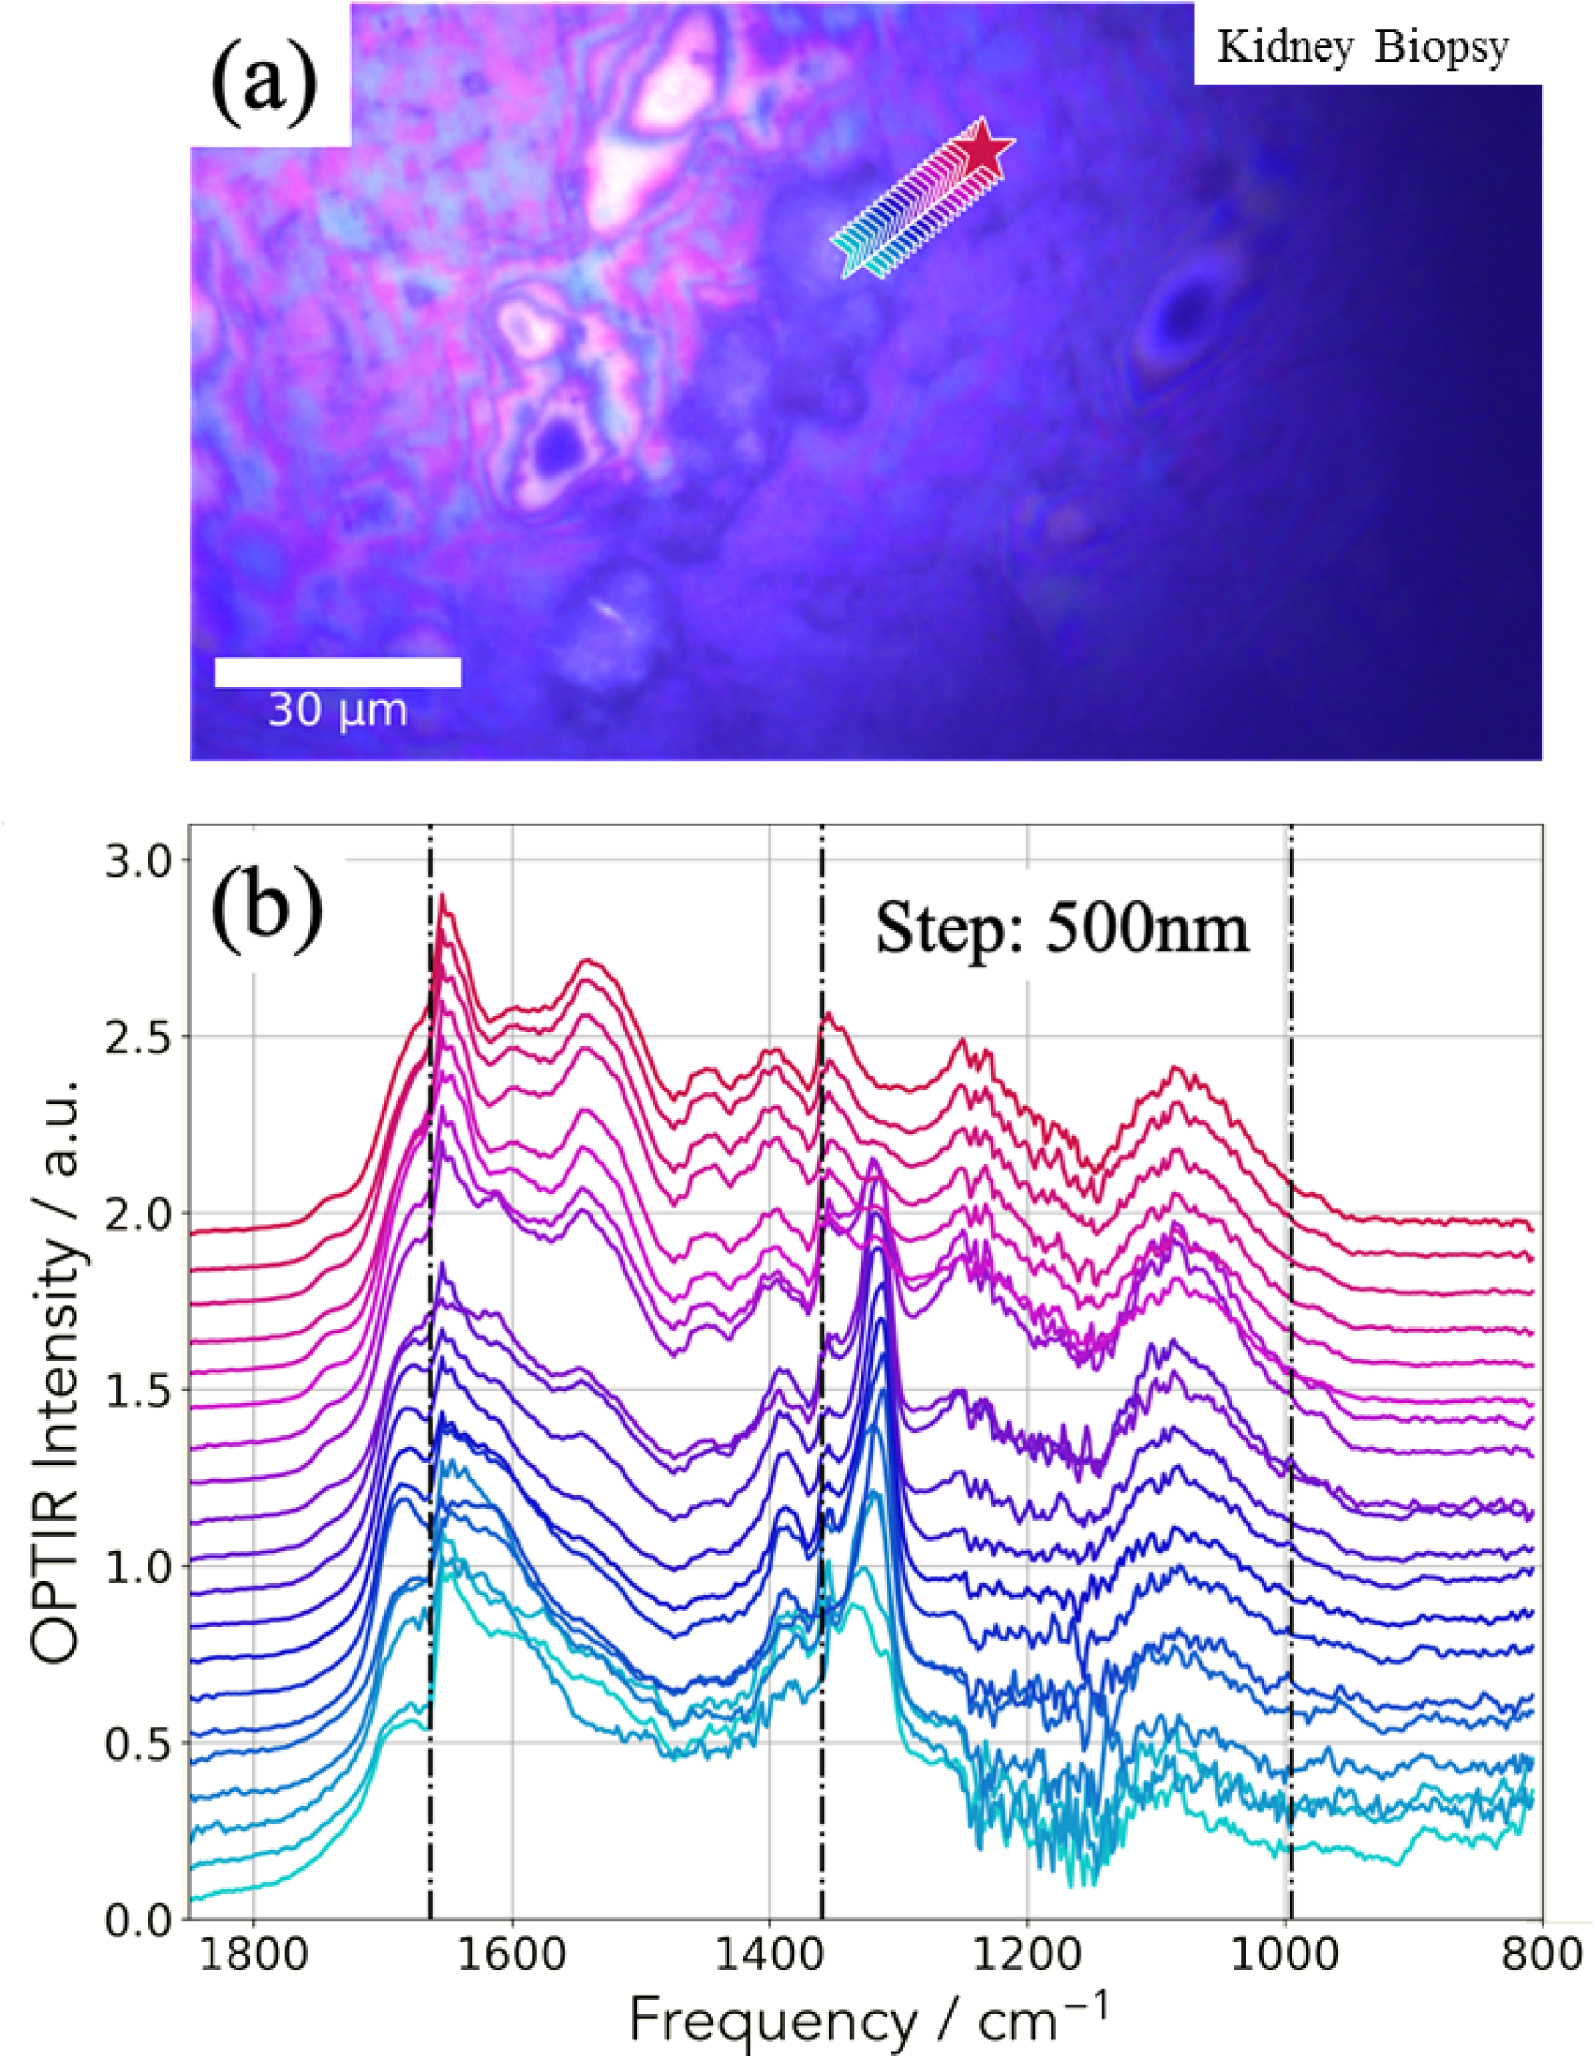
As discussed previously, due to the micrometer spatial resolution of the FTIR spectrometer, we can observe the two bands amide I and II associated to the tissue even if the probe is positioned on the calcification (location 3 in Figure 8b). As it is generally the case, their relative intensities are not always the same. This is due to the preparation protocol which is optimized to preserve the physicochemical integrity of the ectopic calcification. Regarding the chemical composition of the ectopic calcifications, the presence of IR bands at 1315 cm−1 clearly indicates the presence of calcium oxalate monohydrate (its spectrum has been plotted at the bottom of Figure 7d).
The IR spectra collected by the mIRage™ experimental set up are presented in Figure 8b, each spectrum corresponding to a star shown in Figure 8a.
As we have observed through μFTIR spectroscopy, the relative intensity between the amide I and II are not the usual ones. An additional explanation of this observation comes from the transition between the two IR laser stages which is positioned on the amide I band. For this sample, thanks to the high spatial resolution, we have collected an IR spectrum every 500 nm (Figure 8b). The observation of a sudden modification of IR spectra when the probe move on the ectopic calcification indicates that the spatial resolution of the mIRage experimental set up is effectively around 500 nm. Note that the intensity ratio of the two bands of COM (1315 and 1618 cm−1) may be not always the same due to the fact the two lasers used here are polarized. Also note the variation of the position of the band at 1315 cm−1 which may be due to the same reason.
(a) Spatial distribution of the integrated 1302–1327 cm−1 IR absorption band specific to COM. (b) OPT-IR spectrum from the highest intensity (white) pixel of (a). Spectra were smoothed with a 5-point Savitzky–Golay filter and normalized to the integral between 1600–1850 cm−1.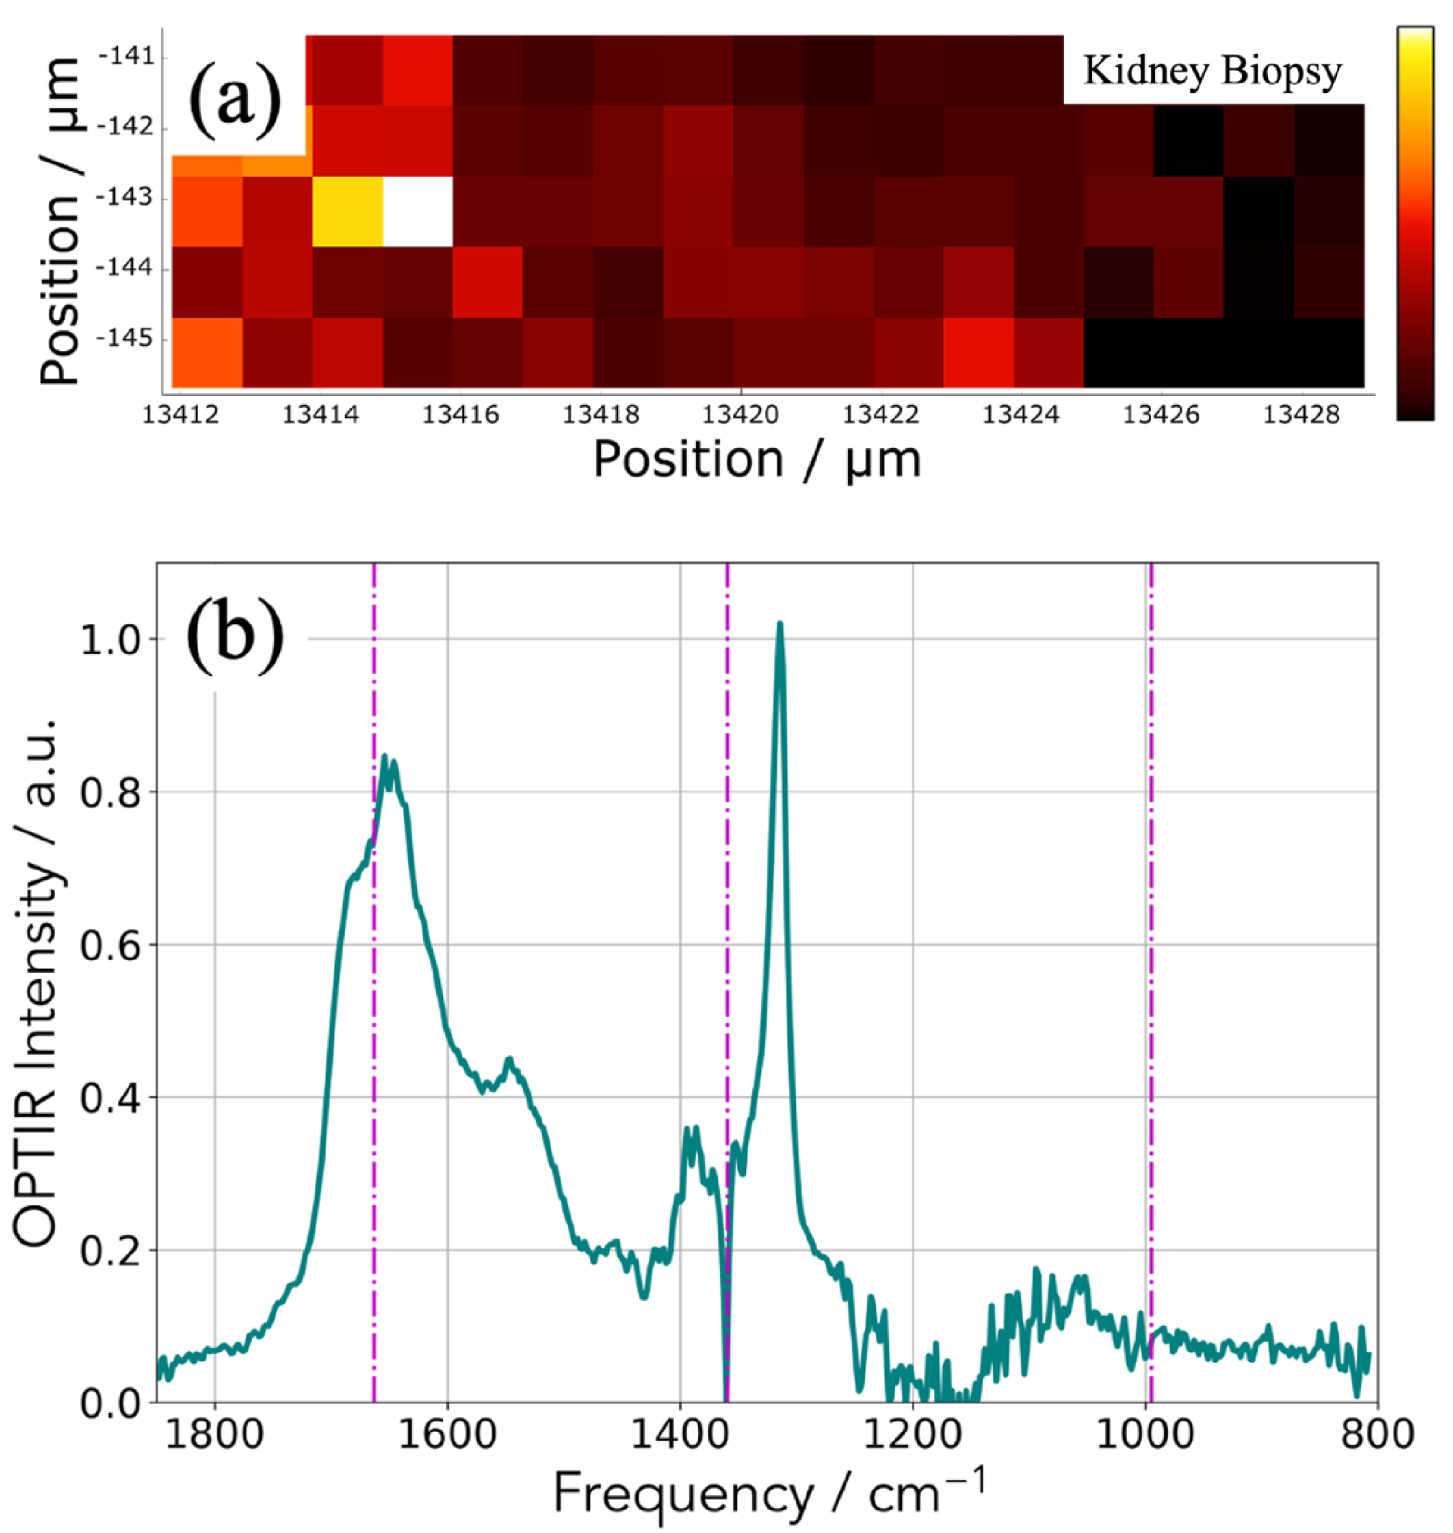
In Figure 9, another way to collect IR data is shown. We select an absorption band of the OPT-IR spectrum (Figure 9b) which corresponds here for calcium oxalate monohydrate (Figure 8a) and we have plotted the maximum of this absorption band versus its position to obtain the spatial repartition of COM with a lateral resolution of 500 nm (Figure 9a).
3.3. The adenine phosphoribosyltransferase (APRT) deficiency
Among the genetic diseases which induce the formation of ectopic mineralizations in kidney we can quote adenine phosphoribosyltransferase (APRT) deficiency which is a rare autosomal recessive disorder. This genetic disease induces the formation of 2,8-dihydroxyadenine (DHA) stones and renal failure secondary to intratubular crystalline precipitation [24, 116, 117]. Different ways exist to establish the medical diagnosis including the identification of typical DHA crystals in urine or renal biopsy, a genetic investigation as well as the measurement of APRT activity in erythrocytes. As underlined by Bollée et al. [117], early diagnosis of the disease is critical because patients may develop renal failure [118, 119, 120] that may be efficiently prevented by allopurinol, a xanthine oxydase inhibitor. We have already demonstrated that μFTIR spectroscopy constitutes an elegant way to perform an early diagnosis of this genetic disease [121].
Comparison between techniques. IR spectrum collected on a classical FTIR device (orange) and an OPT-IR spectrum acquired on the mIRage™ experimental set up (teal).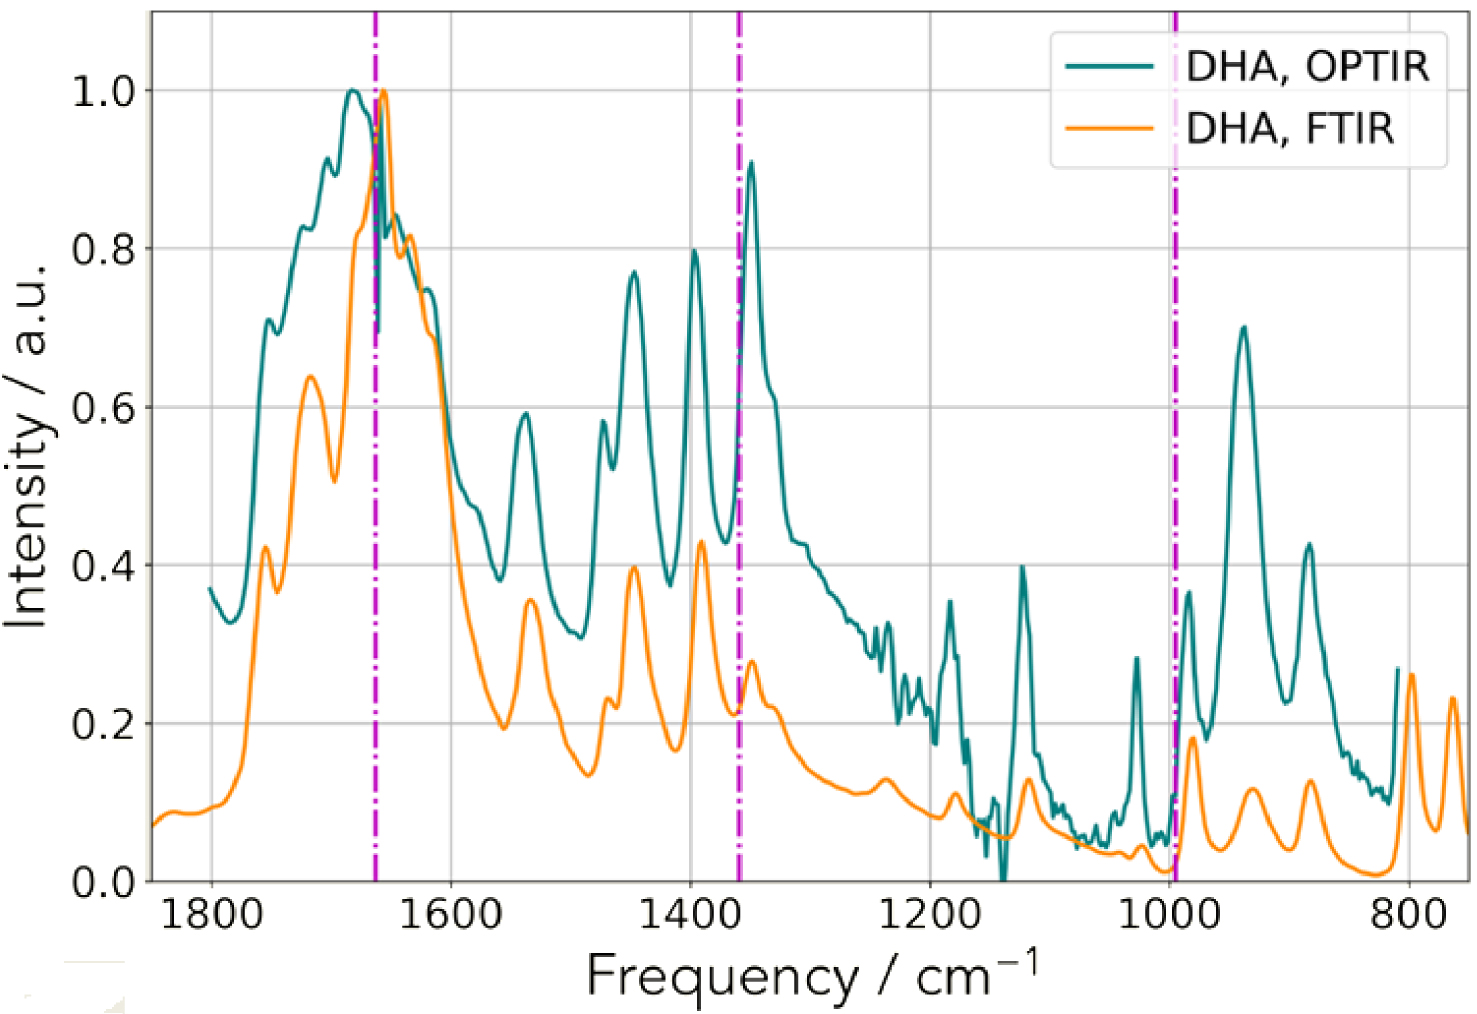
We performed IR experiments using an OPT-IR experimental set up. For that purpose, we start by considering a kidney stone made of DHA and by collecting IR spectra. As we can see in Figure 10, the spectral correspondence and excellent signal to noise ratio allows the clinician to recognize the IR spectrum of DHA crystals [24, 55, 121].
SEM images of DHA deposit at different magnifications present in a human kidney biopsy.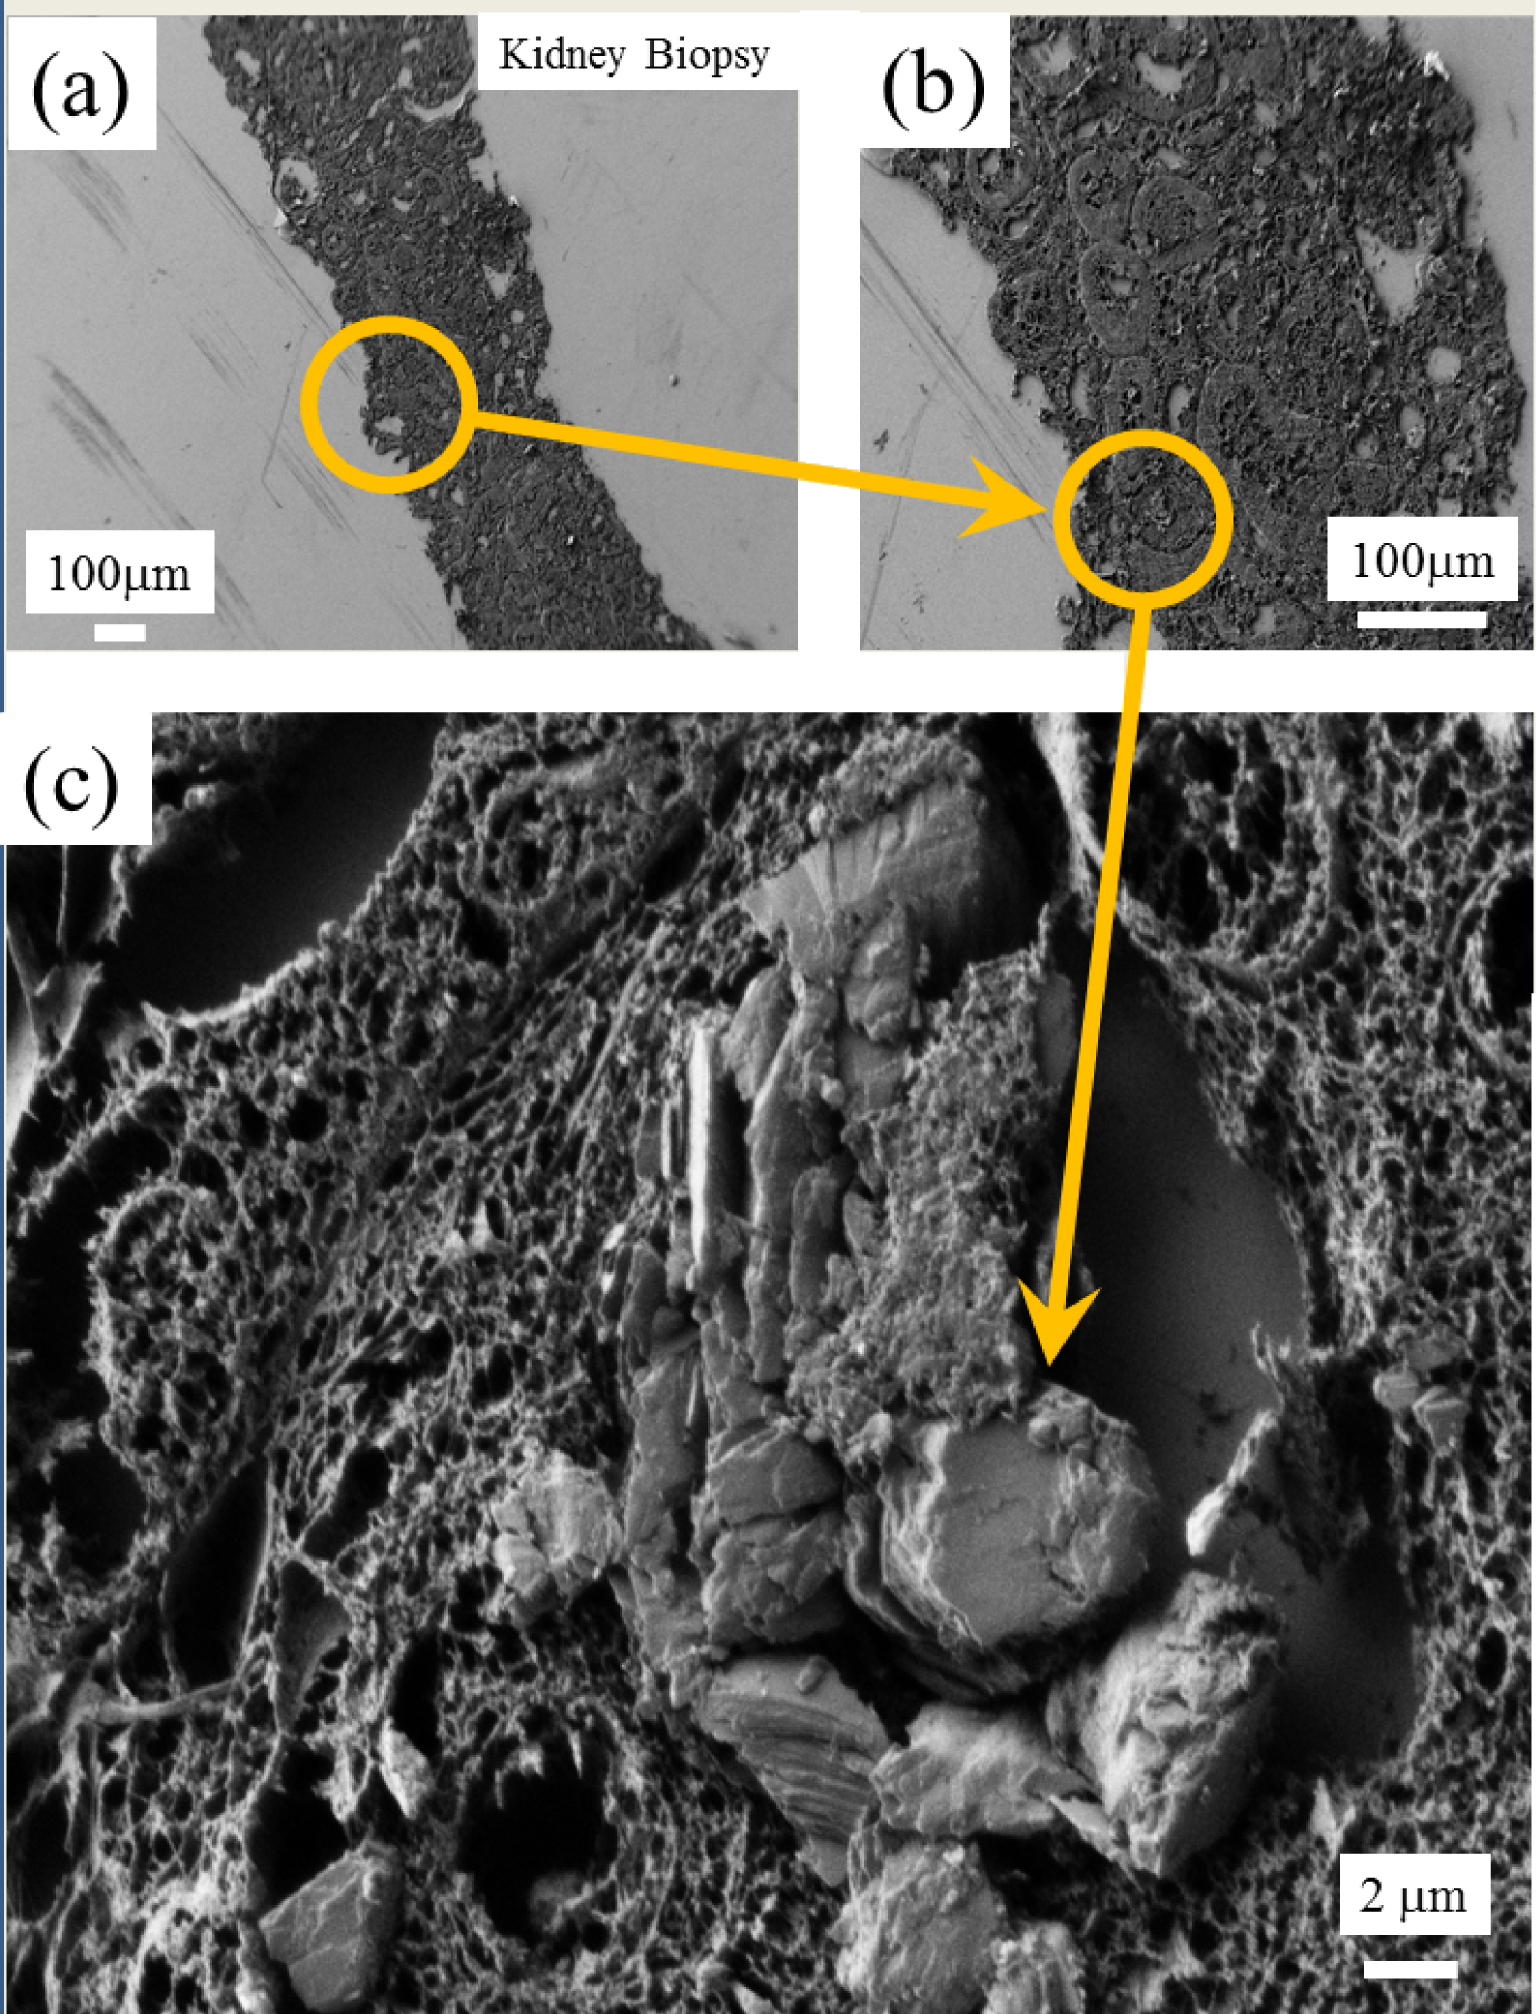
After obtaining these results, we inspected a mouse (as an animal model for this pathology) as well as a human biopsy. Regarding the human biopsy, SEM observations allowed us to localize abnormal deposits (Figure 11). μFTIR spectra were collected (Figure 12) clearly show the presence of DHA crystals.
(a) Optical photography. (b) IR spectra (with the μFTIR and the OPT-IR experimental set up) showing the presence of DHA crystals.
On this human biopsy, mIRage experiments have been also performed and we can see in Figure 12, these IR spectra clearly underline the presence of DHA crystals. One interesting point is that the amide I and II bands are not always visible. It seems that with a probe of 500 nm IR spectra on DHA crystals alone can be collected. As for the previous sample, it is possible to build the spatial distribution of DHA crystals from one selected IR band through its intensity (Figure 13).
(a) Optical image; (b) OPT-IR spectra showing the presence of DHA deposits in a human kidney biopsy.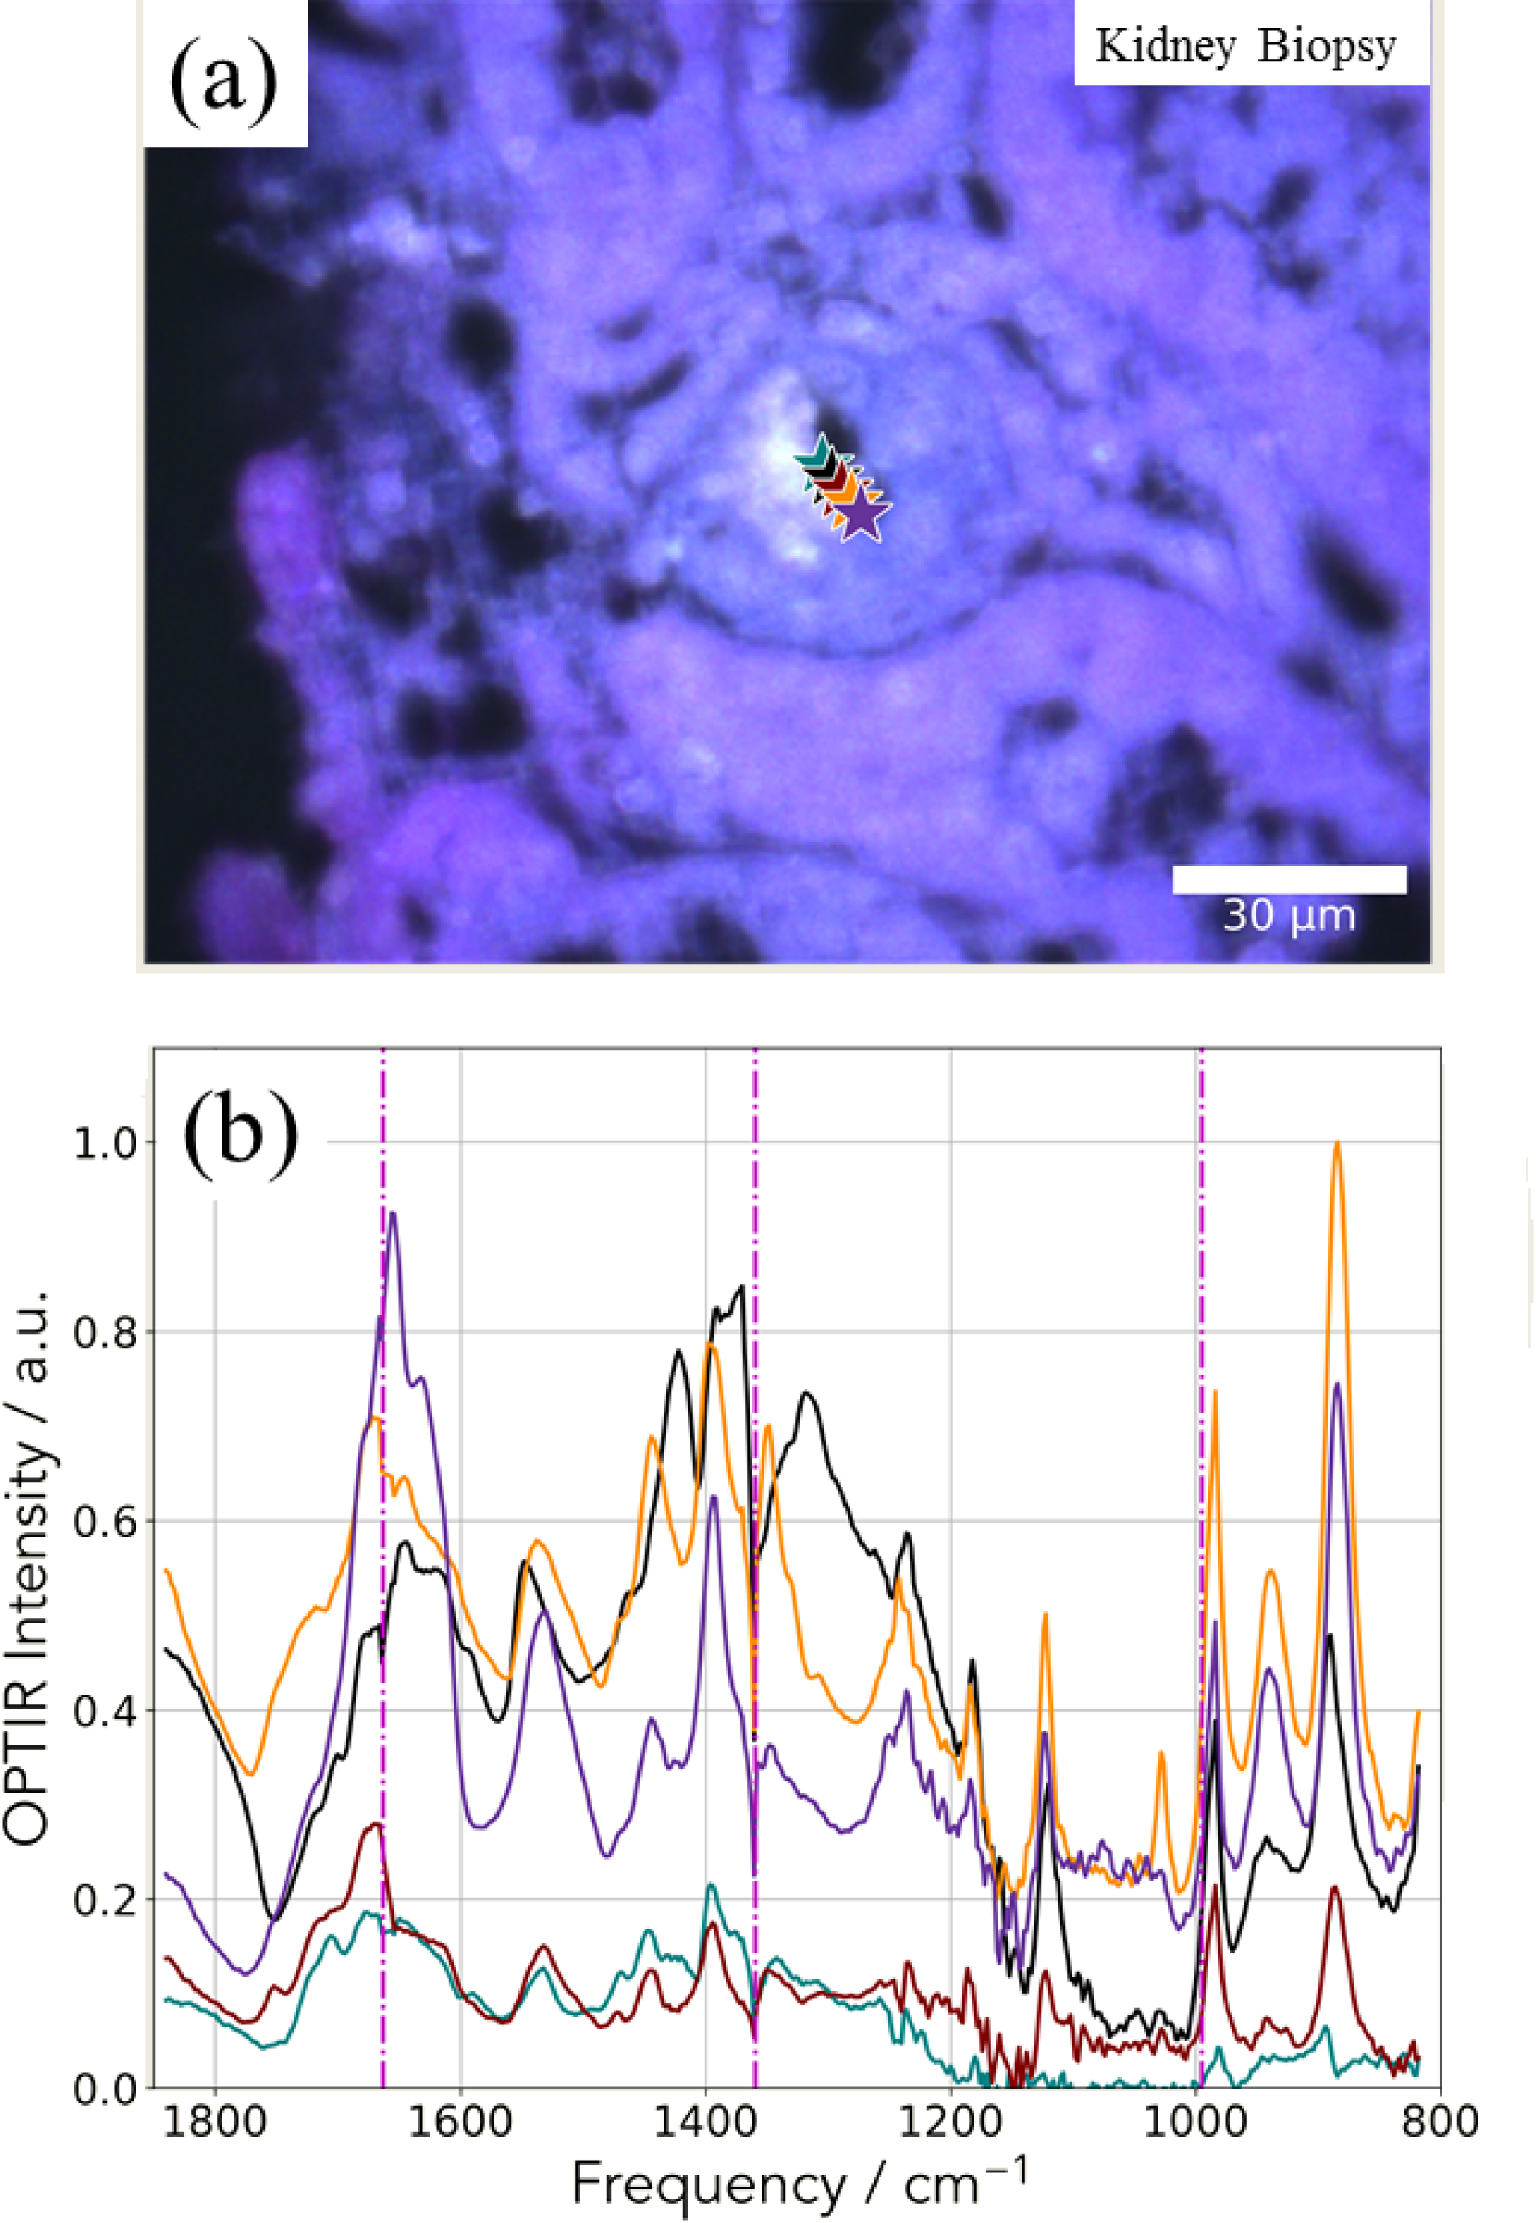
Hierarchical cluster analysis (HCA) of a hyperspectral dataset. (a) Spatial distribution of the Euclidean distance from the average spectrum. (b) Spatial distribution of two clusters identified by HCA. (c) Cluster averages and their standard deviation.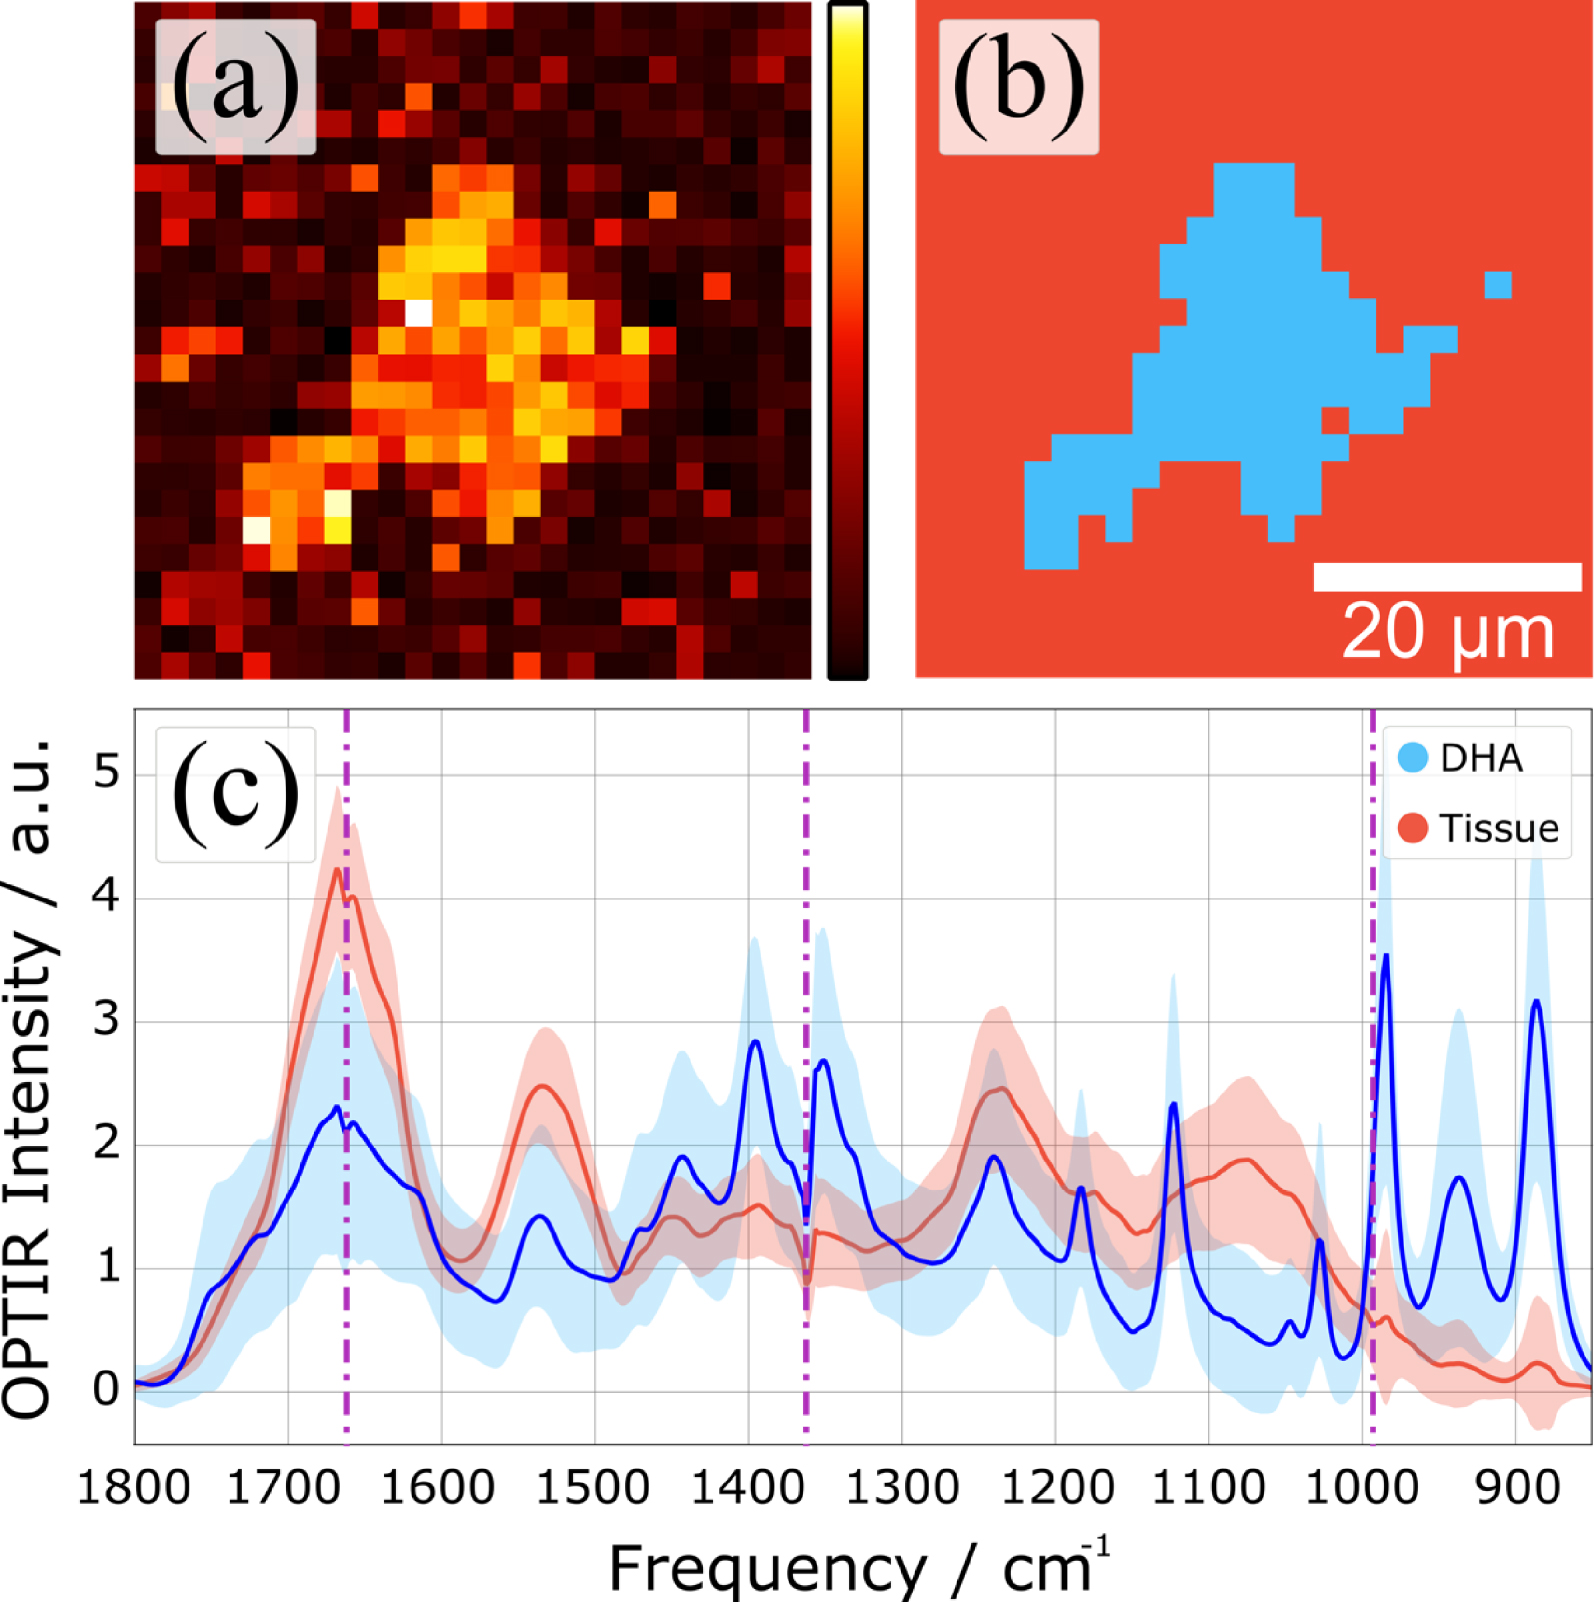
Figure 14 shows the potential of OPT-IR in hyperspectral measurements through an example of hierarchical cluster analysis. Here, we have calculated the Euclidean distances of individual spectra and used the Ward linkage to determine cluster distances. Plotting the spatial distribution of the Euclidean distance of each spectrum from the average spectrum (Figure 14a) highlights a high-intensity area in the middle of the map. The result of HCA is shown in Figure 14b, where the top two clusters are highlighted in red and blue. By calculating the cluster averages for each cluster, we can clearly identify the DHA rich area different from the average spectrum of the surrounding tissue (Figure 14c).
Regarding the mouse kidney, we used the 500 nm probe to underline the possible presence of DHA crystals. In Figure 15a, we selected two areas of interest (Figures 15b and c). For each area, we collected IR spectra using the mIRage™ experimental set up (Figures 16 and 17). One simple way to analyze the IR data can be performed by considering the 1000–800 cm−1 region where DHA has quite intense IR absorption bands.
The different IR spectra collected with the mIRage™ experimental set up show significant differences with the IR spectra corresponding to DHA. Thus, DHA seems to be absent (Figures 16 and 17).
Scanning electron microscopy at different magnifications to select areas of interest for the mouse kidney (b) and (c).
(a) Optical image corresponding to the deposit identified through SEM (Figure 15) and (b) OPT-IR spectra corresponding to the different points of interest (stars in a). (c) OPT-IR and FTIR spectra of DHA reference compound.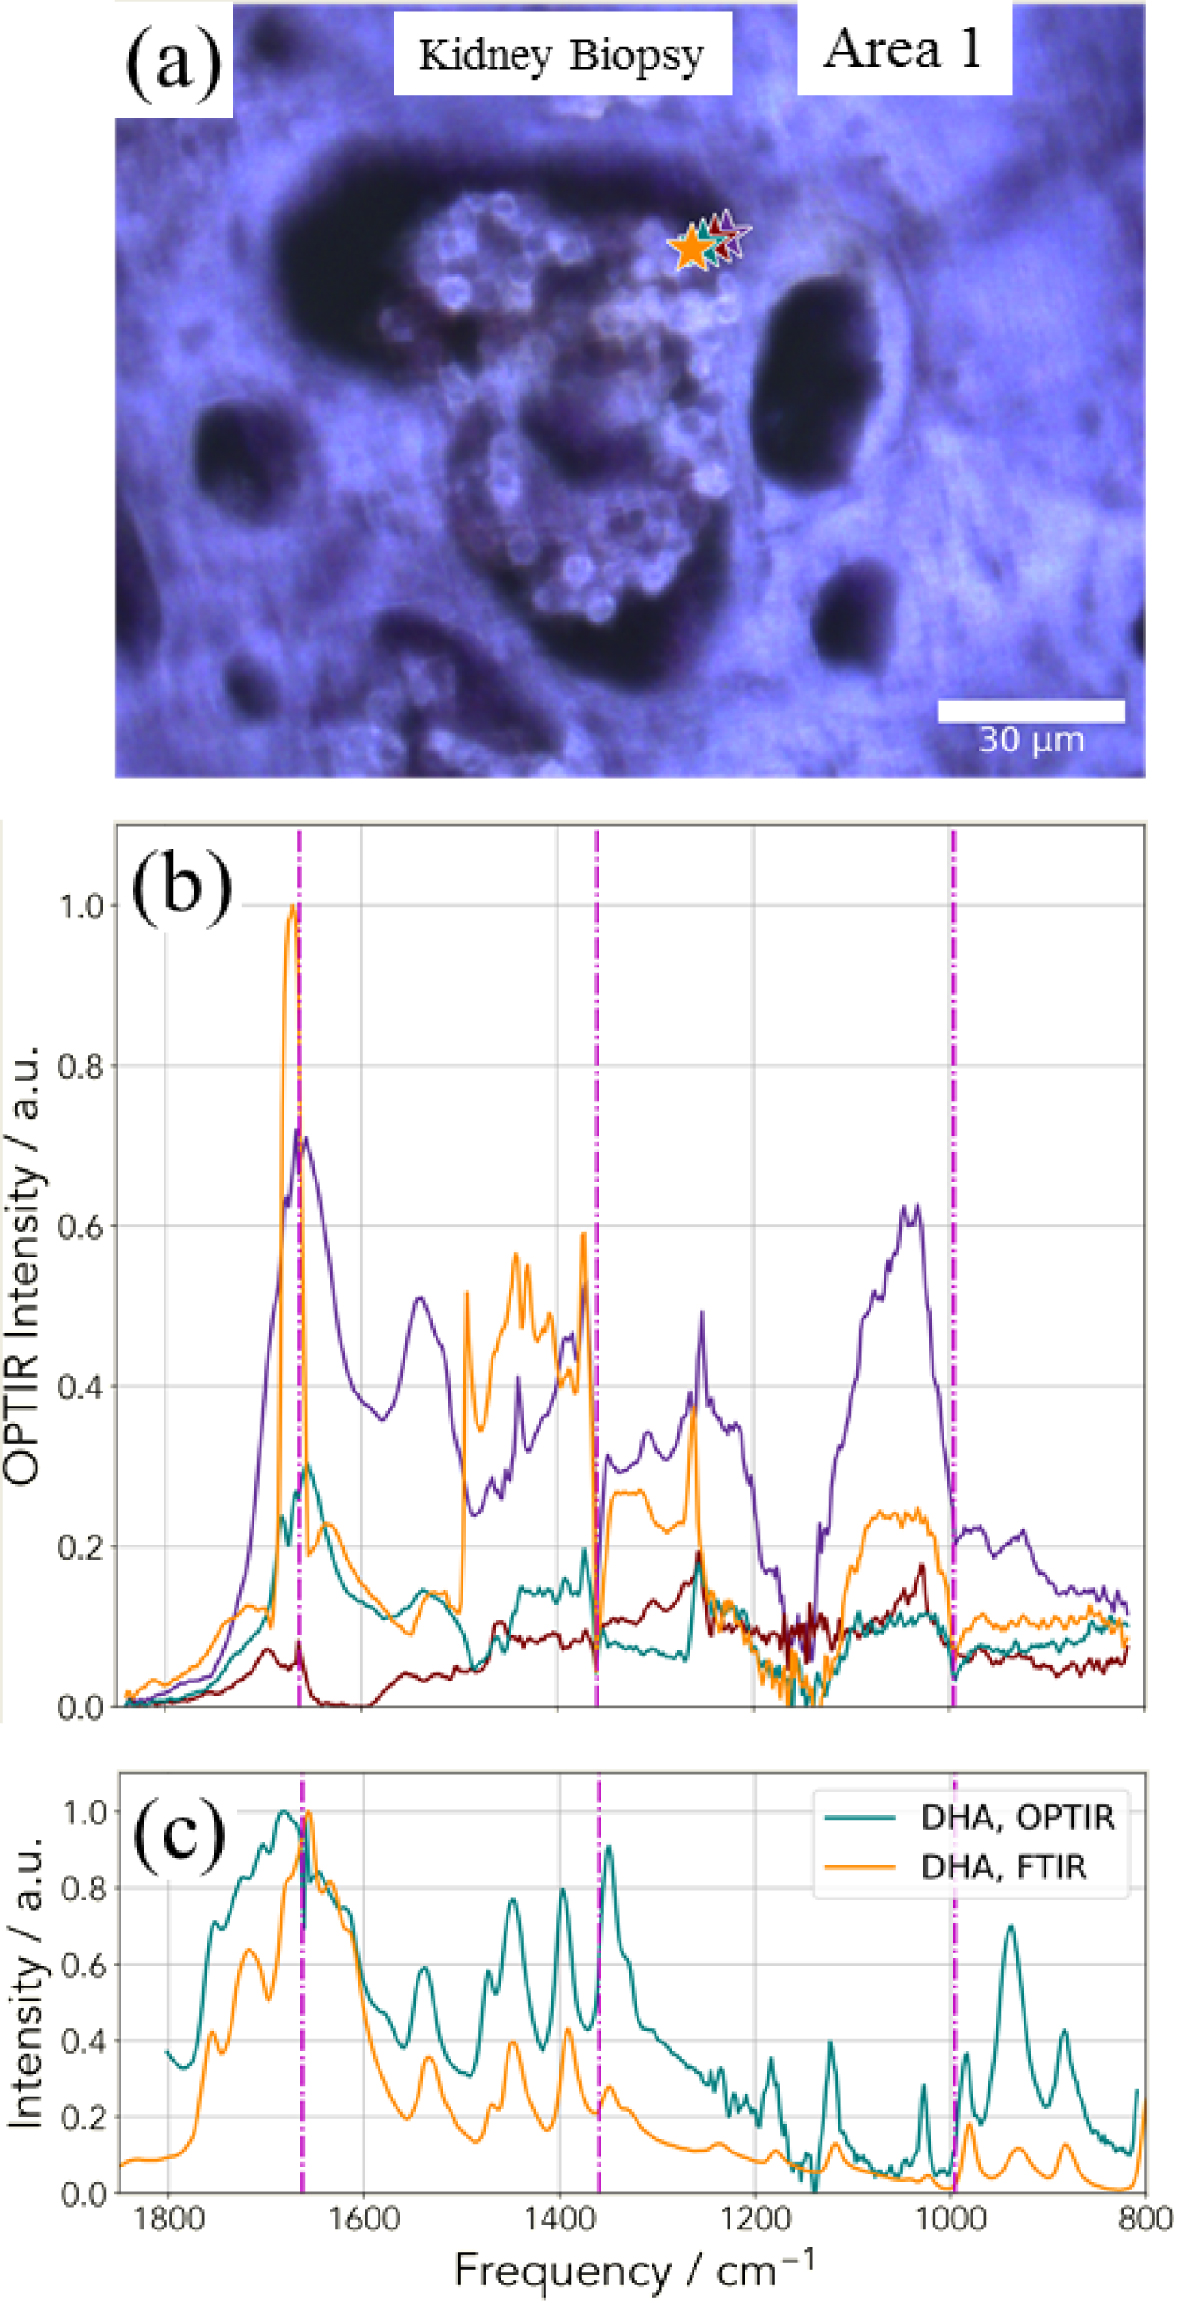
(a) Optical image corresponding to the deposit identified through SEM (Figure 15) and (b) OPT-IR spectra corresponding to the different points of interest (stars in a). (c) OPT-IR and FTIR spectra of DHA reference compound.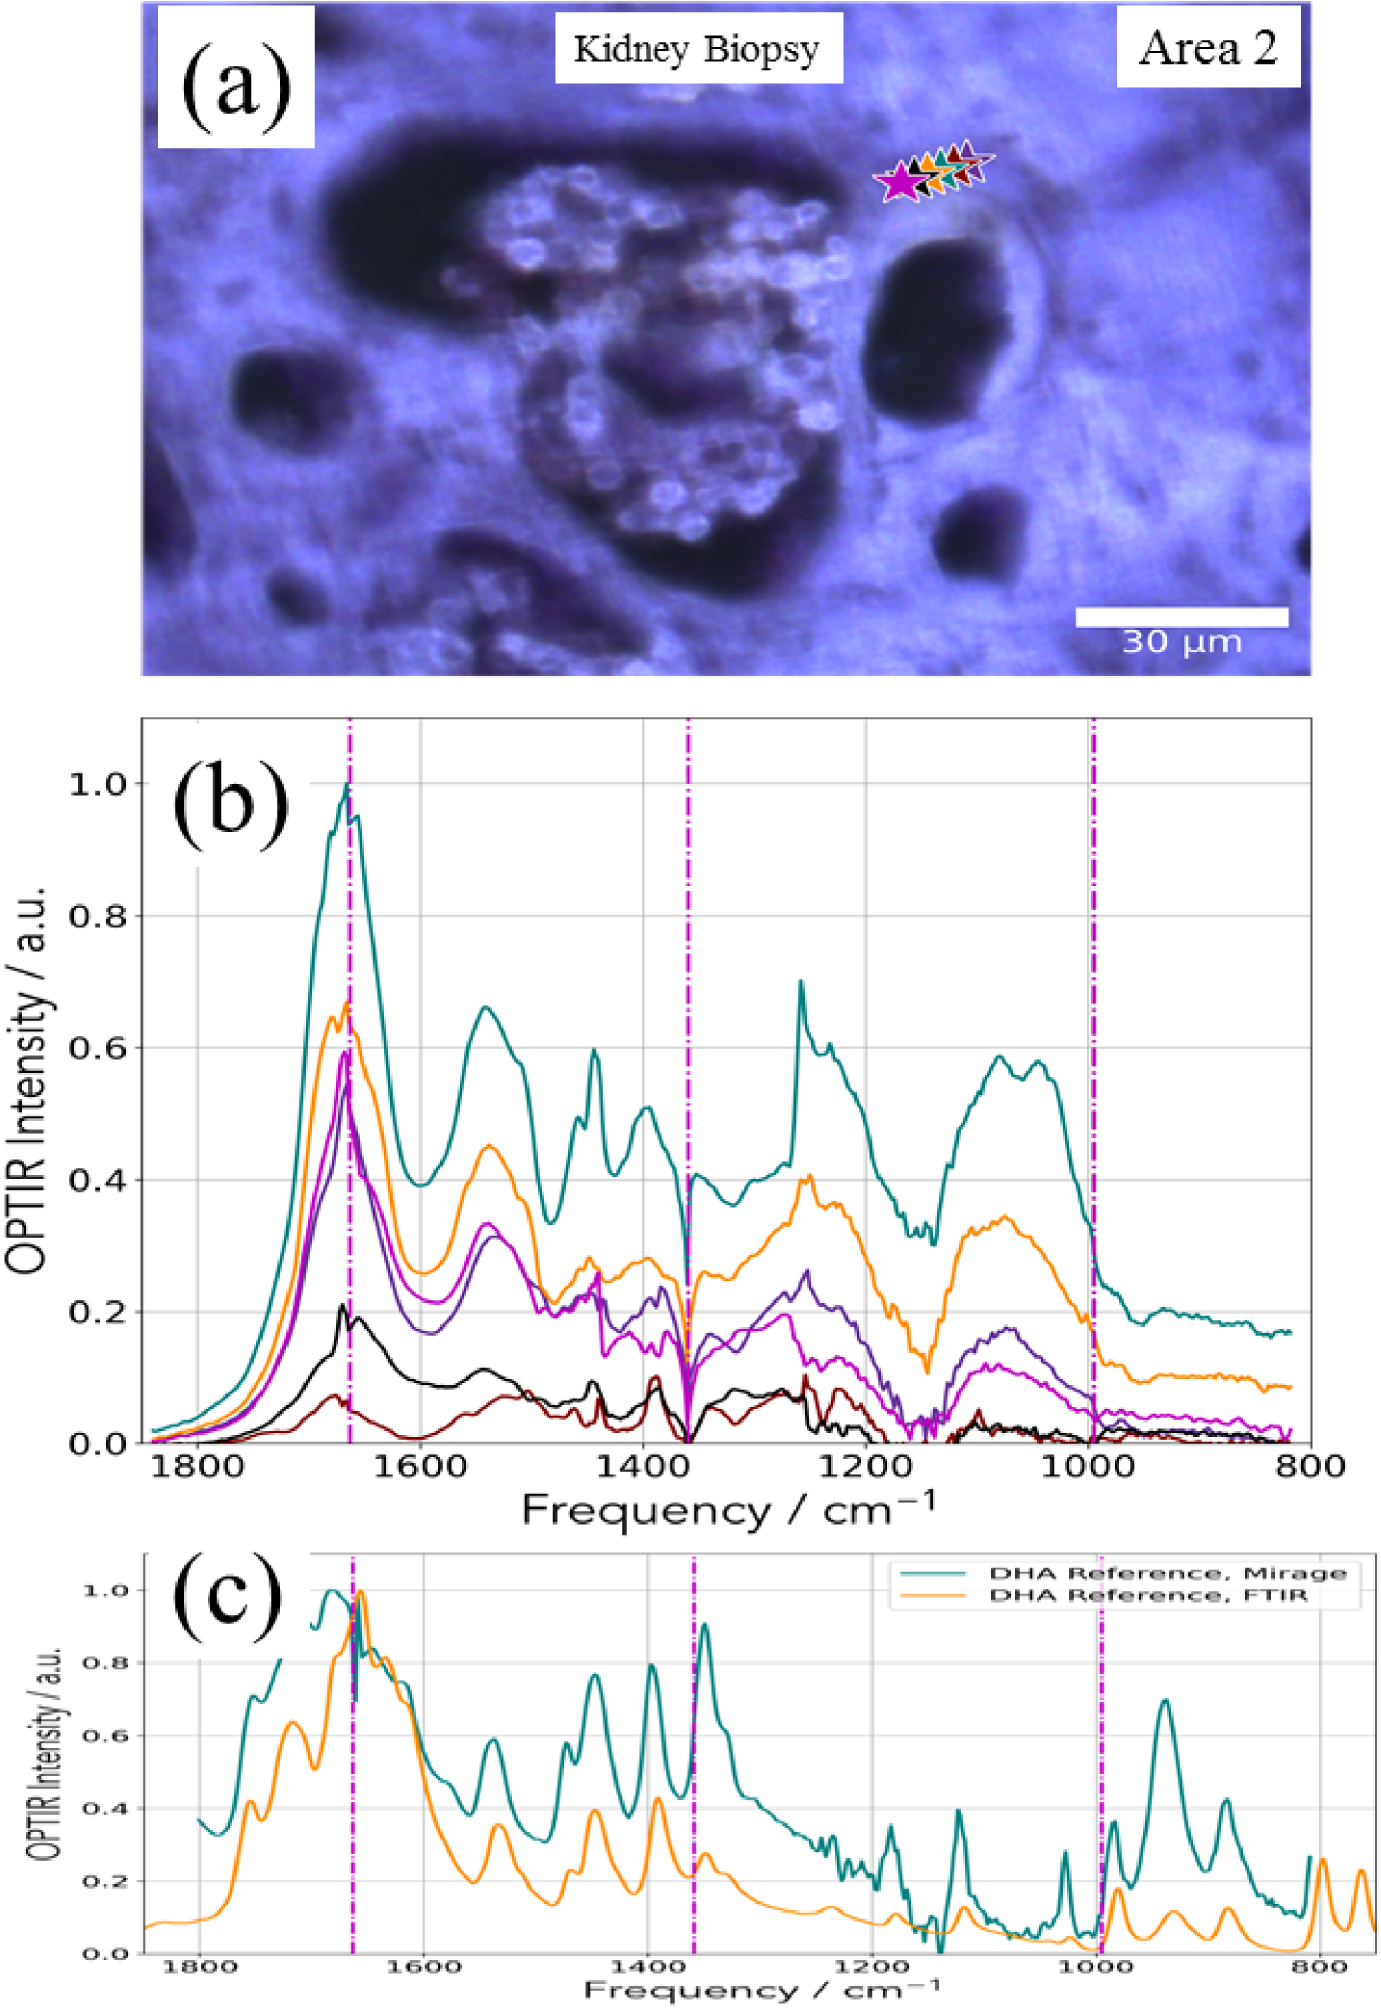
3.4. Giving major information through nondestructive techniques
With the help of OPT-IR nanospectroscopy and SEM-EDX, it is possible to gather information regarding the chemistry and the topology of kidney stones without any kind of preparation. In a recent paper, we have also combined micro computed tomographic imaging (micro CT) and SEM-EDX [122]. Micro CT is a powerful tool for visualizing urinary stones allowing easy visualization of stone structure and mineral identification, especially if an attenuation standard is included with a specimen [122, 123, 124, 125, 126]. Regarding micro CT, experiments were conducted using the Skyscan 1172 Micro CT system (Bruker, Kontich, Belgium), typically using 60 kVp, 0.5 mm Al filter, and 0.7° rotation step for final (cubic) voxel sizes of 2–12 μm. Stones were typically mounted in Styrofoam for scanning, as that material is remarkably X-ray lucent [122].
We have considered here two kidney stones. The first one was collected as part of an ongoing study of kidney stones, in which patients are consented for study under the Indiana University Internal Review Board (under guidelines from the United States Health and Human Services Office of Human Subjects protection). That stone was mainly composed of COD. The second one comes from Tenon Hospital. It was mainly composed of COM. These two kidney stones are made of calcium oxalate, and, at their surface, a white deposit exists named Randall’s plaque [127, 128, 129, 130, 131, 132]. The formation mechanism of Randall’s plaque, which remains incompletely understood, has been addressed in many publications during the last two decades [133, 134, 135, 136, 137, 138, 139, 140, 141, 142, 143]. As underlined by Van de Perre et al. [143], optical microscopy of eliminated kidney stones grown on Randall’s plaque typically reveals a papillary umbilication, the imprint of the previous papillary attachment, which can be found as an irregular depression, while some stones can display plaque remnants at the umbilication as well.
In Figure 18, we can see images of the two kidney stones corresponding to SEM (Figures 18a and b) observations and micro CT (Figure 18c) for the first one (KRP 453) and SEM (Figures 18d and e) observations for the second one (86396). On SEM as well as on the micro CT scans we can see clearly the two chemical phases of the kidney stones i.e. calcium oxalate crystals and calcium phosphate apatite of the RP. The chemical analysis as given by OPT-IR spectroscopy performed for the two samples shows clearly that the Randall’s plaque was made of calcium phosphate apatite (Figure 19), a result in line with previous publications [133, 134, 135, 136, 137, 138, 139, 140, 141, 142, 143, 144].
(a,b) SEM images of a RP at the top of a kidney stone. (c) CT tomography of the KRP 453 stone. (d,e) SEM images of a RP at the top of the kidney stone 86396.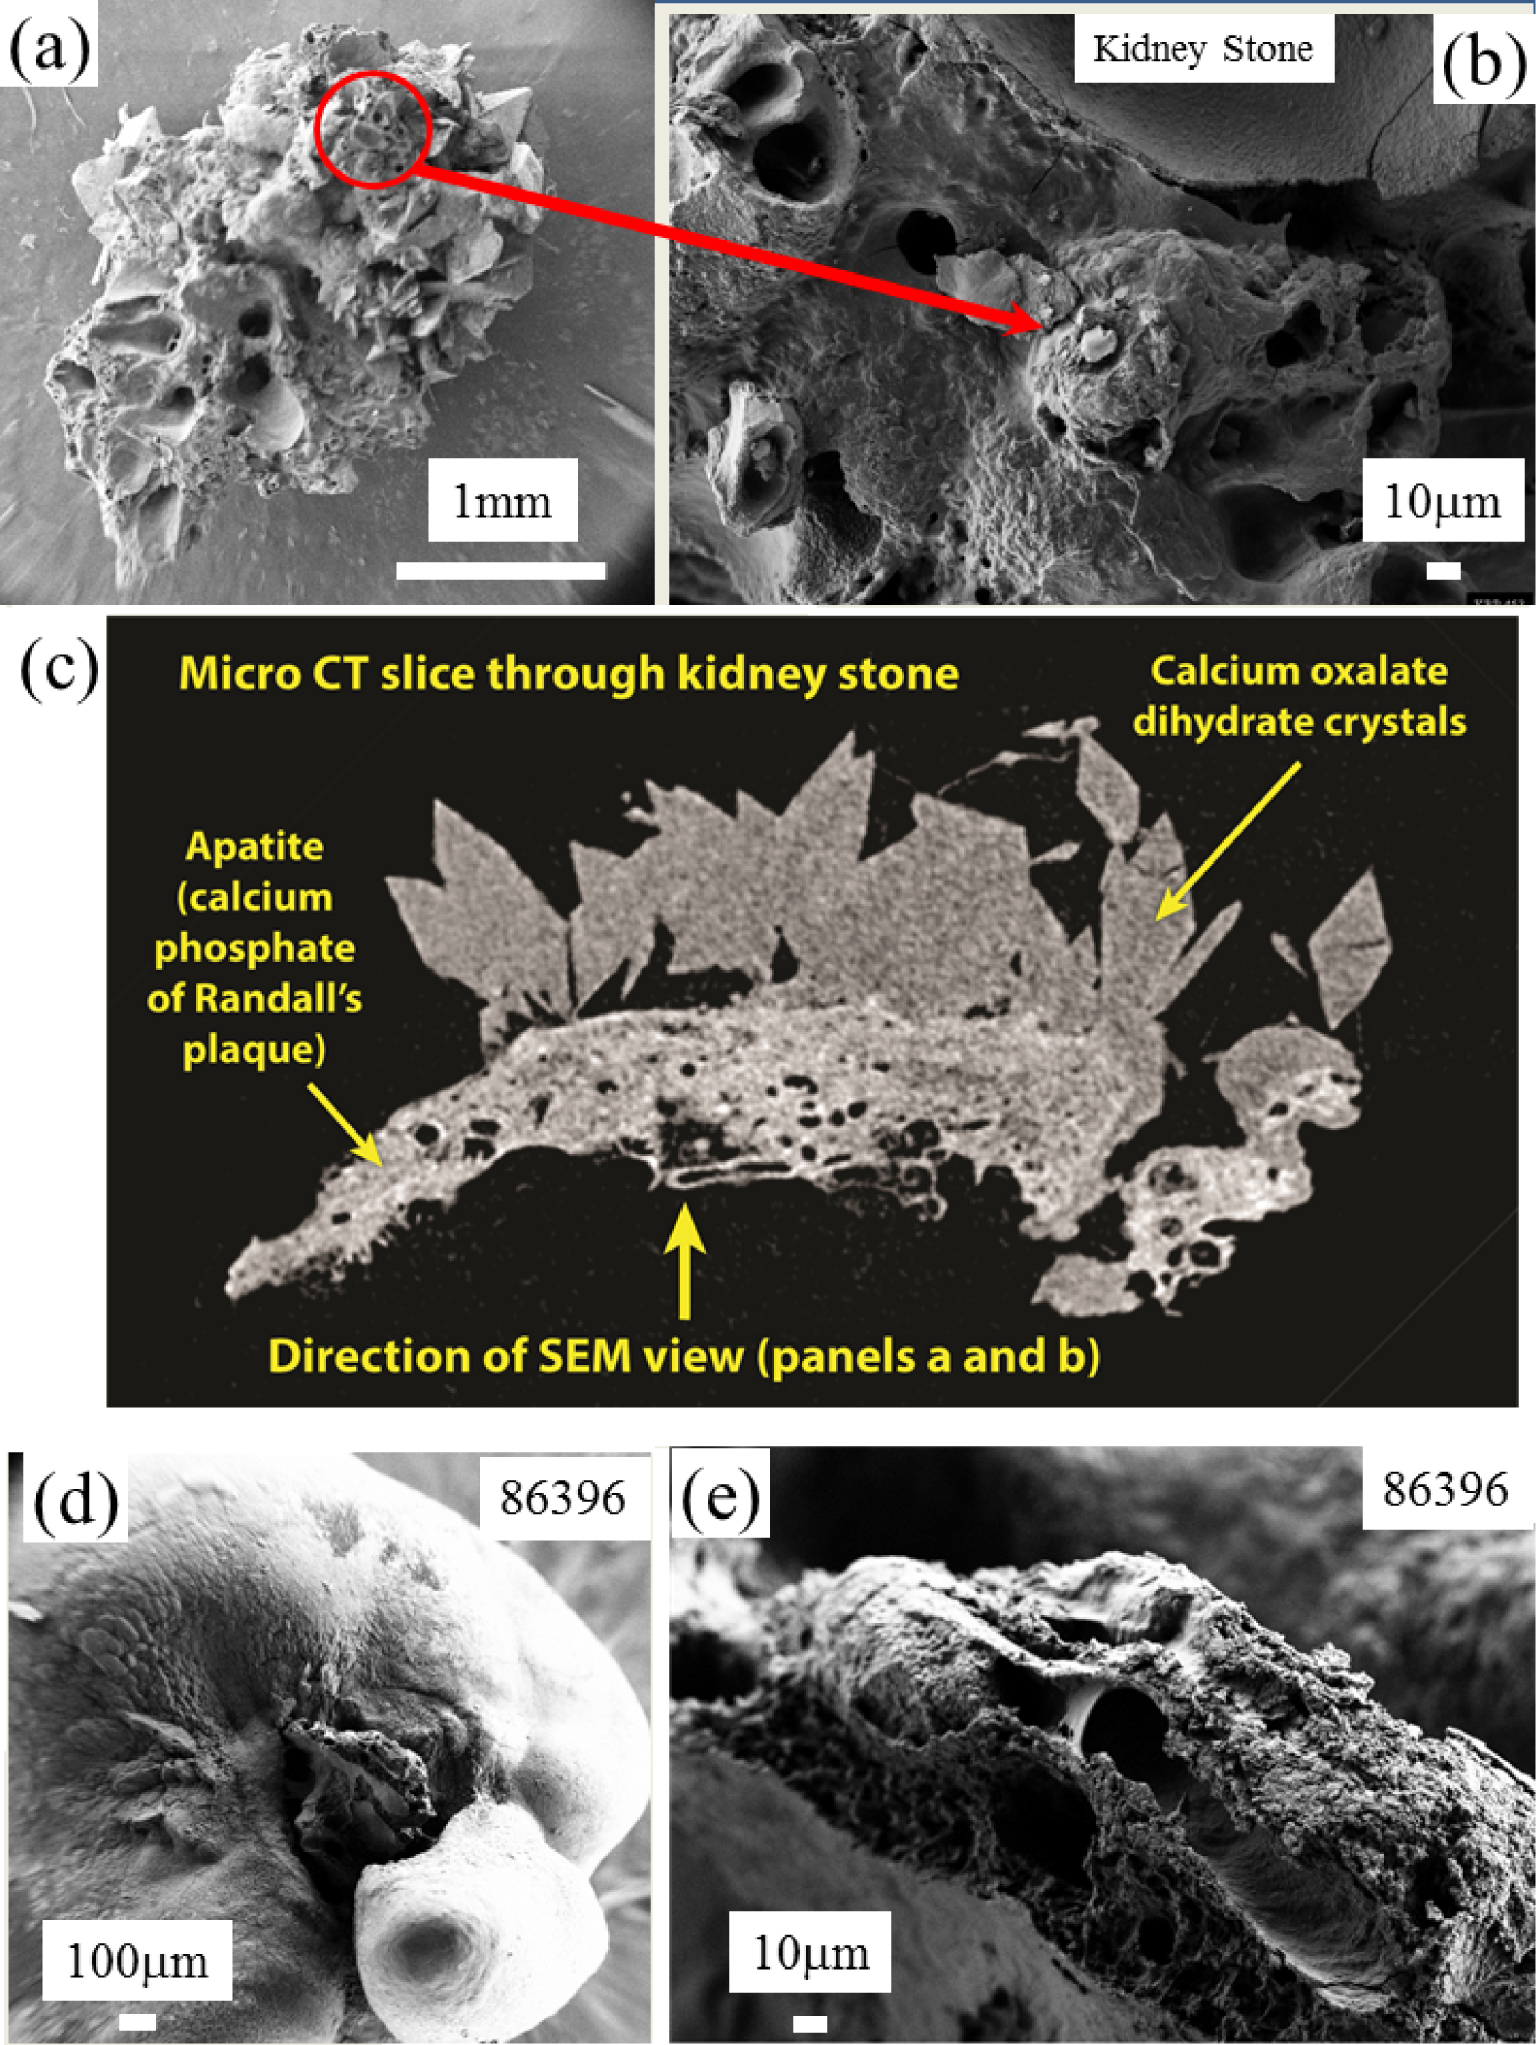
OPT-IR spectrum of the RP for the two samples giving the same chemical composition namely a mixing of ACCP and CA compounds.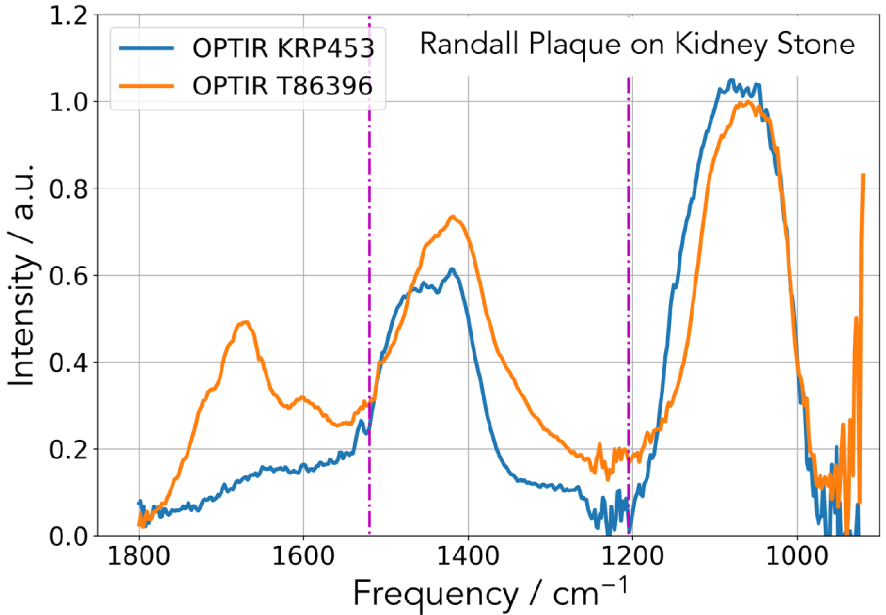
4. Another pathological calcifications: the case of breast cancer
As underlined previously, microcrystalline pathologies affect all the Human organs and among them the presence of calcifications in breast is of primary importance due to its possible link to cancer. Breast cancer is a worldwide public health problem and is the most common cause of cancer deaths, accounting for approximately 16% of cancer deaths in adult women [145]. Breast microcalcifications (BMC) which appear as white spots or flecks on a mammogram are related to calcifications in which the diameter is less than 1 mm [146, 147, 148, 149, 150, 151, 152]. At this point, it is worth to mention that the current spatial resolution mammographs without magnification ranged between 100 and 200 μm [149].
In a recent publication, we have underlined that microcalcifications as seen through usual mammography are made of nanometer scale breast calcifications made of spherical entities [8]. Such structural characteristic leads to the fact that the determination of the chemical composition of such nanometer scale entities cannot be performed through classical μFTIR spectroscopy. This is due to the chemical diversity of BMC in which different chemical phases namely calcium oxalate dihydrate [153], amorphous and nanometer scale crystals of calcium phosphate apatite with different levels of carbonatation [8, 154, 155, 156, 157] as well as whitlockite (Wk) [158, 159, 160, 161] have been identified. For BMC, the number of chemical phases is thus quite low compared to the number of chemical phases identified in ectopic calcifications present in kidney (four instead of 24) [4, 55]. It is also worth to underline the importance of micro and nano spectroscopies which are able to point out the variation of the level of carbonatation from the core to the surface of a BMC [8].
In Figure 20, we show SEM observations of microcalcification displaying a typical morphology related to Wk (different from the one observed in kidney stones [19]). Due to the small size of this abnormal deposit, it is quite difficult to obtain an IR spectrum with a sufficient signal to noise ratio with a classical μFTIR experimental device.
SEM images of an agglomeration of Wk crystals present in a breast biopsy.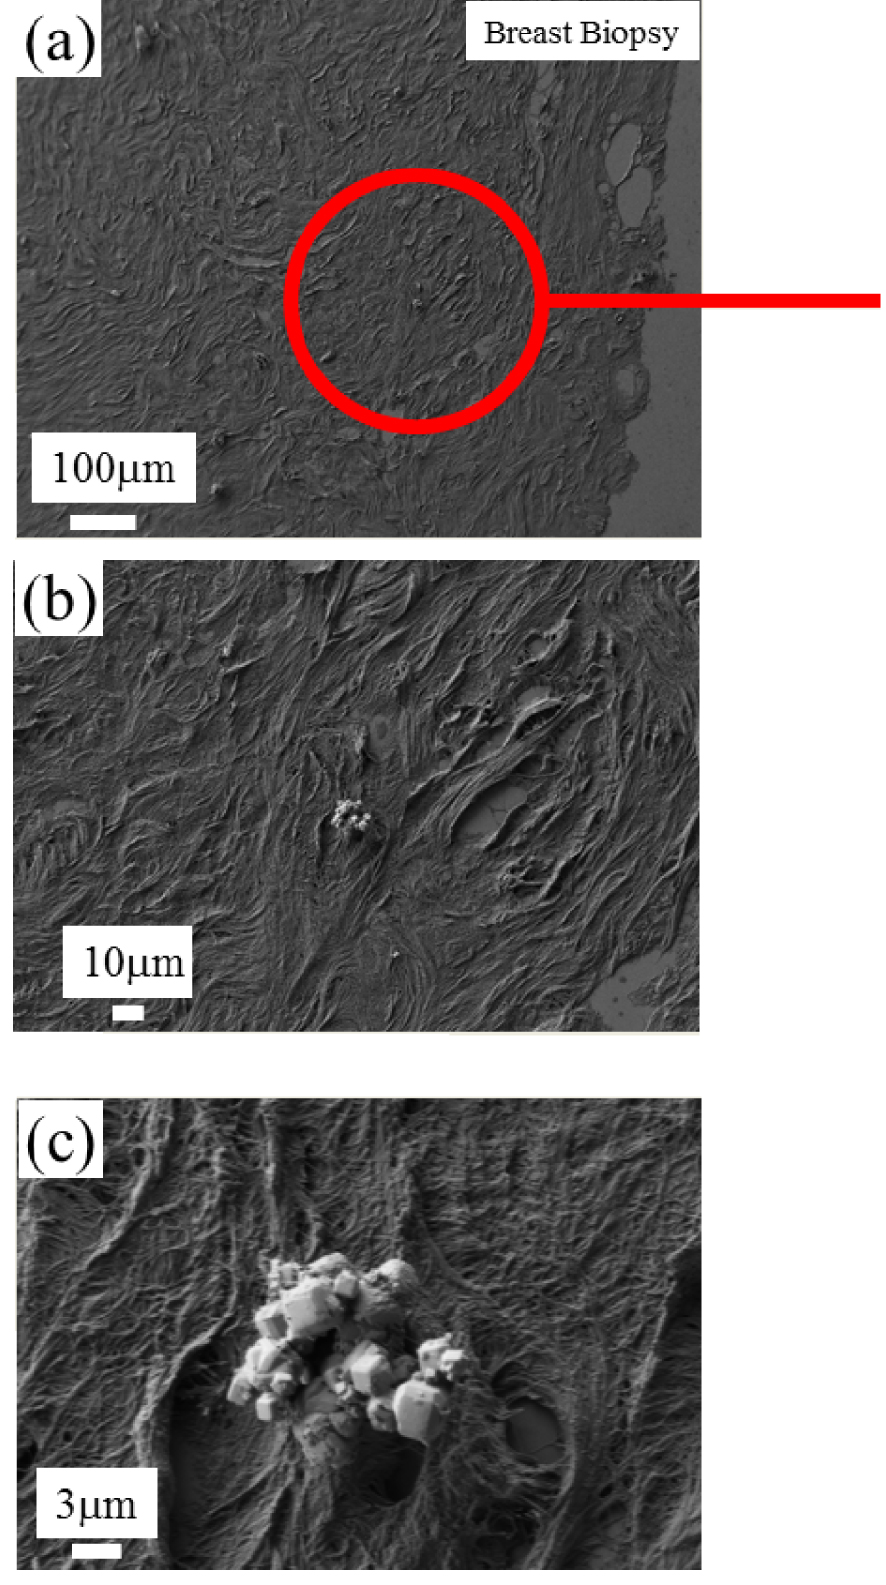
In Figure 21, we can see clearly than the OPT-IR nanospectroscopy is able to collect a significant IR spectrum which underlines the presence of whitlockite in the chemical composition of this abnormal deposit present in breast biopsy. OPT-IR nanospectroscopy seems to underline the presence of a calcium phosphate compound but it is quite difficult to say that this signal corresponds to Wk.
FTIR imaging of the deposit identified through SEM (Figure 20). (a) k-means cluster map of the observed area, the colors are related to the cluster defined on (c). (b) Distribution of the integral value between 1100–1200 cm−1 highlighted in red in the bottom panel (c) Cluster averages based on (a). Here C1, C2, and C4 clusters were merged (shown in black) as they belong to the surrounding tissue. Data were collected with an Agilent imaging set up. An OPT-IR spectrum collected from the sample inclusion of B547 and μFTIR spectra recorded on a reference sample are shown in teal and magenta colors, respectively. The regions accessible with the dual-band QCL are plotted with continuous and the parts not covered by the laser with dashed line.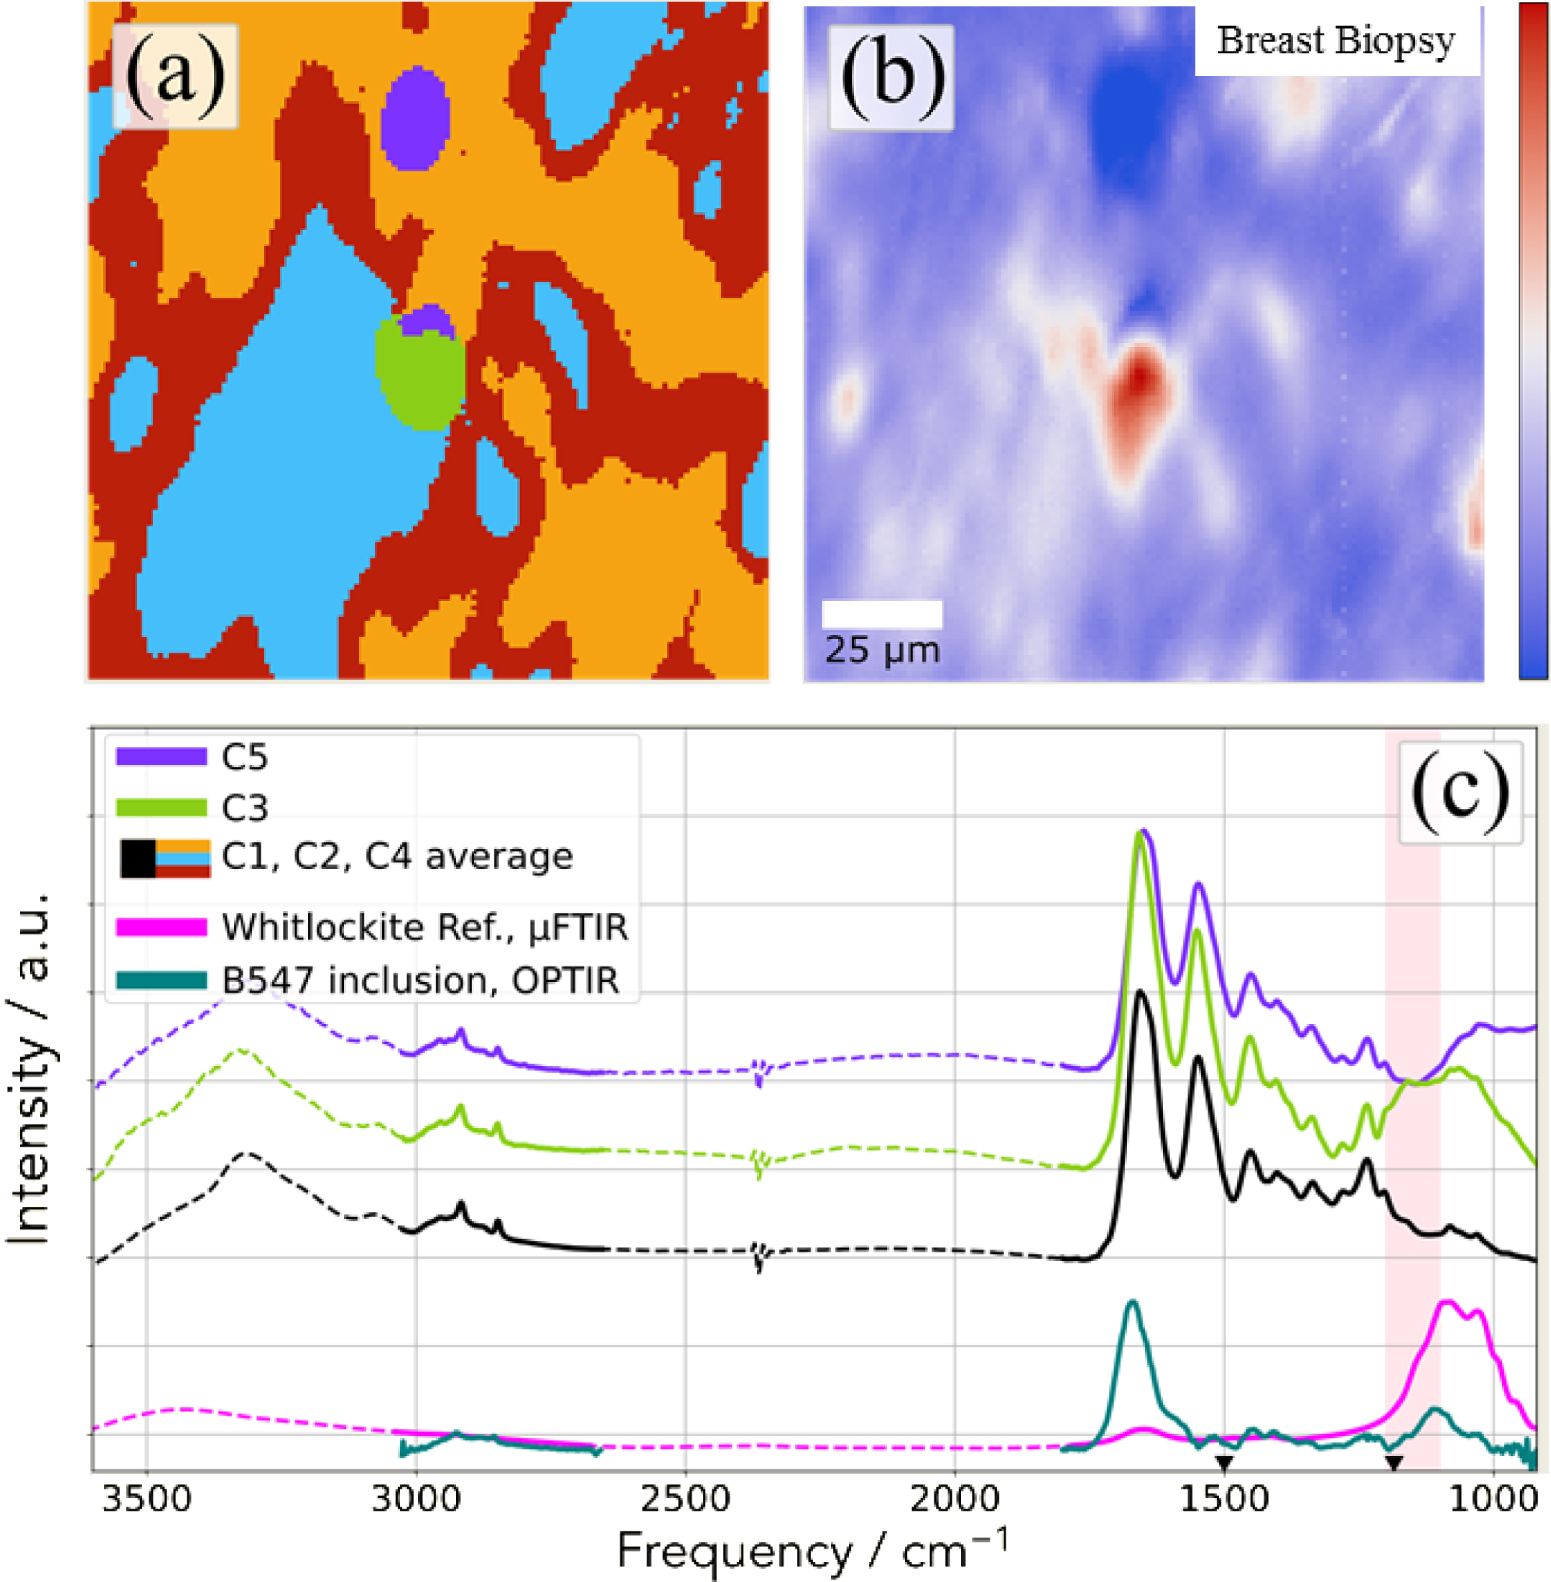
On Figure 22, the FTIR spectra of calcium phosphate identified in PMCD have been plotted. As we can see, it is details on the absorption bands (shoulders and shift) which are the keys to distinguish between Wk, ACCP and CA. Considering all the IR spectra we have collected through OPT-IR, it seems that such discrimination between all the calcium phosphate compounds is quite difficult.
Classical FTIR spectra of calcium phosphate compounds identified in PMCD namely Wk (in black) with the splitting at 1081 and 1031 cm−1 and of a mixing of ACCP and CA (in red) with the shoulders at 1097 cm−1 (corresponding to CA) and 1068 cm−1 (corresponding to ACCP).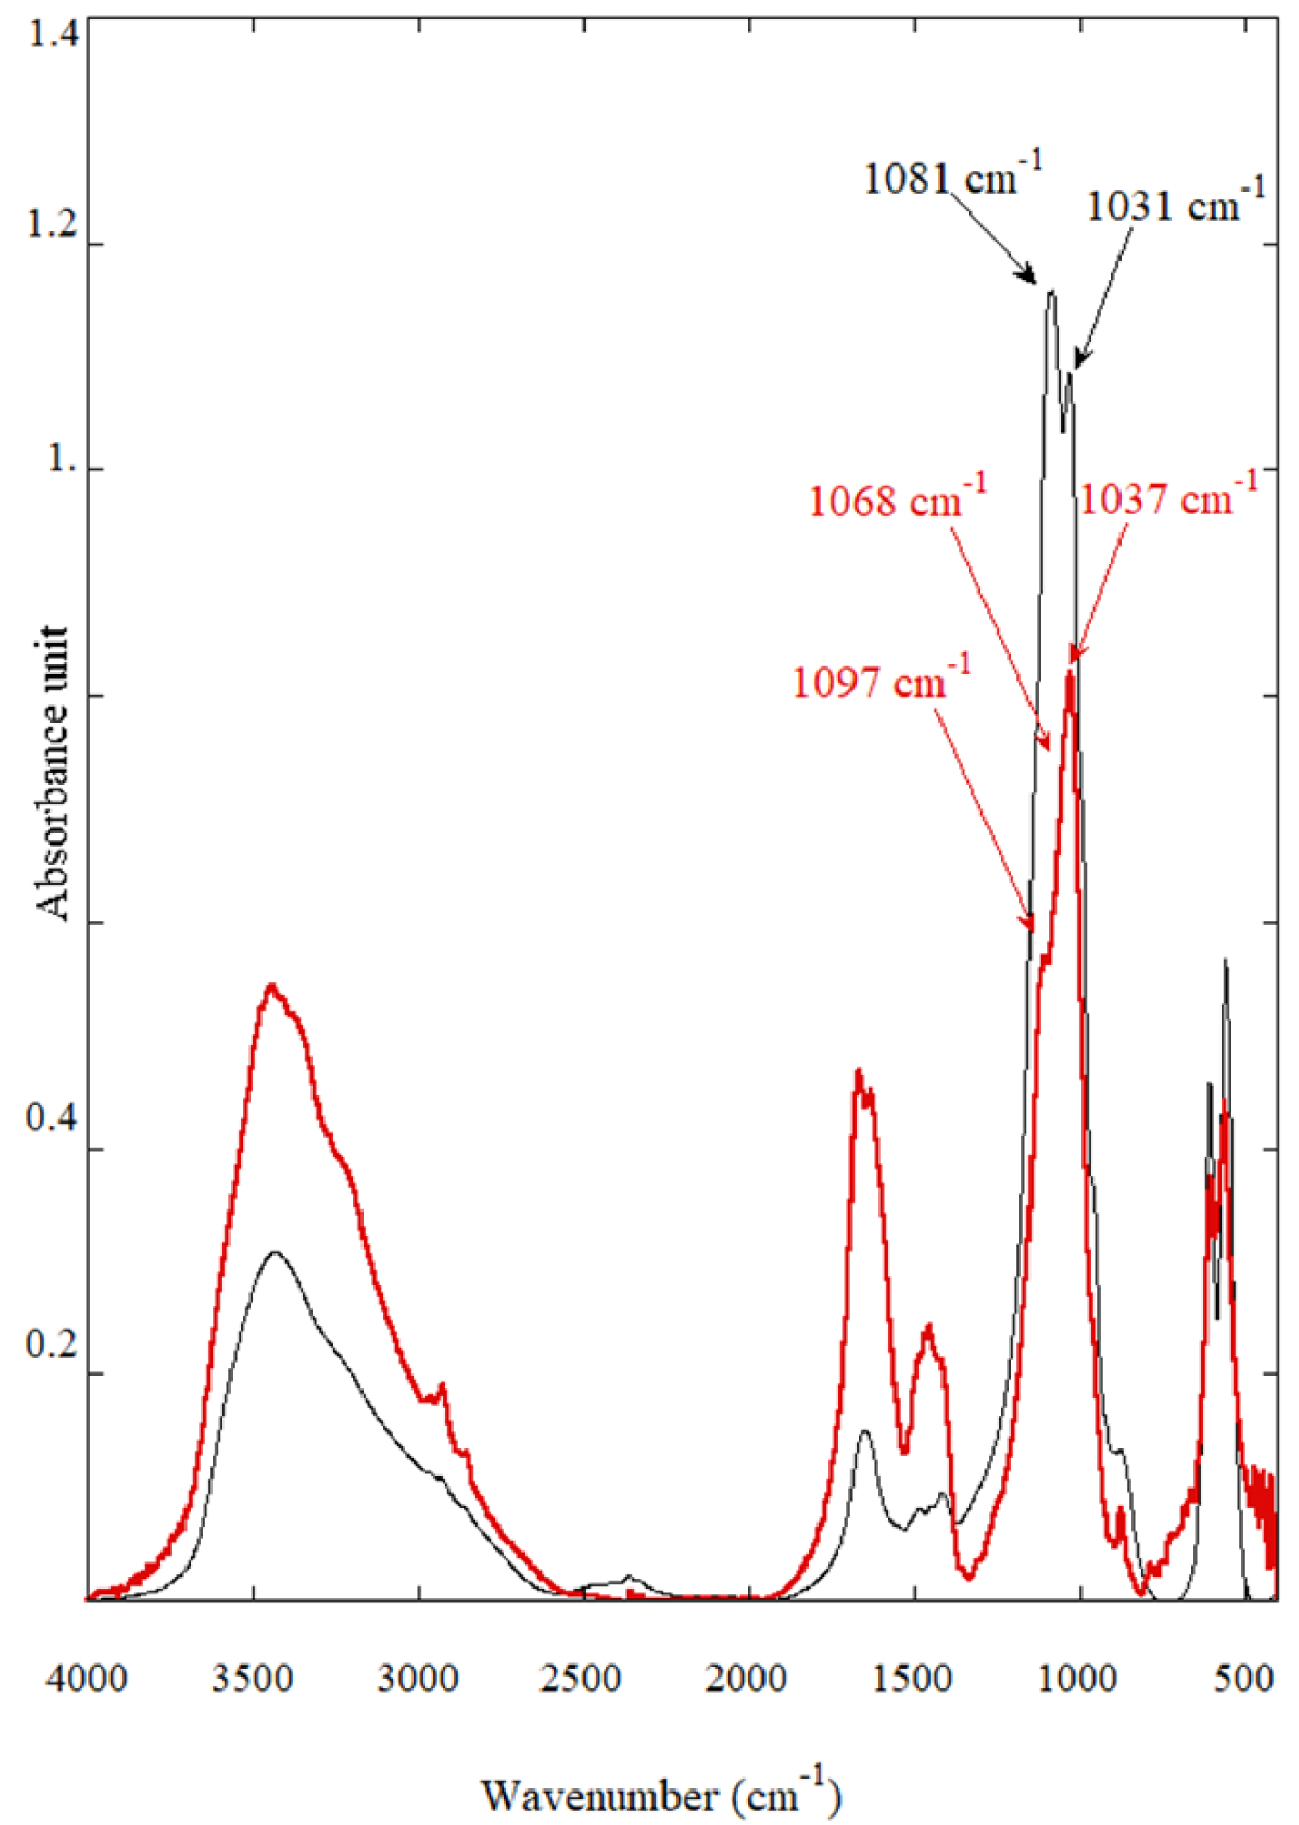
5. Conclusion
It is well accepted in the medical community that conventional IR spectroscopy constitutes the golden standard to obtain a precise chemical composition of kidney stones. The emergence of IR spectroscopy associated to spatial resolution below one micrometer constitutes an incredible opportunity to describe chemical heterogeneity or interface of complex biological samples.
In this contribution we have considered different chemical phases which have been identified in pathological concretions and tissue crystalline deposits. The comparison between IR spectra collected with conventional IR spectroscopy and IR spectra collected at the nanometer scale through OPT-IR may show significant discrepancies depending on which chemical phase is investigated. Such differences exist for other spectroscopies such as AFM-IR or Raman spectroscopy and may have different origins.
In the case of pathologies related to cystine and DHA crystals, the signal to noise ratio is excellent and thus characterization at the nanometer scale through IR spectroscopy can be considered for organic compounds. For the other chemical phases, namely minerals with broad IR absorption bands, such characterization seems to be more difficult. Let’s recall also that a shift (a few cm−1) of IR bands for calcium oxalate may be associated to the presence of both COD and COM (underlining that the patient suffers from hyperoxaluria (linked to the presence of COM) and hypercalciuria (linked to the presence of COD). One problem comes from the possibility to distinguish between different calcium phosphate compounds which is clearly a limitation in the case of breast calcification.
Complementary experiments are ongoing to clearly define the origin of the discrepancy which can exist for different chemical phases identified in pathological calcifications between conventional μFTIR and OPT-IR spectroscopy.
Conflicts of interest
Authors have no conflict of interest to declare.