

1 Introduction
In September 2009, a 64-year-old woman was admitted to Necker hospital for rapidly progressive renal insufficiency failure with a serum creatinine increased around 500 μmol/l giving an estimated glomerular filtration rate of 10 ml/min/1.73 m2, which corresponds to a severe impairment of kidney function (normal value >90 ml/mn/1.73 m2). Her past medical history revealed well controlled hypertension diagnosed 10 years ago, and chronic renal failure diagnosed 2 years ago with a serum creatinine of 215 μmol/l, initially attributed to nephroangiosclerosis (Fig. 1a). Because no obvious cause for her rapid worsening of her renal failure was found, a kidney biopsy was performed, showing an extensive tubulo-interstitial fibrosis scattered with multiple small crystals.
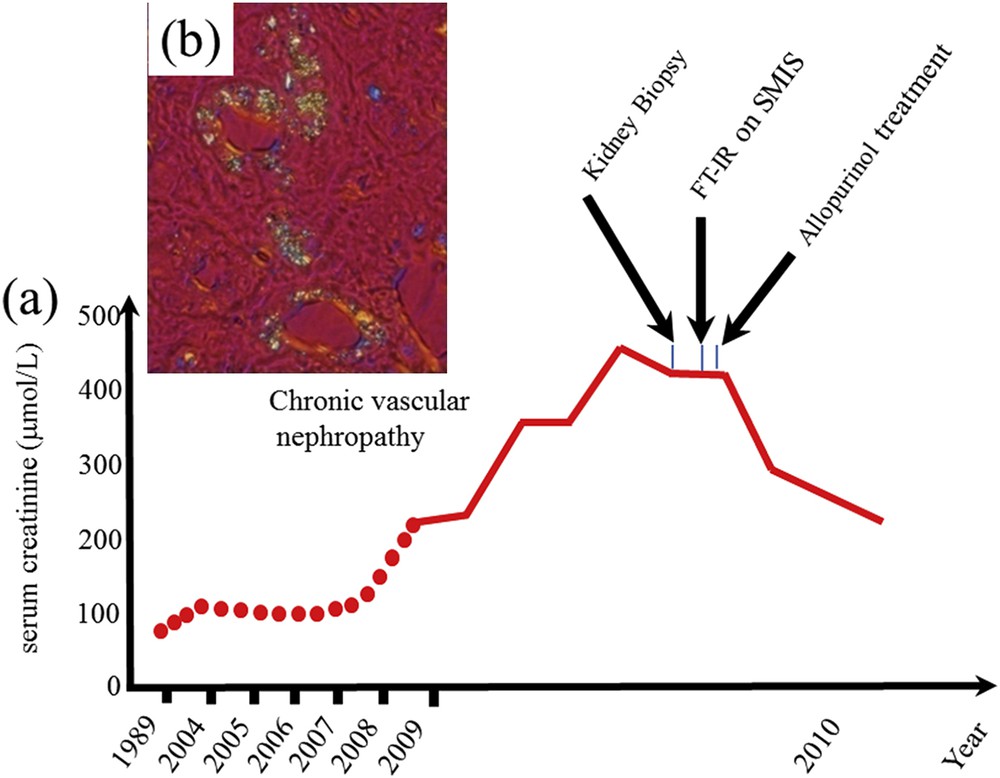
(a) Evolution of the kidney function as given by the serum creatinine. The medical diagnosis from crystals in the kidney biopsy cannot be performed at the hospital (in a short time). As we can see the FTIR measurements performed on the SMIS beamline of the Soleil synchrotron radiation center allow us to identify unambiguously the crystals and allow the clinician to give the right treatment and finally the serum creatinine decreased significantly avoiding dialysis and a kidney graft for the patient. (b) Abnormal deposits observed in the tubular cells and interstitium.
The initial clinical diagnosis suggested adapting the analyses to a search for the presence of 2,8-dihydroxyadenine (DHAd), a compound produced by the body when it is unable to recycle adenine, a molecule that plays a vital role in human beings [1–6]. Recent data suggest this disease could be less rare than commonly reported [7]. For this patient, very small size crystals were observed through optical microscopy and techniques at the hospital were definitely not able to determine their chemical nature (Fig. 1b). Another way is to perform a genetic study. Such investigation is quite long and expensive. To attain this goal, we selected μFourier Transform Infrared (FT-IR) spectroscopy and finally went to the SMIS (SMIS stands for Spectroscopy and Microscopy in the Infrared region using Synchrotron) beamline located at the Synchrotron Radiation national center, namely SOLEIL (Source Optimisée de Lumière d'Energie Intermédiaire du LURE)-Synchrotron to perform such an experiment. Quickly, the presence of DHAd crystals has been identified in the kidney biopsy. This early diagnosis made all the difference. The medical treatment (now allopurinol or febuxostat) of the disease thus identified is available and was applied at once. The kidney function of the patient finally recovered and this patient avoided dialysis processes as well as the kidney transplantation. This clinical case has been reported on different websites [8] and published [9]. Since this experiment, such an approach has been performed for seven other patients. Now, we have started a larger survey on grafted patients (more than 300 patients are engaged in this investigation), such experiments being performed either at the Tenon hospital or at the LCMCP – UPMC on a last generation μFTIR spectrophotometer [10]. The complete set of results brings invaluable information to the clinician regarding the relationship between the presence of deposits and the kidney function. More precisely, we point out a chemical diversity regarding the ectopic calcifications present in kidney biopsies and the fact that in a significant number of cases, several chemical compounds can be identified on the very same kidney biopsy [10,11]. For kidney biopsies which display submicrometer crystals, we have developed other kinds of experiments (see the contribution of M. Refregiers).
Of note, irrespective of the human cost, the financial cost of an undiagnosed case leading to ESRF (End Stage Renal Failure) is at least 85 k€ per year for dialysis (the average time before kidney transplantation is about 18–24 months), 85 k€ for the kidney graft (around 3100 kidney transplantations per year in France, that means 3100 × 85 k€, not far than the price of SOLEIL synchrotron) and finally 10 k€ per year of medical therapy, management of side effects and follow-up of the patient. By comparison, the cost of 8 h synchrotron to establish a clinically relevant diagnosis is 4 k€ (half hour is in fact sufficient) while the price of a last generation in lab μFTIR spectrometer is around 100 k€ and the cost of an analysis on this equipment is around 160€.
More generally, acute renal failure (ARF), which can be induced by a wide range of pathophysiological events, is defined in general terms as an abrupt decrease in renal function leading to retention of nitrogenous waste and disruption of fluid and electrolyte homeostasis [12,13]. An increased body of evidence suggests that crystal formation plays an important role in acute kidney injury and most likely also in the development of chronic kidney disease [14–18]. We have demonstrated that a thorough chemical analysis of the pathological calcifications present in kidney biopsies constitutes a major opportunity for indirect diagnosis of genetic diseases as well as a significant axis of research [9,11,19–22].
Methods used in the hospital setting to gather information on pathological calcifications in biopsies are based on staining procedures [23,24]. Different publications underline some major limitations of such procedures for the characterization of ectopic calcifications [25] and staining procedures such as von Kossa staining alone are not sufficient for identifying and quantifying apatite [26]. Such pitfalls are linked to a significant chemical diversity of pathological calcifications present in kidney biopsy. The presence of compounds such as amorphous silica, sodium hydrogen urate, methyl-1 uric acid and four different Ca phosphates as carbapatite, whitlockite, octacalcium phosphate and amorphous carbonated calcium phosphate in samples [9,27] makes such staining procedures clearly inappropriate.
All these limitations call for an approach that is able to combine techniques available at hospitals with chemical and materials science analytical techniques [28–30] such as Scanning Electron Microscopy (SEM) [31–40], Micro-Computerized Tomography [41–43], μFTIR and Raman spectroscopies [44–51], NMR [52–59], fluorescence induced by X-ray [60–65] or protons [66–70], Mass Spectrometry [71–73], ion chromatography [74], Laser capture microdissection coupled with label-free mass spectrometry [75], X-ray or neutron scattering [76–83] or X-ray absorption spectroscopy [84–96]. It is quite clear that characterization techniques specific to large scale instruments developed to describe at the atomic scale nanometer scale materials can be very useful [97–103]. These characterization techniques can be completed by a modelization of the pathogenesis of these calcifications [104–111].
In this report, we first address the possibility of coupling different classical observations on the very same kidney biopsy material through Field emission scanning electron microscopy (FE-SEM) experiments combined with energy dispersive spectroscopy as well as measurements through Raman and μFTIR spectroscopy. Then, on the same sample, observations using cutting edge technologies such Synchrotron Radiation (SR) – FTIR or SR-UV visible spectroscopy could be performed when ectopic calcifications are made of microcrystals. The complete set of observations will help the clinician gather information regarding the nature and the spatial distribution at the subcellular scale of different chemical phases present in the kidney biopsy material as well as the morphology of the crystal.
2 Materials and methods
A set of six kidney biopsy samples was investigated. The biopsies were performed at Tenon Hospital (Paris, France). Five-micron slices of the tissue samples were deposited on low-e microscope slides (MirrIR, Kevley Technologies, Tienta Sciences, Indianapolis). For tissue embedded in paraffin, the paraffin was chemically removed with xylene in order to improve crystal detection under the microscope. Each sample was identified by a study number and anonymized. The ethical committee of Tenon Hospital had approved the patient consent procedure.
Raman micro-spectroscopy data were recorded on a DXR Raman microprobe (ThermoScientific, Courtaboeuf, France) equipped with a CCD detector. A 10 mW, 532 nm laser was used for excitation and was focused on the sample by using a 100×/0.8NA objective giving a spot size of 0.7 μm. The spectra were collected between 100 and 3500 cm−1 using low resolution grating and a 25 μm slit, giving a spectral resolution of 2–4 cm−1. Spectra were collected at 5 μm interval in X and Y with 2 accumulations of 5 s. Data analysis of Raman spectra and chemical images was performed using OMNIC software (Thermo Scientific).
The UV Visible imaging system is built around a Zeiss Axio Observer (Carl Zeiss, Fr) inverted microscope constructed with quartz-only optics. The white beam of the DISCO beamline at Synchrotron SOLEIL [112] is monochromatised by using an iHR320 (Jobin-Yvon Horiba, Longjumeau, France) before coupling with the entrance of a modified Zeiss Axio Observer Z1 (Carl Zeiss, Germany). A sharp dichroic mirror transmitting only above 300 nm (Omega Optical, Brattleboro, Vermont) reflected the incident light that is further focused onto the sample through a Zeiss Ultrafluar 40× objective (N.A. 0.65, glycerin imm) [113,114]. Fluorescence images were recorded with a Princeton Pixis 1024-BUV (Princeton Instruments, USA) camera after selection through a series of bandpass filters (Semrock, Rochester, USA). Fluorescence images were typically recorded in 10 s exposure. The whole system is controlled via μManager software [115].
A Zeiss SUPRA55-VP SEM was used for observation of the microstructure. This field-emission “gun” microscope (FE-SEM) operates at 0.5–30 kV. High-resolution observations were obtained by using 2 secondary electron detectors: an in-lens SE detector and an Everhart–Thornley SE detector. Measurements were taken at low voltage (between 0.5 and 2 kV) without the usual deposits of carbon at the surface of the sample (Fig. 2a). Energy Dispersive X-ray (EDX) experiments can also be performed. In order to perform Ca cartography, the FE-SEM operated at 12 kV.
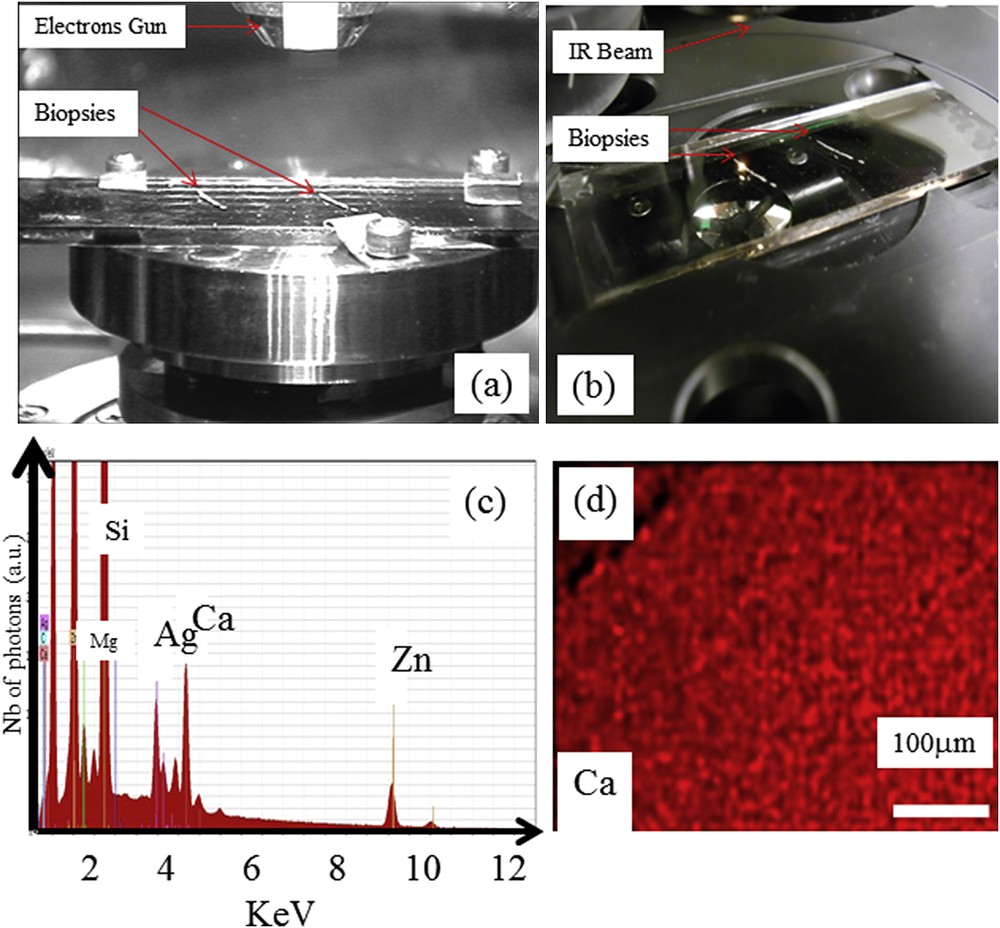
The very sample kidney biopsy sample can be positioned either in the FE-SEM (a) or in the SMIS beamline (b). EDX spectrum of the support (c) imaged with secondary electron detectors (d) showing an homogeneous spatial repartition of Ca on the support as measured by EDX.
To obtain Density Dependent Electron Micrographs (DDC-SEM), [116] samples were coated with carbon and imaged with a secondary in-lens detector and with a backscattering detector at 10 kV.
SR IR micro-spectroscopy was performed at the SMIS beamline (Fig. 2b) at the SOLEIL Synchrotron Radiation Facility (Saint-Aubin, France) operating at 2.75 GeV with a current of 430 mA delivered in top-up mode. Details of the experimental procedure have already been described [117]. IR photons are created by the electrons deflected from a bending magnet in the storage ring. The IR photon source is coupled to a ThermoScientific Nicolet 5700 FTIR spectrometer. Attached to the spectrometer is a CONTINUUM XL microscope (ThermoScientific, Courtaboeuf, France). The detector of the IR microscope is a liquid nitrogen-cooled mercury–cadmium–telluride (MCT-A) detector (50 μm). The microscope was operated in confocal mode, using a 32× infinity corrected Schwarzschild objective (NA = 0.65) and a matching 32× condenser. All spectra were obtained using a double-path single-masking aperture (confocal arrangement), size set to 10 μm × 10 μm. The spectra were collected in trans-reflection mode on the low-e slides, in the 4000–800 cm−1 mid-IR range at a resolution of 8 cm−1 with 16 co-added scans. Each spectrum was recorded in approximately 10 s.
IR micro-spectroscopy was also performed on an IN10MX microscope (Thermo Scientific) for recording large maps. All spectra were collected in ultrafast mode using a 50 μm × 50 μm aperture. The spectra were collected in the 4000–800 cm−1 mid-IR range at a resolution of 16 cm−1 with one spectrum per pixel. Data analysis of IR spectra and chemical images was performed using OMNIC software (Thermo Scientific) [118,119].
Before discussing the results of our experiments, it is important to examine the spectral contribution of the low-e support (without sample) through EDX spectroscopy. This experiment has been reported in Fig. 2c, which shows the X-ray fluorescence spectra induced by electrons in the presence of different trace elements on the support, such as Zn, Ca, Ag, Si and Mg. Special attention has to be paid to these elements when they are detected. We will see that in the case of Ca deposits, the signal coming to the sample is far more important than the Ca of the low-e support. It is thus possible to build different maps giving the spatial contribution of Ca. Also, the contribution of Ca present in the support is homogeneous (Fig. 2d).
3 Results and discussion
Characterization of kidney biopsy samples has to take into account two major specificities. The fact that such a sample is precious and that bleeding complications may follow the biopsy procedure (the percentage of patients that suffer severe complications after a kidney biopsy is less than 0.1) [120,121]. Moreover, such a kidney sample may contain ectopic calcifications constituted of fragile, organic or inorganic, micrometer-sized crystals. Therefore, μFTIR spectroscopy is to be selected first since it is a non-destructive technique. It offers the opportunity to characterize the crystals and to evaluate the surface coverage by the crystals. However, in few cases of very small organic crystals, for which the signal to noise ratio might be not enough to accurately determine the chemical composition, SR-μFTIR experiments can be performed. In the case of inorganic crystals, Raman experiments make it possible to characterize kidney biopsy tissue deposited on a classical hospital support (made of glass, which would be inadequate for FTIR) or evaluate surface coverage by using whewellite crystals (which can be related to the loss of kidney function).
Moreover, as underlined by numerous investigations performed on kidney stones, the crystal morphology could be relevant and must be assessed by scanning electron microscopy. Primary hyperoxaluria and eating disorders are pathologies associated with kidney stones made of the very same chemical phase, whewellite, but they can be distinguished through crystal morphology [122–124]. Thus, any possible modification of the morphology of inorganic crystals induced by Raman spectroscopy (because heating under the laser beam) must be considered and highlights the importance to well define the order of using the various physical methods. We would like now to discuss these different tools through the characterization of a set of six kidney biopsies.
3.1 The case of organic crystals
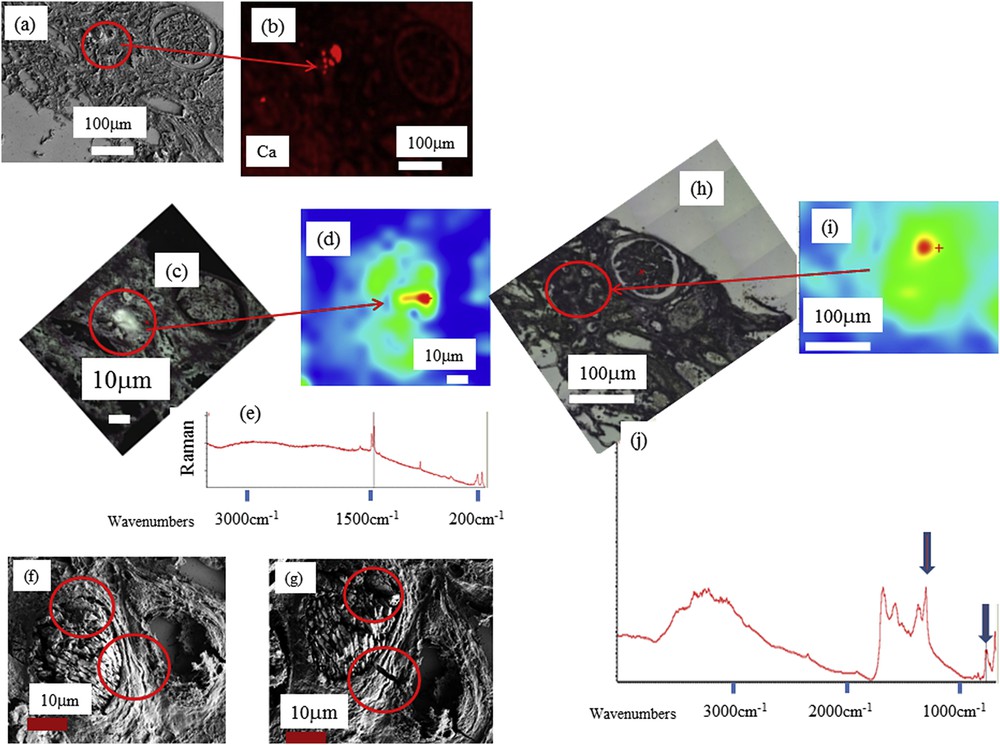
Some kidney diseases lead to the formation of organic crystals. This is the case for cystinuria which is caused by a mutation in renal epithelial cell transporters and leads to the formation of cystine kidney stones [17,83,125–133]. Adenine phosphoribosyltransferase deficiency is another rare inherited disorder responsible for the formation of DHAd crystals in kidney parenchyma which induce recurrent kidney stones and/or kidney failure [7,134]. This disease is often underdiagnosed even after conventional analysis of the kidney biopsy. Observations at the macroscopic scale (Fig. 3a and b) show a circular morphology. At higher magnifications, SEM shows a strong similarity between the morphology of DHAd crystals present in kidney biopsy (Fig. 3c) and the ones observed in DHAd kidney stones (Fig. 3d) [135]. In Fig. 3e, a typical FTIR spectrum is shown in which the different sharp absorption bands specific of DHAd crystals are clearly visible at 1446, 979, 795 and 762 cm−1.
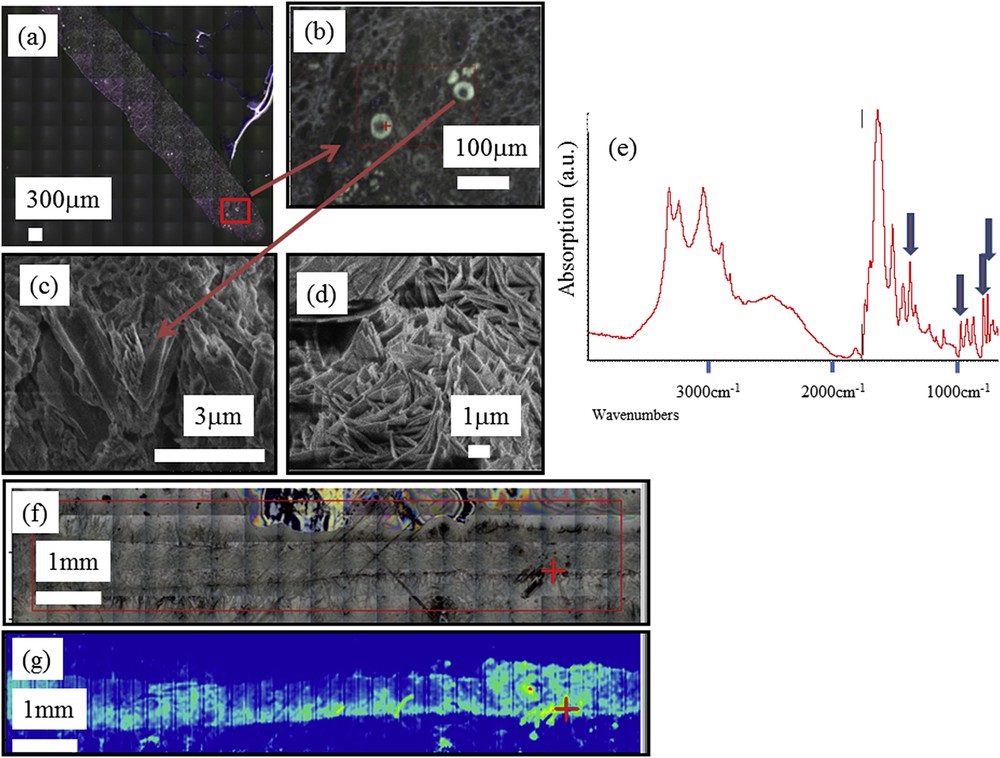
(a, b) Optical micrograph image of the human biopsy (c) SEM image of DHA multiple crystallites in a kidney biopsy (d) SEM image obtained of a DHA crystal in kidney stone. (e) Typical FTIR spectra collected on a μFTIR Experimental device (f) On the same sample (2a), large optical image and (g) Spatial distribution of DHAd crystals in the kidney biopsy as given by the maximum of a specific absorption band: the yellow areas (and still more for red ones) contain more crystals than other parts of the biopsy. The red plus-sign indicates the position of the beam.
When the acquisition time for each FTIR spectrum is fixed to 0.3 s using a IN10MX microscope, large maps can be collected in quite a short time, quickly producing chemical mapping of the kidney biopsy sample (50 μm × 50 μm for the spatial resolution) that provides significant information for clinical practice (Fig. 3f, g).
Another case of organic deposits in kidney biopsies is related to drug-induced nephrotoxicity. Foscarnet, a drug used against cytomegalovirus infection, was reported as crystals formed early in the kidney, in glomeruli of patients, resulting in acute kidney failure [136–139]. In a previous investigation, we found foscarnet crystals in glomeruli of a patient together with an accumulation of apatite crystals in cells of the proximal tubules [9]. In a set of FTIR experiments performed on a biopsy from another patient, we have observed the presence of foscarnet not in glomeruli but in tubules (Fig. 4a–c). These FTIR measurements were complemented by SEM observations to describe more precisely the morphology of foscarnet crystallites shown in Fig. 4d. These observations are important because the localization in tubules rather than in glomeruli may highlight another mechanism to explain the progressive kidney failure in this patient.
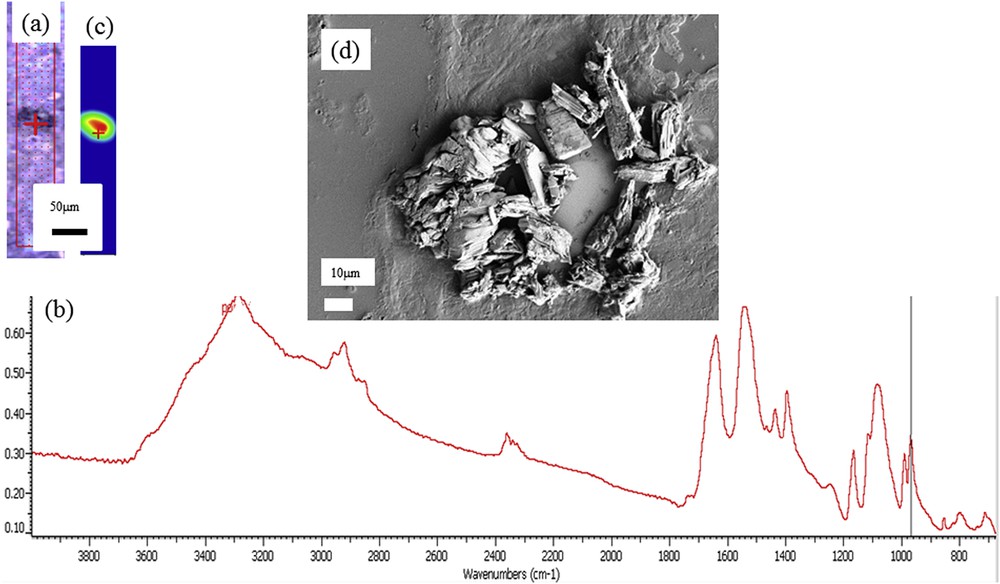
(a) Optical image of a human biopsy. (b) FTIR spectrum of foscarnet collected on a μFTIR experimental device. (c) Spatial distribution of foscarnet obtained from FTIR spectra obtained using the intensity of the IR absorption band at 970 cm−1. (d) SEM image of foscarnet crystals aggregated within a tubule in the biopsy sample.
3.2 The case of inorganic crystals
Despite the presence of Ca on the support (Fig. 2d), it is possible to obtain valuable information regarding the presence of Ca in the biopsy. Fig. 5a shows an image of a kidney biopsy at low magnification (167×) in which we can easily identify a glomerulus and different tubules. Calcium spatial distribution obtained through EDX spectra is given in Fig. 5b which clearly shows different areas containing high amounts of calcium pointing out the presence of ectopic calcifications.
Various images of a biopsy sample (ref. B212) containing whewellite crystals. (a) SEM observations (b) spatial distribution of Ca in biopsy as measured through EDX. (c) Optical dark field image of B212 in the Raman microscope (d) Spatial distribution of whewellite obtained with Raman spectroscopy, (e) typical Raman spectrum of whewellite (1460 cm−1, 1488 cm−1, 1628 cm−1, 895 cm−1). (f, g) SEM observations before (f) and after (g) RAMAN observations: in red circles we can see clearly some alterations induced by the laser beam. (h, i, j) μFTIR measurements: (h) optical image (i) whewellite distribution and (j) typical IR absorption spectrum (peaks at 1315 and 780 cm−1) obtained using last generation in lab μFTIR.
At this point, it is worth mentioning that EDX spectroscopy cannot distinguish between whewellite (CaC2O4·H2O) and weddellite (CaC2O4·2H2O), the two Ca oxalate phases identified in kidney stones. Such discrimination between these two chemical phases is of major clinical importance, because whewellite is associated with hyperoxaluria while weddellite is a signature of hypercalciuria [140,141]. Whewellite crystals are also found in kidney tissue in the case of heavy hyperoxaluria [142]. It is quite difficult to distinguish between whewellite and weddellite crystallites through FE-SEM mainly because these two chemical phases are associated with various morphologies. Moreover, due to experimental conditions (FE-SEM observations are performed under high vacuum), vibrational spectroscopies such as μFTIR or Raman constitute more efficient techniques.
It is well established that the contributions of whewellite and weddellite in FTIR and Raman spectra are easily separated owing to the very different values of the associated absorption bands. The position of signature bands for whewellite in FTIR spectroscopy is 1620, 1315, and 780 cm−1 (respectively 1460 cm−1, 1488 cm−1, 1628 cm−1 and 895 cm−1 for Raman) while for weddellite, FTIR absorption bands are 1643 cm−1 and 1324 cm−1 (respectively 1475 cm−1 and 909 cm−1 for Raman).
Taking into account the small size of the crystallites, Raman spectroscopy (Fig. 5c–e) seems to be even more effective than FTIR but this technique has several drawbacks. First, in Raman spectroscopy we have to take into account the presence of intrinsic autofluorescence background signals, which are usually a few orders of magnitude stronger than those arising from Raman scattering [143]. The presence of such autofluorescence can be a strong limitation of this technique to characterize crystals at the micrometer scale. Second, some patients present extremely low quantities of ectopic calcification with fragile, organic, micrometer-sized crystals; we have already observed that chemical characterization through Raman spectroscopy even at very low power induces significant alterations of their morphology and, sometimes, the destruction of the crystals in the case of very heat-sensitive species. Because human biopsies must be archived for patient follow-up/quality control, μFTIR spectroscopy, being non-destructive, is preferable to Raman spectroscopy to characterize kidney biopsy samples. Finally, even in the case of ectopic calcifications made of whewellite microcrystals, Raman spectroscopy can induce significant modifications (Fig. 5f and g) [144].
All these considerations suggest that classical μFTIR spectroscopy is a more effective technique to determine the chemical nature of ectopic calcifications (Fig. 5h–j). Last generation μFTIR spectroscopes are able to collect significant data even with a beam size of 10 μm.
Recently, we have underlined that significant breakthroughs can been made when cutting edge characterization techniques are used. We performed μSR-FTIR spectroscopy experiments to underline the chemical diversity of ectopic calcifications in kidney biopsies and to propose such techniques as an early diagnostic tool. The comparison of synchrotron and thermal (globar) source has been addressed elsewhere [145]. For the characterization of micrometer scale crystals present in biological tissues, there is not really a gap between last generation in lab experimental device and S.R. beamlines. Nevertheless, in some cases, crystals in tissues may be very small and classical FTIR microscopy may not be sensitive enough to identify their chemical composition. μSR-FTIR is a good alternative technique as it is able to collect vibrational spectra on these microscopic-sized minerals non-destructively. One limitation of these techniques is the fact that μFTIR analysis is based on reflectance, thus resulting in the loss of a fraction of the reflected beam to be collected by the detector because the samples are rarely perfectly flat. Another way to improve sensitivity of the measurement is to perform an ATR analysis which offers the opportunity to improve the collected signal from the sample. In return, this technique is locally destructive.
Starting with characterization through FTIR spectroscopy (Fig. 6a and b), additional information can be provided by DUV imaging of the same sample (Fig. 6c). The reconstructed image shows the fluorescence between 327 and 353 nm (blue), 370–410 nm (green) and 535–607 nm after 275 nm excitation (scale bar = 50 microns). The red channel corresponds to lipofuscin vesicles produced after tissular disorders, the blue channel may be related to protein accumulations, while the green channel shows constitutive tissues. A 3D reconstruction of the fluorescence induced by DUV synchrotron radiation of a crystal in a biopsy (Fig. 6c) is also available. When excited at 275 nm, the crystal presents a bright fluorescence at 580 nm, while the tissue shows mostly UV fluorescence.
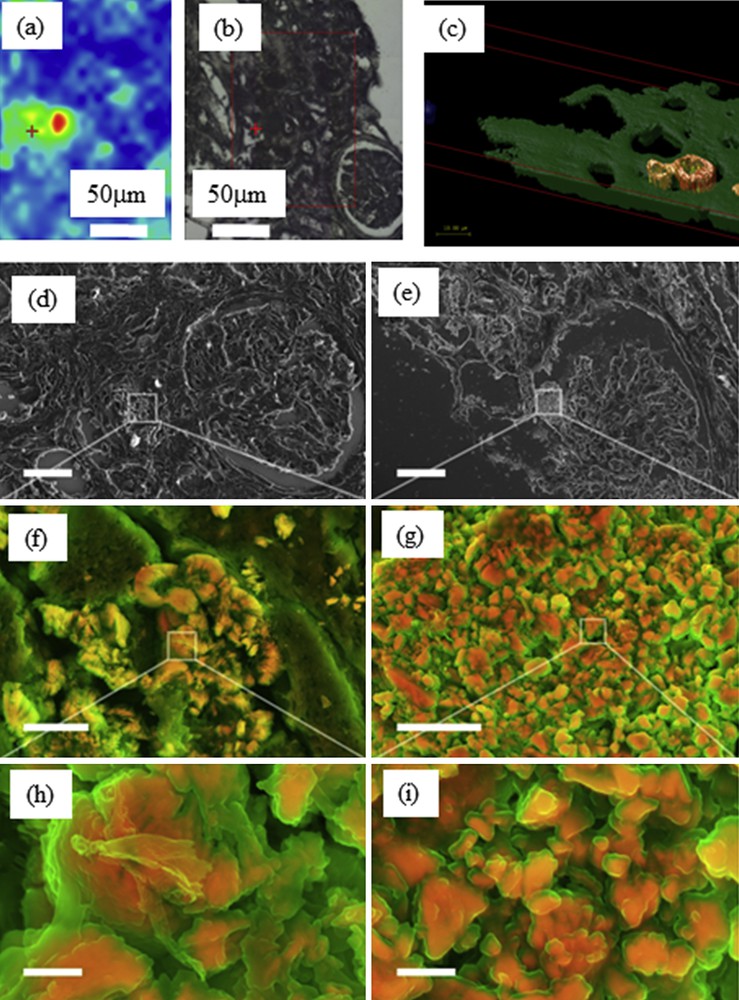
(a) Whewellite distribution and (b) optical image obtained on the SMIS beamline of Soleil synchrotron. (c) Reconstructed 3D-RGB image obtained using Deep UV data collected on the DISCO beamline (scale 10 μm). (d) Scanning electron micrograph and density-dependent color scanning electron micrographs (DDC-SEM) of kidney biopsy. Micrographs were colored in post-processing by combing images acquired by secondary and backscatter electron detectors [116]. The orange color identifies denser material; structures that appear green are less dense. These preliminary observations seem to show that two structures exist. At this point, we may have different possibilities either organic at the surface and whewellite at the core or amorphous whewellite at the surface and whewellite at the core. (d, e) Lower magnification. Scale bar = 30 μm. (f, g) Higher magnification of area presented in d and e. Scale bar = 5 μm. (h, i) Details of the crystals in f and g. Scale bar = 1 μm.
Finally, through scanning electron micrograph and density-dependent color scanning electron micrographs (DDC-SEM), we have investigated a kidney biopsy. The orange color identifies a denser material; structures that appear green are less dense. These preliminary observations seem to show that two structures exist. At this point, we have different possibilities either organic at the surface and whewellite at the core or amorphous whewellite [146] at the surface and whewellite at the core (Fig. 6d–i). SEM studies have previously confirmed the distinct structure of the various types of whewellite crystallite stones at the mesoscopic scale, as identified by macroscopic morphological examination. One of the striking points of this previous paper dedicated to kidney stones related to the fact that the morphology of whewellite crystallites is defined by the pathology. The peculiar morphology of the type Ic stones appears to be specific to genetic hyperoxaluria, which is thus steering the diagnosis towards a search for primary hyperoxaluria quite far from the observations made in the case of intermittent hyperoxaluria of dietary origin (type Ia stones, the most common). It seems thus that such diversity regarding the ectopic calcifications made of whewellite exists also in kidney biopsies but we must consider other factors that are able to modify the morphology of the crystallites such as the precise location (tubular lumen, cells or interstitium) where the crystals may be formed or aggregated. Indeed, at the microscopic scale, we observe clear differences between whewellite or dihydroxyadenine crystallite morphologies not yet well understood (Fig. 7). It was suggested that osteopontin may be an important factor influencing crystal appearance in the tissue [134,147]. Other factors and pathological conditions probably may also exert a significant influence on the crystal morphology.

Different aspects of dihydroxyadenine (a and c) and whewellite (b and d) crystallites in kidney biopsies.
Work is in progress to establish a possible relationship between the morphology of Ca oxalate crystallites in human biopsy and either the pathology and or loss of kidney function. Note that Ca oxalate stones are observed also in the case of ingestion of ethylene glycol-containing solution. Moreover, such description at the submicrometer scale of Ca oxalate crystallites may give information regarding the possible internalization process of Ca oxalate crystals [148], the interaction of these mineral phases and distal renal tubular cells [149].
4 Conclusion
Recent publications have demonstrated that techniques routinely implemented at hospitals, in the determination of the chemical nature of micro-calcifications in kidney biopsies, such as staining procedures, have major drawbacks. Moreover, such techniques are not able to accurately describe the crystal morphology, a parameter which could have important clinical significance. To attain these goals, classical as well as cutting edge characterization techniques can be used. Our data clearly show that major breakthroughs have been obtained; these techniques are already used as early diagnosis tools to understand the biochemical process related to the genesis of pathological calcification.
More precisely, we assessed the use of FE-SEM-EDX and micro-spectroscopy techniques such as Raman, conventional and SR-FTIR micro-spectroscopy on human kidney biopsy samples. Combining conventional FTIR micro-spectroscopy with FE-SEM-EDX seems to be a more effective approach. As underlined previously, the use of SR-FTIR micro-spectroscopy is relevant for crystals smaller than 10 μm. Also, we have shown that scanning electron micrograph and density-dependent color scanning electron micrographs (DDC-SEM) of kidney biopsy tissues are able to describe precisely the structures of whewellite crystallite ectopic calcifications.
Taken together, all these techniques are already at the core of an early diagnosis tool kit and may allow clinicians to collect different kinds of information and to identify unambiguous crystal deposits involved in kidney dysfunction. Finally, the latest developments performed in UV visible micro-spectroscopy show that we are on the verge of collecting exciting results regarding the spatial distribution of organic compounds at a resolution reaching 150 nm.
The approach which underlined the importance of the interface between chemistry, physics and medicine [149–157] described here could also largely benefit pathologists working on other diseases. Indeed, pathological calcifications can be present in different tissues, for example in cartilage [158–162], prostate [163–168], vascular system [36,169,170], salivary glands [80] or breast tumors [171–179]. Of note, characterization techniques such as FTIR are also used in epidemiologic investigations [180–182].
Acknowledgments
This work was supported by the Physics and Chemistry Institutes of the “Centre national de la recherche scientifique” and by contracts ANR-09-BLAN-0120-02, ANR-12-BS08-0022, ANR13JSV10010-01, convergence UPMC CVG1205 and CORDDIM-2013-COD130042. The authors are grateful to the Soleil SR Facility for beam time allocation (proposal numbers DISCO-20130967, SMIS- 20130016, DISCO-20120747, SMIS-20120070, SMIS-20110084, SMIS-20100566, DISCO- 20100565, DISCO-20100505, DISCO-20100502, SMIS-20100039). S.B. is supported by Junior Research Fellowships at Imperial College London.