


 CC-BY 4.0
1. Introduction
The almond tree, Prunus dulcis (Mill.) D.A. Webb (Rosaceae), was already cultivated in Central Asia 5000 years ago [1], then spread to the Mediterranean basin [2], and later to other countries. The almond tree is well adapted to the Mediterranean climate, and tolerant to drought and summer heat. Most of the almond trees have low chilling requirements, but there is a high variability for the blooming time ranging from February to March. About fifty varieties are grown worldwide, with a genetic base mainly founded on three cultivars, Tuono, Cristomorto, and Nonpareil [3]. In France, five varieties released from the INRAE breeding program are mainly cultivated: Lauranne, Mandaline, Ferragnès, Ferraduel, and Ferrastar [4].
The almond tree represents a global economic stake with an unshelled almond production of 4 million tons in 2021, for a total crop area of 2.3 million hectares (source: FAO) and 57% of current production comes from the United States of America. World production and harvested area have increased by 30% in 10 years. French almond consumption has increased and is continuing. In 2021, 47,111 tons of shelled almonds were imported by France, while only 1940 tons were produced locally, representing a cost of 238 million euros (source: French customs). The country is working towards developing a local and sustainable almond industry to reduce its dependence on imports.
The almond tree is susceptible to a range of diseases and pests, including those caused by fungi, bacteria, root-knot nematodes, and insects like Eurytoma amygdali End. (Hymenoptera: Eurytomidae). Due to a lack of effective control methods and the absence of biocontrol, E. amygdali is one of the most serious issues facing almond cultivation in France.
Native to the Middle East [5], E. amygdali appeared in France in the 1980s [6] and can cause more than 80% of crop losses [7]. This univoltine species has a well-described biology [5, 8, 9, 10], with adults emerging and laying eggs in early spring (April) on developed fruits. The larva feeds on the kernel until the end of July and stays in the larval stage until January inside the shell with two diapause phases [11]. The pupation begins in February until March and the insect adult perforates the shell to emerge. Wasps have a diurnal rhythm and are active between 10 a.m. and 7 p.m. with the highest activity around 3 p.m. when temperature and light are most important [12].
Research has tested different ways of developing biocontrol solutions in almonds (clay, essential oils, nets) in order to convert conventional agriculture. So far, there are no approved effective biocontrol methods. Attract-and-kill devices based on the dispersal of volatile organic compounds (VOCs) from plants may be a promising solution, as they have been successfully used to monitor and control other insect pests [13, 14, 15]. Indeed, Kouloussis and Katsoyannos [16] observed that flower and fruit emissions stimulate oviposition and aggregation in E. amygdali females. By investigating the volatile emissions during the flowering phase, we aim to uncover any chemical cues that may be involved in attracting the wasps, even though they are not present at that time. However, the identity of the compounds responsible for this attraction remains unknown. In the literature, only a few studies have reported VOC emissions from almond trees, and not all of them present quantitative values in terms of emission rates [17, 18, 19]. Furthermore, the results of these studies may differ for many reasons, such as the use of different analytical and headspace techniques, the control and measurement of environmental factors, the stage and size of the measured organ, or the almond variety. Generally, almond tree and other Prunus species have been described as low VOC emitters releasing mainly terpenes (mono- and sesquiterpenes) along with some oxygenated low-molecular weight VOCs such as (Z)-hex-3-en-1-ol, methyl salicylate, nonanal or (Z)-hex-3-enyl acetate [17, 18, 19, 20, 21, 22].
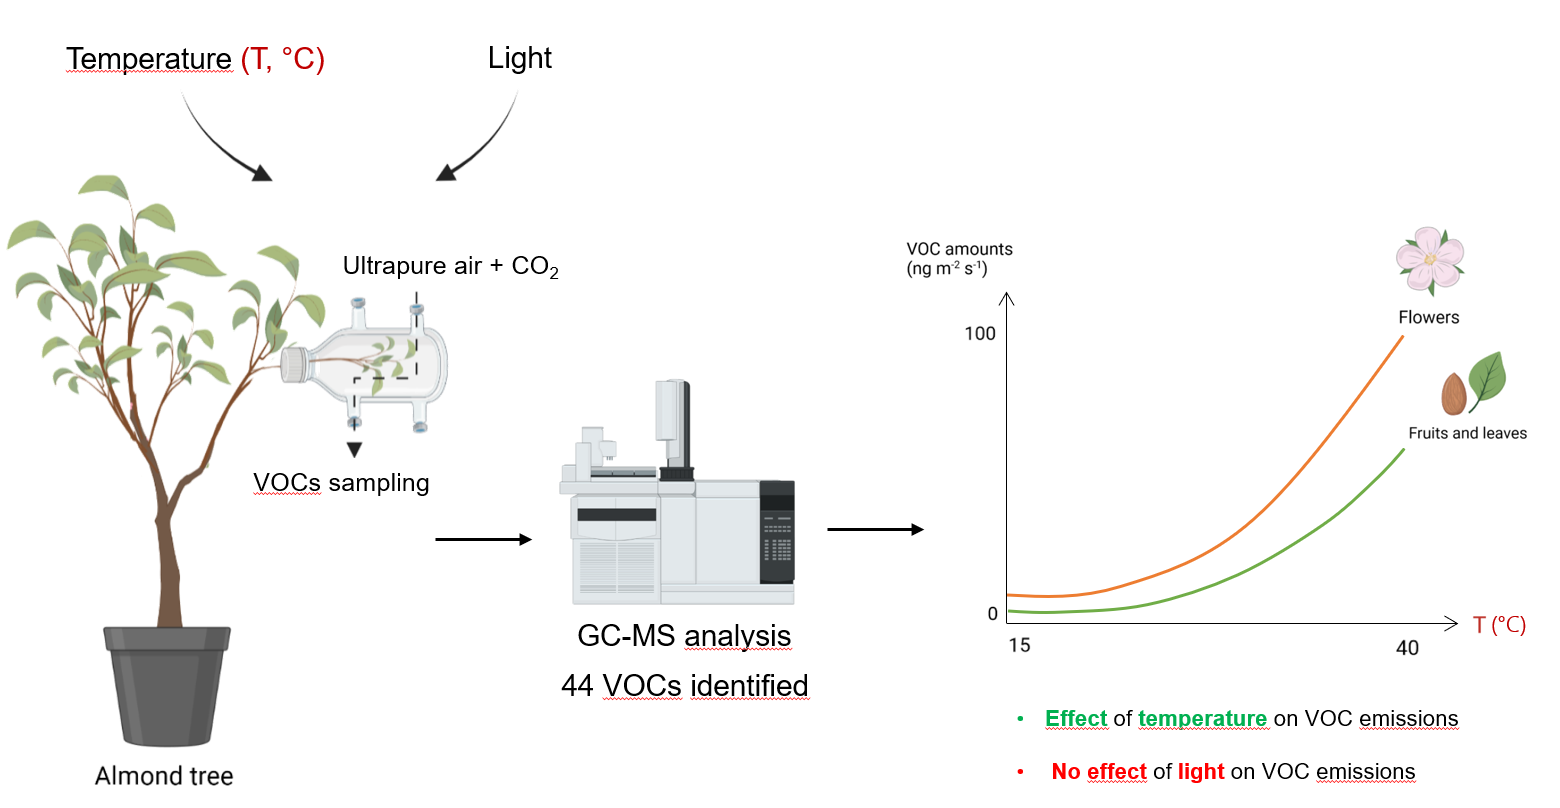
The objective of the present study was to characterize the composition and quantities of VOCs emitted by fruits, leaves and flowers of four varieties of almond trees during spring. We studied short-term and long-term emission variations in the laboratory under controlled conditions. The short-term study examined the temperature and light dependence of emissions to determine which VOCs are emitted during the diurnal activity of the wasp. The long-term emission variations were monitored at different stages of fruit and leaf development, to spot the key VOCs emitted during the first emergence of the wasps in the spring. These findings will enable further investigation into the detection of these VOCs by E. amygdali and the impact on their behavior. The goal is to identify an attractive mixture that can be utilized in trapping devices for effective pest control strategies.
2. Materials and methods
2.1. Plant material
Four varieties of almond trees (Prunus dulcis) were used in our study (Table 1) from February to June 2021. By including varieties with different precocity, we were able to extend the duration of plant material availability. The trees were grown in individual plastic pots of 45 L (40 cm diameter, 37 cm height) and were stored outside on the platform “Terrain Experimental” of the research center in Functional and Evolutionary Ecology in Montpellier, France (43°38′19.8′′ N 3°51′43.4′′ E). On frost days, the pots were placed in a greenhouse at 20 °C. Trees were irrigated daily from June to August and weekly during the rest of the year. To ensure almond development, we manually pollinated flowers. For the self-fertile varieties, the pollen was not supplemented, and we used a brush to transfer pollen between flowers on the same tree. In the case of self-incompatible varieties, we used pollen from another hybrid variety provided by INRAE.
Varieties of Prunus dulcis used for VOC sampling under environmental controlled conditions
| Origin | Planting year | Code | Variety name | Rootstock | Self-fertile | Earliness (1–9)3 |
|---|---|---|---|---|---|---|
| INRAE1 | 2014 | R1004 | Hybrid R1004 | GF677 | Yes | 4 |
| INRAE1 | 1998 | R1568 | Hybrid R1568 | GF305 | No | 4 |
| PHP2 | 2018 | R916 | Lauranne | GF677 | Yes | 5 |
| INRAE1 | 2020 | R1569 | Hybrid R1569 | GF677 | No | 7 |
1 INRAE Avignon, France. 2 Pépinière Haute-Provence, France. 3 Earliness of the variety, ranked from earliest (1) to the latest variety (9).
The phenological stages in our study were defined based on the development of almond tree organs, following the classification system established by Socias i Company et al. [23]. Our stages 1 to 5 correspond to their G to H stages. Stages 1 to 3 represent young almonds characterized by their smaller size, while stages 4 to 5 represent almonds that have reached their final size. The size varies among different varieties and the classification was adapted for each variety.
To ensure an adequate number of replicates for statistical analysis, we grouped these developmental stages of fruits and leaves into two categories. The first category, referred to as “young fruits,” includes stages 1 to 3. The second category, referred to as “mature fruits,” includes stages 4 and 5 (Supplementary Figure S1). By grouping the stages in this way, we aimed to ensure a sufficient sample size for robust statistical analysis.
2.2. VOC emissions measurement device
The terminal part of an intact twig with a length of about 15 cm was placed in a 125 mL FP double-walled glass thermostatic flask (75 mm outer diameter; Legallais, Montferriez-sur-Lez, France) with a GL 14 cap and an inner tube (75 mm outer diameter), (Figure 1). Depending on the phenological stage (flowering, young fruits and mature fruits), the twigs were composed of flowers alone or flowers with young leaves during the flowering period. During the growth period, the twigs were composed of fruits, fruits and leaves, or leaves alone. During our experiments, we employed two trees of each variety for all the samples in random order. While the trees were reused throughout the study, the branch utilized in each sample was never reused.
Chamber system used to collect almond tree VOCs. It is composed of an intact branch, circulation of ultrapure air and CO2 (black arrow), and water in the double wall (dotted blue arrow). The temperature sensor (thermocouple; TH) in the chamber is connected to the water bath. MFC: Mass Flow Controller. The diagram was made with https://www.Biorender.com.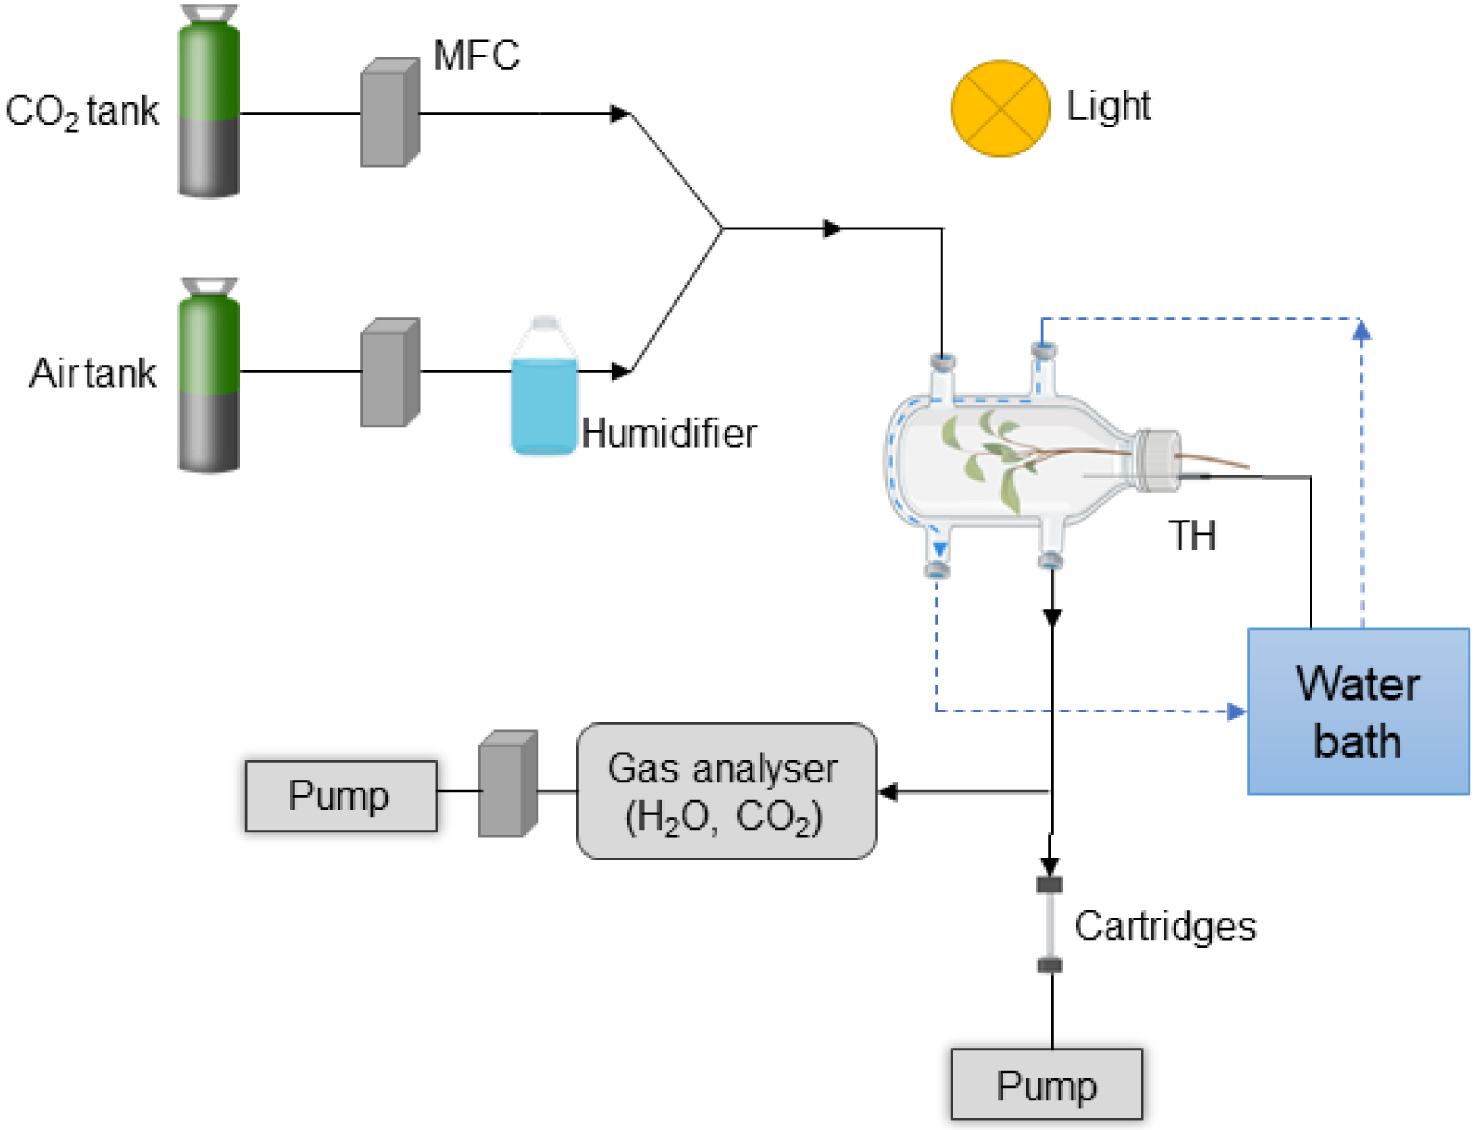
The airflow circulating in the system came from a bottle of Alphagaz 2 ultrapure air (Air Liquide, Paris, France) and was regulated by a mass flow controller (Vögtlin red-y GSC-B4KA-BB26, Muttenz, Switzerland). The air was humidified via a bypass holding a washing bottle (GL 45 central). The CO2 mixing ratio of the air chamber was adjusted to 400 ± 100 ppm by injecting pure CO2 via high-precision mass flow controllers (El-Flow Select, Bronkhorst France S.A.S., Montigny-lès-Cormeilles, France). The flow rate within the chamber was set to 300 mL⋅min−1. A gas analyzer (LI-COR 840; Lincoln, NE, USA) was used to measure the outflows of CO2 and H2O.
A lamp (LX60 Heliospectra AB, Göteburg, Sweden) was used to control the light. The air temperature inside the chamber was measured by a thermocouple (Chrom-Constantan, OMEGA, Biel, Switzerland) connected to the temperature controller of the water bath to adjust the temperature.
VOCs were sampled through adsorbent cartridges filled with Carbotrap (40 mg, 20–40 mesh) and Tenax TA (80 mg, 20–35 mesh) at a flow rate of 100 mL⋅min−1 for 30 min using a pump (Gillian GilAir Plus, Sensidyne LP, USA). Prior to sampling, the cartridges were conditioned for 30 min at 250 °C with an N2 flow from 20 to 50 mL⋅min−1.
2.3. VOC analyses
2.3.1. Gas chromatography-mass spectrometry (GC-MS)
We used a gas chromatograph (GC, Trace™ 1310, Thermo Scientific™ Milan, Italy) coupled to a mass spectrometer (ISQ™ QD Single Quadrupole, Thermo Scientific™ Milan, Italy) with an Optima 5-MS capillary column (30 m length, 0.25 mm Internal Diameter, 0.25 μm film thickness; Macherey-Nagel, Düren, Germany). The VOCs trapped on the cartridges were desorbed with a double-stage desorption system, composed of a Thermal Desorption Unit (TDU) and a Cold Injection System (CIS) (multi-purpose sampler, Gerstell, Mülheim, Germany). First, the cartridges were desorbed at a temperature of 250 °C in splitless mode on the CIS trap cooled at −80 °C by liquid nitrogen. Then, the CIS trap was heated to 250 °C with a 1:4 split ratio to inject the compounds in the column. Helium was used as carrier gas at a rate of 1 mL⋅min−1. The oven temperature was held at 40 °C for 3 min, increased from 40 °C to 220 °C at a rate of 5 °C⋅min−1 and from 220 to 250 °C at 10 °C⋅min−1, and finally held for 2 min. The temperature of the transfer line and the ion source of the mass spectrometer were 250 °C and 200 °C respectively. We acquired masses from 38 m/z to 350 m/z and the ionization energy was set to 70 eV.
2.3.2. GC-MS data processing
MZMine 2.53 software [24] was used to detect VOCs and obtain the area under the curve (AUC) from chromatograms. The parameters chosen to process chromatograms are listed in Supplementary Table S1. XCalibur™ software (Thermo Scientific™ Milan, Italy) was used to identify VOCs with NIST (2011) and Wiley (9th edition) databases. Retention indices (RI) were calculated from the retention times (RT) of a series of n-alkanes (alkane standard solution, 04070, Sigma Aldrich®) and compared with the literature (Adams, 2007).
AUCs were calibrated by means of standard solutions of benzaldehyde, DMNT, (Z)-hex-3-enyl acetate, limonene, methyl salicylate, and β-caryophyllene dissolved in methanol at three concentrations: 1, 10, and 100 ng⋅μL−1. One μL of each solution was injected into the cartridges (N = 3), then placed for 5 min under an N2 flow (Alphagaz 1, Air Liquide) and analyzed by GC-MS.
Each organ (stem, leaves, flowers, fruits) was scanned to calculate the emissions to obtain a total area projected with ImageJ software [25]. Concentrations were calculated from the AUC of each VOC, the calibration factor and the volume sampled.
The calculation of emissions corresponds to:
2.3.3. Protocol of testing temperature and light effects on emissions
In order to assess how emissions varied during day and night, the emission responses to temperature and light were investigated using the following protocol: six temperature levels were tested on the same branch, ranging from 15 to 40 °C in steps of 5 °C at a light intensity of 750 ± 50 μmol⋅m−2⋅s−1 photosynthetic photon flux density (PPFD). For each step, the plant was left to adapt for 30 min and then VOC emissions were collected for 30 min. The steps were performed in ascending or descending order. The effect of temperature on emissions was tested on three stages: flowering (N = 10), young fruits (N = 5), and mature fruits (N = 11) for three varieties: R1568, R1569, and R1004. The Lauranne variety could not be used in the temperature experiments due to technical constraints (tree disease requiring treatment).
The effect of light was studied at a temperature of 30 ± 0.2 °C by increasing or decreasing the incident light level on the same branch, by 0, 75, 250, 500, 1000, and 2000 μmol⋅m−2⋅s−1 PPFD only on mature fruit and leaves at stages 4 (N = 8) and 5 (N = 5). The varieties tested were Lauranne, R1568, R1569, and R1004.
2.3.4. Statistical analyses
Data processing was done with RStudio [26] with R 4.2.1 version. Mean comparisons between flowering and fruit growth stages were made with permutation Student’s test or Fligner–Policello test for non-homogeneous variances. Two Redundant Discriminant Analysis (RDA, R package “RVAideMemoire”) were performed to study the effects of temperature and light on VOC emissions. In each RDA, variety, branch composition (flowers, fruits, leaves), phenological stage, and their interactions were tested. The effect of variables was tested by a pairwise factor fit with 999 permutations and a correction of p-values by a false discovery rate method. Before RDA analyses, raw data was transformed by adding a constant to 0.0001 to remove zeroes and a quadratic-root transformation [27].
3. Results
3.1. Volatile emissions of almond tree in spring
Under standard temperature and light conditions, 40 compounds were identified in almond tree emissions collected between February and May (Table 2). The trees’ phenological stages were divided into two categories: “flowering” and “fruit and leaf growth”. Sesquiterpenes (SQTs) accounted for half of the VOCs emitted during both the flowering and growth stages. The average emissions from Prunus dulcis were low, with a mean value of 36.3 ± 9 ng⋅m−2⋅s−1 (N = 19) during the development stages, but higher during the flowering amounting to 167.1 ± 64 ng⋅m−2⋅s−1 (N = 11). Among the VOCs detected, nine compounds, including five SQTs and one monoterpene (MNT), could not be identified. Three compounds were exclusively detected during flowering, namely 1,4-dimethoxybenzene, unknown compound and unknown MNT, while 10 compounds were identified during the development stages.
Mean emission rates ± standard errors of almond trees measured under standard conditions (30 °C at 750 μmol⋅m−2⋅s−1 PPFD) for 30 min, across four varieties, without distinguishing between fruit and leaf growth stages
| Classe | VOC | Retention time (min) | Retention index | Database | Emissions (ng⋅m−2⋅s−1)d | ||
|---|---|---|---|---|---|---|---|
| Calculated | Database | Flowering | Fruit/leaf growth stages | ||||
| GLV | (E)-hex-3-en-1-ol | 9.05 | 858 | 800 | Adams | 0 | 0.03 ± 0.02 |
| MNT | α-Pinene | 11.73 | 938 | 932 | Adams | 0.12 ± 0.04 | 0.02 ± 0.01 |
| Phenolic | Benzaldehyde | 12.1 | 939 | 935 | NIST | 48.3 ± 34.5 | 2.76 ± 2.48 |
| GLV | (E)-hex-3-en-yl Acetate | 13.92 | 1003 | 1004 | Adams | 0 | 0.2 ± 0.11 |
| Phenolic | p-methyl Anisole | 14.03 | 1007 | 1015 | Adams | 0 | 0.03 ± 0.02 |
| Unknown | Unknown compound | 15.31 | 1038 | 0.08 ± 0.06 | 0 | ||
| MNT | (E)-β-Ocimene | 15.35 | 1048 | 1044 | Adams | 0.38 ± 0.12 | 2.28 ± 0.64 |
| MNT | Unknown MNT | 16.01 | 1060 | 0.009 ± 0.008 | 0 | ||
| MNT | Linalool | 16.93 | 1097 | 1095 | Adams | 0 | 0.03 ± 0.01 |
| Aldehyde | Nonanal | 17.06 | 1096 | 1100 | Adams | 1.2 ± 0.45 | 2.91 ± 0.96 |
| HT | DMNTa | 17.69 | 1114 | 1115 | PACE | 0.95 ± 0.28 | 2.26 ± 0.49 |
| Unknown | Unknown compound 1 | 18.08 | 1127 | 0 | 0.005 ± 0.005 | ||
| Phenolic | 1,4-dimethoxyBenzene | 19.1 | 1161 | 1161 | Adams | 67.4 ± 50.6 | 0 |
| Phenolic | Methyl Salicylate | 20.09 | 1194 | 1190 | Adams | 0 | 0.06 ± 0.03 |
| GLV | (Z)-hex-3-en-yl Valerate | 22.13 | 1228 | 1243 | NIST | 0 | 0.003 ± 0.003 |
| SQT | Unknown SQT 1 | 24.18 | 1345 | 0.13 ± 0.07 | 0.04 ± 0.01 | ||
| SQT | α-Cubebene | 24.58 | 1356 | 1345 | Adams | 0.1 ± 0.04 | 0.04 ± 0.02 |
| SQT | Unknown SQT 2 | 24.71 | 1361 | 0.05 ± 0.02 | 0.04 ± 0.02 | ||
| SQT | α-Copaene | 25.32 | 1383 | 1374 | Adams | 0.5 ± 0.21 | 0.67 ± 0.21 |
| SQT | β-Bourbonene | 25.58 | 1393 | 1387 | Adams | 1.29 ± 0.6 | 4.42 ± 1.42 |
| SQT | α-Bourbonene | 25.64 | 1351 | 1384 | NIST | 0 | 0.35 ± 0.30 |
| SQT | α-Gurjunene | 26.24 | 1419 | 1409 | Adams | 0.09 ± 0.04 | 0.04 ± 0.02 |
| SQT | (E)-β-Caryophyllene | 26.5 | 1429 | 1417 | Adams | 1.68 ± 0.53 | 1.4 ± 0.33 |
| SQT | β-Copaene | 26.73 | 1438 | 1430 | Adams | 0.63 ± 0.29 | 0.74 ± 0.23 |
| SQT | Unknown SQT 3 | 26.84 | 1446 | 0.32 ± 0.14 | 0.17 ± 0.09 | ||
| MNT | (E)-geranyl Acetone | 27.18 | 1456 | 1453 | Adams | 0.65 ± 0.5 | 0.63 ± 0.4 |
| SQT | (Z)-Muurola-3,5-diene | 27.2 | 1393 | 1448 | Adams | 0 | 0.04 ± 0.01 |
| SQT | (E)-α-Bergamoteneb | 27.23 | 1458 | 1430 | Adams | 0.71 ± 0.35 | 0.04 ± 0.04 |
| SQT | α-Humulene | 27.37 | 1464 | 1452 | Adams | 1.18 ± 0.36 | 0.84 ± 0.23 |
| SQT | Allo-Aromadendrene | 27.57 | 1472 | 1458 | Adams | 0.98 ± 0.38 | 0.6 ± 0.2 |
| SQT | Unknown SQT 4 | 27.64 | 1475 | 0.007 ± 0.006 | 0.04 ± 0.02 | ||
| SQT | (E)-muurola-4(14),5-dieneb | 27.71 | 1476 | 1465 | Adams | 0.09 ± 0.04 | 0.03 ± 0.02 |
| SQT | Unknown SQT 4B | 27.84 | 1483 | 0.1 ± 0.09 | 0.09 ± 0.05 | ||
| SQT | Germacrene D | 28.04 | 1490 | 1484 | Adams | 36.2 ± 12.6 | 12.54 ± 5.41 |
| SQT | BicycloGermacrene/(E,E)-α-Farnesenec | 28.45 | 1507 | 1500 | Adams | 2.89 ± 0.98 | 2.43 ± 0.76 |
| SQT | 𝛿-Cadinene | 28.79 | 1526 | 1513 | Adams | 0.36 ± 0.17 | 0.13 ± 0.05 |
| SQT | 𝛾-Cadinene | 29 | 1536 | 1522 | Adams | 0.53 ± 0.21 | 0.23 ± 0.08 |
| SQT | α-Cadinene | 29.38 | 1553 | 1537 | Adams | 0.19 ± 0.1 | 0.06 ± 0.03 |
| Phenolic | (E)-hex-3-en-yl Benzoate | 29.95 | 1578 | 1565 | Adams | 0 | 0.08 ± 0.03 |
| Unknown | Unknown compound 2 | 30.15 | 1586 | 0 | 0.009 ± 0.007 | ||
a (E)-4,8-dimethyl-1,3,7-nonatriene. b Tentative identification of Z or E isomers. c Tentative identification. d Mean ± SE. e MNT: monoterpene, SQT: sesquiterpene, HT: homoterpene, Phenolic: phenolic compounds, GLV: green leaf volatile.
These results suggest that the emissions of different classes of VOCs vary depending on the phenological stage of almond trees. Phenolic compounds, such as benzaldehyde and 1,4-dimethoxybenzene, two major compounds, were found to be more emitted during the flowering stage (P = 0.006, Table 1). For mean comparisons, DMNT and nonanal were grouped by their biosynthetic pathway (fatty acid), into a class called other VOC (OVOC). On the other hand, OVOC, MNTs, and green leaf volatiles (GLVs) were more emitted during the development of fruits and leaves (Figure 2). However, the difference between these classes was only significant for OVOC (P = 0.03). There was no significant difference in emissions between flowering and growth stages for SQTs and unknown compounds (P > 0.1).
VOC class comparisons between flowering (N = 11) and fruit and leaf development (N = 31). Emissions (in ng⋅m−2⋅s−1) were measured in standard controlled conditions at 30 °C and 750 μmol⋅m−2⋅s−1 PPFD. Fruit and leaf development was grouped without differences in stages. Data are presented as mean ± standard errors. SQT: sesquiterpenes, OVOC: other VOC, MNT: monoterpenes and GLV: green leaf volatilales.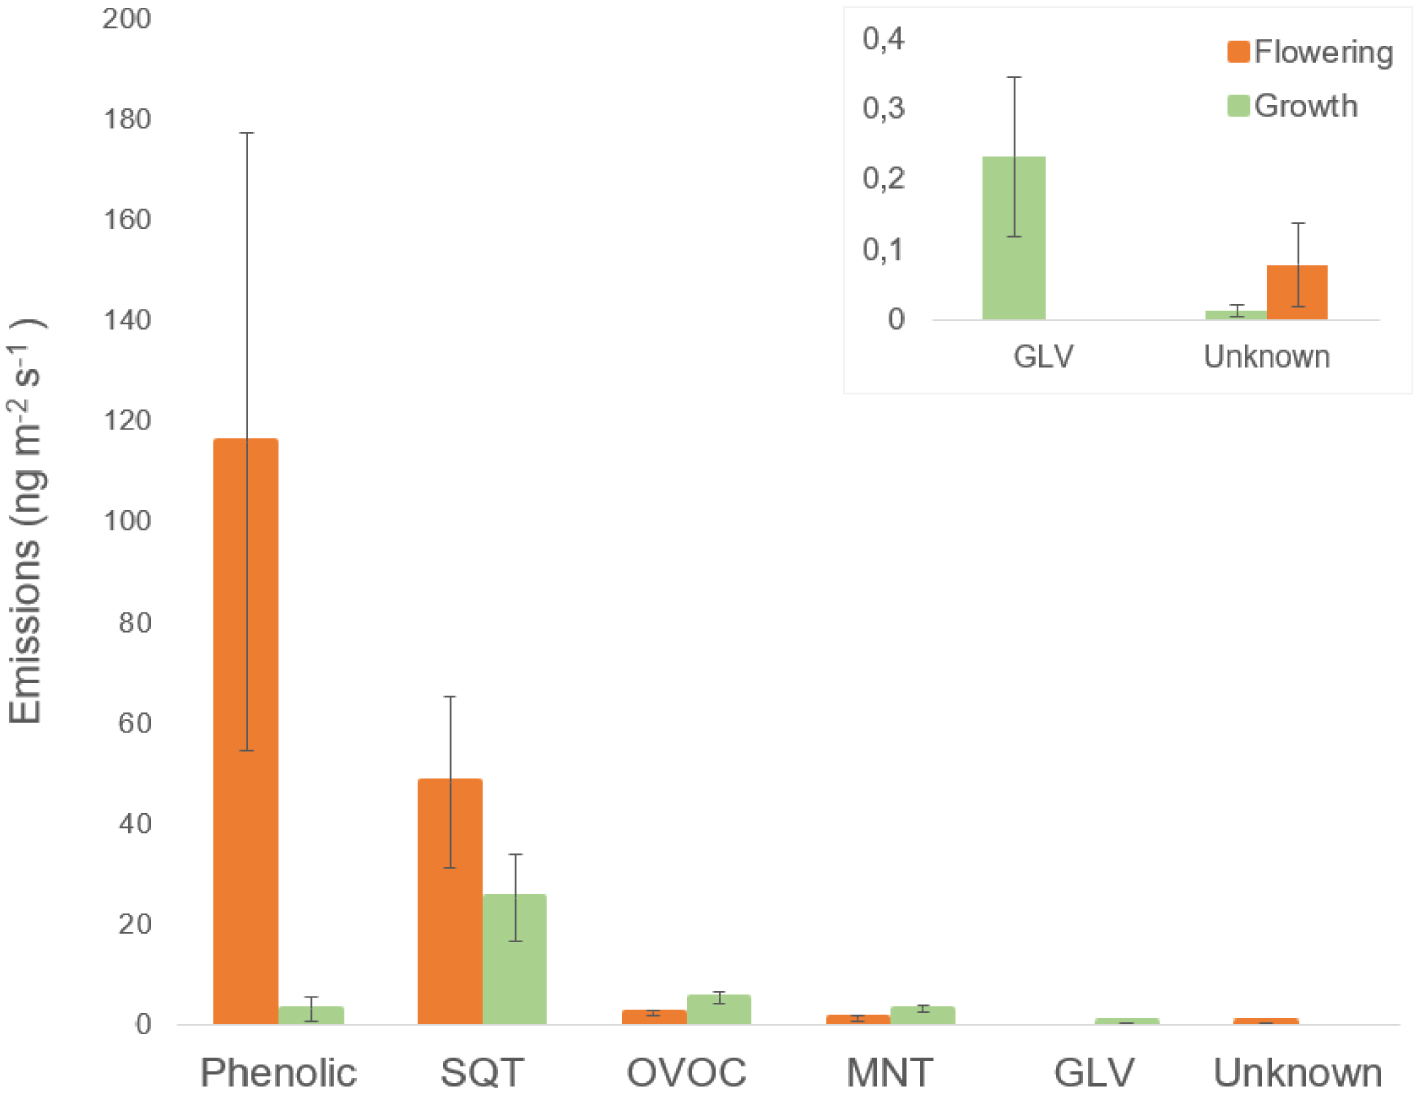
SQTs were identified as the second most prevalent class of compounds emitted during flowering, comprising 53.4 ± 17.2 ng⋅m−2⋅s−1 out of total emission of 180.8 ± 63.1 ng⋅m−2⋅s−1, or approximately 30% of total emissions (Figure 2). During fruit and leaf growth, SQTs were the primary class of emitted VOCs, accounting for 25 ± 8.6 ng⋅m−2⋅s−1 out of total emission of 36.3 ± 9 ng⋅m−2⋅s−1, or approximately 70%. Germacrene D was found to be the most abundant SQT emitted by almond trees across all phenological stages. The bicycloGermacrene/(E,E)-α-farnesene was another major compound found at both flowering and growth stages. Additionally, (E)-β-caryophyllene was identified as the second most abundant compound during fruit and leaf growth (Figure 3). During the flowering stage, two unidentified compounds along with α-gurjunene were detected as minor SQT. As for the developmental stages, (E)-muurola-4(14),5-diene, α-gurjunene, and one unidentified compound were identified as minor VOCs.
Average SQT emissions from almond twigs at the flowering stage (N = 11) and the fruit and leaf growth stage (N = 31) under standard controlled conditions. (A) Major SQT and (B) minor SQT. Data are presented as mean + standard errors. The compounds are ranked in ascending order of retention time. Bicyclogermacrene (TI) is bicyclogermacrene or (E,E)-α-farnesene.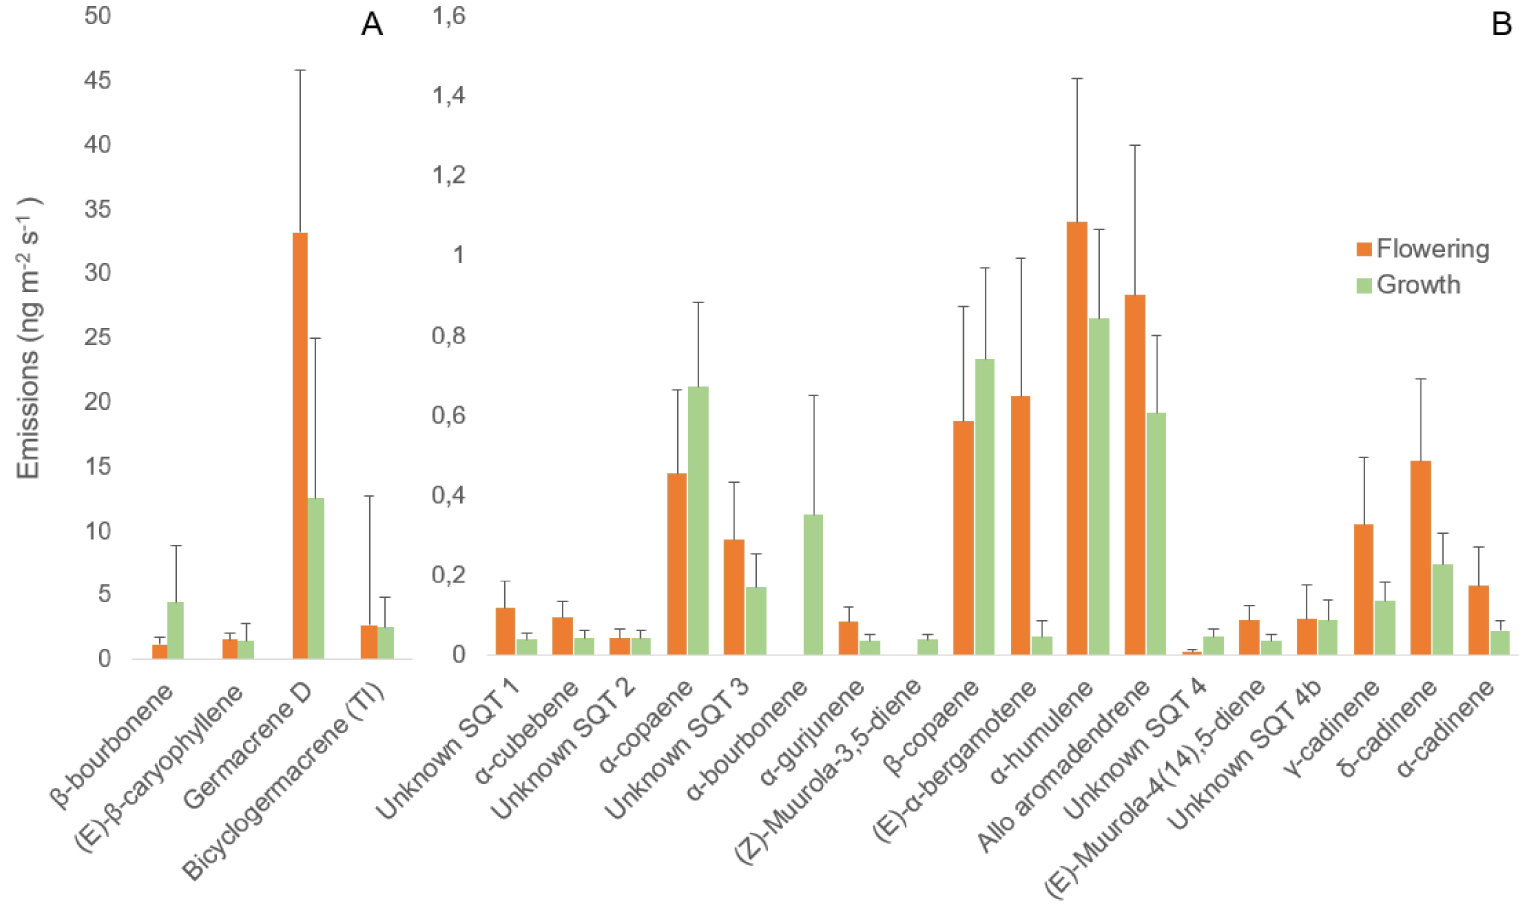
3.2. Impact of temperature and light on VOC emissions
We analyzed the effects of light and temperature on VOC emissions. In the course of this experiment, we identified four new compounds in addition to the 40 compounds identified under standard conditions (Table 2). Three compounds were identified during the first sampling of temperature or light gradients in mature fruit and leaf. Among these three VOCs, (Z)-hex-3-en-1-ol was the most abundant VOC emitted, with an average of 3.54 ± 1.34 ng⋅m−2⋅s−1. (Z)-hex-3-en-yl butanoate and (Z)-hex-3-en-yl-2-methyl-butanoate were also detected, with emissions of 0.71 ± 0.19 and 0.29 ± 0.12 ng⋅m−2⋅s−1, respectively. Additionally, an unidentified SQT was emitted in trace amounts by R1568 flowers between 15 and 30 °C, and at 0.14 and 0.2 ng⋅m−2⋅s−1 at 35 and 40 °C (Supplementary Figure S2).
3.2.1. RDA analysis for the temperature model
The RDA model accounted for 57% of the constrained variance, with the first two components of the RDA analysis explaining 81% of this variance. As a result, these two components were deemed sufficient to explain the model. Figure 4 displays a score plot of RDA analysis for differentiating between temperatures. The results of the effect of vegetative and reproductive parts of the twig and the variety are shown in Supplementary Figure S3.
Score plot and correlation plot of the first two constrained components from RDA analysis for the temperature effect on VOC emissions. The factor shown is the temperature in correlation with VOCs. The constrained variance was explained at 62% by component 1 and at 19% by component 2. The composition of the measured twigs, the varieties and the phenological stages are in Supplemental S3.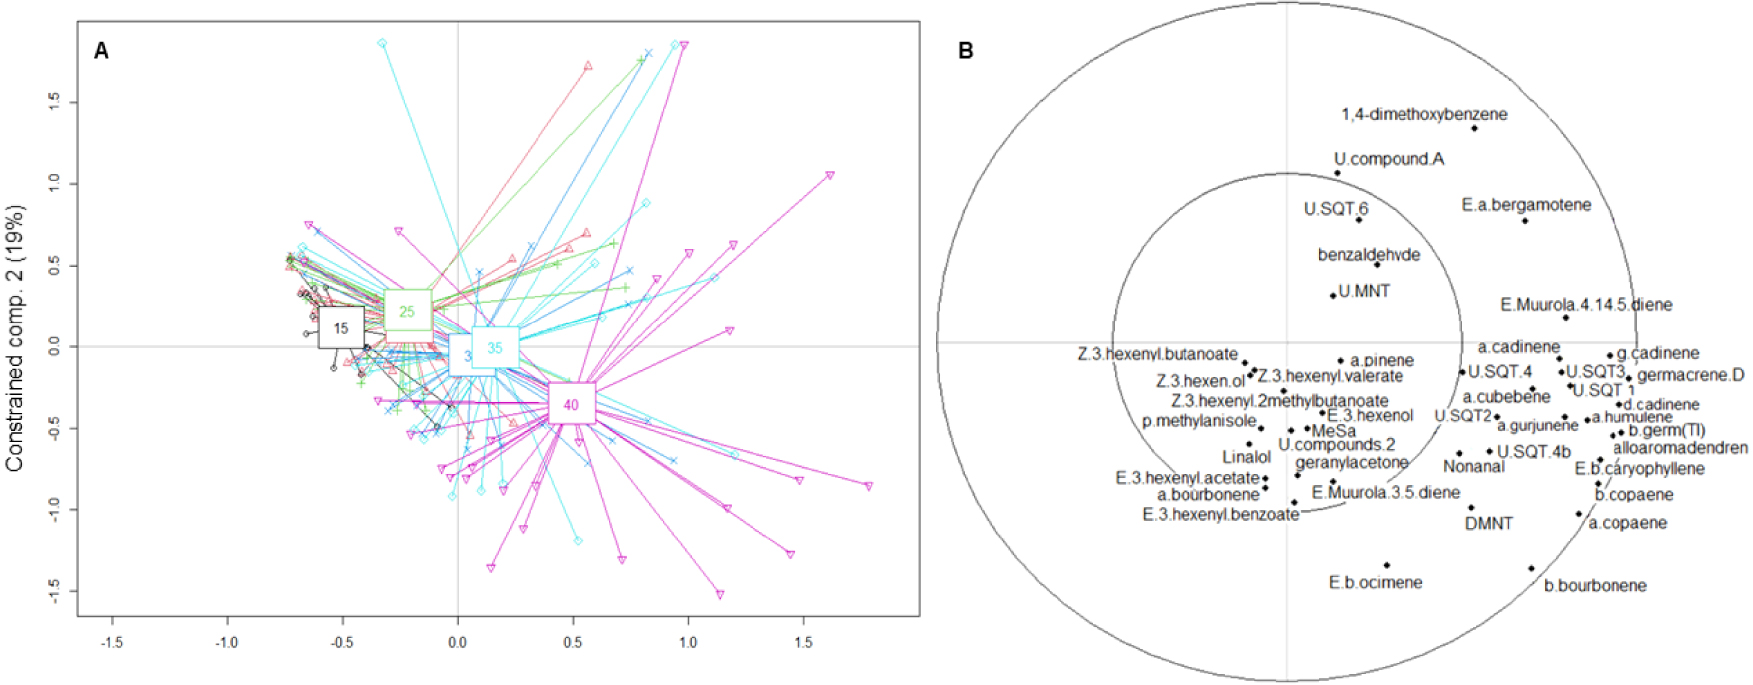
The first RDA analysis demonstrated that temperature had a significant effect on VOC emissions, with a cluster at 15 °C; 20–25 °C; 30–35 °C and 40 °C. The analysis revealed a significant effect of temperature on the quantities of VOC emitted, but this effect was observed only when there was a temperature difference of 10 °C or more between samples (Table 3, Supplementary Table S3). The analysis also identified two significant interactions, including a Temperature × Phenology interaction indicating that the temperature effect depended on the phenological stage (Table 3, Figure 5). VOC emissions increased with temperature for all classes during fruit and leaf development, except for phenolic compounds, which remained stable and were emitted only in low quantity between 0.13 ± 0.08 and 1.88 ± 1.42 ng⋅m−2⋅s−1 (Figure 4, Supplementary Figure S4). Notably, GLVs were absent during the flowering stage and were present in greater quantity at 15 °C or 40 °C during the first sampling. Moreover, with the exception of GLVs, emissions were very low at 15 °C.
Effect of temperature on VOC emissions according to the phenological stage (triangle: flowering, circle: fruit and leaf growth). Emissions were summed by class for each sample and averaged by temperature level. Error bars are standard errors.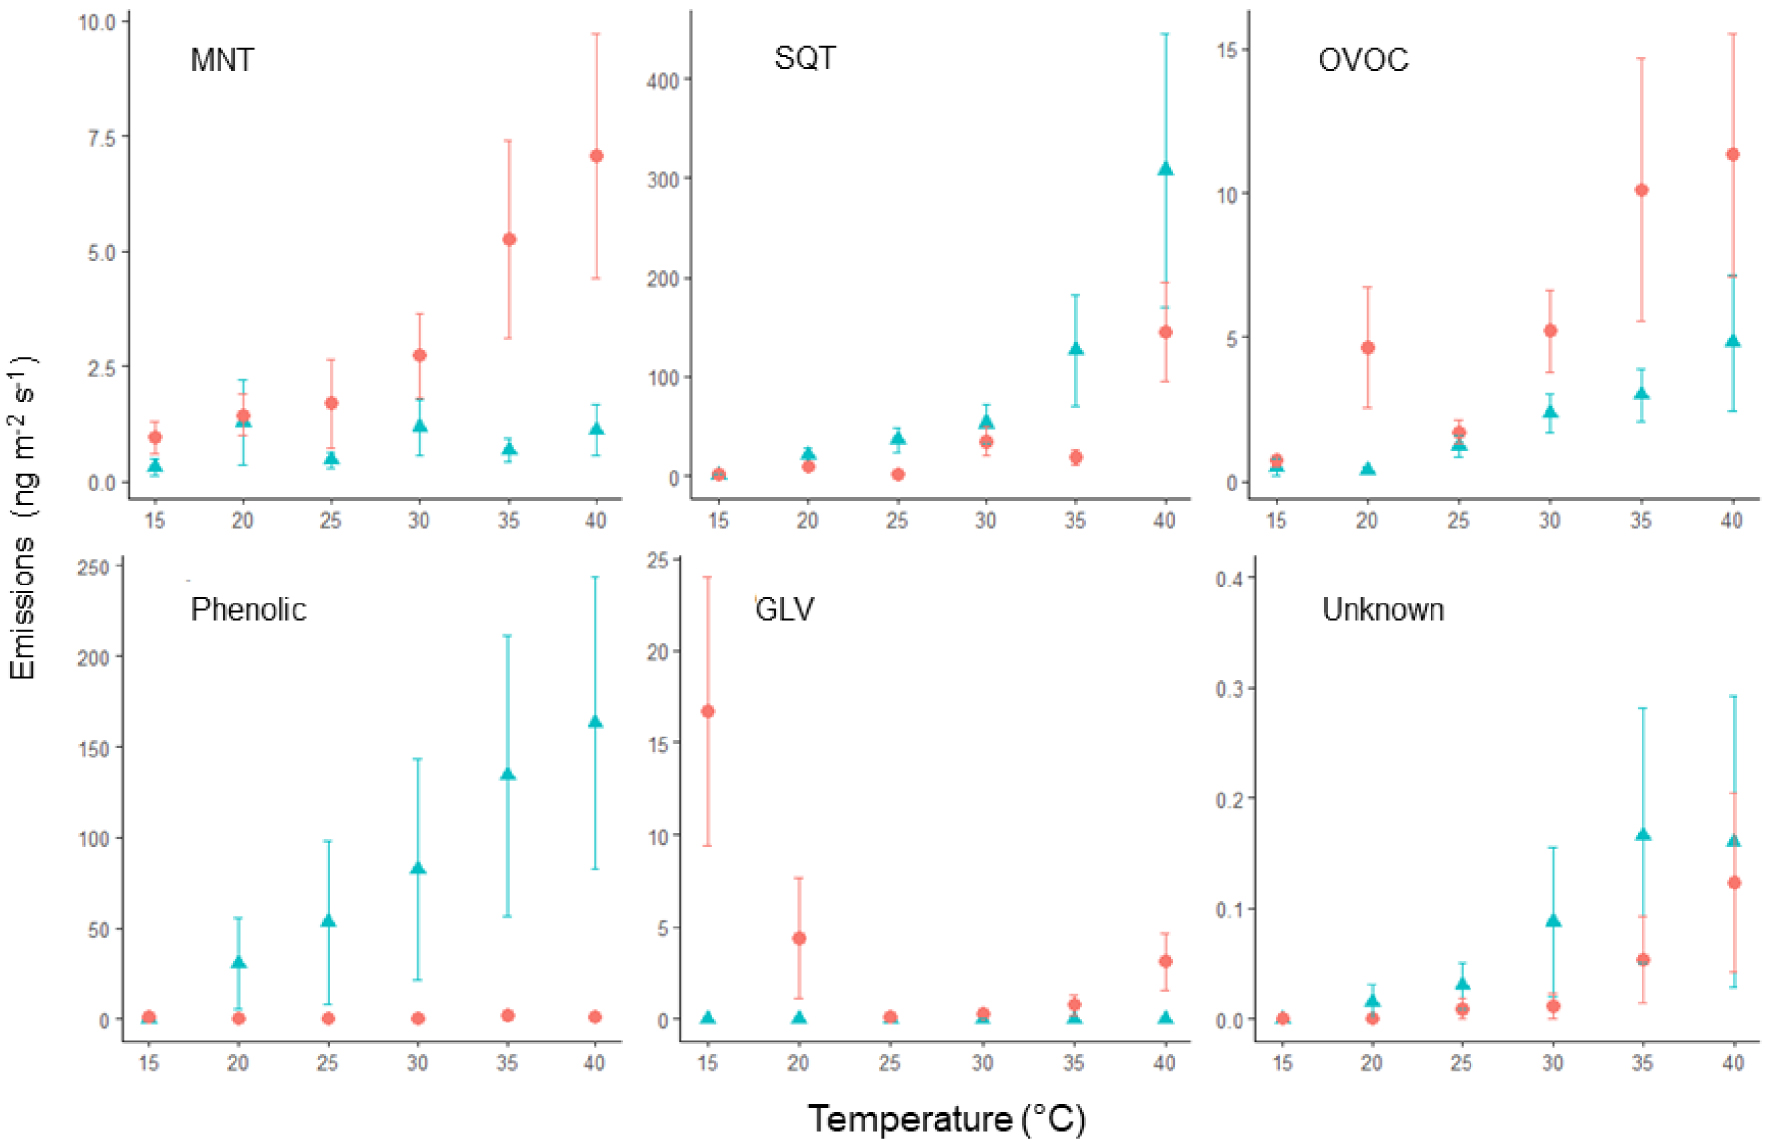
Summary of the significant permutation F-test results for the two RDA models on VOC emissions and interactions between factors
| Model | Variablea | p-value | Significance |
|---|---|---|---|
| Temperature effect | Temperature | 0.001 | ∗∗∗ |
| Phenology | 0.001 | ∗∗∗ | |
| Branch composition | 0.018 | ∗ | |
| Variety | 0.001 | ∗∗∗ | |
| Temperature: phenology | 0.011 | ∗ | |
| Phenology: variety | 0.007 | ∗∗ | |
| Light effect | Light | 0.095 | ⋅ |
| Phenology | 0.001 | ∗∗∗ | |
| Branch composition | 0.001 | ∗∗∗ | |
| Variety | 0.001 | ∗∗∗ | |
| Phenology: variety | 0.001 | ∗∗∗ |
a Phenology was categorized into “flowering”, “young” or “mature” fruits and leaves for the temperature model, and into stage 4 and stage 5 for the fruit and leaf growth in the light effect model. The composition of branches was “flowers”, “flowers + leaves”, “fruits”, “leaves” or “fruits + leaves”.
Regarding other factors, there was no difference in volatile emissions between twigs bearing only flowers and those with both flowers and young leaves. However, there was a significant difference in emissions between twigs with flowers and those with fruits and leaves (P = 0.01), regardless of the development stage. Furthermore, pairwise tests highlighted a difference between young and mature fruits and leaves (P = 0.01).
The model was conducted on three varieties with different precocity, with two trees per variety: R1568 (N = 12), R1569 (N = 7), and R1004 (N = 8). We found a significant difference between R1004 and R1568 (P = 0.003, Supplementary Figure S3 and Table S2). The analysis of individual VOC compounds did not reveal any significant differences among the varieties. However, when considering the overall emissions per class, variations were observed (Figure 6). The R1004 variety exhibited higher emissions of phenolics compounds and MNTs compared to R1568 and R1569, and similar emissions of SQTs compared to R1568. Both R1004 and R1568 varieties had significantly higher emissions compared to R1569. No significant differences were observed for OCOVs. The R1569 variety displayed the highest emissions GLVs among the three varieties. Additionally, the second significant interaction Phenology × Variety, indicated that the chemical profile was variable according to the varieties between flowering and the fruit and leaf growth.
VOC emissions summed by class and averaged by variety (ng⋅m−2⋅s−1). Three varieties were measured in the temperature experiments: R1004, R1568 and R1569. The emissions presented here are those at 30 °C but the pattern is similar for each temperature level. VOC emissions were averaged for fruit and leaf growth stages. SQT: sesquiterpenes, OVOC: other VOC, MNT: monoterpenes and GLV: green leaf volatilales.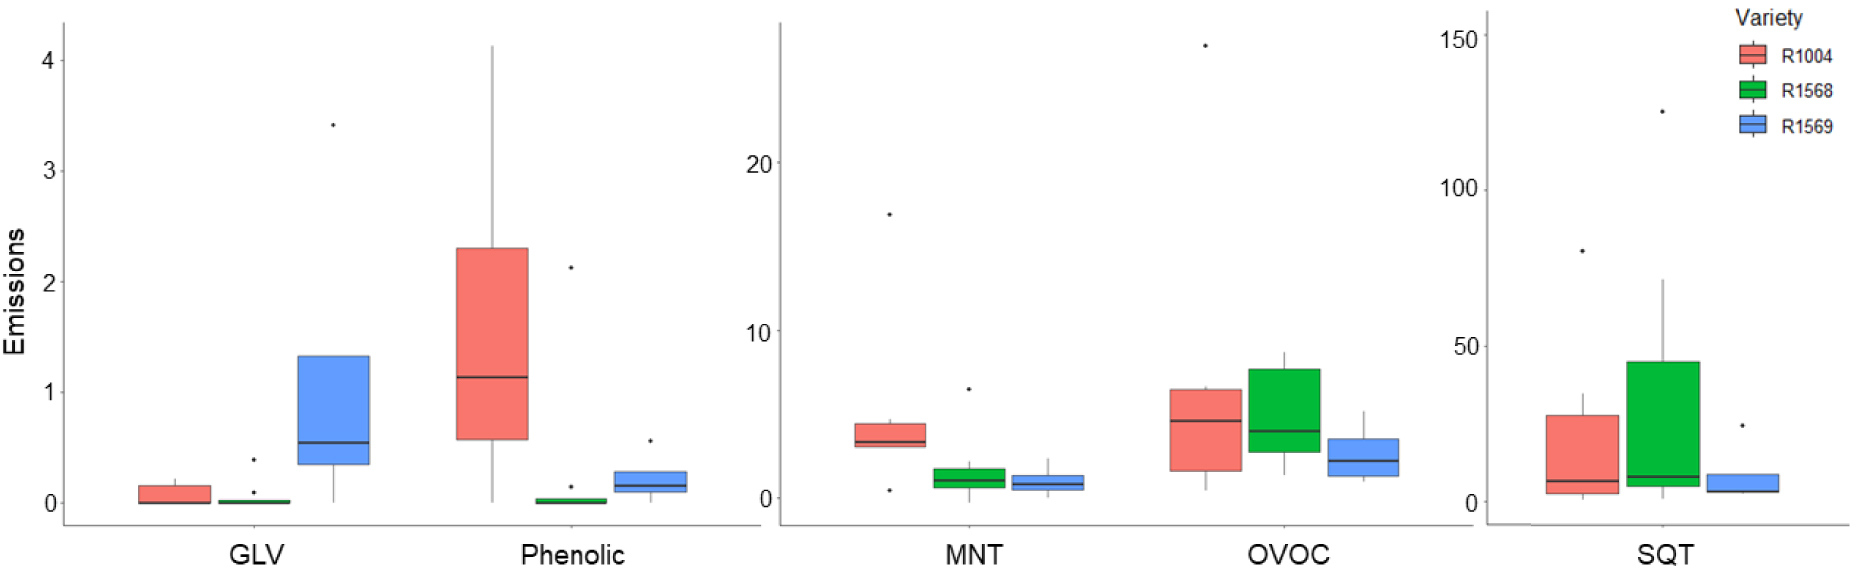
By examining both the score plots and the correlation plot, we found that floral emissions were positively correlated with SQTs, (E)-α-bergamotene, and 1,4-dimethoxyBenzene, while no other cluster was observed. On the other hand, fruit and leaves were positively correlated with SQTs, which were the variables that best explained the model. Regarding varieties, the odor profile of R1568 was primarily composed of SQTs and 1,4-dimethoxyBenzene, while no clear grouping was observed for R1004. GLVs were common to all three varieties. Overall, SQTs and 1,4-dimethoxyBenzene were the VOCs that best explained the model (Figure 4).
3.2.2. RDA analysis for the light model
The effect of light was evaluated in stage 4 (N = 8) and stage 5 (N = 5), where fruits with leaves or fruits and leaves separated were used. For the branch with only fruits, the leaves were not removed beforehand. The varieties tested were Lauranne (N = 2), R1568 (N = 2), R1569 (N = 4), and R1004 (N = 4). The proportion of constrained variance explained by the model was 62% with 78% of this variance explained by the first four dimensions. The light had no significant effect on VOC emissions, but there were significant effects of phenology, variety, and branch composition, as well as a significant interaction between phenology and variety (Table 3). This interaction indicated that the chemical profile varied among varieties at different stages of fruit and leaf growth. Each variety had a distinct odor profile, and emissions from fruits with leaves differed from those from separated fruits or leaves (Figure 7, Supplementary Table S3). While emissions varied with the phenological stage, there was no difference in profile odor between stages 4 and 5 (P = 0.14). SQTs and GLVs played a role in explaining the emission pattern and were correlated with emissions from R1569 and R1004 (Figures 7B and 8).
Score plots of the first two constrained components from RDA analysis for the light effect. The factors were the plant parts (A), and the varieties (B). The constrained variance was explained at 51% by component 1 and at 10% by component 2. The correlation plot of these components, and components 3 and 4 are in Supplementary Figure S5.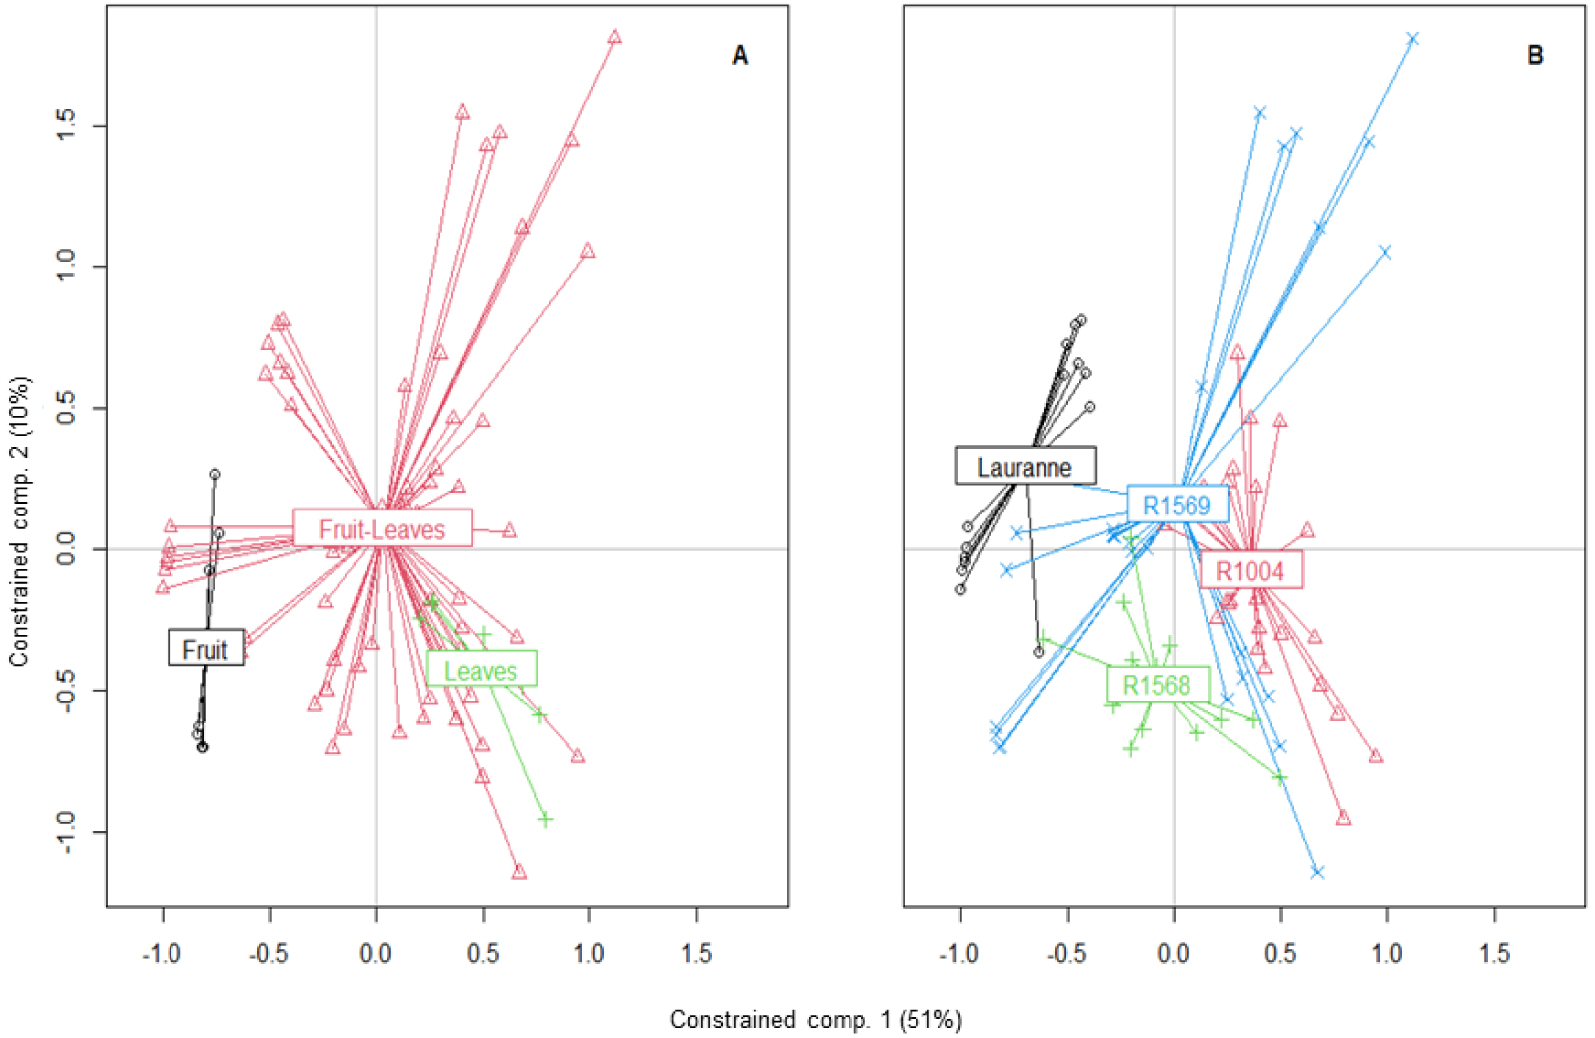
VOC emissions summed by class and averaged by variety (ng⋅m−2⋅s−1). Four varieties were measured in the temperature experiments: Lauranne, R1004, R1568 and R1569. The emissions presented here are those at 1000 μmol⋅m−2⋅s−1 PPFD but the pattern is similar for each light level. VOC emissions were averaged for fruit and leaf growth stages. SQT: sesquiterpenes, OVOC: other VOC, MNT: monoterpenes and GLV: green leaf volatilales.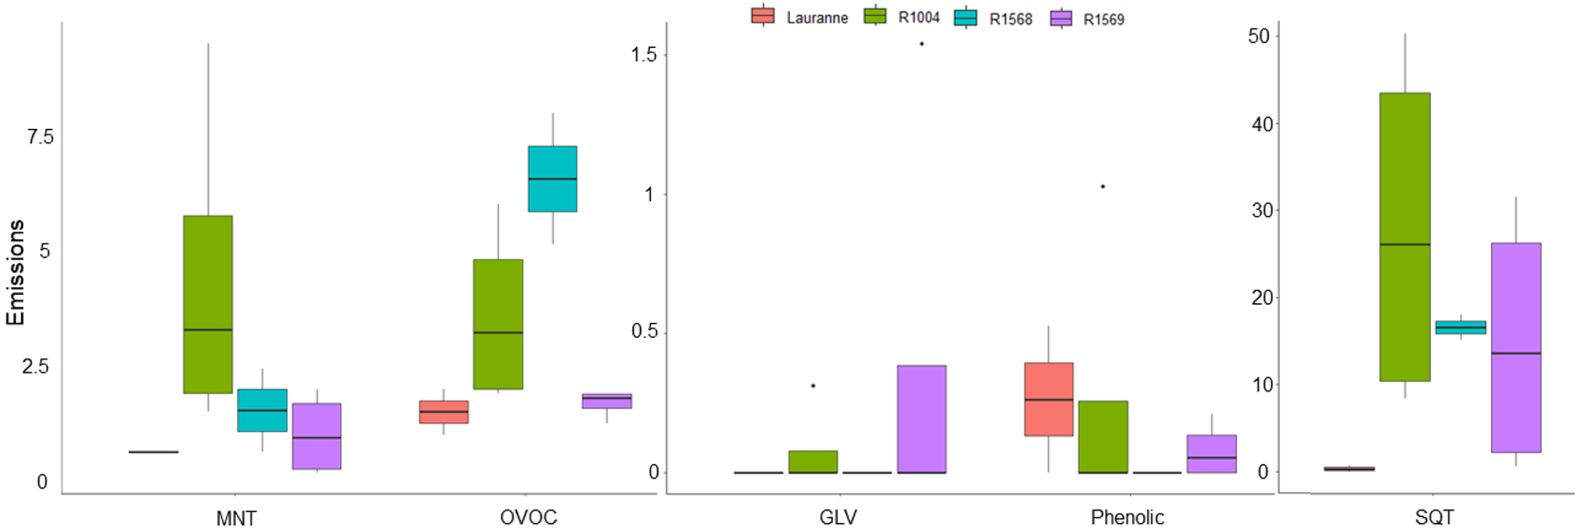
No significant effect of light was observed on VOC emissions. However, there was a significant effect of variety on these emissions (Figure 8). In the light experiments, R1004 and R1568 varieties were found to be the main emitters of MNTs, OVOCs and SQTs. On the other hand, the Lauranne variety exhibited lower emissions of VOCs overall, except for phenolic compounds.
4. Discussion
4.1. Overview of emissions from almond trees
To our knowledge, only a few studies have investigated VOC emissions from almond trees (Table 4). Because different analysis and headspace techniques, units, and almond varieties were used in each study, a direct comparison of the numerical values is not possible. Nevertheless, our and previous studies consistently show that P. dulcis is rather a significant emitter of SQTs than an emitter of MNTs [17, 18, 19].
Overview of major VOCs of Prunus dulcis reported in the previous and present study
| Compound | Value | Unitb | Objective | Experimental | Reference |
|---|---|---|---|---|---|
| Benzaldehyde | 2.8–48.3 | ng⋅m−2⋅s−1 | Spring emissions under environmentally controlled conditions | Dynamic headspace in a glass chamber Carbotrap/Tenax cartridges |
Our study |
| 1,4-dimethoxyBenzene | 0–67.4 | ||||
| Germacrene D | 12.5–36.2 | ||||
| bicycloGermacrene/(E,E)-α-Farnesene | 2.4–2.9 | ||||
| (Z)-hex-3-en-yl Acetatea | <0.5–400 | Relative peak area (×106) | Seasonal variation of emissions between March and August | Static headspace in Teflon bag SPME–GC-MS |
Beck et al. [18] |
| Caryophyllenea | <0.5–150 | ||||
| α-Humulenea | 0.5–50 | ||||
| Butyrolactone | 0.5–50 | ||||
| MNTs | <0.05 | μg⋅h−1⋅g−1 DW | Emissions from agricultural crops | Dynamic headspace in Teflon bag Adsorbent cartridges GC-MS/GC-FID |
Winer et al. [17] |
| SQTs | No data | ||||
| Hex-3-en-1-ol + hex-3-en-yl Acetate | 2.1 | ||||
| MNTs | 68 ±51 | ngC⋅gDM−1⋅h−1 | Emissions from plant enclosures in a greenhouse in standard conditions | Dynamic headspace Tenax/Carbopack cartridges GC/MS-FID |
Gentner et al. [19] |
| Oxygenated MNTs | 150 ±28 | ||||
| SQTs | 10,000 ±3300 | ||||
| Benzaldehydea | 573.8–1145.5 | ng⋅g−1 FW | Concentration in crushed flowers | Fresh tissues crushed in liquid nitrogen SPME GC-MS |
Nawade et al. [28] |
| (E)-2-Hexenal | 62.06–414.14 | ||||
| Hexanal | 15.42–48.82 | ||||
| 1,4-dimethoxyBenzenea | 2.02–205.9 | ||||
| n-Nonanala | 2.42–61.41 | ng⋅g−1 FW | Concentration in crushed young fruits | ||
| n-Decanal | 2.65–14.59 | ||||
| n-Octanol | 1–9.18 | ||||
| Undecanal | 0.75–7.52 | ||||
| Eugenol | 1.58–674.48 | ng⋅g−1 FW | Concentration in crushed leaves | ||
| Phenyl ethyl Alcohol | 9.42–92.81 | ||||
| Methyl Salicylatea | 1.97–51.62 | ||||
| Germacrene Da | 1.55–37.26 |
The table lists the ranges or mean values ± standard deviation of the major VOCs detected in each study. Note that the first four studies use different units for emission rates and that the last study [28] reports tissue concentrations instead of emissions.
a Compounds found in our analyses. See Table 2. b FW: fresh weight, DW: dry weight, DM: dry matter, C: carbon.
Qualitatively, we find several common compounds between the studies, such as β-caryophyllene, α-humulene, β-(E)-ocimene, linalool and (E)-hex-3-enyl acetate. These VOCs were also detected in our study but not in major amounts. Some VOCs were not detected in our study as perillene [19] or butyrolactone [18]. The study conducted by Nawade et al. [28] did not report on VOC emissions but examined the concentrations of VOCs found in crushed almond tree tissue. While it is not possible to directly compare this study to ours, we found that some of the VOCs we detected were similar to the composition of ground tissues (Table 4).
Minor VOCs may be as important as major VOCs in plant–insect interactions [29]. Our study allowed us to identify many VOCs emitted in small quantities, though not all. Moreover, low molecular weight VOCs may not have been retained by our adsorbent cartridges.
4.2. Seasonal variation of VOCs
The results highlight the variability in the composition and quantities of VOCs emitted during flowering and the growth of fruits and leaves, with stronger emissions from the flowers. However, there was no significant difference in VOC emissions between flowering shoots with or without leaves, which could be attributed to the relatively small size of leaves appearing towards the end of flowering. The floral profile of P. dulcis showed similarities with other Prunus species [30], particularly the presence of benzaldehyde, a floral compound commonly found in plants [31, 32]. The other major VOCs of P. dulcis, 1,4-dimethoxybenzene and germacrene D, differed from other Prunus species. Germacrene D was found in the Rosaceae family such as rose scents [33], and 1,4-dimethoxyBenzene was not found in Prunus species but similar phenolic compounds existed in P. persica and P. avium [32]. However, 1-4-dimethoxyBenzene is commonly found among major compounds emitted by the flowers of various Salix species and elicits a behavioral response in bees [34, 35]. Consequently, the high 1-4-dimethoxyBenzene emission in flowers of almond trees is probably related to pollinator attraction.
Due to the small number of measurements on the fruits and leaves at stages 1 and 2, we grouped these two stages into a “young” stage, and stages 3 to 5 were grouped in a “mature” stage. Our analysis of seasonal emission variations during fruit and leaf growth revealed a diverse range of VOCs, but the majority were SQTs in young and mature fruits and leaves. Our findings are consistent with those of Beck et al. [18], who investigated seasonal variations in VOC emissions from March to August. They found that GLVs, particularly (Z)-hex-3-enyl acetate, were present from mid-May to mid-July, which corresponds to the period when the fruit is mature. However, we identified germacrene D as a major compound, although it was present in only small quantities in Beck et al.’s study.
There seem to be differences between leaf and fruit emissions, but more replicates are needed to identify these VOCs. Since it is difficult to have branches with only fruits, leaves could be removed several days before to avoid a burst of GLVs, but this might create a bias. By adapting the device to the size of an almond, it would enable targeted sampling of specific VOCs emitted by almonds. The longer accumulation time provided by the device would allow for a greater collection of low-level VOC emissions, facilitating more accurate identification of the specific compounds present in almonds.
4.3. Influence of temperature and light on emissions
As reported in numerous studies, plant VOC emissions are influenced by temperature [31, 36]. To our knowledge, no study had shown the impact of temperature on VOC emissions from P. dulcis. Since wasps have a peak in activity in the middle of the day, VOCs emitted at higher temperatures should be more likely to attract wasps. Our study shows a positive correlation between emissions and temperature, with a continuous increase in emissions up to 40 °C. GLVs, such as (Z)-hex-3-en-1-ol, (Z)-hex-3-en-yl butanoate, and (Z)-hex-3-en-yl-2-methyl-butanoate were detected during the most advanced stages of fruit and leaf growth. However, these VOCs were only present during the initial measurement and disappeared afterwards regardless of variations in temperature or light conditions. It is likely that these VOCs have been induced by mechanical stress during the branch positioning in the device and were not influenced by temperature, as discussed by Winer et al. [17].
Furthermore, a significant temperature effect was observed when the difference between the two samples was at least 10 °C. All the VOCs we detected were present within a temperature range of 15 to 40 °C, which made it impossible to select specific VOCs.
No study has investigated the impact of light on VOC emissions from Prunus species. Since wasps are active during the day, discriminating the VOCs emitted according to the time of day would have allowed better targeting of the compounds to be tested. Yet, the apparent absence of a light effect did not allow us to exclude any VOCs on this criterion. Our study was however based on the short-term effect of light. The continuous monitoring of VOC emissions during the natural day/night courses could provide further insights into the environmental factors determining the dial emission rhythm.
The effect of light on emissions could not be assessed during the flowering stage due to the very short flowering time. Thus, four compounds were not found: an unknown compound, 1,4-dimethoxyBenzene, unknown SQT 6, and unknown MNT. (E)-α-bergamotene and linalool were only found in the temperature experiments during the flowering and fruit/leaf growth stages, but not in the light study. It is possible that these compounds were not emitted during the mature stage or were present in such small amounts to be detected. The same hypothesis applies to unknown compound 1, which was not detected in the temperature experiments.
4.4. Impact of variety on VOC emissions
Temperature and light effect models aimed to select VOCs to identify the simplest and most attractive volatile mixture of E. amygdali. Both models demonstrated a significant difference in odor profiles between varieties. In the light experiments, the Lauranne variety exhibited the lowest emissions of VOCs, except for phenolic compounds. This finding can be partially attributed to the fact that the Lauranne variety produced fewer leaves and fruits compared to the other varieties. In contrast, R1004 and R1568 were found to be the two varieties with the highest VOC emissions. To reduce the variability in emissions, conducting additional replicates per variety is recommended. Furthermore, in order to compare the different varieties, we initially hypothesized that the variations observed between the varieties would follow a similar pattern during plant growth. However, to further strengthen our findings and account for interactions between the variety and growth stage factors, it would be beneficial to increase the number of replicates for each stage and variety. However, the impact of variety on the chemical profile of almond trees did not allow the exclusion of VOCs since all varieties were parasitized by E. amygdali during the spring, indicating that their behavior was not affected by varietal emission differences. However, given the abundance of almond varieties, further exploration of differences in VOC emission profiles may prove interesting. Although our experiences are not comparable, Nawade et al. [28] studied the effect of the variety on the compounds present in the tissues and the expression of the TPS genes responsible for the synthesis of terpenes. The tissue-derived compounds partially supported our identification of the effect of variety and phenology on VOC composition. The expression of TPS genes was found in each tissue and variety, but in varying quantities, which could explain the variations in chemical profiles. This variability could potentially impact the interactions between P. dulcis and E. amygdali, although no study has focused on the almond wasp to date.
5. Conclusion
In this study, 44 VOCs emitted by four varieties of almond trees were identified and quantified. VOC emissions were positively correlated with temperature, except for GLVs which are emitted under stressful conditions such as high temperature or rough handling [37]. Light conditions hand no significant effect on emissions. We observed an effect of phenology on the VOC profile though sesquiterpenes-dominated emissions throughout the spring.
To our knowledge, our work is the first study that measured almond tree emissions under environmentally controlled and physiologically normal conditions and investigated their dependency on light and temperature. However, several parameters can influence emissions and create measurement uncertainties [37]. In our study, we only measured emissions from a limited section of the branch and not from the whole tree. Moreover, in our study emissions were measured on potted trees, which could be different from field-grown trees. Another aspect that we did not investigate was the effect of air and soil humidity on the emissions. Given the current climatic context, with more frequent drought episodes, it would be worthwhile to consider the impact of air and soil humidity on emissions as observed on other species [38, 39, 40]. Moreover, E. amygdali activity is negatively correlated with humidity [12] and a context of drought would potentially favor infestation. Therefore, identifying emissions in this context could provide valuable insights. Although our results did not allow us to identify VOCs that likely do not attract the almond wasp, the chemical characterization of the 44 VOCs will enable us to conduct electroantennography tests to evaluate their detection by E. amygdali. This will help in the development of a biocontrol method for trapping the almond wasp in orchards.
Conflict of interest
The authors declare that they have no conflict of interest.
Acknowledgement
We wish to thank the CEFE experimental field team for their involvement in our project.