


 CC-BY 4.0
1. Introduction
In a global change context, the invasiveness of some macrophyte species now causes acute environmental problems in lakes around the world [1]. These species disrupt benthic and pelagic nutrient cycles by producing large amounts of biomass [2], and participate in local biodiversity decline [3]. Thousands of tons of these plants must be removed from lakes each year, with heavy harvesting costs.
Invasive macrophytes show high growth rates as well as a very efficient capacity for vegetative propagation and dispersal [4], giving them clear advantages over other hydrophytes. These plants are also known to affect phytoplankton biomass by altering light regimes and nutrient concentrations [5]. In addition, allelopathy seems to be a particularly effective mechanism to control the development of primary producers. Indeed, recently, an increasing number of studies have stated that invasive macrophytes synthesize bioactive compounds able to allelopathically affect epiphytic communities (bacteria, microalgae, and microfauna), phytoplankton, other plants, and herbivores to ensure their competitive success [6, 7]. Allelochemicals produced by aquatic vascular plants could even be more effective against phytoplankton compared to competition for light and nutrients [5]. In particular, phenols include several toxic molecules such as the family of tannins [8, 9, 10]. According to [11], cyanobacteria are the most sensitive algal group to bioactive compounds from macrophytes. Recent studies acknowledge this observation stating that prokaryotic algae are more sensitive to allelochemicals compared to eukaryotic algae [12].
In a context of increasing eutrophication of aquatic ecosystems, the genera of cyanobacteria that form harmful blooms are causing growing environmental and health hazards [13] due to the production of cyanotoxins. Different approaches based on synthetic chemicals like copper sulfate have been developed to control such blooms [14], however, to reduce collateral damage to ecosystems, environmentally friendly approaches are now needed. In this context, allelopathically active compounds from aquatic vascular plants may offer an interesting option for effective biocontrol of cyanobacteria growth. For instance, different physiological and biochemical processes in cyanobacteria are affected by macrophyte extracts [15, 16]: disturbance of the membrane integrity, oxidative stress, inhibition of extracellular enzyme activity, inhibition of photosynthesis, and respiration.
The techniques used to study allelopathy between cyanobacteria and macrophytes are diverse. Most often, cyanobacteria are cultured in a mineral medium, and macrophyte extracts are added at different concentrations around 1 g/L with exposure times varying between 3 and 10 days [8, 7, 17]. Macrophytes and cyanobacteria can sometimes be co-cultured [17, 18, 19]. Cyanobacteria growth is usually monitored to account for the potential impact of macrophyte extracts. Direct methods such as determination of cell number, dry weight, or biomass [20, 21], are frequently used, as are indirect methods: optical density [22], pigment concentrations [23]. Cyanobacteria’s photosynthetic capacity is also commonly monitored [24], as well as their toxicity by enzyme-linked immunosorbent assays [25, 26].
Despite their relevance, these methods show limitations in terms of precocity and precision of the response measured to different concentrations of bioactive molecules [27]. To tackle this issue, it appears in recent literature that metabolomic approaches may show a higher sensitivity in identifying allelopathic interactions, particularly between cyanobacteria and macrophytes [28, 16]. Metabolomics make it possible to investigate tenuous and early molecular responses as they precede changes in metabolism and growth [29]. Emerging in the 1990s from technical advances in analytical chemistry, metabolomics is defined as the study of all the metabolites of an organism (i.e. metabolome) at a given time and in a given context [30, 31]. As metabolites are small organic molecules involved in metabolic processes, the metabolome represents what is produced from the functional expression of genes under specific environmental conditions (i.e. molecular phenotype) [32]. Globally, primary metabolites are involved in growth or reproduction, whereas secondary (or specialized) metabolites are involved in allelopathic interactions [33]. Different techniques are used to implement metabolomic analyses such as nuclear magnetic spectrometry (NMR) or high-resolution mass spectrometry (HRMS) coupled with separation techniques such as liquid chromatography (LC) or gas chromatography (GC). Regarding, allelopathic interactions in aquatic ecosystems, the untargeted approach based on LC-HRMS/MS is currently the most widespread method since it both allows to determine the molecular/biochemical response to the stress and to identify the secondary metabolites (bioactive compounds) potentially involved [34, 16]. To this end, such a method is often combined with bioguided fractionation in order to direct the identification toward the active metabolites [35].
The Aquitaine coastline lakes share an exceptional natural and cultural heritage, including many endemic species of plants and animals, all of great ecological value. However, over the last decades, these lakes have been exposed to growing biomasses of invasive macrophytes, in particular Lagarosiphon major (L. major), and to frequent cyanobacteria blooms (Microcystis aeruginosa). Both affect crucial ecological functions and disturb human health and activities [36], with potential consequences on the regional economy. To date, the potential presence of natural bioactive compounds in L. major remains unknown. In this context, considering the phytomass this species produces in our region, we planned to explore in L. major the potential existence of bioactive compounds able to control cyanobacterial blooms. The detection of such bioactive compounds may thus constitute a promising and environmentally friendly solution to solve the twofold problem that Aquitaine lakes must face: how to control Microcystis aeruginosa (M. aeruginosa) blooms and how to valorize the L. major biomasses harvested each year? To this end, M. aeruginosa cultures were exposed to increasing concentrations of L. major extracts under controlled conditions. The potential responses of cyanobacteria were characterized by a combined approach based on untargeted metabolomics and photosynthetic activity measurements.
2. Material and methods
2.1. Reagents
Absolute ethanol for macrophyte extraction was purchased from Xilab. All solvents used for metabolomics (i.e. metabolome extraction and UPLC-TOF analyses) were purchased from Biosolve (Dieuze, France). This included methanol (MeOH, UPLC grade), methylbutylether (MTBE, UPLC grade), ultrapure water (UPW, UHPLC grade), acetonitrile (ACN, UHPLC grade), isopropanol (ISO, UHPLC grade), and formic acid (purity: 99%, Biosolve) (see Supplementary Material for accurate composition of the eluent).
2.2. Sampling and extraction of macrophytes
Plants (Lagarosiphon major) were collected in spring 2018 in Parentis Lake (southwest France). Leaves and stems were washed to remove benthic invertebrates and biofilm, then dried at 70 °C until a stable weight was reached. Dried plants were ground to 10 mm (RETSCH SM 300).
Extraction was realized in a thermoregulated reactor with 66% ethanol as solvent in distilled water and 10% (w/v) total solid. The mixture was agitated for four hours at 40 °C. The liquid extract and the solid residue were separated under pressure through a 40 μm filter. The liquid extract was clarified through a 0.4 μm filter and concentrated 3 times under vacuum, to reach 300 g⋅l−1 (dried plants equivalent) as a final concentration in distilled water.
2.3. Cyanobacteria culture
L. major extracts were tested for anticyanobacterial activity using toxic M. aeruginosa non-axenic strains obtained from the Museum National d’Histoire Naturelle de Paris (France) (Microcystis aeruginosa MNHN-PMC-2010-679).
Prior to exposure to L. major extract, M. aeruginosa strains were mass-cultured in 100 ml glass flasks in a sterilized BG-11 medium (2% of concentrated Sigma-Aldrich Cyanobacteria BG-11 freshwater solution 50x in deionized water). Cultures were grown at 25 °C, 18 μmol⋅s−1⋅m−2 PAR and with a 16 h: 8 h light:dark photoperiod.
2.4. Design of the experiment
The inoculum of strains in experiments consisted of exponential growth phase cells at a density of 3 × 10⁻⁵ cells⋅ml−1. Twenty-five ml were inoculated in 100 ml glass flasks and incubated for 96 h with 25 ml of L. major extracts according to the following concentration range (dry weight): 10 g⋅l−1, 3.3 g⋅l−1, 1.1 g⋅l−1, 0.4 g⋅l−1, 0.1 g⋅l−1 and a control group with 25 ml of BG11 with the same content of distilled water (3.3%). All experiments were carried out in four replicates. Flasks were covered with a gas-permeable foam stopper to avoid contamination and placed in the same conditions of light and temperature as above. Every day flasks were manually shaken and positions were randomly changed to ensure the same incubation conditions for each. Cell densities were determined for each condition after 96 h of exposure.
In order to focus on the response directly attributable to cyanobacteria, excluding any artifact due to L. major extracts, we tracked the temporal changes of the latter over 96 h. This step was then implemented to characterize the photosynthetic activity and the metabolites contained in macrophyte extracts as a function of time. The experiment was carried out in four replicates under the same conditions as above, considering only two concentrations (3.3 and 0.4 g⋅l−1 of extract).
2.5. Chlorophyll a content, photosynthetic efficiency measurements, and associated statistics
Light adaptation of the strains was carried out for 15 min at 25 °C prior to the measurements that were all performed within 2 h. Total chlorophyll a (Chl a) related to cyanobacteria was determined by multi-wavelength pulse-amplitude-modulated fluorometry on a Phyto-PAM system [37] immediately after inoculation (T0) and after 24, 48, 72, and 96 h of exposition. The automatic Zero-offset function (Zoff) previously suppressed the potential background signal, measuring the filtrate of a blank sample (BG11). Temperature (25 °C) and distance between the light-emitting diode and samples (8 mm) were kept constant for all measurements. Photosynthetic efficiency (yield) was estimated using the saturation pulse method to determine photosystem II (PSII) quantum yield (photosynthetic efficiency, Yeff) at 24 h, 48 h, 72 h, and 96 h. Effective PSII quantum yield is defined as a measure of the photosynthetic efficiency of the community [38].
Single-factor ANOVA statistical tests were performed using RStudio version 4.0.3 to account for potential significant differences between photosynthetic activities at different extract concentrations after 96 h. A post hoc Tuckey test was performed at 96 h to compare modalities two by two.
2.6. Untargeted metabolomics
2.6.1. Sampling and sample preparation
After four days of exposure, 40 mL of each replicate were quenched in liquid nitrogen and stored at −80 °C. The samples were slowly defrosted at 4 °C overnight prior to their centrifugation (15 min, 3500 RPM) on ice, allowing to separate the exo-metabolome (i.e. culture medium) and the endo-metabolome (cyanobacteria). Both were stored at −80 °C prior to freeze drying and further storage at −80 °C. The extraction was performed only on the endometabolome samples through a biphasic extraction adapted from Giavalisco et al. [39] and Mazzella et al. [40] (brief description in Supplementary Material, Section 1.1).
2.6.2. UPLC-HRMS/MS analyses and data processing
As a first step, all extracts (i.e. cyanobacteria endometabolome and macrophyte extracts) were analyzed on a UPLC-ToF system (Ultra-Performance Liquid Chromatography—Time of Flight Mass Spectrometry, Xevo G2-S ToF, Waters). Following the injection of 10 μL, the chromatographic separation was performed at 40 °C on an HSS-T3 column (150 × 2.1 mm × 1.7 μ, Waters) connected to an HSS-T3 security guard cartridge (10 × 2.1 mm) by using two different gradients according to the analysis of the hydrophilic or the lipophilic fraction, respectively (Supplementary Table S1). HRMS data acquisition was performed in MSe centroid mode after electrospray ionization operated in positive (ESI+) or negative (ESI−) mode (Supplementary Table S2). Briefly, MSe mode consisted in the acquisition of all ion fragmentations including full scans (50–1500 m∕z) at both low (6 eV) and high (10–40 eV ramp) collision energy with a scan time of 0.2 s. Lockspray solution (Leucine Enkephalin, Waters) was infused every 60 s at 10 μL∕min in parallel with the sample to correct mass drift during the acquisition (Lockmass: 556.2771 in ESI+ and 554.2615 in ESI−). Data processing (i.e. preprocessing and further filtration) is described in Supplementary Material (Section 1.2.3).
Since the reliability of MSe mass spectra with available MS2 libraries was low (see below), a limited number of relevant samples (i.e. extracts of cyanobacteria from only two conditions: control and exposed to 10 g/L) were re-injected on UPLC-Qexactive+ instrument (ThermoScientific) in order to acquire actual MS2 allowing to improve the annotation of metabolites and associated pathways. The chromatographic conditions were similar to those of UPLC-TOF (Supplementary Table S1). The mass spectrometer was operated in DDA top5 acquisition mode consisting of a full scan (75–1500 Da) followed by MS2 acquisition of the five most abundant peaks for each scan. Source and acquisition parameters are detailed in Supplementary Material (Supplementary Table S3). Data were directly processed with MS-DIAL.
2.6.3. Chemometric analyses and aggregated metabolomic dose–responses
The metabolomic datasets were analyzed using the statistical analysis tool from MetaboAnalyst 5.0 and DROMICS [41].
Prior to the chemometric analyses in MetaboAnalyst, data were processed using the interquartile range (IQR) in order to keep only the 5000 more significant features. Then, data were normalized (sample’s median), transformed (cube root of variable values), and scaled (variable value pareto) to obtain homoscedasticity. For the endometabolome datasets, unsupervised (PCA, HCA) and supervised (PLS-DA) multivariate analyses were implemented to get a comprehensive picture of the metabolomic response and to test if the metabolomic fingerprints differed between the tested concentrations. Such analyses were performed for all the datasets, individually.
To take advantage of the serial dilution-based screening strategy, DROMICS [41] was used in order to provide aggregated metabolomic dose–responses, as the empirical cumulative distribution frequency (ECDF) of the benchmark dose 1SD (BMD1SD) of each feature (see Supplementary Section 1.2.3). To do so, the entire dataset (i.e. without IQR filtration) was first normalized, transformed, and scaled. In DROMICS, the features were first filtered according to their responsiveness (i.e. Quadratic trend test, FDR = 0.01) and then categorized according to their trends (increase, decrease, U-shape, Bell-shape) with increasing concentration of the extract (see Supplementary Section 1.2.3). The responsive features fitting with the proposed quadratic models were selected for annotation.
2.6.4. Metabolite annotation
Metabolite annotation was performed using MS-DIAL combined with MSClean-R, allowing the multiplexing of positive and negative data and the clustering of adducts, the use of an in-house MS2 library (kind gift from G. Marty), and the further implementation of software (MS-Finder, SIRIUS 5) for in silico machine learning and molecular networking (Supplementary Table S6 and Supplementary Figure S1 and S2). To this end, only a part of the HRMS-TOF raw data was processed including those from the cyanobacteria endometabolome (control and at 3.3 g/L conditions) and the macrophyte extract (3.3 g/L).
Briefly, the datasets were processed with the suspect list from DROMICS and an in-house database covering central metabolism. For both processes, the signals were cleaned using MS-CleanR and further annotated using MS-Finder and SIRIUS. In both softwares, several databases (Puchem, COCONUT, HMDB, CheBi, Biocyc, etc…) were explored from in silico fragmentation and machine-learning, based on the simplified molecular-input line-entry system (SMILES). In particular, Sirius was used to take advantage of its machine-learning algorithm to compare our experimental MS2 fragments with the predicted ones.
Since the match between TOF spectral data and the in-house library was low (data not shown), some samples were analyzed on an UPLC-Qex+ to obtain more accurate MS2, allowing to improve the number of matches with MS2 spectra from experimental acquisition or in silico and machine learning tools. These HRMS data were directly processed using MS-DIAL combined with MS-cleanR, MS-Finder, and SIRIUS. Details on processing parameters are provided in Supplementary Material (Supplementary Table S5, Supplementary Figures S1 and S2).
In the best case, the metabolites were putatively annotated at Level 2a (i.e. probable structure due to library MS2 spectrum match) while most of them were at L3 (tentative candidates related to match in silico or machine learning based fragmentation) according to the confidence scale of Schymanski et al. [42]. Also, SIRIUS allowed annotation at the pathway and superclass levels based on a neural network algorithm (Natural Products Classifier, [43]. The putative annotations of all the datasets (Hydro ESI+∕− from both LC-TOF/LC-Qex, Lipo ESI+∕− from LC-TOF) were finally merged in a single sheet and further filtered to obtain a list of putative metabolites, pathways and superclasses (𝛥ppm < 10; ZODIAC score > 0.4; Single putative SMILE from SIRIUS).
2.7. Chemical characterization of L. major raw extracts
UPLC-HRMS/MS analyses (TOF and QExactive+) were performed on macrophyte extracts as described above (i.e. only the hydrophilic gradient). The dataset (ESI+∕−) was processed directly in MS-Dial combined with MS-Clean-R, MS-Finder, and SIRIUS as described above for the endometabolome.
3. Results
3.1. Photosynthetic activity of M. aeruginosa strains
The average Chl a contents in controls were about 900 μg∕l. No clear impact of extracts was observed on Chl a whatever the concentration considered (Figure 1).
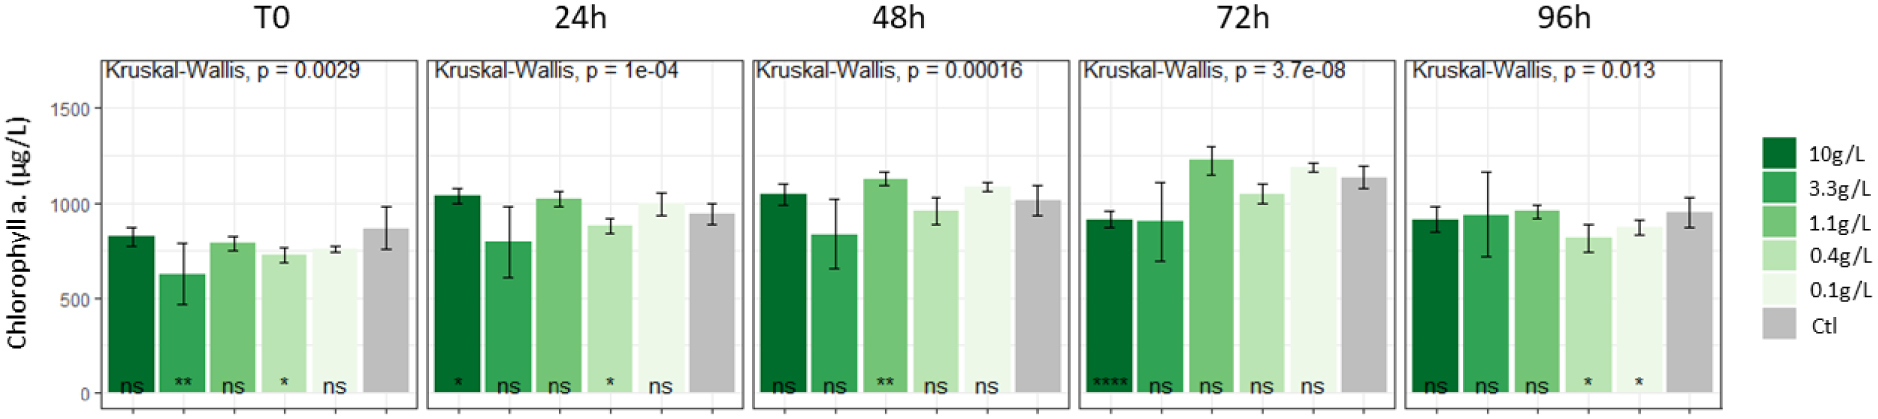
Impact of L. major extracts on M. aeruginosa strains: Chl a contents ns: non significant difference with the control; *: significant difference (p < 0.05).
Yield values for controls were about 0.40. The photosynthetic yield value of M. aeruginosa was significantly reduced with the 10 g/l extract (Figure 2).
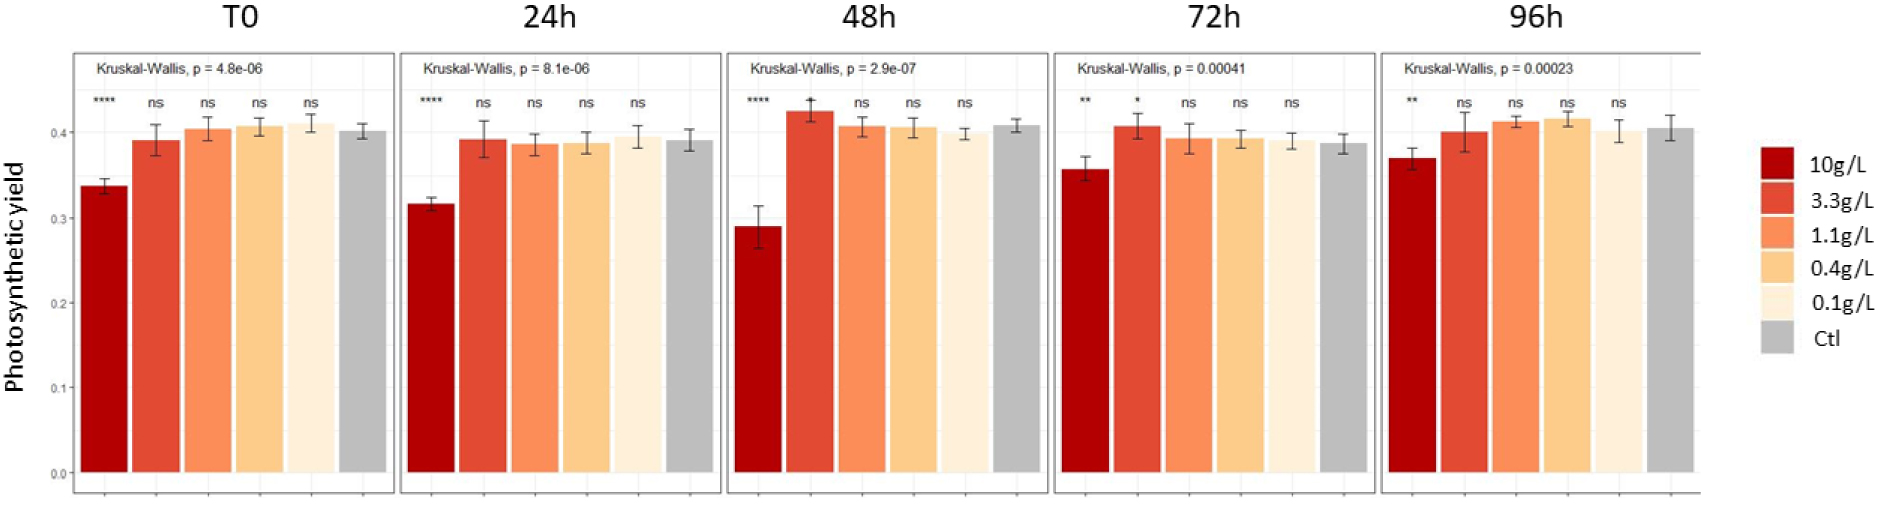
Impact of L. major extracts on M. aeruginosa strains: photosynthetic yield values.
After 96 h of exposure, cell densities for the different conditions were not significantly different from the initial one (3 × 10⁻⁵ cells⋅ml−1): 2.7 × 10⁻⁵ cells⋅ml−1 for 10 g⋅l−1; 2.8 × 10⁻⁵ cells⋅ml−1 for 3.3 g⋅l−1 and 1.1 g⋅l−1; 2.7 × 10⁻⁵ cells⋅ml−1 for 0.4 g⋅l−1; 2.9 × 10⁻⁵ cells⋅ml−1 for 0.1 g⋅l−1.
3.2. Metabolomic response of Microcystis aeruginosa exposed to Lagarosiphon major extracts
3.2.1. Metabolomic fingerprint and associated aggregated dose–response
Results from exploratory PCA and HCA performed on each dataset (i.e. Hydro-ESI+∕−, Lipo-ESI+∕−) revealed that the metabolomic fingerprints differed between the different concentrations tested (Supplementary Figure S3). In particular, HCA and associated heatmaps revealed how the highest concentrations (10 and 3.3 g/L), clustered together, triggered a shift in the metabolome of Microcystis aeruginosa (Supplementary Figure S3). Hence, HCA results revealed two main metabolite clusters in all datasets: one with high intensities at the highest concentrations and low intensities for the control, and another cluster with opposite patterns. Further PLS-DA results confirmed for all datasets the clear discrimination between the different conditions tested, showing significant (high R2 and Q2 values) and distinct distributions along component 1. This axis explained 34.7% (HydroESI+) and 71.6% (LipoESI−) of the total covariance (Figure 3).
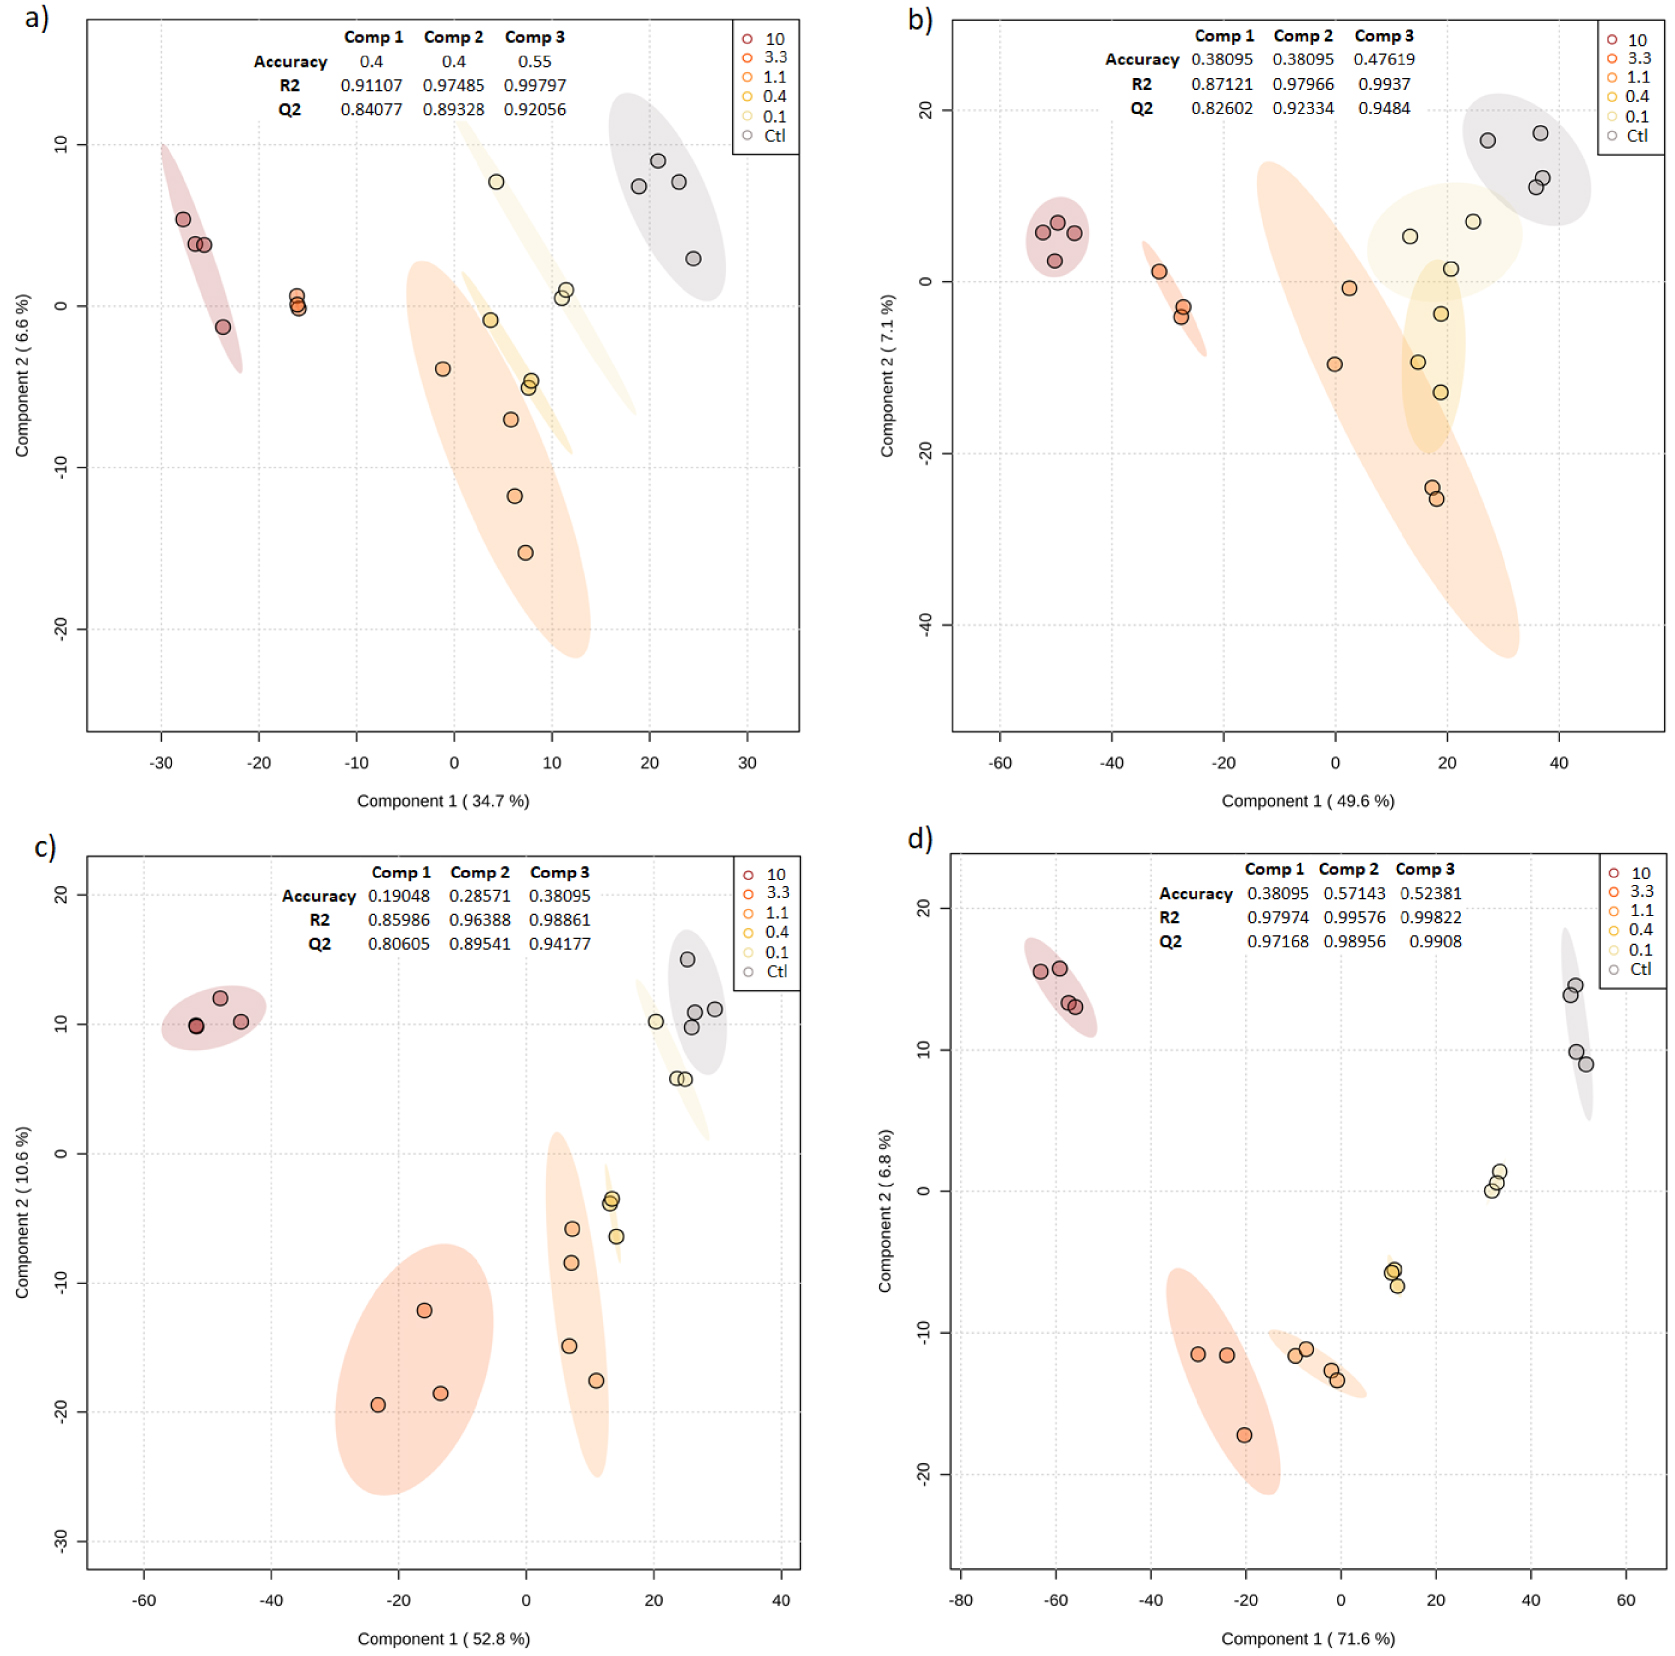
PLS-DA scores plots of the metabolome hydrophilic (a, ESI+; b, ESI−) and lipophilic fractions (c, ESI+; d, ESI−) of M. aeruginosa strain.
The further implementation of DROMICS allowed us to categorize the features according to their quadratic trends (i.e. Increase, Decrease, U-shape, Bell) and to provide an aggregated response (ECDF) according to their sensitivity to the extract (i.e. BMD1SD), revealing interesting patterns for each dataset (Figure 4 and Supplementary Figure S4). First, the full aggregated ECDF showed that 50 to 75% of the metabolome responded at concentrations higher than 1 g/L of Lagarosiphon major extract (Figure 4). Then, for all datasets, increasing and decreasing trends were the most represented (>60% of total signal), while increasing features were more frequent than decreasing ones except for the lipophilic ESI− (Supplementary Figure S4). Nevertheless, the high number of decreasing features for all the fractions (938 for Hydro-ESI+, 1597 for Hydro-ESI−, 3410 for Lipo-ESI+, 2493 for Lipo-ESI−) highlighted the potential inhibition of the biosynthesis of hundreds of metabolites (Supplementary Figure S4). Nevertheless, it is important to notice that most of these features are likely shared between ESI+/ESI−. In the same way, the analytical redundancy between various adducts corresponding to the same metabolites was not yet filtered at this level. Thus, the high number of features following a quadratic trend should be considered carefully.
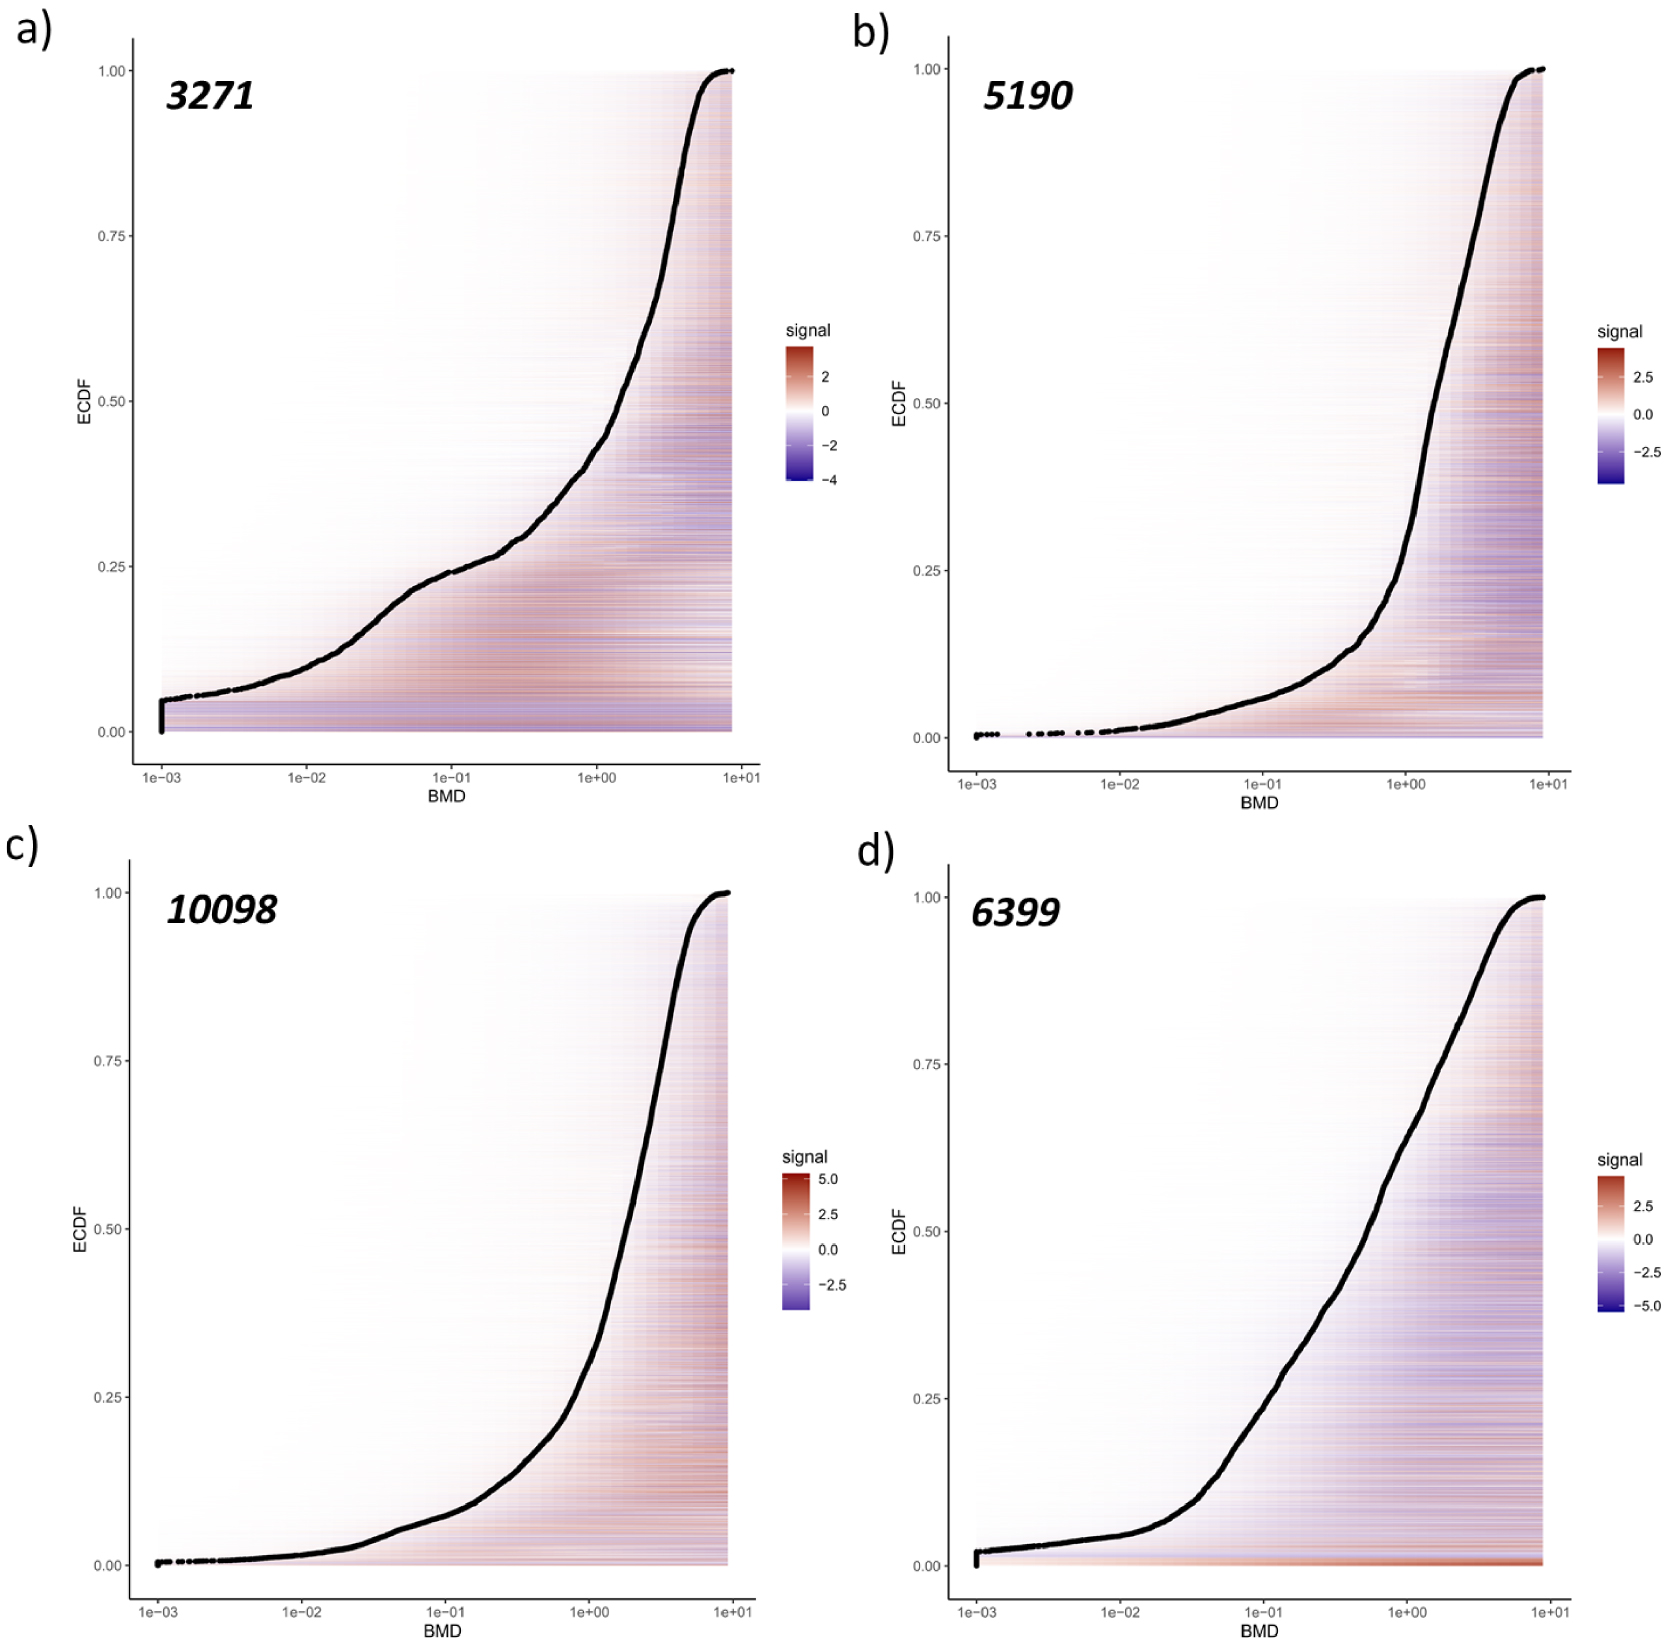
Empirical cumulative distribution function (ECDF) of the BMD1SD values from the metabolome in the hydrophilic (a, ESI+; b, ESI−) and lipophilic (c, ESI+; d, ESI−) fractions of M. aeruginosa strain. In the distribution, one point is one feature. The redcolor means upregulation, while in blue is downregulation. The numbers in the top left are the number of features for each conditions (i.e. the number of point in the ECDF).
3.2.2. Candidate pathways and associated metabolites
By processing both LC-TOF and LC-Qexactive HRMS data in MS-Dial combined with MS-cleanR and further MS-Finder and SIRIUS annotation tools, some putative metabolites and associated pathways have been preliminary annotated. Overall, in case of a poor match between our spectra and the in-house library, MS-Finder and mostly Sirius proposed a putative formula and structure (Smile, InchI) for 588 signals in the hydrophilic phase, and for 274 signals in the lipophilic phase following a significant quadratic trend (Inc, Dec, U, Bell) or showing significant up/down-regulation (see Supplementary Table S6 and S7).
Figure 5 summarizes the contribution of these metabolites to different NPC pathways [43]. The most represented pathways were the amino acids and peptides (37.1%) followed by the alkaloids (22%), the fatty acids (21.2%), and the terpenoids (11.0%). For these pathways, the proportion of various trends was quite similar: almost 30% of increasing, 30% of decreasing, and 30% of metabolites rather following U-shaped or bell trends.
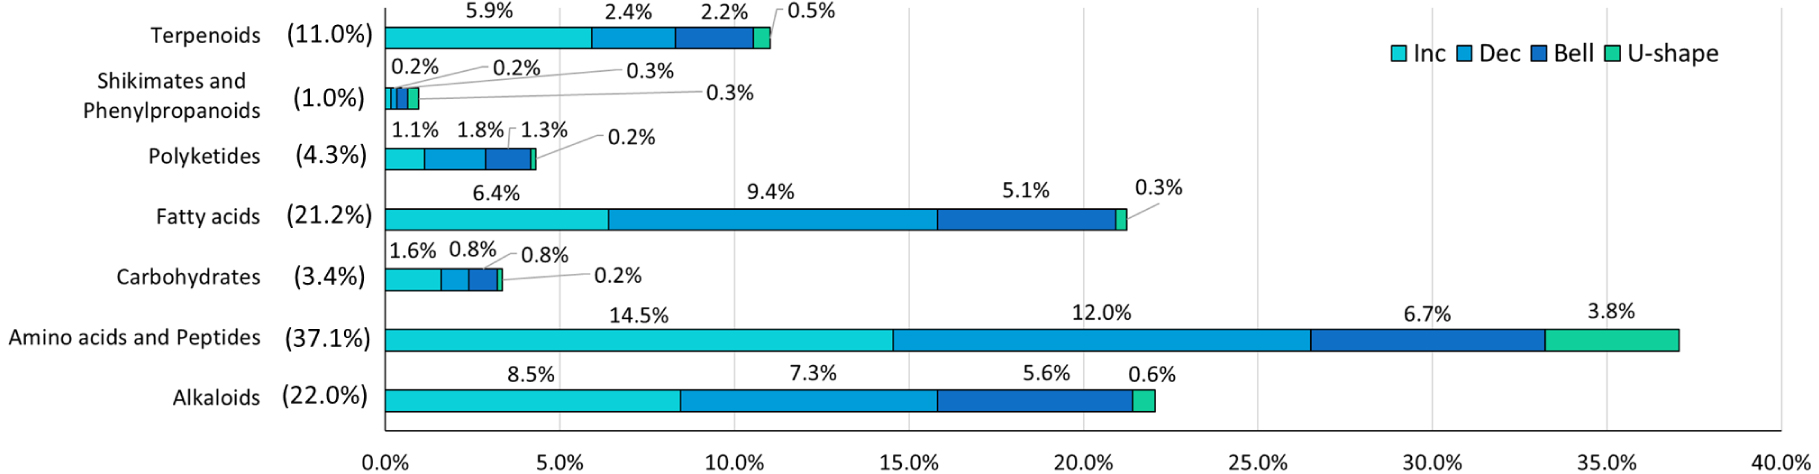
Distribution of the putative metabolites among the NPC pathways in both hydrophilic and lipophilic phases and associated trends according DROMICS. Inc = increasing, Dec = decreasing.
Figure 6a reports the distribution of BMD1SD according to the different pathways that revealed quite similar sensitivity. Indeed, for all the pathways considered, most of the putative metabolites responded significantly for exposure concentrations below 1.25 g⋅l−1 of macrophyte extract. Looking at the fold change of the putative metabolites in these various pathways showed some discrepancies (Figure 6b). Indeed, the classes of polyketides and fatty acids were significantly downregulated (i.e. median < 0) in comparison to the other classes (Kruskal–Wallis, Dunn post hoc, p < 0.01). The others were mainly upregulated (median > 0) although many amino acids and peptides (12% of the total) and alkaloids (7.3% of the total) were still significantly downregulated, as reported in Figure 5.
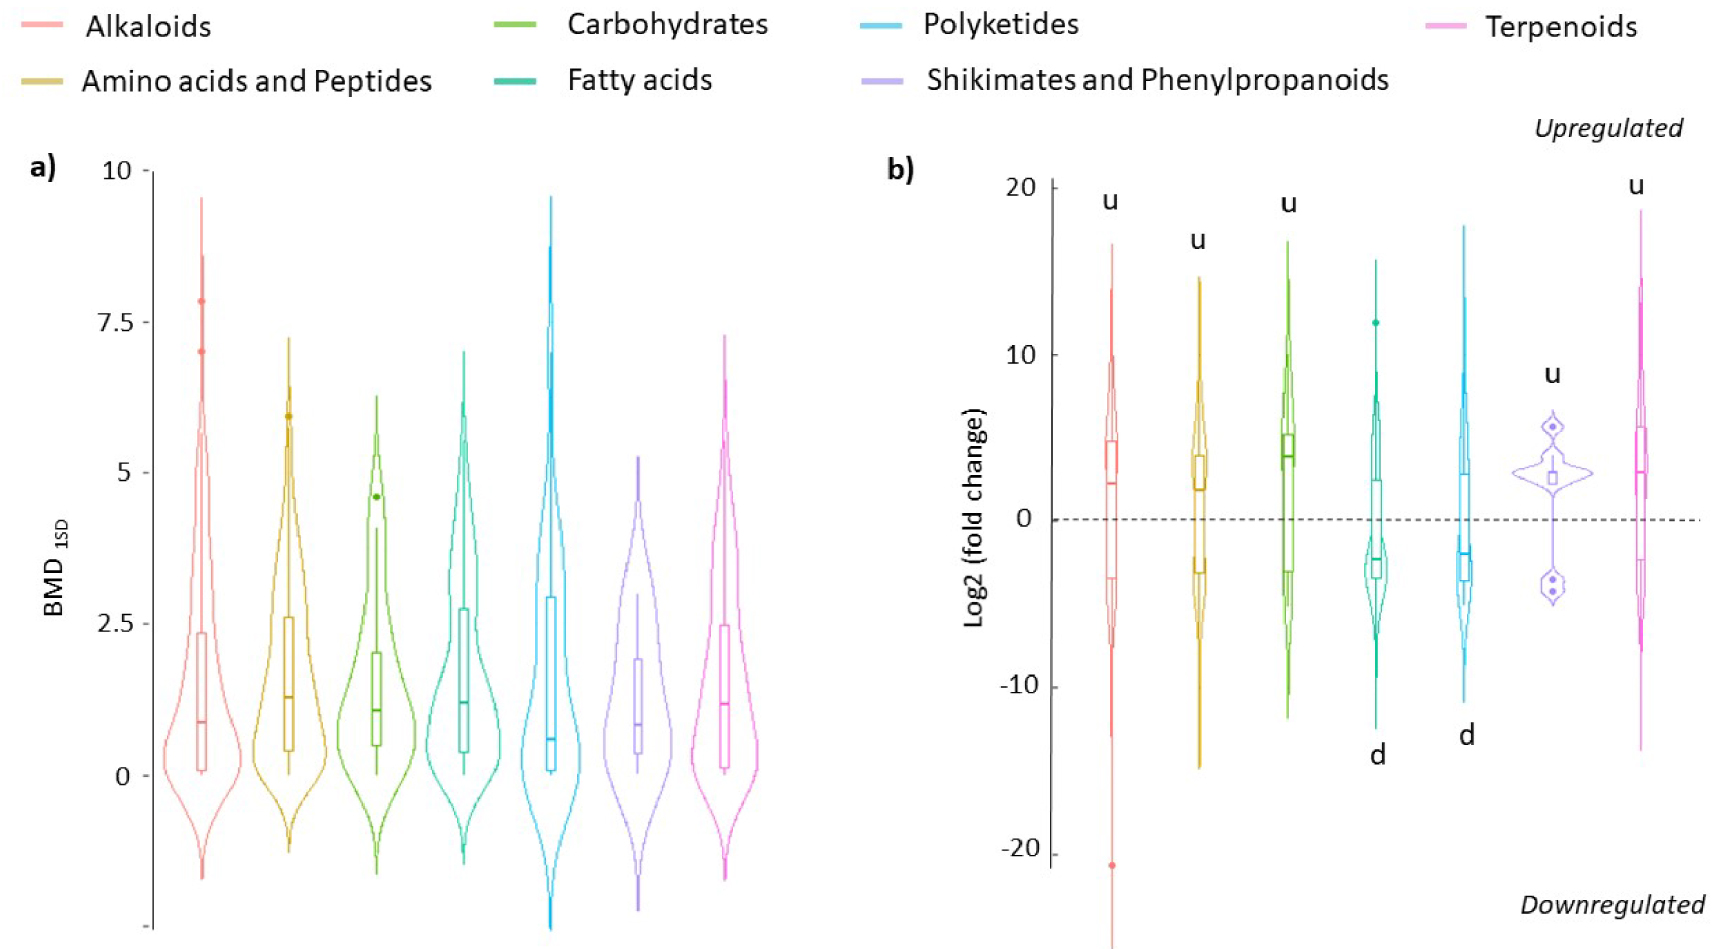
Distribution of BMD1SD values (a) and significant fold change (b) of putative metabolites from both hydrophilic and lipophilic phases of M. Aeruginosa endometabolome according to NPC classes. BMD1SD are expressed in g/L (a). Significant fold changes were from ANOVA t-test (p value < 0.01) between the control and 3.3 g/L conditions (b). In b, significative differences in the distribution of log2fold between the classes are noted “u” and “d” according to Kruskal–Wallis and post hoc Dunn’s tests, respectively (p < 0.01). Masquer
Distribution of BMD1SD values (a) and significant fold change (b) of putative metabolites from both hydrophilic and lipophilic phases of M. Aeruginosa endometabolome according to NPC classes. BMD1SD are expressed in g/L (a). Significant fold changes were from ANOVA Lire la suite
At the superclass level, the oligopeptides and the small peptides were the most abundant (26 and 17% among the total annotated metabolites, respectively) (Supplementary Figure S5). Concerning the small peptides superclass, numerous features up/down regulated were attributed to the di/tri-peptides class while two amino acids (i.e. L-methionine, N-methylthreonine) and one alkaloid (tetrandrine) were putatively annotated (L2a) according to experimental MS2 fragmentation spectra (Supplementary Table S6). Other “abundant” superclasses significantly up/dow-regulated were the sphingolipids (6%), triterpenoids (5%), tryptophan alkaloids (5%), glycerophospholipids (4%), and eicosanoids (4%), mainly represented by the prostaglandins class (Supplementary Figure S5 and S6). Overall, our results revealed that 268 putatively annotated metabolites at L3 belonging to various superclasses/classes from amino acids and peptides (125), fatty acids (79), alkaloids (26), polyketides (15), terpenoids (10), carbohydrates (8), shikimate and phenylpropanoids (2) pathways (NPC class probability > 0.5) followed a decreasing, U-shape or bell trends associated to the exposure to increasing concentration of L. major extract (Supplementary Table S6).
3.3. Biomolecules in L. Major extracts
UPLC-HRMS-analyses provided a detailed picture of the chemical landscape (even if not totally holistic according to the ethanolic extraction) of Lagarosiphon major extracts. Hence, almost 2201 features were putatively annotated at the pathway level (probability > 0.5, Supplementary Table S8). Most of these metabolites belonged to the terpenoids (23%), fatty acids (22%), alkaloids (18%), amino acids and peptides (17%) pathways (Figure 7).
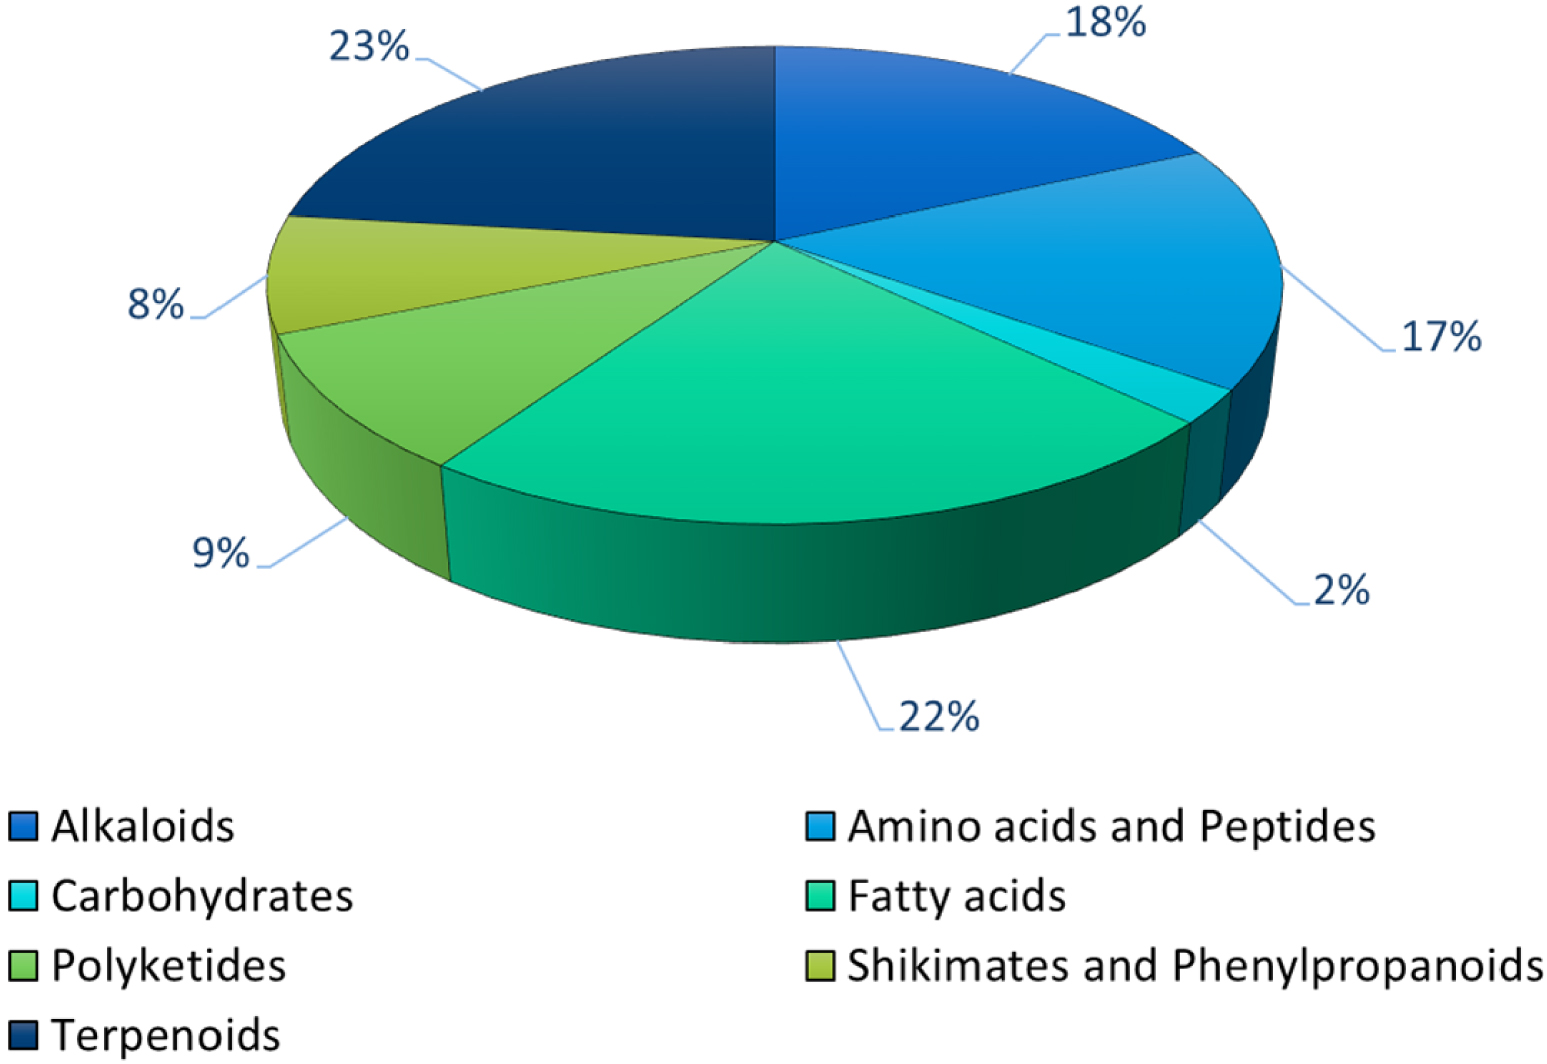
Distribution in the various NPC_pathways of the putative annotated metabolites in L. major extract. (Zodiac score > 0.5, NPC probability > 0.5, n = 2179).
At the superclass level, 1538 features were putatively annotated (probability > 0.5, Supplementary Table S8). The small peptides (12%), the oligopeptides (8%), the triterpenoids (7%), the fatty acids and conjugates (7%), and the sesquiterpenoids, the tryptophan alkaloids and the steroids (all at 5%) were the more abundant while the flavonoids represented less than 1% (Supplementary Figure S7). At the class level, the cyclic peptides (6%), the tripeptides (5%), the amino acids (5%), the dipeptides (4%), the hydroxy-fatty acids (4%) and other octadecanoids (3%) encompassed 27% of the total annotated metabolites (Supplementary Figure S8). The other main classes (i.e. higher than 2% of the total) were the cinnamic acids and derivatives, the oleanane triterpenoids, the open-chain polyketides, the prostaglandins, pyridine alkaloids, the glycerophosphoethannolamides, the dicarboxylic acids, the phenolic acids, limonoids, the n-acylamines and the unsaturated fatty acids, accounting for 23% of the total.
Among all the putatively annotated pathways according to NPC-classifier [43], a few features matched our in-house experimental MS2 library. Among others, p-coumarate, caffeic acid, and saikosaponin A were putatively annotated at L2a level (Table 1, Supplementary Figure S9–S11). Thanks to MS-Finder and SIRIUS, additional structures were found including triterpene saponins (e.g. spinasaponin A, acutoside A; lucyoside M), flavonoids (Quercetin 3-galactoside, selaginellin M, Luteolin 7-O-beta-D-diglucuronide) or phenolic acids (vanillic acid, salicylic acid glucoside) and phenylpropanoids (caffeic acid), all annotated at the level 3 (Table 1).
List of putatively annotated metabolites in L. major extracts
| m∕z | Formula | Rt | adduct | 𝛥m∕z (Da) | Sirius score | Zodiac score | Putative name | InChIKey | CSI.FingerID score | Confidence score | xlogp | MS2 exp. match | NPC.superclass | CHEBI | PUBCHEM CID | Confidence level |
|---|---|---|---|---|---|---|---|---|---|---|---|---|---|---|---|---|
| 465.1012 | C21H20O12 | 8.993 | [M+H]+ | 0.002 | 44.9 | 1.0 | Quercetin 3-galactoside | OVSQVDMCBVZWGM-DTGCRPNFSA-N | −96.7 | 0.2 | 0.4 | N | Flavonoids | 67486 | 5281643 | L3 |
| 167.0334 | C8H8O4 | 7.009 | [M−H]− | 0.002 | 7.4 | 1.0 | Vanillic acid | WKOLLVMJNQIZCI-UHFFFAOYSA-M | −43.4 | 0.1 | 0.6 | N | Phenolic acids (C6-C1) | 16632 | 54675858 | L3 |
| 299.0764 | C13H16O8 | 6.923 | [M−H]− | 0.001 | 29.2 | 1.0 | Salicylic acid glucoside | TZPBMNKOLMSJPF-TWEVDUBQSA-N | −31.5 | 0.1 | −0.9 | N | Phenolic acids (C6-C1) | 87766 | 151505 | L3 |
| 637.1025 | C27H26O18 | 8.536 | [M−H]− | 0.002 | 4.7 | 1.0 | Luteolin 7-O-beta-D-diglucuronide | PBBVWJQPAZYQDB-DBFWEQBMSA-L | −156.9 | 0.2 | −0.6 | N | Phenolic acids (C6-C1) | 57815 | 46878427 | L3 |
| 165.0547 | C9H8O3 | 3.561 | [M+H]+ | −0.0005 | 38.8 | 1.0 | p-Coumaricacid | NGSWKAQJJWESNS-UTCJRWHESA-N | −19.8 | 0.2 | 1.4 | Y | Phenylpropanoids (C6-C3) | 17450 | 1549106 | L2a |
| 163.0391 | C9H8O4 | 10.04 | [M−H2O+H]+ | 0.0008 | 39.4 | 1.0 | Caffeate | QAIPRVGONGVQAS-DUXPYHPUSA-N | −13.3 | 0.5 | 0.9 | Y | Phenylpropanoids (C6-C3) | 36281 | 689043 | L2a |
| 779.459 | C42H68O13 | 13.882 | [M−H]− | −0.0003 | 27.8 | 1.0 | Acutoside A | LEQCLUFJRGKLOA-WLMDKFIXSA-N | −243.2 | 0.1 | 2.3 | N | Diterpenoids | 65370 | 21606142 | L3 |
| 817.4351 | C42H66O14 | 12.567 | [M+Na]+ | −0.001 | 44.1 | 1.0 | Spinasaponin A | BQPYEFAVIPEQIK-CGCSGISQSA-N | −54.6 | 0.2 | 3.0 | N | Triterpenoids | 9228 | 441951 | L3 |
| 835.4466 | C44H68O15 | 12.962 | [M−H]− | 0.002 | 46.8 | 1.0 | Lucyoside M | FNSXRAISABPGKU-UHFFFAOYSA-N | −95.3 | 0.3 | 2.7 | N | Triterpenoids | 176325 | 131751578 | L3 |
| 779.4576 | C42H68O13 | 13.339 | [M−H]− | 0.001 | 10.1 | 1.0 | Saikosaponina | KYWSCMDFVARMPN-MSSMMRRTSA-N | −102.1 | 0.2 | 2.5 | Y | Triterpenoids | 8996 | 167928 | L2a |
| 159.1019 | C8H16O3 | 12.036 | [M−H]− | 0.002 | 20.8 | 1.0 | 3-Hydroxyoctanoic acid | NDPLAKGOSZHTPH-UHFFFAOYSA-N | −10.9 | 0.3 | 2.0 | N | Fatty Acids and Conjugates | 37098 | 26613 | L3 |
| 295.2283 | C18H32O3 | 14.367 | [M−H]− | −0.0004 | 22.7 | 1.0 | Coronaric acid | FBUKMFOXMZRGRB-YFHOEESVSA-N | −5.7 | 0.1 | 5.3 | N | Octadecanoids | 34494 | 6246154 | L3 |
| 329.2338 | C18H34O5 | 11.434 | [M−H]− | −0.0004 | 31.3 | 1.0 | Pinellic acid | MDIUMSLCYIJBQC-MVFSOIOZSA-N | −25.2 | 0.1 | 3.1 | N | Octadecanoids | 34506 | 9858729 | L3 |
| 291.1964 | C18H28O3 | 13.74 | [M−H]− | 0.0002 | 5.1 | 1.0 | Colnelenic acid | OYKAXBUWOIRLGF-VMBRNALUSA-N | −27.8 | 0.1 | 4.6 | N | Octadecanoids | 60959 | 6441679 | L3 |
| 309.2077 | C18H30O4 | 13.996 | [M−H]− | −0.001 | 24.7 | 1.0 | Octyl docosanoate | MWSXIWIELAIOBE-UHFFFAOYSA-N | −14.5 | 0.1 | 4.7 | N | Octadecanoids | 80081 | 80081 | L3 |
4. Discussion and perspectives
4.1. Molecular and physiological responses of M. aeruginosa to L. major extracts
In this study, we demonstrate the anticyanobacterial properties of L. major extracts. In particular, we report that L. major extract inhibits M. aeruginosa photosynthesis, with a clear drop in the cyanobacteria photosynthetic yield at a concentration of 10 g⋅l−1. Photosynthesis is a key physiological process targeted by allelopathic compounds [44, 16]. Numerous studies suggest that allelochemicals from macrophytes show photosynthesis inhibitory properties by disrupting the electron transport chain, reducing pigment content, or modifying Chl a fluorescence [45]. If the active concentration of 10 g⋅l−1 may appear quite high, this is consistent with literature that frequently reports the effects of extracts from several grams per liter. For instance, Chara globularis inhibits cyanobacteria growth at 2.5 g⋅l−1 [46] and Egeria densa at 3 g⋅l−1 [47].
The metabolome of M. aeruginosa on the other hand changed from the lowest tested concentration (0.1 mg/L). This study is the first to characterize the aggregated dose–response of the metabolome from an allelopathic interaction perspective. In particular, EDCF highlighted that 25–50% of the metabolome responded to concentrations lower than 1 g⋅l−1 while the yield still did not change. Thus, our results demonstrate, in the context of our study, the earlier detection of the molecular responses regarding the physiological ones, as recently reported in the literature [48, 49]. Such results further underline the potential use of metabolomics as an early and sensitive (predictive) marker of the potential impairment of physiological processes such as photosynthesis.
Moreover, this study highlights that the response of the M. aeruginosa endometabolome is not monotonic. Indeed, even if the majority of the putative annotated metabolites followed increasing or decreasing trends, many others followed a bell trend. If such discrepancies have already been reported in microalgae or periphyton in metabolomic and other omic approaches [50, 51, 48], this study reports it regarding potential chemical interactions. Altogether, such outcomes underline the need to improve the knowledge about single metabolite or pathway dose–responses. Here, our data suggest that various biosynthetic pathways in M. aeruginosa might be impaired by L. major extracts (e.g. amino acids and peptides, alkaloids). Nevertheless, as discussed thereafter, the current experimental design limited our ability to go further and provide actual clues about the impact of L. major extract on key metabolic functions.
4.2. Uncertainties regarding the interpretation of metabolomic data
First of all, as we subtracted from the cyanobacteria endometabolome the signals from macrophyte extracts, it is likely that primary metabolites occurring in both matrices have been removed from the dataset, limiting the assessment of L. major effects on M. aeruginosa metabolism. Conversely, the lipophilic phase signals of the endometabolome were not filtered and could then be “contaminated” by the macrophyte extract. Nevertheless, the hydrophilic extraction of L. major matrix logically limited the content of lipophilic chemicals that could be further partitioned in the lipophilic phase of M. aeruginosa endometabolome. Thus, even if it cannot be excluded that increasing signals in the lipophilic phase were at least partly due to L. major extracts, many metabolite trends from the lipophilic phase of M. aeruginosa metabolome decreased or followed a bell or U-shape with increasing concentration of L. major extract.
Despite those limitations, our results reveal that 268 annotated metabolites belonging to various classes, mainly from amino acids and peptides, fatty acids, and alkaloids pathways (NPC class probability > 0.5), follow such trends (i.e. decreasing, U, bell). Among amino acids and peptides, the most impacted metabolites were tripeptides and cyclic peptides which are both known as secondary metabolites involved in allelopathic interactions (e.g. antibacterial, antifungal activities) [52, 53, 54]. For example, gamma-glutamyl peptides—one of the tripeptides putatively annotated in this study—are known to be involved in endogenous processes dedicated to protecting cyanobacteria against environmental stressors (oxidative stress and xenobiotic detoxification) [55]. Some other annotated metabolites were identified as mycosporine-like amino acids, described in the literature as photoprotective molecules [54]. Among fatty acids, many putative metabolites were classified as ceramides (sphingolipids superclass) known for their role in adaptation to biotic and abiotic stress in plants at both physiological and structural levels [56, 57]. Others were glycerophospholipids known as major constituents of the cellular membrane, prostaglandins described as anti-inflammatory chemicals [58], and unsaturated fatty acids playing a role in membrane physiology, stress regulation, and with bioactive properties (antibacterial and antifungal) [59].
Altogether, our results show the clear modulation of various metabolite classes and pathways mainly involved in the secondary metabolism of M. aeruginosa, suggesting a potential impairment of defense mechanisms against environmental predators and competitors (fungi, bacteria, plants). Further experiments are needed in order to (i) determine if the central metabolism of M. aeruginosa is also potentially impaired by L. major metabolites and (ii) to identify these bioactive chemicals. To do so, bio-guided fractionation of L. major extract seems to be a promising approach that would reduce its complexity, allowing to unravel the actual effect on M. aeruginosa metabolome and to isolate the key metabolites identified through cutting-edge structural elucidation techniques [35].
4.3. Extract composition, in relation to the effect observed on M. aeruginosa
Allelopathic compounds with algicidal effects are classified into four categories: polyphenols, alkaloids, fatty acids, and terpenoids [12]. Among the 40 macrophyte species reported in the literature, Nezbrytska et al. [60] listed the most promising ones for biological control of cyanobacteria, considering their ability to produce such allelochemicals. If Nuphar lutea, Myriophyllum spicatum, Ceratophyllum demersum, Phragmites communis, or Elodea canadensis are cited because largely studied, to date Lagarosiphon major remains absent from this list, and from literature in general, because its chemical composition is absolutely unknown.
Hence, to the best of our knowledge, this study reveals for the first time anticyanobacterial properties of L. major extracts, containing metabolite classes with known allelopathic properties such as alkaloids, fatty acids, terpenoids (e.g. saponins), and polyphenols (e.g. flavonoids) as revealed by the rough screening and further HRMS analyses. Among putative annotated metabolites, the following may be involved in allelopathic interactions between macrophytes and cyanobacteria as recently reviewed by Zhu et al. [12] and Mohamed [7]: the phenylpropanoids p-coumarate, caffeic acid; the polyphenols vanillic acid and salicylic acid glucoside, luteolin 7-O-beta-D-diglucuronide; the flavonoid quercetin 3-galactoside; the triterpenoids saponines spinasaponin A, acutoside A, lucyoside M and saikosaponina A; the fatty acids 3-hydroxyoctanoic acid, coronaric acid, pinellic acid, conelenic acid and octyl docosanoate. Among them, caffeic acid has been recently described as highly active in the mg⋅l−1 range concentration on M. aeruginosa, leading to growth impairment, reactive oxygen species (ROS) production and modulation of various metabolic pathways [16, 61].
Further investigations are still needed to confirm those metabolite identities and their role in the potential impairment of metabolic pathways associated with primary and secondary metabolisms.
5. Conclusions and perspectives
To the best of our knowledge, this study is the first to reveal the anticyanobacterial effect of L. major extracts. This was observed at both physiological (photosynthesis) and molecular levels (metabolome). Despite uncertainties in the interpretation of the metabolomic response, our results highlighted the potential impairment of various metabolic pathways associated with the complex dose–response of multiple classes of putative metabolites.
The next steps will consist in (i) isolating and identifying active metabolites from L. major extracts through the implementation of a bio-fractionation strategy associated to a cutting-edge structural elucidation based on the combined use of LC-HRMS and RMN; (ii) confirming the biological activity of the pure compounds identified against M. aeruginosa metabolism, physiology, and growth; (iii) measuring their concentrations in the environment; (iv) characterizing such macrophyte-cyanobacteria interactions on the field to get insight about actual allelopathic interactions between the two species.
Conflicts of interest
The authors have no conflict of interest to declare.
Acknowledgments
Support from INRAE and Carnot Eau & Environnement is gratefully acknowledged. The authors thank G. Marty for providing the in-house MS2 library in the frame of MTH2.0 project (ANR 11-INBS-0010).
This work was carried out with the support (equipment and personnel) provided by the XPO scientific infrastructure (LIFE research infrastructure - Living in Freshwater and Estuaries, INRAE) of EABX research unit, and by the Bordeaux Metabolome scientific insfrastructure (MetaboHUB research infrastructure).
Vous devez vous connecter pour continuer.
S'authentifier