


 CC-BY 4.0
1. Introduction
In Ecology, the soil matrix is still considered as a “black box” regarding biochemical processes (e.g. root exudation, enzymatic activities) and ecological processes (e.g. species interactions, decomposition) occurring belowground [1, 2]. Living organisms within the soil compartment can reach impressive numbers with for example millions of bacteria, or hundreds of tiny microarthropods (i.e. arthropods under 2 mm like Collembola or Acari) in a handful of soil coming from the vicinity of plant roots (i.e. the rhizosphere). The expression of biological activities performed by these organisms and by the interactions between them generate a huge diversity of chemicals released in the soil [3, 4]. This is especially true for the plant roots or mycorrhiza associated to roots exudating chemicals (exudates) to the belowground compartment. Plants, through their roots, are known to exudate primary or secondary metabolites, either soluble or volatile, ranging from low (<1000 Da; e.g., organic acids, phenols, vitamins) to high molecular weight (e.g., glycomolecules, proteins, or nucleic acids) [5, 6, 7]. These compounds can generate interactive feedback loops between the roots and the other soil organisms that regulate numerous soil processes like aggregation of soil particles with soil nutrients, water availability, soil detoxification, structure and function of soil food web as well as nutrient cycling and thereby CO2 release by the soil [8, 9].
Different chromatographic methods were developed to analyze metabolites (metabolomics) presenting a large range of polarity. Ion chromatography (IC) was dedicated to the analysis of ionic or ionizable compounds. For volatile compounds, gas chromatography (GC) is the most used technique. Nevertheless, HPLC appeared to be the most suitable technique to analyze a large range of polarities. Moreover, coupling with mass spectrometry becomes very useful, due to the complexity of these matrices and the need for structural identification [7, 10, 11, 12].
Sensitivity and separation capacities of the analytical methods achieved in the last decade, enable a better screening of the diversity of the chemical signals released by plants or microbiome [13]. However, most of these studies focused on root exudates obtained from plants grown hydroponically or on gelose with a nutritive solution [14, 15, 16, 17, 18], meaning roots lacked living substrate as is the soil. On the other hand, several studies performed in microcosms tested how the presence of soil fauna may contribute to mineralization but mainly focused on analyzing C, N, or P content of the leachates [19, 20, 21, 22]. For example, those studies showed that presence of soil detritivores increases the amount of nitrate in the soil and the metabolic activities of soil microbes. However, how the presence of soil fauna in interaction with plant roots may modify the chemical signals of the soil, and not only the cycling of major elements, is still poorly documented. In the last decades however, development of chemical analyses like metabolomics for example [12] offers the opportunity to more accurately determine the soil signals in terms of molecules. Accessing chemical compounds in a real soil matrix with both the presence of roots and soil fauna is still a methodological challenge.
To overcome this issue, this study focused on the development of an original sample collection method of chemical signals and their analysis by UHPLC-HRMS. This is a fast analytical method combining analytical separation of compounds with high resolution mass spectrometry which enables molecular mass assessment with high precision. This method is well known to analyze compounds in complex matrices [23].
The signals obtained could help assess chemical signal modifications following biotic interactions belowground (a plant and a group of soil fauna). In this study we used Folsomia candida, a species belonging to Collembola, a dominant soil fauna group [24] known to regulate the growth and phenology of plants [25] in association with Poa annua, a common worldwide-distributed grass species [26, 27]. By adding or not individuals of F. candida in microcosms with plants, we wanted to test whether their presence would modify the chemical signals of the soil matrix.
2. Materials and methods
2.1. Experimental design and microcosm setup
To collect soil signals obtained by the interaction between plants and Collembola, an innovative plant microcosm was designed to sample soil leachates. First, a neutral material such as glass was required in order to avoid exogen pollution or degradation. Secondly, soil quantity had to be adapted to allow submersion by a solvent and its fast sampling to avoid release of degradation compounds and stress compounds in the presence of organic solvents. To meet these specifications, 20 homemade microcosms (Figure 1) were manufactured from classical borosilicate beakers (total volume 200 mL, diameter 6 cm, height 9.5 cm) equipped with PTFE stopcock purchased from VWR (Fontenay-sous-Bois, France).
Pictures of the microcosms of the respective four treatments.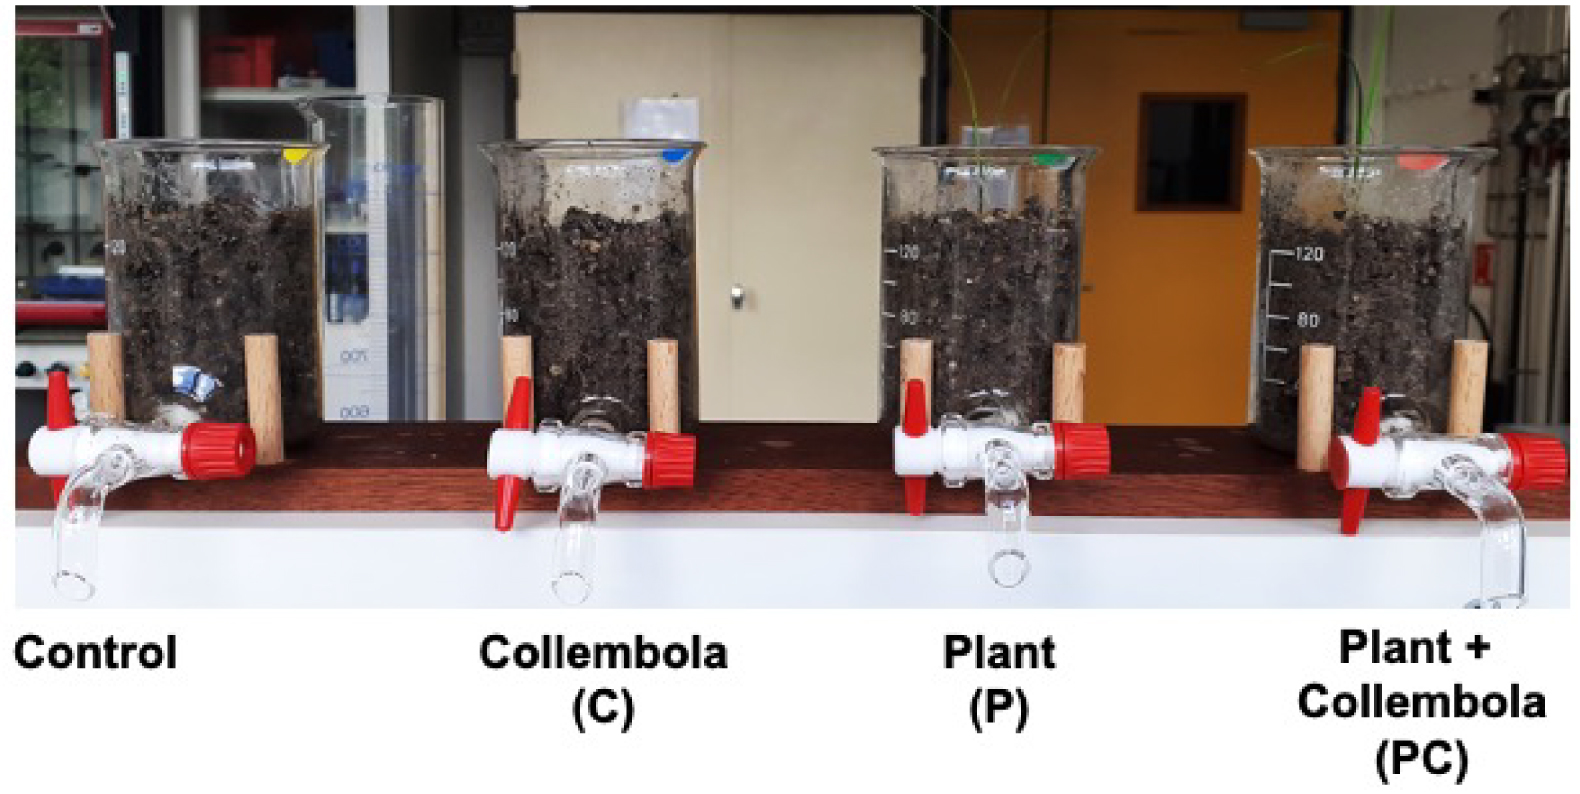
The experiment was set up in May 2020 with different treatments corresponding to two factors with two levels: presence or absence of a plant (Poa annua) and presence or absence of a collembolan species (Folsomia candida). The following treatments were established:
- Soil without plant and Collembola: “Control”
- Soil with plant but without Collembola: “P”
- Soil without plant but with Collembola: “C”
- Soil with plant and with Collembola: “PC”.
Each treatment was replicated 5 times in microcosms filled with soil (160 mL of soil) prior to the establishment of the treatment. The soil was a rendosol (Organic Matter content 6.17%; pH 7.79) collected from a chalk grassland in Normandy, France. A part of the soil was autoclaved with two cycles of 105 °C at 48 h intervals to eliminate the original fauna and microflora. This sterilized soil was used as a substrate for all microcosms. From the remaining part of the collected soil, microorganisms (fungi and bacteria) were extracted in a suspension by first stirring during 1 h 500 g of fresh sieved (2 mm) soil in 2 L of physiological water (0.85% NaCl), according to the protocol described by Eisenhauer et al. [28]. The suspension was then filtered through a filter paper (Whatmann N°5) purchased from VWR (Fontenay-sous-Bois, France) and a volume of 37 mL of microbial filtrate (i.e. microbial suspension) was inoculated into each of the 20 microcosms. In order to establish the microbial community, the microcosms were then incubated at a temperature of 25 °C for 10 days (D10). In parallel, seedlings of Poa annua (4 cm height) obtained from a single individual were transferred to half of the microcosms (one seedling per microcosm). A total of 20 individuals (only adults, based on animal size) of a typical Collembola, Folsomia candida, reared in the laboratory, was introduced in each of the 5 microcosms of the treatments C and PC. All the microcosms were then incubated in a climate chamber (temperature: 20 °C, daily light/dark 16 h/8 h) with soil moisture maintained at 60% of the soil water holding capacity during the experiment. The experiment was stopped after 4 weeks (D38).
2.2. Sample collection and preparation
To collect soil chemical signals/metabolites, a volume of 100 mL of a methanol/ultrapure water (75/25, v/v) mixture was introduced on the top of each microcosm. Methanol was purchased from Carlo Erba (Val de Reuil, France) and ultrapure water was obtained from a Milli-Q water purification system from Millipore Ltd. (Bedford, MA, USA). The solution was percolated through the microcosm in less than 3 min and then, was collected using the stopcock. Around 80 mL were thus obtained from each microcosm. The sampled solution was then evaporated and concentrated to 20 mL using a SP Genevac EZ-2 Envi (Genevac Ltd, Ipswich, UK) prior to UHPLC-HRMS analyses.
2.3. UHPLC-HRMS method
The metabolite profiles were acquired on a UHPLC instrument (Dionex Ultimate 3000, Thermo Scientific, Waltham, MA, USA) equipped with a RS pump (© RS Components Ltd), an autosampler, and a thermostatically controlled column oven, and coupled to a Photodiode Array Detector (PDA), as well as an accurate quadrupole Time of Flight (qToF) mass spectrometer equipped with an Electrospray Ionisation (ESI) source (Impact II, Bruker Daltonics®, Billerica, MA, USA). The separation was carried out using a Luna® Omega Polar C18 column (2.1 × 100 mm, 1.6 μm, Phenomenex, Torrance, CA, USA). Gradient elution was performed using ultrapure water (Cogolin reagent FMP, Fluka) (A) and acetonitrile (Cogolin reagent FMP) (B), both acidified with 0.1% formic acid as follows: 5% B during 2 min, then 40% B for 6 min followed by a 4-min linear gradient up to 100%, and finally 2 min at 100% in isocratic mode. The analysis was followed by a 4-min equilibration time in initial conditions for the next round of analysis. Flow rate was 0.5 mL/min, temperature 40 °C, injection volume 2 μL. Blank injections correspond to injection of pure methanol.
MS detection was performed in negative and positive ionization modes. MS parameters were set as follows: nebulizer gas N2 at 3.5 bar, N2 dry gas at 12 L⋅min−1, capillary temperature at 200 °C, and voltage at 3000 V in negative mode and at −2500 V in positive mode. Analyses were recorded at an acquisition frequency of 4 Hz, and the mass range was set from m∕z 50 to 1200 uma. Mass spectrometer calibration was performed systematically with a mixture of formate and acetate solution composed of 25 mL of ultrapure water, 25 mL of propan-2-ol (Sigma Aldrich, Darmstadt, Germany), 0.5 mL of NaOH, 25 μL of formic acid, and 75 μL of acetic acid. The MS-based metabolomic data were calibrated automatically by internal calibration with a solution of formate and acetate before exporting the data to netCDF files (acquired in centroid mode) using Bruker Compass DataAnalysis 4.3 software.
2.4. Data analysis
All the converted analyses were processed by the XCMS software [29] under R software version 3.5.1, following steps to generate the final data matrix: (1) peak picking (peakwidth = c (2.20) ppm = 2) without threshold prefilter; (2) correction of retention time (method = obiwarp), (3) grouping (bw = 10, minfrac = 0.3, minsamp = 1), (4) fill peaks, and (5) report and generate the data matrix transferred to Excel software. To remove technical variability, the matrix was then filtered according to blanks and pools of three following steps using in-house R scripts: (1) filtering the matrix using the Signal/Noise (S/N) ratio in order to remove peaks observed in blanks (S/N set at 10), (2) filtering the matrix using the peaks coefficient of variation in order to remove peaks with variable intensities in the pooled samples (threshold at 0.3), (3) filtering the matrix according to autocorrelation between the peaks.
To focus on chemical signals resulting from plants, either alone (P) or in combination with Collembola (PC), signals of the Control treatment (i.e. soil) were subtracted from both Plant (P) and Plant and Collembola (PC) treatments. Then signals from the C treatment were subtracted from PC. Orthogonal partial least squares discriminant analysis (oPLS-DA) was performed on both resulting P and PC matrices to determine whether a discrimination of plant-released-compounds was possible based on the presence or absence of Collembola. Furthermore, a Permanova test was used on both reshaped P and PC matrices to test for statistical differences between chemicals obtained.
3. Results and discussion
Combining both negative (ESI−) and positive ionisations (ESI+), a total of 478 ions were detected. A mixture of equal volumes of P, C, PC, and Control extracts called “Pooled sample” was injected to evaluate if leachate compounds could be detected and was compared to the blank injection. The resulting Base Peak Chromatograms (BPC) can be divided into three parts (Figure 2).
Base Peak Chromatograms (BPC) obtained for blank (red dotted lines) and pooled sample (blue dotted lines). (a) ESI−; (b) ESI+.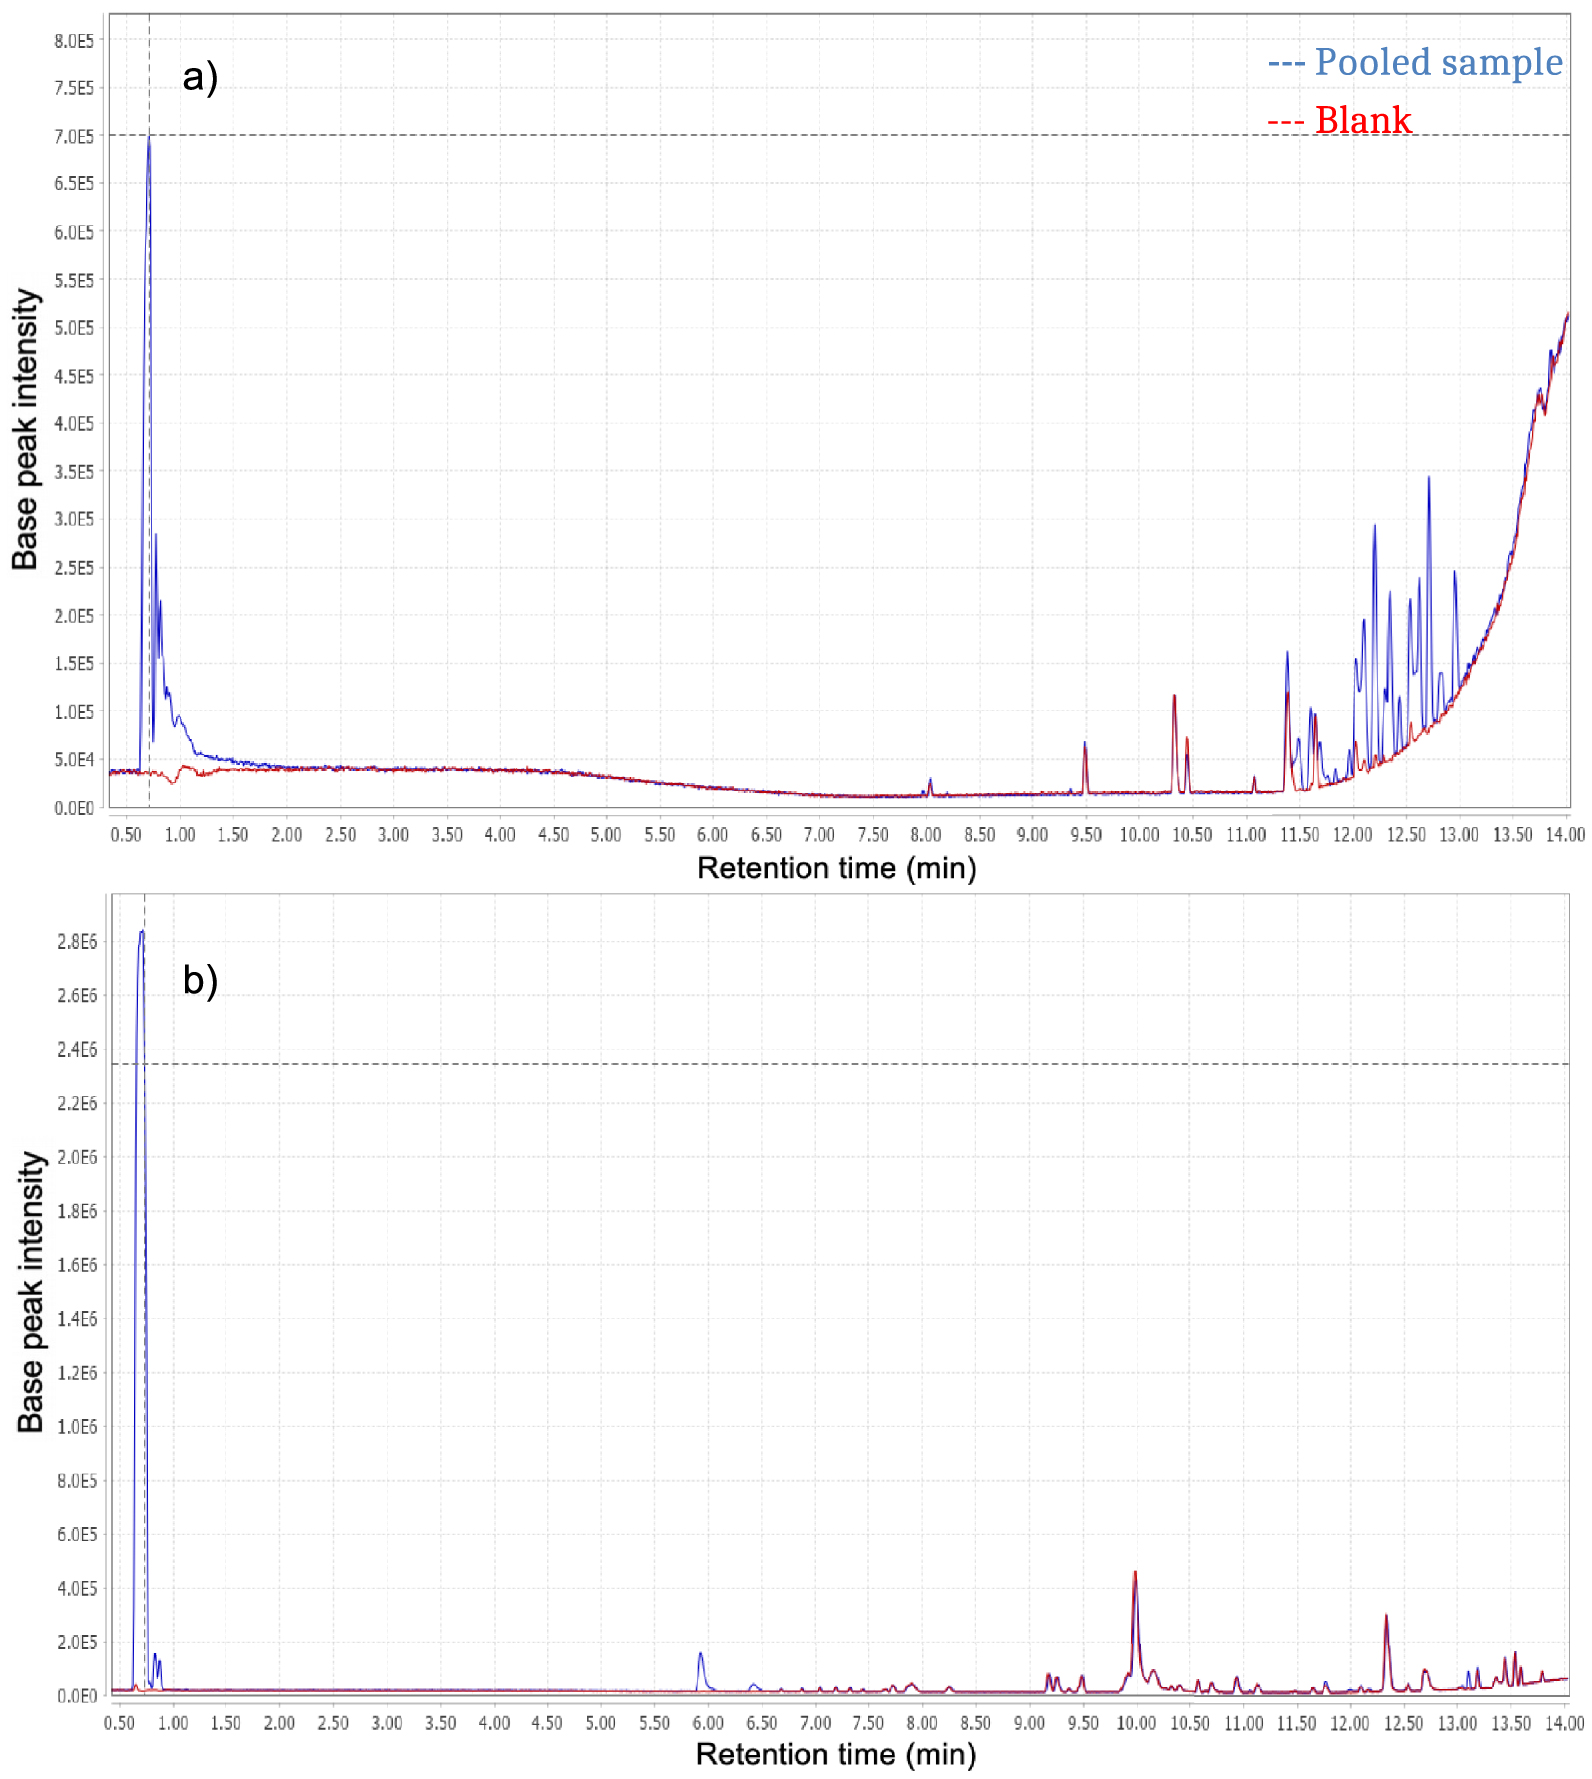
The first part with retention times between 0–5 min, corresponds to polar entities, whereas the second and third parts, from 5–10 min and 10–15 min, respectively, refer to compounds with average and low polarities. Ions produced in the source in negative mode result from compounds with acidic properties and conversely, compounds with basic properties are ionized in positive mode. There are some differences regarding the retention time distribution between the three parts of chromatograms. There is also inequality between chromatograms resulting from each ionization mode. Indeed, negative ionization seems to be more specific than positive ionization, as most compounds detected with positive ionization mode were also found in the blank injection.
The first part of the chromatograms shows an elution band corresponding to non-retained compounds, the most polar ones presenting no retention by the stationary phase. ESI+ chromatograms show more than twice the intensity observed in ESI− chromatograms. This is not surprising because the mobile phase used for the analyses is acidified. The second part (retention time T of 5–10 min) of the ESI− chromatogram shows no specific compounds whereas the ESI+ one does, corresponding to compounds with average polarities. Comparison with the last chromatogram part indicates the presence of compounds with low polarity, especially in ESI− mode.
According to the oPLS-DA, the two different treatments, plant alone or with Collembola (P versus PC), seem to be well distinguished according to high values of both R2Y and Q2 (Figure 3), meaning that treatments induce different chemical signals. Furthermore, both treatments were strongly different according to a Permanova test (PC versus P; F = 2.33; p = 0.0084). Folsomia candida seems to affect chemical signals released in the soil following plant roots–Collembola interactions. We cannot exclude that Folsomia candida, the Collembola species used in our experiment, may have fed upon roots during the experiment. Collembola in general are known to switch diet and may behave like herbivores in presence of plant roots [30], surely modifying chemicals released from plant roots. For example, root herbivory was shown to influence soil nutrients [31, 32]. On the other hand, we can neither exclude that interactions between Poa annua and F. candida might also take place through indirect pathways, through changes in microbial communities composition and structure as already shown [33].
oPLS-DA analysis results performed on two sets of ions, one referring to metabolites found in Plant treatment (P) and the second one in Plant + Collembola treatment (PC). R2X and R2Y represent the fraction of the variance of the x and y variable explained by the model, while Q2 suggests the predictive performance of the model. R2X, R2Y, and Q2 vary between 0 and 1.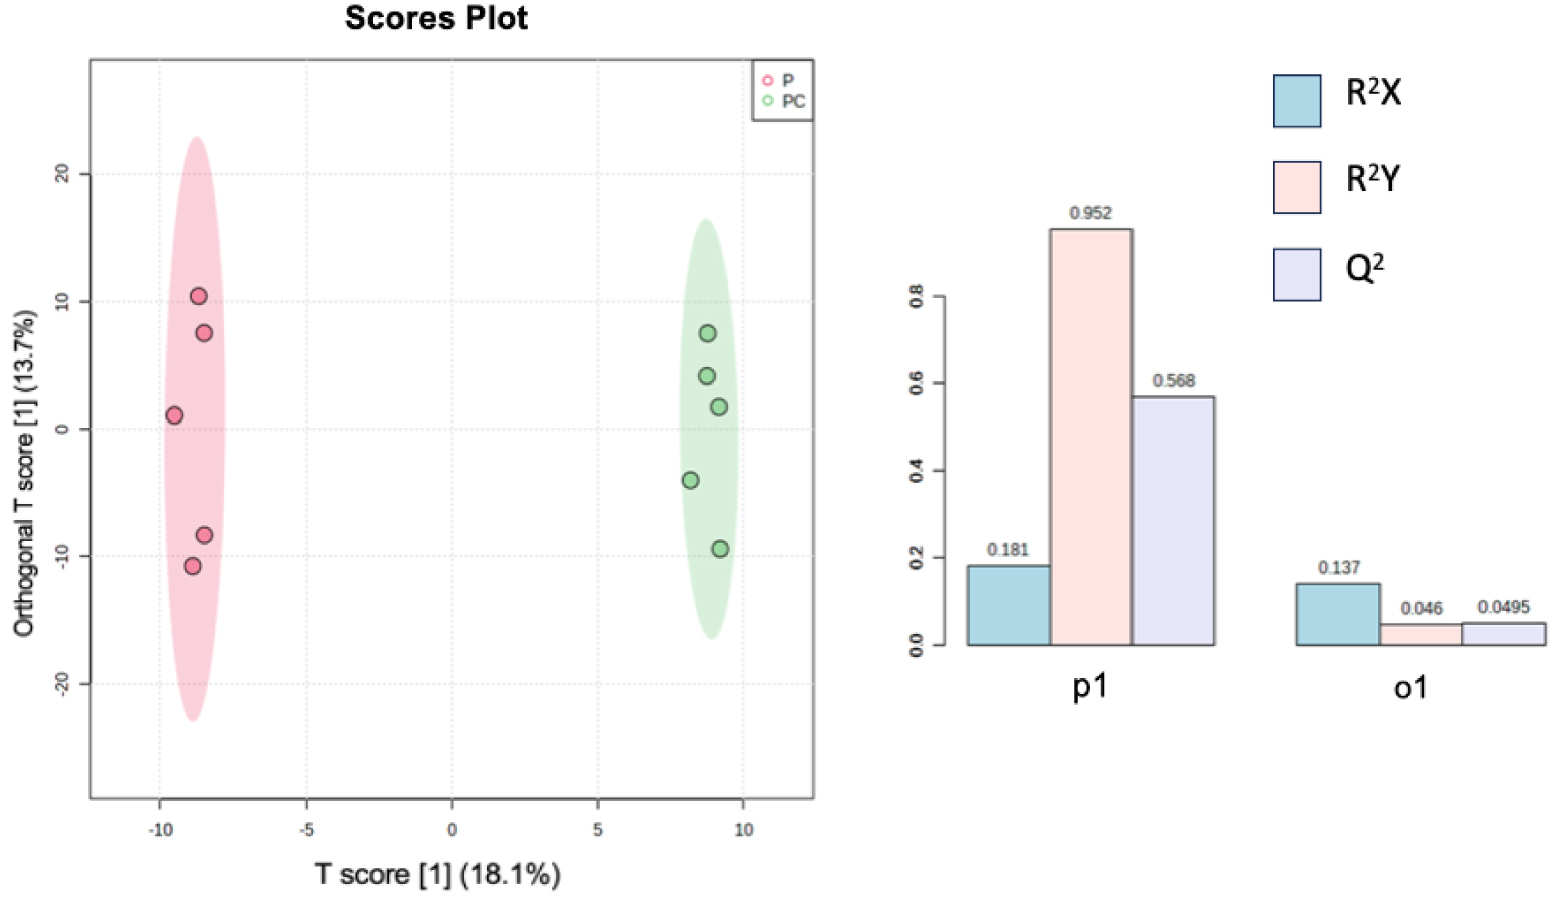
A variable importance in projection (VIP) score plot is also presented in Figure 4. This plot selects the ions which explain most differences between treatments. In ordinate are presented these ions with the following nomenclature: M for mass, followed by the corresponding m∕z ratio followed by the retention time (T) in seconds. Thus, most of the ions with the highest VIP scores were eluted in the dead time, which means that most of the ions explaining differences between microcosms are very polar entities.
VIP score plot resulting from the oPLS-DA performed on two treatments, P (Plant) and PC (Plant + Collembola). This plot shows the 30 most important VIP scores.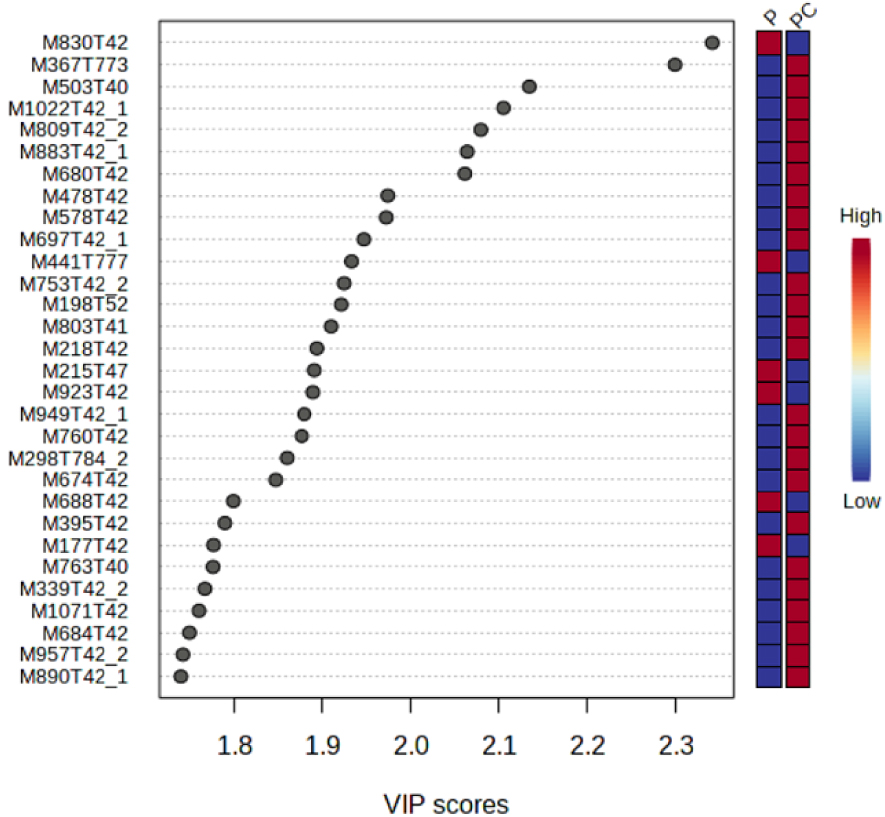
These ions have higher intensities in PC treatment than in P treatment. Among the 30 top VIP score values, only three ions, with m∕z 830, m∕z 773 and m∕z 784, respectively, were eluted in the third part of the chromatogram. Only 6 out of the top 30 VIP ions exhibited a higher intensity in P treatment than in PC treatment. Relating the presence of Collembola to the lower intensity of these ions is not easy but several hypotheses could be proposed: first, Collembola can directly metabolized these ions for example by absorbing them through their ventral tubes [34]. Secondly, F. candida can indirectly impact the ions by regulating the microbial community structure and functions as discussed previously [33, 35]. Finally, the presence of Collembola can also modify the plant gene expression (RNA) and then the nature and intensity of metabolites exuded by the roots [36, 37, 38]. In the same manner, the 24 ions showing higher intensities in PC treatment than in P treatment could be attributed to supplementary ions directly provided by the presence of fauna through trophic interactions with the roots for example [30], or indirectly through modified soil microbial communities or root exudates [33, 35].
4. Conclusion
In this work, the experimental design developed as support for growing plants, microcosms made with beakers equipped with stopcock, facilitates the sampling and analysis of soil chemical compounds. Indeed, different treatments were studied and differences in chemical signals were detected. Such a method offers opportunities to explore chemical signals induced by plant root–soil organism interactions in complex soil matrices and also allows control of other parameters such as for example soil properties and climatic variables. Further investigations will be performed to identify metabolites collected.
Declaration of interests
The authors do not work for, advise, own shares in, or receive funds from any organization that could benefit from this article, and have declared no affiliations other than their research organizations.
Acknowledgments
The authors would like to thank Matthieu Normand and Evelyne Blanchard, Ecodiv Lab, Université de Rouen, for their technical assistance. We are grateful to Charles Lanel, glass-blower at the Université de Rouen, for designing and manufacturing the microcosms. Also, authors would like to thank Stéphane Greff and the joint metabolomics service (plateforme Mallabar) at IMBE (Aix-Marseille Université), for their welcome and help.