


 CC-BY 4.0
1. Introduction
Lanthanide complexes coordinated to organic ligands have attracted significant attention in many different fields due to the special optical, electronic, and magnetic properties of the lanthanide ions. These lanthanide-containing complexes exhibit various applications ranging from luminescent thermometers [1, 2, 3, 4], and MRI contrast agents [5, 6, 7] for medical imaging to quantum information processing [8, 9, 10, 11, 12, 13, 14], and single molecule magnets (SMMs) [15, 16, 17, 18, 19]. Understanding the electronic structure in lanthanide complexes is important for optimising their performance and designing new functional materials [20]. Lanthanide-containing complexes that can be modified with various chemical groups to tune their properties or give new features, such as functionalisation for deposition on different surfaces or solubility in diverse media, offer promising prospects. It is still challenging to synthesise lanthanide complexes where the first coordination sphere remains constant upon post-derivatisation.
Recently, we studied the magnetic properties of a new family of trigonal lanthanide complexes LnL (H3L = tris(((3-formyl-5-methylsalicylidene)amine)ethyl)amine) with Ln ranging from Gd to Lu [21]. These complexes have three pendant carbonyl groups that are non-coordinating to the lanthanide ion. Therefore, these carbonyl groups can be used to react with primary amines via a Schiff-base reaction to form imines. This post-derivatisation conserves the number and nature of atoms in the first coordination sphere. We have previously performed studies focusing on the derivatisation of YbL, for example by reacting YbL with benzylamine to obtain complexes suitable for deposition on graphene [21], or by reacting YbL with 1-octadecylamine to form new complexes [22] that have potential in making lanthanide-containing micelles [23, 24, 25, 26, 27, 28] and Langmuir–Blodgett film [29, 30, 31, 32].
Herein, we present the synthesis and characterisation of a novel series of lanthanide complexes LnL18 (H3L18 = tris(((3-(1-octadecylimine)-5-methylsalicylidene)amine)ethyl)amine) with Ln = Tb–Tm and Y. We investigate the crystal field splitting of LnL18 by luminescence measurements and the static magnetic properties by SQUID magnetometry. Additionally, the dynamic magnetic properties were examined through alternating current SQUID magnetometry. The results were compared to YbL18 and (Tb–Tm)L to get an understanding of the impact of the post-derivatisation on the electronic and magnetic properties of the Ln ions.
2. Experimental
2.1. Materials and physical measurements
All solvents and chemicals used for the syntheses of the complexes herein were purchased from commercial sources and used as received. All syntheses were made without any attempt to exclude moisture or oxygen. No attempt was made to dry any of the solvents used. The Ln(OTf)3⋅xH2O salts, 2,6-diformyl-p-cresol (dfmp) and LnL were prepared as described in literature [21].
Positive-ion mode MALDI mass spectrometry was performed on a Bruker Solarix XR 7T ESI/MALDI FT-ICR MS instrument at the Department of Chemistry, University of Copenhagen. Infrared (IR) spectra were measured on an Agilent Technologies Cary 630 FTIR spectrometer. Powder X-ray diffraction (PXRD) was recorded on a BRUKER D8 ADVANCE powder diffractometer using a Cu Kα radiation (λ = 1.5418 Å) source. 1H NMR was obtained using a Bruker 500 MHz instrument equipped with a cryoprobe. For 1H NMR, calibration was done against solvent signals from the deuterated solvent. Elemental (C, H, and N) analyses were performed on a FlashEA 1112 instrument at The Microanalytical Laboratory at the Department of Chemistry, University of Copenhagen. Direct current (d.c.) and alternating current (a.c.) magnetic susceptibility measurements were recorded using a Quantum-Design MPMS-XL SQUID magnetometer. The measurements were done on polycrystalline samples immobilised in a small amount of n-hexadecane to avoid orientation of the sample in the magnetic field. The magnetic susceptibility measurements were corrected for the diamagnetism of n-hexadecane (186 × 10−6 cm3∕mol) [33] and of the sample using the approximation (Msample∕2) × 10−6 cm3∕mol [34]. Luminescence spectra of polycrystalline samples of TbL18, HoL18 and ErL18 were obtaining from a Horiba-Jobin Yvon Fluorolog fluorimeter equipped with an InGaAs near-infrared (NIR) detector and a photomultiplier detector for the UV/Vis range. Additionally, an Oxford Instruments cryostat was used for the cryogenic measurements. UV/Vis absorption spectroscopy was measured on a Lambda 2 UV/Vis spectrometer manufactured by Perkin Elmer. The measurement was performed with a scan rate of 120 nm/min and with a background correction to the pure solvent.
2.2. Synthesis of LnL18 (H3L18 = Tris(((3-(1-octadecylimine)-5-methylsalicylidene)amine)ethyl)amine))
TbL18. TbL (0.052 g; 0.070 mmol) and 1-octadecylamine (0.189 g; 0.70 mmol) were dissolved in a MeOH:CHCl3 1:1 mixture (20 ml). The mixture was boiled until it became clear. Then the solution was kept at 50 °C until a yellow precipitate formed. The solution was left to slowly cool down to room temperature. The precipitate was washed with MeCN and diethyl ether.
Yield: 0.076 g (86%). Anal. Calcd for C87H144N7O3Tb: C, 69.89; H, 9.71; N: 6.56. Found: C, 69.86; H, 9.82; N: 6.58. MALDI mass spectrum: 1496.07 m/z [TbL18H]+ (Figure S2). IR ν(C–H): 2917 cm−1, 2849 cm−1, νC=N: 1634 cm−1, 1619 cm−1 (Figure S8).
The remaining LnL18 complexes (Ln = Dy–Tm) and YL18 were synthesised analogously to TbL18.
DyL18. Yield: 0.071 g (73%). Anal. Calcd for C87H144N7O3Dy: C, 69.73; H, 9.69; N: 6.54. Found: C, 69.59; H, 9.76; N: 6.58. MALDI mass spectrum: 1499.07 m/z [DyL18H]+ (Figure S3). IR ν(C–H):2918 cm−1, 2850 cm−1, 𝜈(C=N): 1633 cm−1, 1619 cm−1 (Figure S9).
HoL18. Yield: 0.055 g (62%). Anal. Calcd for C87H144N7O3Ho: C, 69.61; H, 9.67; N: 6.53. Found: C, 69.12; H, 9.68; N: 6.59. MALDI mass spectrum: 1502.08 m/z [HoL18H]+ (Figure S4). IR ν(C–H): 2919 cm−1, 2851 cm−1, 𝜈(C=N): 1634 cm−1, 1619 cm−1 (Figure S10).
ErL18. Yield: 0.069 g (80%). Anal. Calcd for C87H144N7O3Er: C, 69.51; H, 9.65; N: 6.52. Found: C, 69.04; H, 9.76; N: 6.88. MALDI mass spectrum: 1504.08 m/z [ErL18H]+ (Figure S5). IR ν(C–H): 2919 cm−1, 2851 cm−1, 𝜈(C=N): 1634 cm−1, 1619 cm−1 (Figure S11).
TmL18. Yield: 0.064 g (73%). Anal. Calcd for C87H144N7O3Tm: C, 69.43; H, 9.64; N: 6.51. Found: C, 68.05; H, 9.45; N: 6.52. MALDI mass spectrum: 1506.08 m/z [TmL18H]+ (Figure S6). IR ν(C–H): 2918 cm−1, 2850 cm−1, 𝜈(C=N): 1634 cm−1, 1620 cm−1 (Figure S12).
YL18. Yield: 0.05 g (56%). Anal. Calcd for C87H144N7O3Y: C, 73.33; H, 10.19; N: 6.88. Found: C, 72.81; H, 10.29; N: 6.73. MALDI mass spectrum: 1426.03 m/z [YL18H]+ (Figure S7). IR ν(C–H): 2916 cm−1, 2850 cm−1, 𝜈(C=N): 1634 cm−1, 1620 cm−1 (Figure S13) 1H NMR (500 MHz, CDCl3) 𝛿/ppm 8.23 (s, 3 H), 8.17(s, 3 H), 7.76 (s, 3 H), 7.01 (s, 3 H), 4.30 (t, 3 H, J = 13.3 Hz), 3.40 (d, 3 H, J = 14.1 Hz), 3.15 (m, 6 H), 3.09 (m, 3 H), 2.84 (d, 3 H, J = 12.7 Hz), 2.21 (s, 9 H), 1.26 (m, 96 H), 0.88 (t, 9 H, J = 6.9 Hz) (Figure S1).
The complexes diluted in a diamagnetic host (Gd@YL18, Dy@YL18 and Er@LuL18) were synthesised analogously to TbL18, but using a 5:95 mixture of either GdL, DyL or ErL and YL or LuL as the diamagnetic host.
Gd@YL18 at 5% dilution. Yield: 0.09 g (62%). Calcd for C87H144N7O3Y0.95Gd0.05: C, 73.33; H, 10.19; N, 6.88. Found: C, 72.05; H, 10.13; N, 6.73. The PXRD was checked for phase purity of the sample (Figure S22). IR ν(C–H): 2917 cm−1, 2850 cm−1, 𝜈(C=N): 1633 cm−1, 1619 cm−1 (Figure S15).
Dy@YL18 at 5% dilution. Yield: 0.07 g (47%). Calcd for C87H144N7O3Y0.95Dy0.05: C, 73.33; H, 10.19; N, 6.88. Found: C, 72.23; H, 10.14; N, 6.51. The PXRD was checked for phase purity of the sample (Figure S22). IR ν(C–H): 2916 cm−1, 2850 cm−1, 𝜈(C=N): 1633 cm−1, 1619 cm−1 (Figure S16).
Er@LuL18 at 5% dilution. Yield: 0.07 g (51%). Calcd for C87H144N7O3Lu0.95Er0.05: C, 69.15; H, 9.61; N, 6.49. Found: C, 68.81; H, 9.64; N, 6.39. The PXRD was checked for phase purity of the sample (Figure S22). IR ν(C–H): 2917 cm−1, 2850 cm−1, 𝜈(C=N): 1634 cm−1, 1620 cm−1 (Figure S17).
2.3. Crystal structure determination
Crystals suitable for single-crystal X-ray diffraction were obtained in different manners for the complexes depending on the metal ion. For TbL18 and DyL18, single crystals were obtained through slow evaporation of a MeCN:chloroform 1:1 solution. For HoL18, single crystals were obtained by dissolving the complex in chloroform and then adding the solution to acetone (approximately five times the volume). Upon evaporation of the solvents, single crystals of HoL18 formed.
Single-crystal X-ray diffraction on single crystals of TbL18, DyL18, and HoL18 was performed at 100 K using a Bruker D8 VENTURE diffractometer equipped with a Mo Kα high-brilliance I μS S3 radiation source (𝜆 = 0.71073 Å), a PHOTON 100 CMOS detector, and an Oxford Cryosystems cooling system. Data reduction was performed using SAINT, and the absorption corrections was handled by SADABS using the multi-scan method. The structures were recorded using APEX3 and solved by SHELXT [35, 36] using intrinsic phasing and refined using SHELXL [37] (Least Squares). Visualisation of the crystallographic data during the refinement was obtained using the OLEX2 program package [38, 39]. All atoms were refined anisotropically except for hydrogen. Hydrogen atoms were placed at calculated positions in OLEX2 using the “Add H” command. In the structure of TbL18, additional electron density was found next to the molecule. This electron density could not be modelled as solvent and a solvent mask (SQUEEZE) in OLEX2 was thus used. The electron density amounted to 9 electrons which could stem from a disordered water molecule.
3. Results and discussion
3.1. Synthesis and characterisation
The complexes LnL18 (Ln = Tb–Tm, Y) were synthesised using a one-pot Schiff-base reaction between the corresponding LnL complex and 1-octadecylamine (Scheme 1). In order to ensure that all aldehyde groups of the complex were transformed to 1-octadecylimine groups, a 1:10 ratio between LnL and 1-octadecylamine was used. MALDI mass spectra show signals from all [LnL18H]+, confirming that the complexes have been formed (Figure S2–S7). The isotope pattern of each complex matches with the experimental spectrum further strengthening that the observed signals come from the intended product. IR spectra of the LnL18 complexes show no trace of the aldehyde stretch (1668–1669 cm−1) found in the parent complex LnL (Figure S8–S14) confirming the complete reaction of all aldehyde groups with 1-octadecylamine. Additionally, the C–H stretches between 2850–2919 cm−1 for LnL18 are much more intense than those for LnL (Figure S14), as anticipated from the larger amount of C–H units in LnL18 compared to LnL.

Schiff-base reaction forming the LnL18 complexes.
The polycrystalline samples of LnL18 (Ln = Tb–Tm, Y) are phase-pure and of the same structure as the one determined for the LnL18 single crystals (vide infra). This is confirmed by a PXRD simulation from a single crystal studied by X-ray diffraction at room temperature (Figure S21).
In LnL18 all Ln(III) ions except for Y(III) are paramagnetic. The paramagnetism of these ions complicates the recording of NMR spectra and hence only 1H NMR on YL18 has been performed. The 1H NMR spectrum of YL18 shows the expected signals and integrals of these signals (Figure S1). As anticipated by the structure of the complexes, most of the protons in the octadecyl chains have almost identical chemical shifts with only the two protons next to the imine group and the protons on the terminal methyl group of each chain showing markedly different chemical shifts than the rest of the chain. The NMR spectrum shows no signs of the starting materials confirming that the complexes are formed purely as also indicated by the above analyses.
The CHN elemental analyses also agree with the expected values for the LnL18 complexes indicating that the complexes have been obtained pure.
The complexes containing the larger Ln ions (La(III), Pr(III), Nd(III), Sm(III), Eu(III) and Gd(III)) were also synthesised following a similar procedure as for (Tb–Tm, Y)L18. However, the PXRD revealed that they were difficult to get phase-pure or in the same phase as the complexes containing the smaller Ln ions (Tb–Tm, Y)L18. This was also seen for (La–Eu)L and is likely the result of solvent coordination to the Ln ion. It is common that the greater size of the early Ln ions leads to higher coordination numbers through solvent coordination [40]. By doping GdL18 into the YL18 diamagnetic host it was possible to obtain GdL18 in the same phase as the complexes LnL18 (Ln = Tb–Tm, Y, Figure S22).
Last, it should be mentioned that introduction of long aliphatic chains makes the post-derivatised LnL18 much more soluble in organic solvents than their parent complexes. Hence, these complexes are readily soluble in, for example chloroform and dichloromethane, but remain insoluble in alkanes.
3.2. Crystal structure
Single crystals large enough for single-crystal X-ray diffraction were obtained for TbL18, DyL18 and HoL18. The complexes crystallise in the triclinic space group P

Solid state structure (upper left) and unit cell (upper right) of TbL18. Colour code: Tb, green; N, blue; O, red; C, grey. All hydrogen atoms have been omitted for clarity. Thermal ellipsoids are set to 50% probability. Structural overlay of the solid state structures of TbL18 (blue) and TbL (red) viewed from the side (bottom).
As in YbL18, the newly formed imine groups point away from the Ln ion and are therefore non-coordinating.
The post-derivatisation of LnL with 1-octadecylamine leads to small structural changes to the first coordination sphere of the complexes. For instance Tb–Nimine in TbL18 is on average 2.474(17) Å compared to 2.490(1) Å in TbL, and Tb–Napical in TbL18 is 2.6346(17) Å compared to 2.647(2) Å in TbL. The other bond lengths also remain very similar to the parent complexes, as do the bond angles (Table 1). Still the bond angles do vary more than the bond lengths as is clearly visible when the two structures are overlaid (Figure 1).
Average bond lengths and angles in TbL18, TbL, DyL18, DyL, HoL18, HoL, and YbL18
| TbL18 | TbL | DyL18 | DyL | HoL18 | HoL | YbL18 | |
|---|---|---|---|---|---|---|---|
| Bond length (Å) | |||||||
| Ln–O | 2.200(1) | 2.208(1) | 2.192(2) | 2.196(2) | 2.184(2) | 2.191(2) | 2.156(1) |
| Ln–Nimine | 2.474(2) | 2.490(1) | 2.462(1) | 2.473(2) | 2.453(1) | 2.462(2) | 2.418(2) |
| Ln–Napical | 2.635(2) | 2.647(2) | 2.631(2) | 2.628(3) | 2.631(2) | 2.626(3) | 2.612(2) |
| Bond angle (°) | |||||||
| ∠ Nimines | 57.26(4)–61.44(4) | 60 | 57.35(5)–61.44(5) | 60 | 57.48(5)–61.40(5) | 60 | 57.62(5)–61.34(5) |
| ∠ Ophenoxides | 59.22(4)–60.5(4) | 60 | 59.19(5)–61.07(5) | 60 | 59.07(5)–61.02(5) | 60 | 59.15(5)–61.11(3) |
Although the trigonal symmetry of the complexes is lost upon post-derivatisation, the first coordination sphere around the Ln centre remains approximately trigonal. The Ln–O bond varies between 2.195(1)–2.203(1) Å for TbL18, 2.187(2)–2.199(2) Å for DyL18, and 2.179(2)–2.192(2) for HoL18, while Ln–Nimine bond varies between 2.468(2)–2.479(2) Å for TbL18, 2.461(2)–2.462(2) Å for DyL18, and 2.453(2)–2.454(2) for HoL18 (Table S3). Additionally, the three angles in the triangle defined by the three phenoxides remain close to the expected 60° for trigonal symmetry, while the angles involving the three coordinating imines deviate more (Table 1).
Moving from TbL18 to HoL18, a slight contraction in the bond lengths between the Ln ion and the ligand is observed (Tables 1 and S3). This is to be expected as the Ln(III) ions shrink in size through the series. The contraction in the bond lengths is even more visible when comparing the aforementioned complexes to YbL18. As the bond lengths shrink, the previously mentioned angles between the coordinating imine groups come closer to 60°, and the complexes thereby become closer to trigonal with smaller Ln ions.
Like for the previously studied YbL18 [22], the differences in the first coordination sphere between the post-derivatised LnL18 and their parent LnL remain minor. The biggest difference between the post-derivatised complexes LnL18 and their parent complexes LnL is seen in the length of the complexes and the distances to neighbouring Ln centres. The addition of the three octadecyl chains extends the longest distance within one complex (r1) from 13.2 Å to 32.8 Å (Figures S24 and S28). Consequently, the distance between two Ln(III) ions within a unit cell (r2) also increases from 7.8 Å to 30.0 Å (Figures S24 and S29). Because the aliphatic chains stack inside a unit cell (Figure 1), r2 gets elongated quite significantly; however, the distances to the nearest neighbours or the next nearest neighbours remain very similar between LnL18 and LnL (Table S2 and Figures S25–S26 and S30–S31).
3.3. Influence of the post-derivatisation on the crystal field splitting
In an effort to understand the influence of the octadecyl chains on the electronic structure of the ground multiplets of TbL18–TmL18, the complexes were studied using variable-temperature-variable-field (VTVB) measurements, luminescence spectroscopy and d.c. magnetic susceptibility measurements, and compared to those of their parent complexes.
3.3.1. Luminescence spectroscopy
Luminescence spectroscopy was measured on polycrystalline samples of TbL18, HoL18, and ErL18 as well as TbL, HoL, and ErL (Figure 2). To eliminate possible hot bands and decrease the bandwidth, the measurements were carried out at low temperature (4 K). All the compounds share an intense absorption around 400 nm from the phenyl rings as seen in the UV/Vis absorption spectrum (Figure S66). All the luminescence spectra were measured by exciting the ligand in this absorption region (400–425 nm). Following absorption by the ligand, energy is then transfered to the lanthanide. The excitation wavelength was adjusted to avoid higher order diffractions from the excitation monochromator in the emission spectrum.
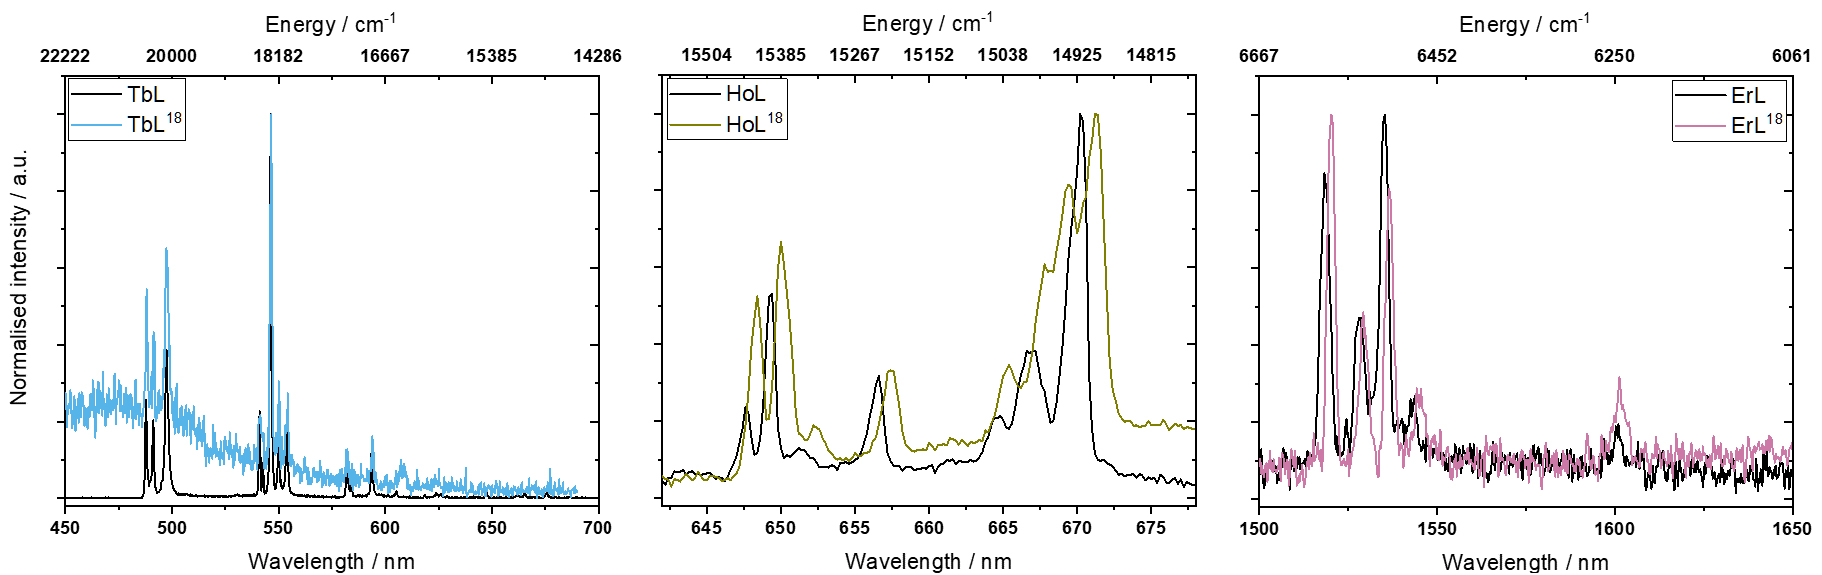
Luminescence spectra of: TbL18 and TbL (left) measured at 4 K, with excitation at 400 nm; HoL18 and HoL (middle) measured at 4 K, with excitation at 400 nm; ErL18 and ErL (right) measured at 4 K, with excitation at 425 nm.
The emission spectra of LnL18 and of the parent complex LnL are very similar, as expected from the close structural resemblance of the first coordination spheres (Figure 2). For TbL18 the signal to noise ratio is much lower than seen for the parent complex TbL. We suspect this to be due to the additional Schiff-base of the post-functionalisation which could lead to a fast quenching of the emitting 5D4 state of Tb due to the very large amount of additional high-energy C–H stretches being introduced, which is clearly seen from IR spectroscopy (Figure S8).
The number of observed bands is very similar between TbL18 and TbL, HoL18 and HoL, and ErL18 and ErL. TbL18 and TbL have 10 and 11 observable bands, respectively, while HoL18 and HoL have 8 and 7, respectively, and ErL18 and ErL have both 5 bands. In the case of the Ho and Er complexes, the bands stem from the 5F5→5I8 and 4I13∕2→4I15∕2 transitions, respectively. Thus, these luminescence spectra only give information about the splitting of the ground multiplet. For the Tb complexes the situation is different with luminescence transitions observed for 5D4→7F6, 5D4→7F5 and 5D4→7F4. Here the 3 observed bands between 480–500 nm (5D4→7F6) provide information on the ground multiplet splitting. The available experimental data (Figure 2 and Table S9) do not allow to unambiguously assign the observed bands as of electronic or vibrational origin. Therefore, for the sake of simplicity, we assume for all complexes that all the observed transitions are of electronic origin. In each spectrum, the highest energy band is assigned as the zero-phonon line; these are at 20492 cm−1, 15423 cm−1, 6578 cm−1 for TbL18, HoL18, and ErL18, respectively, and 20500 cm−1, 15442 cm−1 and 6587 cm−1 for TbL, HoL and ErL, respectively. The energies of the various ground term sublevels can be found in Table 2. We note there are fewer emission bands observed in the luminescence spectra of LnL18 and LnL than what is expected based on the number of energy levels in the ground multiplet. The remaining energy levels may be hidden in the linewidth of the peaks. For instance, the three bands originating from 5D4→7F6 in TbL have linewidths of 91–186 cm−1.
The observed energies (cm−1) of the ground term sublevels of TbL18, TbL; HoL18, HoL; and ErL18, ErL
| TbL18 | TbL | HoL18 | HoL | ErL18 | ErL |
|---|---|---|---|---|---|
| 0 | 0 | 0 | 0 | 0 | 0 |
| 138 | 142 | 38 | 43 | 39 | 45 |
| 383 | 395 | 90 | 86 | 70 | 73 |
| 211 | 212 | 102 | 104 | ||
| 394 | 400 | 333 | 341 | ||
| 448 | 440 | ||||
| 484 | – | ||||
| 524 | 521 |
The energy level splitting of the ground multiplet is essentially unchanged upon post-derivatisation of TbL, HoL or ErL to TbL18, HoL18 or ErL18. The energies of the ground term sublevels (Table 2) indicate small changes of 2–13 cm−1, however, considering the step size of 0.2–0.3 nm used in the measurements, the uncertainties of the energies are comparable to these numbers, being ±25 cm−1 for TbL18, ±9 cm−1HoL18 and ±2 cm−1 for ErL18. This is also expected from the close structural resemblance of the first coordination spheres. In our previous study on YbL18 we also saw very small changes in the energy level structure of the ground multiplet [22]. However, when the derivatisation is made on the phenyl rings, changes in the energy level splitting of up to 45% have been observed between Er(trensal) derivatives (H3trensal = 2,2′,2′ ′-tris(salicylideneimino)trimethylamine) [41]. The larger shifts in the energy levels moving between different Ln(trensal) derivatives are likely due to the substitution groups being placed directly on the phenyl rings rather than an aldehyde being changed into an imine.
3.3.2. Static magnetic properties
The static magnetic properties of TbL18–TmL18 were studied by d.c. magnetic susceptibility measurements and VTVB measurements. The d.c. magnetic susceptibility measurements (Figure 3) were recorded in the temperature range 2–270 K in a static magnetic field B of 1000 Oe.

Temperature dependence of the χT product of TbL18–TmL18 and TbL–TmL. The χT data of LnL are obtained from literature [21]. Curie constants (CLn) of Tb(III), Dy(III), Ho(III), Er(III), and Tm(III) are shown as dashed lines.
The d.c. susceptibility data are plotted as the χT product, where χ = M∕B, with χ being the molar magnetic susceptibility and M being the magnetisation, and B being the magnetic field.
TbL18–TmL18 reach their lowest χT value at 2 K being 2.80, 6.59, 4.91, 5.33, 0.60 cm3⋅K⋅mol−1, respectively. Upon increasing the temperature, the χT products continuously increase, which is due to the population of excited levels in the ground multiplets of the complexes as there are negligible magnetic couplings to neighbouring complexes (the nearest paramagnetic centre is about 7 Å away). At 270 K, the χT products of TbL18–TmL18 reach their highest values at 10.41 (CTb = 11.82), 13.23 (CDy = 14.17), 12.28 (CHo = 14.07), 10.90 (CEr = 11.48), and 5.70 (CTm = 7.15) cm3⋅K⋅mol−1, respectively. These χT products are smaller than the values expected for the isolated Ln(III), known as the Curie constants (CLn). This suggests that the total energetic splitting of their ground states is larger than the thermal energy available at 270 K. This is corroborated by the luminescence spectra and has also been observed for other complexes with a similar coordination sphere such as the Ln(trensal) [42, 43], Ln(trenovan) (H3 trenovan = tris(((3-methoxysaliclidene)amino)ethyl)amine) [44], and LnL [21].
Comparing the temperature dependence of the χT products of TbL18–TmL18 to TbL–TmL the Kramers ion (Dy and Er)-containing complexes show almost no difference between the post-derivatised and parent complexes, as expected from the very subtle changes in the first coordination sphere and the similar energy level splitting of the ground multiplet found between ErL18 and ErL. This was also observed for the χT products of the Kramers ion complexes YbL18 and YbL [22]. In terms of the non-Kramers ion (Tb, Ho and Tm) complexes, larger deviations between the post-derivatised complexes and the parent complexes are found. Emission spectroscopy showed very similar energy level splittings of the ground multiplets of TbL18 and TbL as well as for HoL18 and HoL, leading us to believe that the change in the temperature dependence of the χT products between post-derivatised complexes and their parent complexes likely stems from different eigenvector compositions. This also explains why the χT product at 2 K for TbL18 is 2.80 cm3⋅K⋅mol−1 while it is 1.20 cm3⋅K⋅mol−1 for TbL. The large difference in the eigenvector compositions is also corroborated by VTVB measurements (vide infra).
VTVB measurements were conducted with applied magnetic fields of 500, 5000, 10,000, 20,000, 30,000, 40,000, and 50,000 Oe and with temperatures in the range 2–10 K (Figures S32–S36).
For all complexes the maximum magnetisation value is reached at 2 K and 50,000 Oe. The reduced magnetisation of TbL18–TmL18 does not superimpose, suggesting that the ground state is not thermally isolated from excited states. This is similar to the parent complexes LnL, where only the GdL and YbL complexes show superimposable reduced magnetisation curves [21]. Comparing the VTVB measurements of the post-derivatised complexes TbL18–TmL18 with the parent complexes TbL–TmL, the difference between the Kramers and non-Kramers ion-containing complexes becomes more apparent. The VTVB measurements of the Kramers ion-containing complexes DyL18 and DyL as well as ErL18 and ErL are almost identical (Figures S33 and S35), suggesting very similar eigenvector compositions of the ground energy levels for the post-derivatised and parent complexes. On the contrary, the non-Kramers ion-containing complexes show different VTVB magnetisation for LnL18 and LnL (Figures S32, S34 and S36). The difference between magnetisation curves for the Kramers and non-Kramers ion complexes upon derivatisation is likely due to the difference in the degeneracy of the energy levels of the Kramers and non-Kramers ions and the loss of crystallographic trigonal symmetry upon derivatisation, with the latter leading to additional off-diagonal terms in the crystal field Hamiltonian, causing more mixings of the states. Unlike in the case of Kramers ions, the energy levels of non-Kramers ions are not forced to be degenerate in pairs at zero magnetic field. Previous measurements on TbL, HoL and TmL indicated that the ground state is likely a singlet but with an excited doublet very close to the ground state for TbL and HoL [21]. If the degeneracy of this doublet is lifted due to the loss of trigonal symmetry, this may lead to much different magnetisation curves.
3.3.3. Influence of the post-derivatisation on the dynamic magnetic properties
A.c. susceptibility measurements were performed on TbL18–TmL18 within the frequency range 1–1500 Hz of an oscillating magnetic field of 3.5 Oe, and with an applied static magnetic field H of 0 to 5000 Oe (Figures S37–S46). When no static magnetic field is applied, none of the complexes show any out-of-phase a.c. signal (χ′ ′) with respect to the available frequency range. This suggests that a large degree of quantum tunnelling of magnetisation (QTM) is present in the complexes, similar to the parent complexes and other complexes with the Ln(trensal) motif [21, 44, 45]. In an attempt to quench the QTM, the a.c. susceptibility was measured in static magnetic fields. When applying a static magnetic field, an out-of-phase signal emerged for the complexes containing Kramers ions (Dy and Er). This was not observed for the complexes containing non-Kramers ions. The difference between the Kramers and non-Kramers ion complexes is likely due to the non-Kramers complexes having a singlet instead of a doublet as the ground state. In three-fold symmetry, only Kramers ions are required to have a degenerate ground state in zero magnetic field. This difference between the Kramers and non-Kramers ions has also been observed in the parent complexes LnL and for the similar Ln(trensal) complexes [21, 44].
The field dependence of the χ′ ′ for DyL18 and ErL18 show similar features (Figures S40 and S44). At low magnetic fields a peak in the χ′ ′ is found at high frequencies. Upon increasing the magnetic field this process disappears from the measurement window, and instead a very broad signal emerges at low frequencies. The same behaviour was observed in the parent complexes DyL and ErL, where the broad relaxation process was found to be temperature-independent [21]. Unfortunately the relaxation process at high frequencies has its maximum outside our measurement window preventing an investigation of its temperature dependence.
In an effort to slow the relaxation dynamics of the process found at high frequencies the complexes DyL18 and ErL18 were diluted at 5% into the diamagnetic hosts YL18 and LuL18, respectively. The dilution into the diamagnetic host limits the dipolar interactions between neighbouring magnetic centres, thereby limiting the effect of dipolar couplings on the spin-lattice relaxation. The field dependence of the χ” of Dy@YL18 and Er@LuL18 show a single peak with a maximum around 100 Hz (Figures S54 and S60). At 1000 Oe the χ′ ′ signal is most intense and at the lowest frequency for both Dy@YL18 and Er@LuL18, presenting the optimal field to study the temperature dependence. Upon increasing the temperature, the signal quickly moves outside our measurement window with the maximum of the signal moving past the measurement window already at 3 K (Figures S56 and S62). Using CC-FIT2 [46], the temperature dependence of the a.c. susceptibility data was fitted to a generalised Debye model. The limited temperature interval that could be extracted from the measurements prevents a detailed analysis of the results. To compare the relaxation dynamics of the post-derivatised complexes to those of the parent complexes, DyL and ErL were diluted into their diamagnetic hosts YL and LuL at 5%, respectively. However, the dilution into a diamagnetic host did not result to observation of a maximum within the available frequency range (Figures S58 and S64). This shows that the spin-lattice relaxation of the Dy and Er ions is slowed down upon the derivatisation, a feature which was also observed for YbL18 [22].
As previously mentioned, GdL18 could not be obtained phase-pure. However, when GdL18 is diluted at 5% into the diamagnetic host YL18, it adopts the same phase as the other members of the LnL18 family presented herein. Having obtained the Gd complex phase-pure we decided to compare its relaxation dynamics to those of the parent complex GdL. For this, GdL was diluted at 5% into the diamagnetic host YL. Field dependence measurements of the a.c. susceptibility for Gd@YL18 showed an optimal relaxation at 3000 Oe (Figure S48). Temperature dependence was subsequently measured with a static magnetic field of 3000 Oe for both Gd complexes (Figures S49–S52). Using CC-FIT2 [46], the relaxation times were obtained for each complex. Contrary to the Dy and Er containing complexes, relaxation times for Gd@YL18 and Gd@YL could be obtained over a large temperature interval (Figure 4 and Tables S5 and S6). Both complexes show very similar relaxation times up to 5 K. Going to higher temperatures, Gd@YL18 starts to relax faster, which may be attributed to the increased amount of vibrations from the octadecyl chains. In a double logarithmic plot the temperature dependence of the relaxation time of Gd@YL is fully linear with a slope of 1.5, which indicates that the relaxation could be governed by a direct process in this temperature regime (Figure S65). In the case of Gd@YL18, the temperature dependence of the relaxation shows a slight curvature, suggesting that at least two different relaxation processes are present within the studied temperature interval.

Temperatue dependence of the relaxation time (τ) of Gd@YL18 at 5% dilution, Gd@YL at 5% dilution, Dy@YL18 at 5% dilution, and Er@LuL18 at 5% dilution. τ was obtained by fitting the generalised Debye model using CC-FIT2 [46] to the temperature dependence of the a.c. magnetic susceptibility of these complexes at a fixed applied static magnetic field.
4. Conclusion
A novel series of aliphatic chain containing lanthanide complexes (Tb–Tm, Y)L18 have been obtained through Schiff-base reaction post-derivatisation of LnL with 1-octadecylimine chains. Single-crystal X-ray diffraction revealed that upon post-derivatisation the first coordination sphere of LnL18 shows great similarities to the one of the parent complex. However, due to van der Waals interactions between the octadecyl chains in the solid state, the trigonal symmetry of the parent complex (LnL) was lost upon post-functionalisation. Emission spectra of (Tb, Ho, Er)L18 and (Tb, Ho, Er)L showed little change in the energetic splitting of the ground multiplet upon post-derivatisation. The changes in the energy level splitting were much smaller than what has been observed between different Er(trensal) derivatives, suggesting that changes in the second coordination sphere that do not change the electron density on the phenyl rings of the complexes have very little effect on the energy levels of the Ln ions in this type of complexes. Although the energy level splitting seems to be little perturbed by the post-derivatisation, the static magnetic properties were found to change significantly upon post-derivatisation for the non-Kramers ion complexes. The effect was largest for the magnetisation measurements at low temperature and is likely the result of a large change in the eigenvector compositions because of non-diagonal terms induced by the low symmetry. This large difference in the static magnetic properties of the non-Kramers ions upon post-derivatisation was not observed for the Kramers ions. It is surprising that post-derivatisation influences the static magnetic properties of the LnL complexes differently depending on whether they contain Kramers or non-Kramers ions. This is important to the future integration of Ln complexes into devices, where bulk properties are wished to be retained upon device integration. If LnL complexes are to be integrated into such devices the focus should be on integrating the Kramers ion-containing complexes which seem less susceptible to small perturbations.
Further studies will investigate how different chain lengths of the amines affect the electronic and magnetic properties of the Ln ions to get a better understanding of the relationship between the static and dynamic properties of the systems as well as between the Kramers and non-Kramers ion complexes. Moreover, Langmuir–Blodgett films formed with these complexes will be studied, to see how the static magnetic and electronic properties change upon organisation in a 2D structure.
Declaration of interests
The authors do not work for, advise, own shares in, or receive funds from any organization that could benefit from this article, and have declared no affiliations other than their research organizations.
Funding
We thank the Novo Nordisk Foundation for research grant NNF20OC0065610.
Accession codes
CCDC 2222267, 2222268 and 2263962 contain the supplementary crystallographic data for this paper. These data can be obtained free of charge via www.ccdc.cam.ac.uk/data_request/cif, or by emailing data_request@ccdc.cam.ac.uk, or by contacting The Cambridge Crystallographic Data Centre, 12 Union Road, Cambridge CB2 1EZ, UK; fax: +44 1223 336033.
Vous devez vous connecter pour continuer.
S'authentifier