


 CC-BY 4.0
1. Introduction
Biodegradable wastes, particularly lignocellulosic biomass, represent a promising sustainable energy source due to their abundance and renewability. This biomass, derived from agricultural residues and forestry byproducts, has garnered global interest due to its availability worldwide and its ability to be converted into various forms of bioenergy with net zero impact [1] by reducing greenhouse gas emissions [2] and substituting fossil fuels. It also contributes to waste management by repurposing materials that would otherwise be discarded [3]. Additionally, the processing of lignocellulosic biomass can promote rural development and a circular bioeconomy [4].
Advanced technologies, such as thermochemical conversion, are being explored to enhance the efficiency of converting lignocellulosic materials into bioenergy, making them a viable alternative to traditional energy sources [5]. Among these methods, pyrolysis is an environmentally friendly process in which the decomposition of organic material is conducted at temperatures ranging between 400 °C and 900 °C in the absence of oxygen [6]. It leads to the formation of biogases (volatiles), bio-oil (liquid), and biochar (solid) [7]. Bio-oil is a highly promising biofuel that is used for heating and/or for power generation, but biochar can be used as soil amendment and soil carbon sequestration or to remove contaminants from the environment (water or gas treatment) [8].
Pyrolysis is considered a good waste processing method because it uses a wide variety of residues including agricultural residues [9], municipal solid waste [10], plastic waste [11], sludges [12], and so on. During pyrolysis, lignocellulosic biomass undergoes thermal degradation, leading to the release of volatile compounds and the formation of solid char residues [13].
Thermogravimetric analysis (TGA) is a pivotal technique for investigating the pyrolysis of lignocellulosic biomass, offering insights into the thermal stability and decomposition behavior of complex organic materials [14]. The TGA quantifies weight loss as a function of temperature, allowing for the determination of key parameters such as moisture content, ash yield, volatile matter, and fixed carbon contents [15, 16]. By analyzing the thermal degradation profiles of biomass experimental data and the use of kinetic models, it is possible to calculate kinetic parameters such as the activation energy and the pre-exponential factor [17, 18]; it is also possible to identify the pyrolysis mechanism and its thermodynamic parameters [19].
This analysis not only aids in optimizing pyrolysis processes for energy production but also enhances the understanding of product yields and the environmental implications of biomass utilization. Overall, TGA serves as an essential tool in the sustainable development of bioenergy from lignocellulosic materials [20].
Phragmites australis (PA) is one of the most widespread wetland plants globally, with significant biomass production due to its rapid growth and invasiveness [21, 22]. Its ability to thrive in diverse environments has led to ecological concerns, particularly in regions where it outcompetes native species and disrupts ecosystems, impacting negatively the biodiversity [23, 24], which makes its valorization in the pyrolysis process a promising approach to energy production and waste management [25, 26].
Zhao et al. and Barbooti et al. investigated the thermal degradation of PA, and they found that this process occurs in three stages: the first stage corresponds to moisture evaporation; the second corresponds to the thermal degradation of cellulose, hemicellulose, and lignin; the third is characterized by the formation of fixed carbon and degradation of lignin, resulting in biochar formation and higher thermal stability [25, 27]. To the best of our knowledge, the pyrolysis reaction mechanism of PA was investigated by some researchers using the master plot method, and there is no mention of the Coats–Redfern (CR) method for PA pyrolysis. This method is based on the application of heterogeneous reaction models (CR models) to the experimental data and compares the activation energy values obtained to those calculated with isoconversional models (Kissinger–Akahira–Sunose (KAS) and Ozawa–Flynn–Wall (OFW) models) to attain the best-fitted model and to predict the thermal degradation mechanism [28]. This method was used by Dhaundiyal and Gangwar [29] to investigate the pyrolysis mechanism of pine needles. Moreover, for instance, there is little information about the thermodynamic properties of the PA pyrolysis mechanism.
The main aim of the current work is to investigate the thermal behavior of Tunisian PA pyrolysis using experimental TGA data to obtain more information about kinetic and thermodynamic PA thermal degradation and the CR method to study this pyrolysis reaction mechanism. Besides, the climatic conditions in the Mediterranean basin and North Africa contribute to variations in biomass resource composition [30], which makes the focus on Tunisian PA pyrolysis critical to the development of localized biomass-to-energy conversion strategies.
2. Material and methods
2.1. Preparation of raw and pyrolyzed biomass
Phragmites australis was collected from Gabes, a region situated in the southern part of Tunisia. It was initially washed with distilled water several times to remove any impurities stuck to different plant parts. Then, the plant was dried in an air oven at 323 K for 48 h, crushed, and sieved to the desired particle size (ranging from 0.1 to 0.2 mm).
Raw PA pyrolysis was performed in a vertical cylindrical ceramic reactor with fixed parameters (nitrogen flow of 20 mL/min, heating rate of 10 °C/min, and 1 h of pyrolysis time) to evaluate its morphology and functional groups.
2.2. Characterization of raw and pyrolyzed biomass
2.2.1. Morphology and composition of raw and pyrolyzed PA
A scanning electronic microscope (SEM, type Tescan VEGA3 SBH model with tungsten filament) coupled to Bruker XFlash EDS sensor microanalysis for energy-dispersive X-ray (EDX) was used to examine the raw PA surface morphology (under 275× magnification) and to determine the percentage of some chemical elements (C, O, Na, Cl, and K).
The surface microstructure of the pyrolyzed PA was examined using an SEM (type FEIQ250/EDAX Thermo Fisher) under 2000× magnification.
Volatile matter (VM) was obtained from the TGA data, and fixed carbon (FC) content was calculated using this expression:
| (1) |
2.2.2. Determination of functional groups
Raw and pyrolyzed PA functional group measurements were carried out with a Bruker ALPHA Fourier transform infrared (FTIR) spectrometer with a spectrum ranging between 400 cm−1 and 4000 cm−1. The samples were prepared using the KBr method by Gardon et al. [31]. This technique involves mixing the powdered and dried samples with potassium bromide (KBr) in a ratio of about 1:100. The mixture is then placed into a pellet press; then, high pressure is applied to form a transparent pellet, which is analyzed in transmission mode.
2.3. Thermogravimetric analysis
The thermobalance SETARAM S60/58B41 was used to evaluate the weight loss of a definite mass of raw PA. Different heating rates (ranging from 10 °C/min to 50 °C/min) were applied to the PA samples under a fixed flow of inert gas (N2) of 20 mL/min, and the results were presented as weight loss and derivative or differential thermogravimetric (DTG) curves for each heating rate.
2.4. Kinetic modeling
The TGA data of raw PA was used to study the thermal decomposition behavior during the pyrolysis process. The PA thermal degradation is considered a non-linear process composed of different stages, which can be described with various models. The Arrhenius law is used to analyze the PA pyrolysis as a function of thermal degradation time t [14, 15, 17]:
| (2) |
| (3) |
K(T) is the reaction rate constant, which can be defined by the Arrhenius law [14, 15, 17]:
| (4) |
Equation (2) combined with Equation (4) gives
| (5) |
| (6) |
Some methods have been proposed to resolve Equation (6); among them is the CR method, which is used to estimate the reaction mechanism.
2.4.1. Isoconversional models
Isoconversional models are used to evaluate the activation energy for different values of the conversion rate. These models require that the kinetics of reactions do not depend on the heating rate, and then the conversion of raw materials into products takes place in a one-step process [7]. The temperature increases from T0 with a constant heating rate 𝛽 as described by these expressions:
| (7) |
| (8) |
Combining these expressions with Equation (6) gives
| (9) |
The KAS model
The KAS model represents all the chemical and physical reactions that take place during thermal decomposition. In this model, the temperature integral P(x) is
| (10) |
| (11) |
The OFW model
The OFW model requires the measurement of temperatures corresponding to fixed conversion rates at different heating rates. In this case, the determination of activation energy does not require prior knowledge of reaction mechanisms [32].
This model, developed by Flynn and Wall [33] and Ozawa [34], uses a correlation among the heating rate, the activation energy, and the temperature of the samples during pyrolysis [7]. The derivation of this correlation is based on Doyle’s approximation [35]:
| (12) |
| (13) |
2.4.2. Determination of the pre-exponential factor
The pre-exponential factor (A) is an important parameter to obtain some information about the chemical reaction and then to optimize the pyrolysis. It can be calculated using this equation [36]:
| (14) |
2.5. Thermodynamic parameters
Enthalpy (ΔH), Gibbs free energy (ΔG), and entropy (ΔS) were calculated using kinetic data (Ea and A), TGA data points, and the following equations [37]:
| (15) |
| (16) |
| (17) |
2.6. Estimation of the reaction mechanism
The model developed by Coats and Redfern [28] is used to estimate the activation energy values by applying Equation (15) for the kinetic function corresponding to the appropriate pyrolysis mechanism.
| (18) |
Reaction mechanisms functions, model names, and f(𝛼) and g(𝛼)
| Model name | f(𝛼) | g(𝛼) |
|---|---|---|
| Chemical reaction order | ||
| Chemical reaction order 0 (F0) | 1 | 𝛼 |
| Chemical reaction order 1 (F1) | 1 − 𝛼 | −Ln(1 − 𝛼) |
| Chemical reaction order 1.5 (F1.5) | (1 − 𝛼)3/2 | 2[(1 − 𝛼)−3/2 − 1] |
| Chemical reaction order 2 (F2) | (1 − 𝛼)2 | (1 − 𝛼)−1 − 1 |
| Chemical reaction order 3 (F3) | (1 − 𝛼)3 | [(1 − 𝛼)−2 − 1]/2 |
| Chemical reaction order 4 (F4) | (1 − 𝛼)4 | [(1 − 𝛼)−3 − 1]/3 |
| Diffusion | ||
| Parabolic law (D1) | 1/(2𝛼) | 𝛼2 |
| Valensi equation (D2) | −[Ln(1 − 𝛼)]−1 | 𝛼 + (1 − 𝛼)Ln(1 − 𝛼) |
| Ginstling–Brounshtein equation (D3) | (3/2)[(1 − 𝛼)1/3 − 1]−1 | (1 − 2𝛼/3) − (1 − 𝛼)2/3 |
| Jander equation (D4) | (3/2)(1 − 𝛼)2/3[1 − (1 − 𝛼)1/3]−1 | [1 − (1 − 𝛼)1/3]2 |
| Nucleation and growth | ||
| Avrami–Erofeev equation (N1.5) | 3(1 − 𝛼)[−Ln(1 − 𝛼)]2/3 | [−Ln(1 − 𝛼)]2/3 |
| Avrami–Erofeev equation (N2) | 2(1 − 𝛼)[−Ln(1 − 𝛼)]1/2 | [−Ln(1 − 𝛼)]1/2 |
| Phase interfacial reaction | ||
| Shrinkage geometrical column (S1) | 2(1 − 𝛼)1/2 | 1 − (1 − 𝛼)1/2 |
| Shrinkage geometrical spherical (S2) | 3(1 − 𝛼)2/3 | 1 − (1 − 𝛼)1/3 |
3. Results and discussion
3.1. Characterization of raw and pyrolyzed PA
3.1.1. Composition of raw PA
As illustrated in Figure 1, EDX analysis was conducted to identify some components present in the raw PA. The peaks show the prevalence of carbon and oxygen along with the presence of other components in trace amounts (Na, Cl, Si, Cl, and K). Table 2 presents an elemental composition of the raw PA added to ash, volatile matter, fixed carbon, and moisture content. High carbon and oxygen contents (47.35% and 48.58%, respectively) coupled with low moisture and ash contents (3.34% and 8.73%, respectively) indicate that this biomass is a highly promising raw material for a range of applications in energy, activated carbon, and biochar production processes. The composition of the PA Tunisian variety is close to the Egyptian PA reported by El Shahawy and Heikal [38]. Other biomasses observed in the literature like pine cones [13], olive stones [14], and cocoa shell [36] have high contents of volatile matter and fixed carbon and low ash content, which is important for gasification and pyrolysis processes. However, there are differences in composition, which may be due to species, variety, type of soil, or climatic conditions [39].
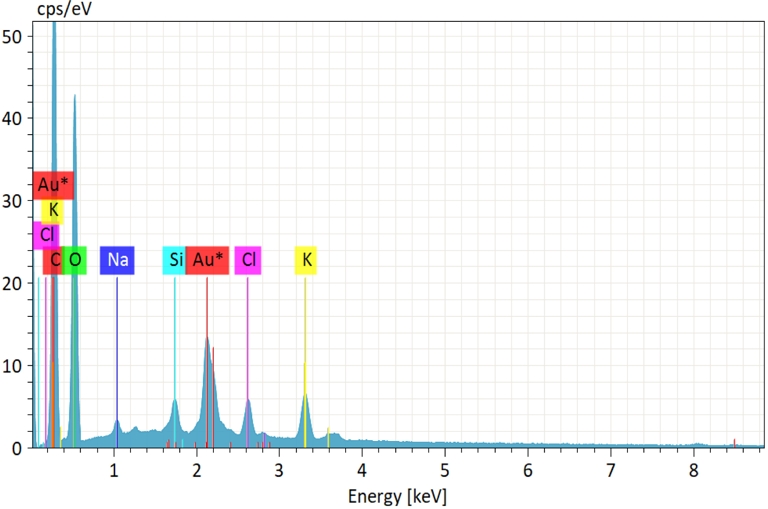
Energy-dispersive X-ray spectra of raw PA.
Composition of raw PA
| Moisture (%) | Ash (%) | VM (%) | FC (%) | C (%) | O (%) | Na (%) | Si (%) | Cl (%) | K (%) |
|---|---|---|---|---|---|---|---|---|---|
| 3.34 | 8.73 | 45.125 | 42.81 | 47.35 | 48.58 | 0.51 | 0.53 | 1.07 | 1.96 |
3.1.2. Morphology of raw and pyrolyzed PA
The SEM analysis of raw PA presented in Figure 2a shows that the biomass is rough with a regular and compact structure with fibers arranged in bundles [38]. The presence of a small number of pores and a cylindrical fiber structure gives the idea that the biomass has a typical compact lignocellulosic fibrous structure [40, 41]. Ponce et al. [39] also revealed this structure for sugarcane bagasse, corn husk, and rice husk characterized by a cylindrical fiber with a rough structure.
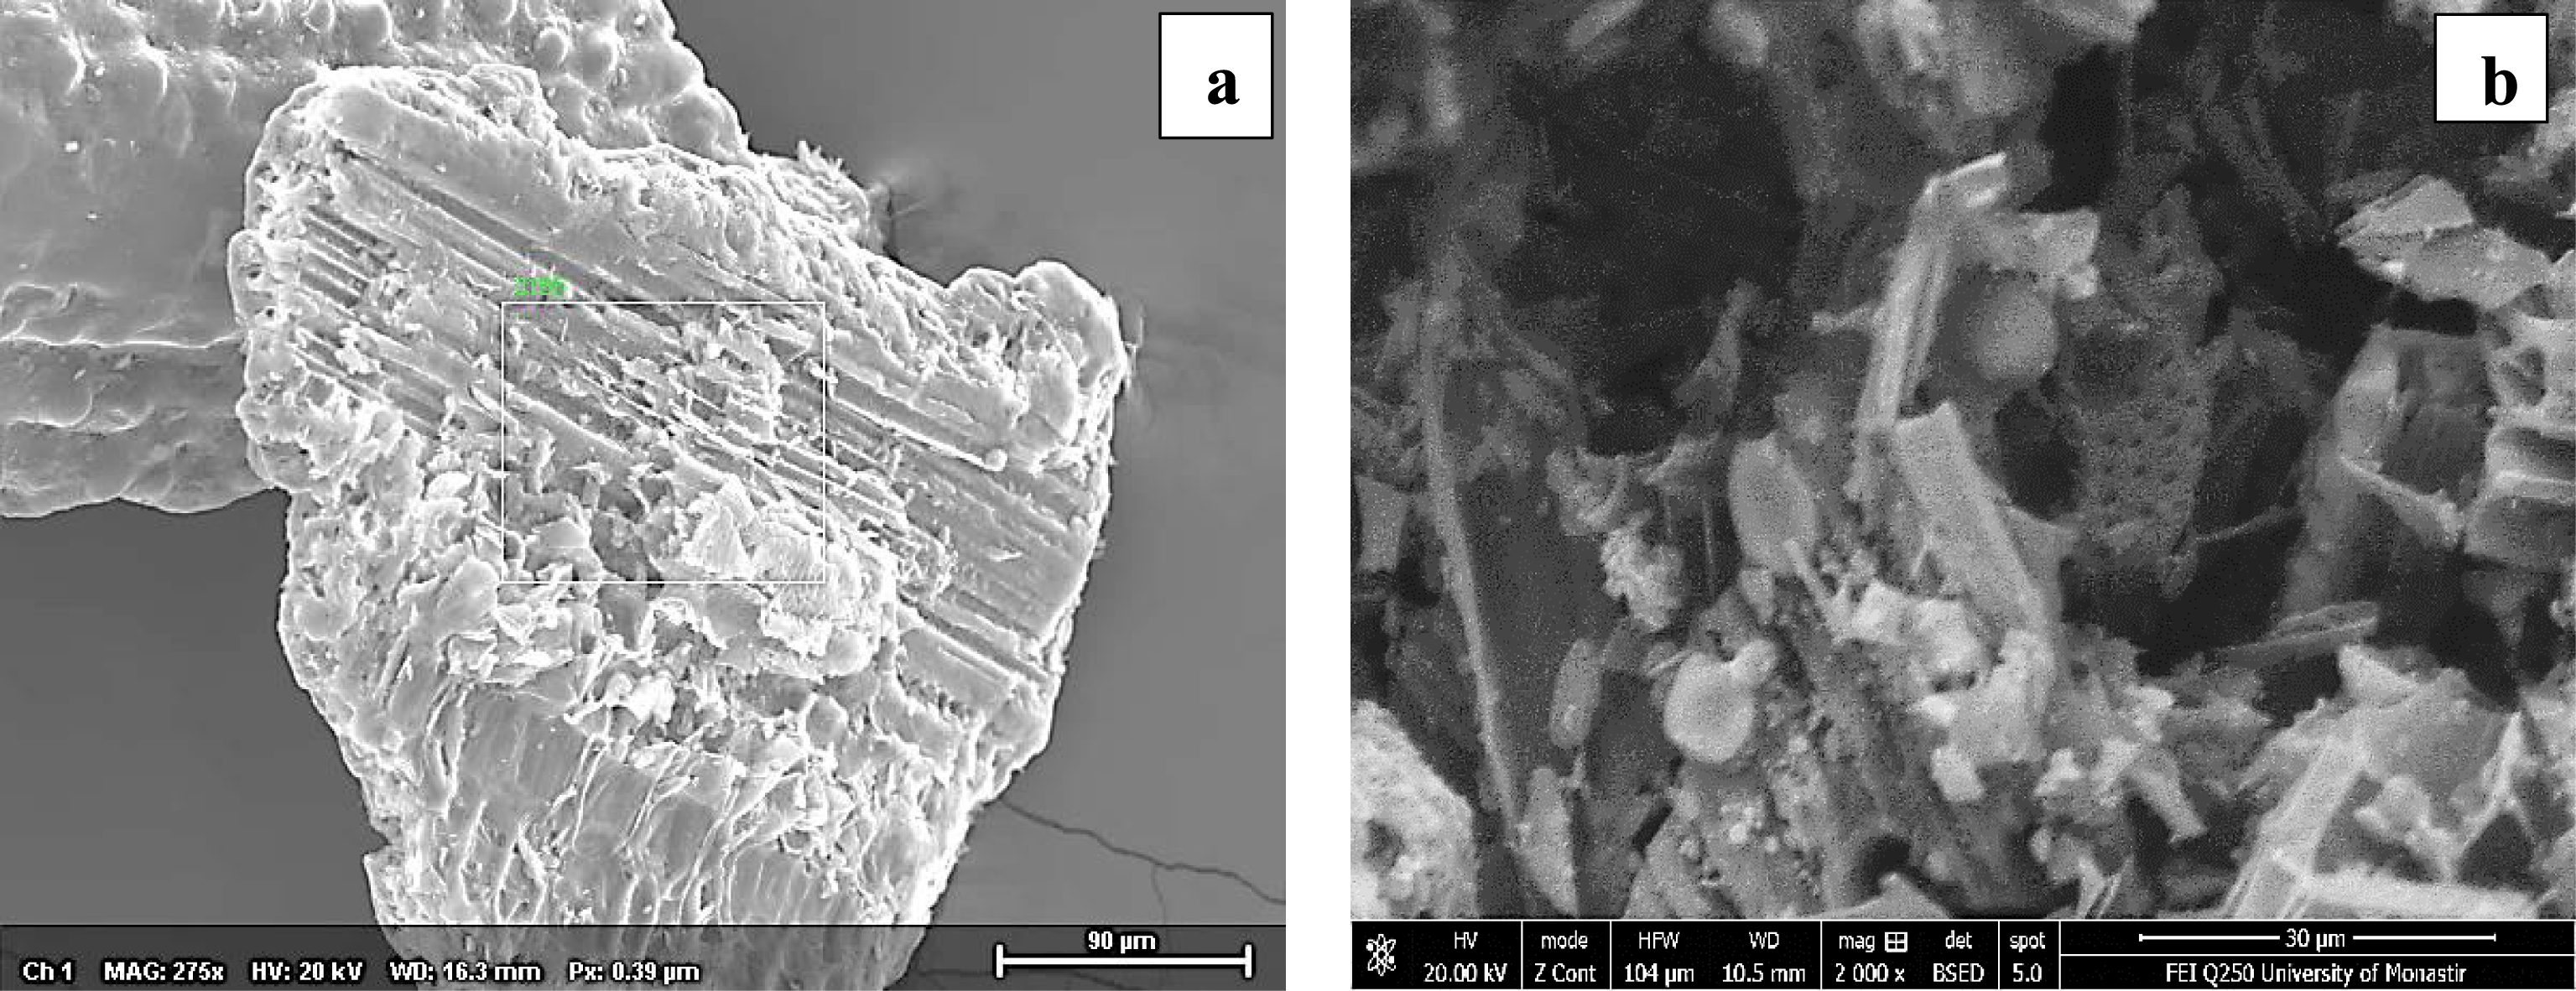
SEM of raw (a) and pyrolyzed (b) PA. (a) SE MAG: 275×, HV: 20 kV, WD: 16.3 mm; (b) SE MAG: 2000×, HV: 20 kV, WD: 10.5 mm.
After pyrolysis, as shown in Figure 2b, the biochar develops a fairly high porosity, the surface morphology changes, and it becomes cleaner and fluffier than raw biomass. Many cracks, cavities, and spherical pores are also visible on the surface, but with different shades due to the loss of moisture and volatile matter. This structure is of great importance as it develops the PA pore structure, thereby enhancing the uptake of pollutants from aqueous solutions and the retention capacities of the biochar [8]. This structure was also observed by Kordoghli et al. [42] after orange peel pyrolysis and by Bouaik et al. [8] after red alga pyrolysis in which they have noticed the presence of pores with different forms (fluffy sponges, balls) and formless particles.
3.1.3. Functional groups of raw and carbonized PA
The FTIR analysis of raw and pyrolyzed PA is presented in Figure 3. The raw PA spectrum is similar to those obtained for other lignocellulosic materials such as olive stones, rice husk, sugarcane bagasse, and wheat straw [14, 42].

FTIR of raw and pyrolyzed PA before and after pyrolysis.
The peak situated around 3128 cm−1 refers to the –OH stretching vibration of hydroxyl groups present in cellulose, hemicellulose, and lignin structures [43]. The C=O stretching vibrations at 1730 cm−1 can be assigned to carbonyl groups (ketones, phenols, carboxylic acids, and aldehydes) and confirm higher concentrations of lipids and fatty acids [44]. The band at 1603 cm−1 corresponds to the C–H deformation in methyl, methylene, and methoxyl groups of lignin [45]. The band observed at 1498 cm−1 is associated with lignin aromatic rings [40]. The peak at 1400 cm−1 is due to the bending vibration of C–O–C pyranose ring skeletal vibration of cellulose present in the biomass [40]. The C–C ring breathing bands at 1229 cm−1 can be attributed to the presence of ether, ester, and phenol groups of lignin [45, 46]. The band situated at 1036 cm−1 represents C–H or C–OH stretching vibration bonds in cellulose and hemicellulose [38] while the peaks appearing at 622 and 562 cm−1 are associated with bending vibrations of CH3, =CH2, and ≡CH, which are cellulose components [14]. Several biomasses such as pine cones [13] and olive stones [14] present the same spectrum overall, which is explained by the primordial presence of cellulose, hemicellulose, and lignin in their structure, characteristic of lignocellulosic biomasses.
After pyrolysis, as shown in Figure 3, the O–H stretching bands located at 3128 cm−1 become significantly reduced because of the destruction of these groups as dehydration occurs and water is released as most of the organic oxygen-containing groups are broken [47]. It is also clear that the C=O stretching bands associated with carbonyl groups (at 1730 cm−1) disappear because they are thermally decomposed [47]. The band situated at 1400 cm−1 presents a significant reduction, reflecting the destruction of glycosidic linkages [47].
Globally, a significant quantity of lignin, cellulose, and hemicellulose has been removed from the plant’s structure during pyrolysis [48, 49]. The same interpretation was developed by Tabal et al. [44] and Kordoghli et al. [41] who noticed that after the pyrolysis of Ficus wood and orange peels, several band intensities such as aliphatic remain weak or disappear due to organic decomposition in the presence of heat.
3.2. Thermogravimetric analysis
Thermogravimetric analysis is commonly employed to investigate the thermal composition of materials. The TG and DTG curves illustrating respectively the weight loss and derivative thermogravimetric variation as a function of temperature at different heating rates (10, 20, 30, 40, and 50 °C/min) are presented in Figure 4a and b. The shape of these curves is typical of the thermal degradation of lignocellulosic biomasses like olive stones [14], pomegranate peels [15], rice husk [50], cardoon leaves [51], and Typha latifolia [52], and they all reveal the presence of three stages of decomposition.
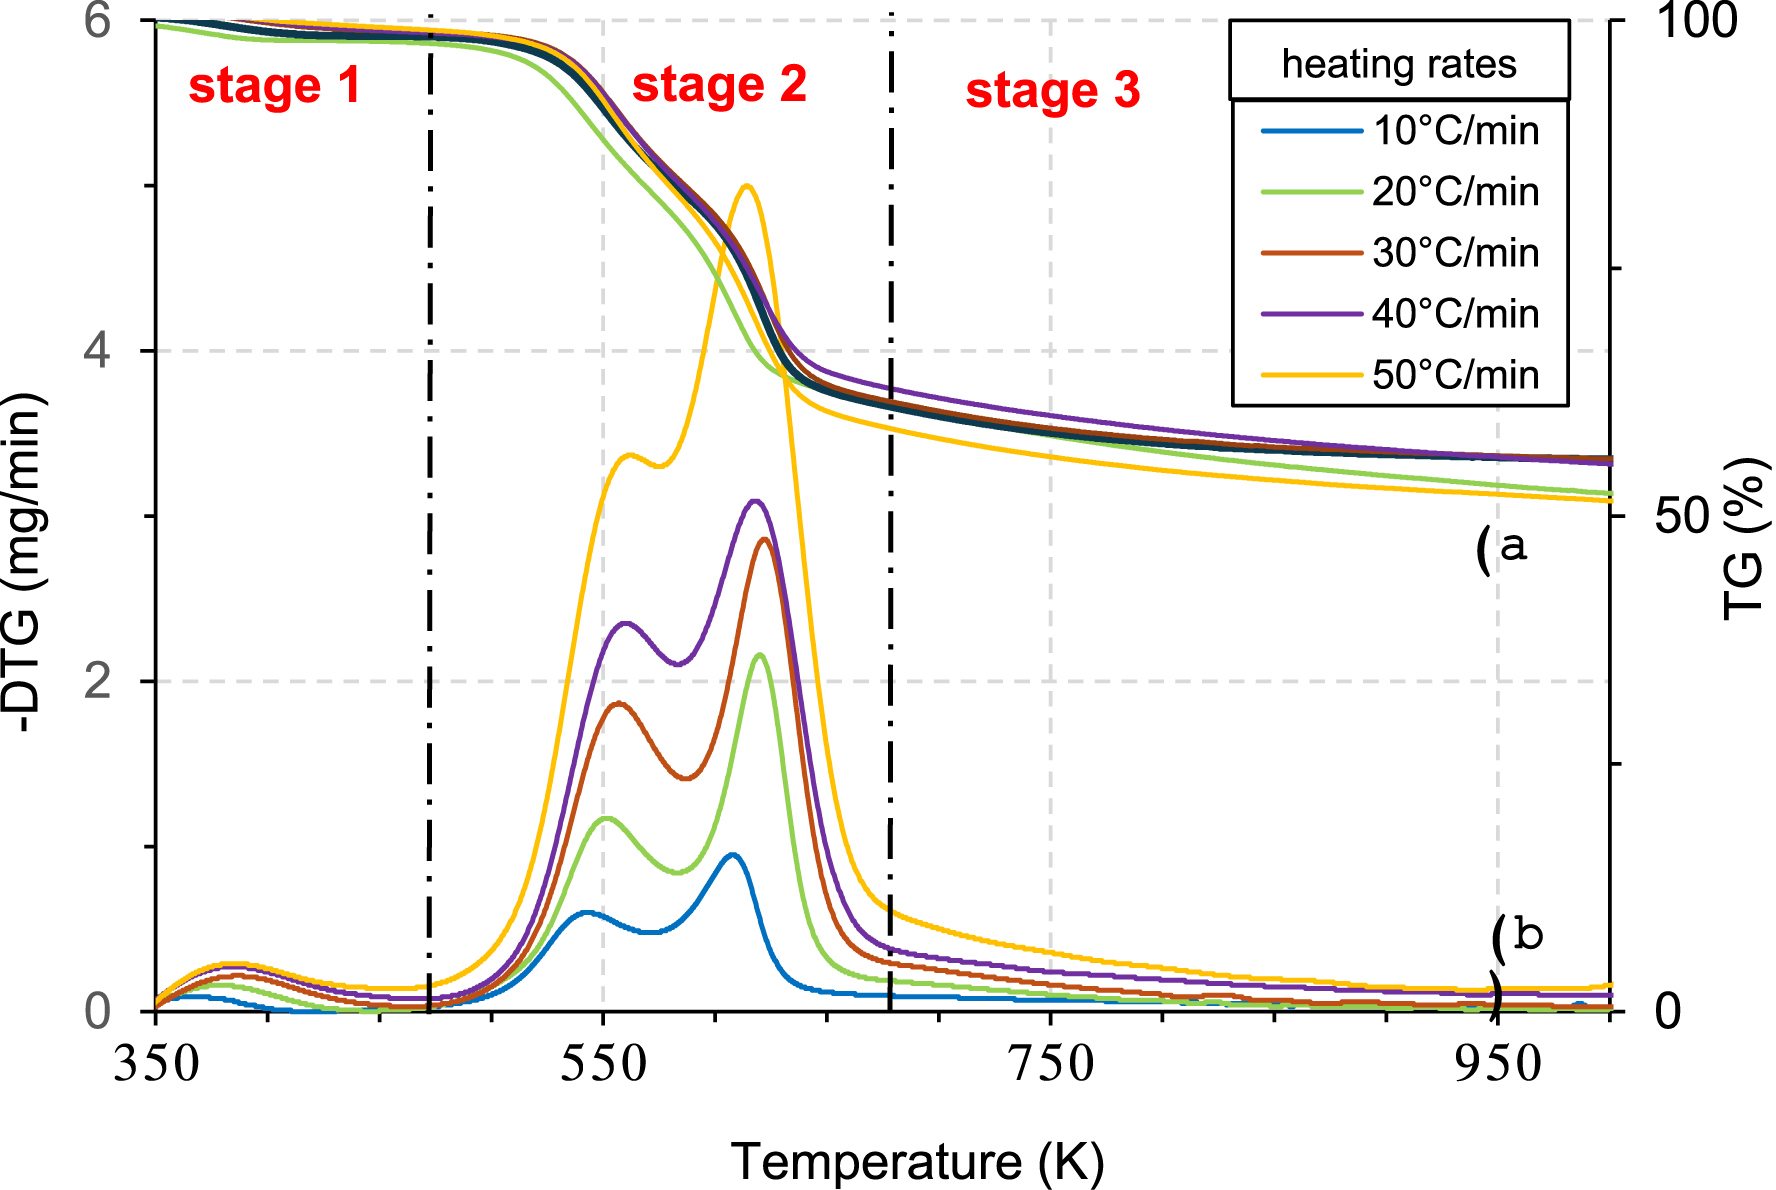
Weight loss (TG) (a) and differential thermogravimetric (DTG) (b) curves for different heating rates.
The first stage ranges from 350 K to 475 K for all the heating rates, and it is characterized by a small drop with a mass loss of about 2.35%, which corresponds to the evaporation of free physisorbed water in micropores and mesopores (moisture) [14]. The remaining low moisture makes the PA suitable for pyrolysis and combustion [53].
The second stage in which the most significant weight loss is observed (58.92%) and the temperature ranges between 475 K and 675 K indicates the degradation of hemicellulose and cellulose present in the PA structure [54].
This stage in which the degradation of PA occurs is divided into two regions for all the heating rates. Region 1 (R1) characterized by the presence of a strong peak in the DTG curve situated at a temperature between 475 K and 575 K and by a conversion rate 𝛼 ⩽ 0.35 corresponds to the zone in which the hemicellulose is mainly pyrolyzed. Region 2 (R2) situated between 575 K and 675 K corresponds to the zone in which the cellulose is mainly pyrolyzed [14, 15].
The third stage, observed at T ⩾ 675 K, presents a loss of weight of 8.97%, and it is associated with lignin decomposition [47]. The constant mass present in this stage is attributed to ash content representing the inorganic components present in PA [55].
Zhao et al. [56] revealed that PA pyrolysis occurs in three stages. The first stage involves the loss of cellular water (the temperature ranges between 323 and 513 K), and the second stage occurs as the temperature increases from 513 to 773 K and in which the major part of the organic material is decomposed (weight loss greater than 50%). This stage is divided into two regions: Region 1 in which the temperature increases from 513 to 591 K and Region 2 where the temperature increases from 591 to 773 K. The third stage is observed for a temperature over 773 K where there is a slight continued loss of weight which corresponds to a slow decomposition of residuals and carbonaceous matters present in the biomass.
Zhao et al. [27], who studied PA pyrolysis under different heating rates, also revealed the presence of three stages (stage 1: from 313 to 422 K with 8% weight loss, stage 2: from 422 to 872 K with about 60% weight loss, and stage 3: from 872 to 1153 K with 4.65% weight loss).
When comparing these results, the presence of some similarities and differences attributed to the PA characteristics and origin, experimental conditions, and sample preparation is observed.
3.3. Kinetic modeling
3.3.1. Evaluation of activation energy
The plots corresponding to OFW and KAS models shown in Figure 5 (a and b, respectively) are used to estimate the activation energy of raw PA pyrolysis at conversion rates ranging between 0.1 and 0.6.
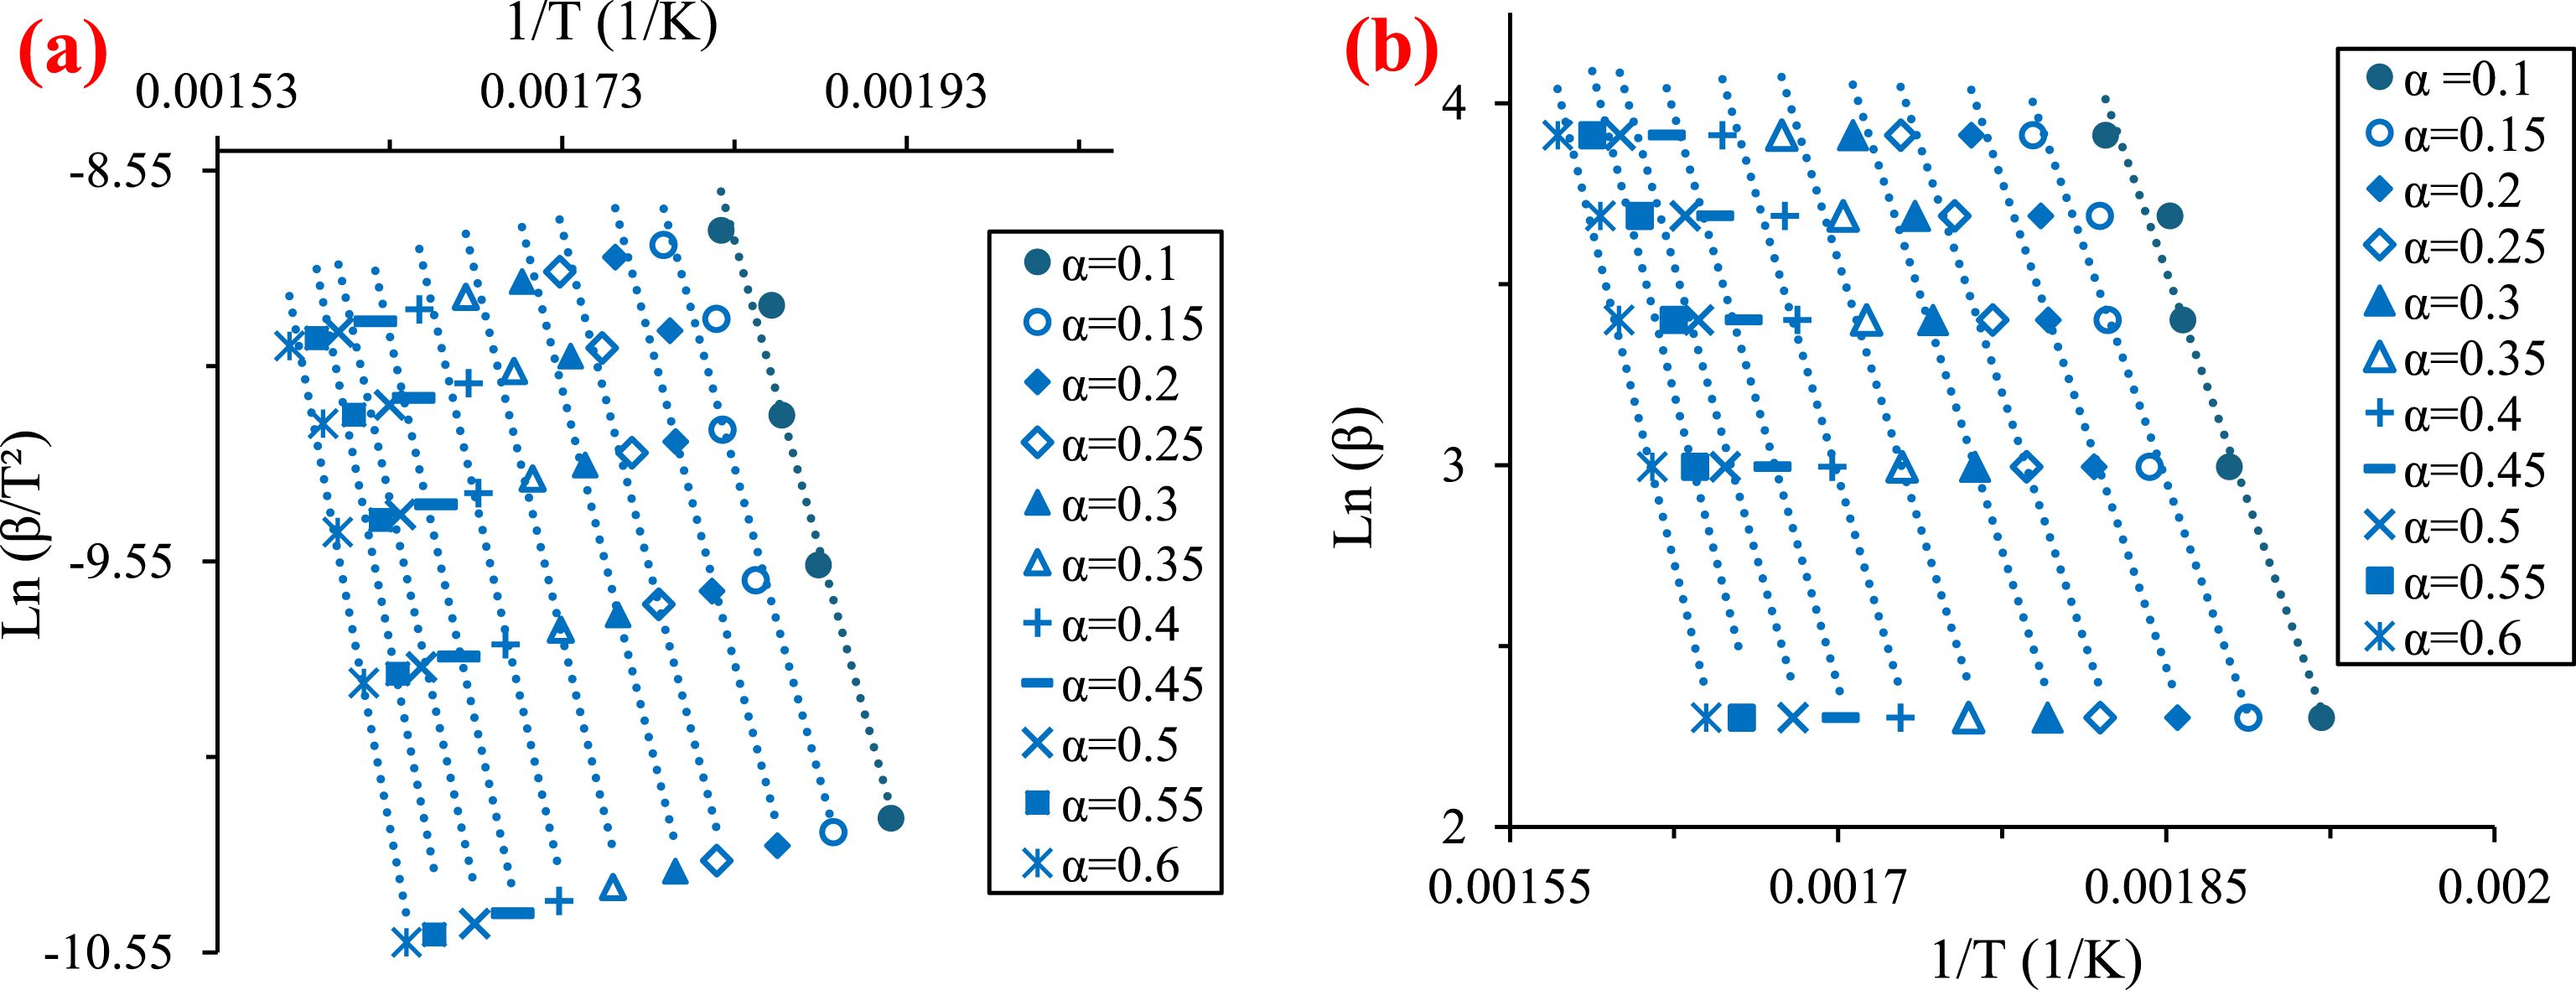
Linear fit plots of KAS (a) and OFW (b) models.
The results presented in Figure 6 show the dependence of activation energy on the conversion rate. The obtained values rise as the conversion rate values increase from around 133 kJ/mol for a conversion rate of 0.1 to nearly 193 kJ/mol for a conversion rate of 0.6. The lower Ea-value indicates that less energy was required to initiate a reaction, and then the energy increased as the reaction progressed [57]. This proves that pyrolysis is a multi-step process with various apparent activation energies [58]. Hemicellulose decomposition dominance in R1 requires less energy than cellulose decomposition, which is dominant in R2 [59]. In their investigation of olive kernel pyrolysis, Boukaous et al. [30] observed that the activation energies (Ea) increase with increasing conversion rates from approximately 170 kJ/mol to around 230 kJ/mol. This trend follows a similar Ea–𝛼 shape to that observed in PA pyrolysis studies. Besides, the values obtained with the two models are approximately equal with a minimal deviation of approximately 1%, confirming their validity (average Ea-value of 157.72 kJ/mol).
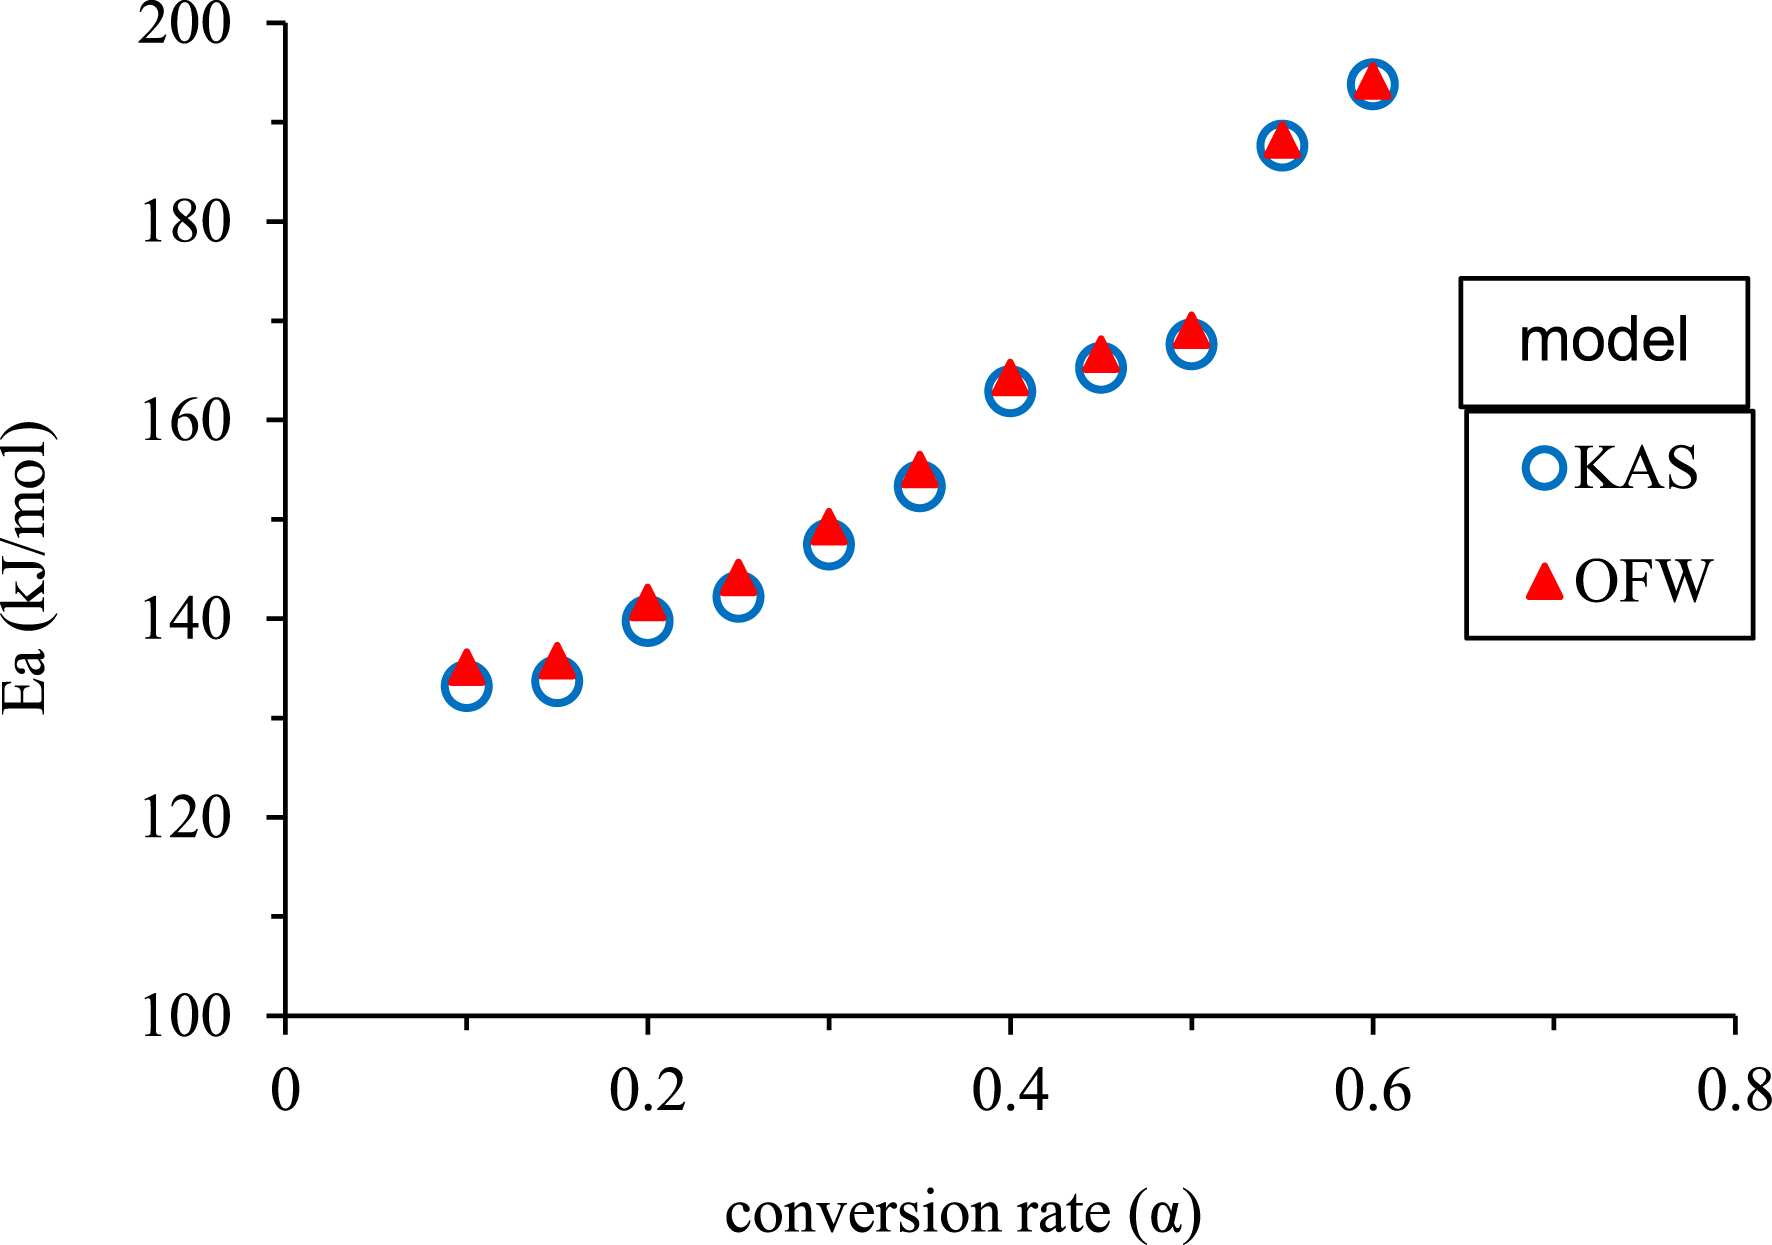
Variation of Ea-values with conversion rate for KAS and OFW models.
3.3.2. Evaluation of the pre-exponential factor
The pre-exponential factor is related to the reaction chemistry. In fact, lower A-values (⩽109 s−1) indicate a surface reaction, whereas higher values (⩾109 s−1) indicate a more complex reaction [52]. All the A-values calculated with the average Ea-value obtained from KAS and OFW models are presented in Table 3. They are above 109 s−1, which shows the dominance of cellulose decomposition [60]. They also indicate the complexity of PA, the rotation of the active complex, and that the reagent remains constant during the monomolecular reactions of PA decomposition [61]. Moreover, these values are lower when compared to the A-values of Typha latifolia (A-values range from 5.53 × 10¹⁰ to 3.02 × 10¹⁵ s−1) [52] and cocoa shell (A-values range from 4.26 × 10⁹ to 1.44 × 10¹⁵ s−1) [36].
Pre-exponential factor for different heating rates
| 𝛽 (°C/min) | 10 | 20 | 30 | 40 | 50 | Average |
|---|---|---|---|---|---|---|
| A (s−1) | 2.88 × 10¹¹ | 3.03 × 10¹¹ | 3.89 × 10¹¹ | 6.4 × 10¹¹ | 1.04 × 10¹² | 5.33 × 10¹¹ |
Table 4 groups together the kinetic parameter values obtained for various biomasses from the literature and those obtained in this work. They are well aligned and characteristic of lignocellulosic materials. When comparing the activation energy of PA (157.72 kJ/mol) with other biomasses, it falls into a moderate range, indicating that it requires a reasonable amount of energy for thermal breakdown. In contrast, materials like cardoon stems and maize cobs (224.51 kJ/mol and 202.19 kJ/mol, respectively) exhibit significantly higher activation energies, suggesting that they are more resistant to decomposition and may necessitate more intensive processing techniques. Conversely, biomasses such as pomegranate peels and olive stones (88.98 kJ/mol and 124 kJ/mol, respectively) have much lower activation energies, making them easier to convert into energy. This positions PA as a potentially efficient feedstock, requiring more energy than softer materials but less than highly fibrous substances, allowing for versatile application in various conversion processes while balancing energy requirements and processing costs.
Activation energies and pre-exponential factors obtained for different biomasses
| Biomass | Ea (kJ/mol) | A (s−1) | References |
|---|---|---|---|
| Phoebe zhennan wood | 170.49 | 3.47 × 10¹⁷ | [2 ] |
| Cardoon stems | 224.51 | 1.9 × 10¹⁹ | [7 ] |
| Olive stone | 124 | 8.38 × 10⁸ | [14 ] |
| Pomegranate peels | 88.98 | 3.41 × 10¹² | [15 ] |
| Cocoa shell | 104.5 | 2.74 × 10¹¹ | [36 ] |
| Typha latifolia | 183 | 1.5 × 10¹⁵ | [37 ] |
| Maize cob | 202.19 | 8.14 × 10¹⁷ | [62 ] |
| Soybean straw | 154.15 | 8.61 × 10¹⁴ | [63 ] |
| Phragmites australis | 163–212.87 | 2.07 × 10¹⁰ | [27, 56 ] |
| Phragmites australis | 157.72 | 5.33 × 10¹¹ | This work |
3.4. Thermodynamic parameters
Enthalpy (ΔH), entropy (ΔS), and Gibbs free energy (ΔG) calculated for the different heating rates are presented in Table 5.
Thermodynamic parameters of PA pyrolysis
| Heating rate (°C/min) | 10 | 20 | 30 | 40 | 50 | Average |
|---|---|---|---|---|---|---|
| ΔH (kJ⋅mol−1) | 151.57 | 151.4 | 151.24 | 151.07 | 150.9 | 151.24 |
| ΔG (kJ⋅mol−1) | 218.54 | 220.57 | 224.25 | 228.59 | 233.29 | 225.04 |
| ΔS (J⋅mol−1⋅K−1) | −90.49 | −91 | −93.6 | −96.89 | −100.46 | −94.49 |
The positive ΔH-values indicate the endothermic nature of PA pyrolysis [64]. In fact, an external energy source is required to increase the energy level of the reagent and facilitate its transition [65]. The lower difference between Ea- and ΔH-values (Ea − ΔH ⩽ 6.5 kJ/mol) indicates that the pyrolytic conversion of PA into bioenergy seems to be potentially viable and the product formation would be favorable [52, 66].
Barrier energy is represented by the low activation energy needed to break the chemical bonds found in organic molecules. Furthermore, it shows that the activation energy needed to break the chemical bonds in organic molecules and enable the synthesis of products seems to be low, indicating that the process might be completed with ease. This proves that the chemicals produced by pyrolyzing PA, such as coals, fuel gases, and bio-oils, are created without requiring a significant amount of extra heat. The efficient conversion of PA into bioenergy is shown by the preferential production of these products at lower enthalpy [52, 67].
The parameter ΔG represents the amount of bioenergy that becomes available when pyrolysis occurs [67]. The ΔG-values of PA pyrolysis range between 218.54 and 233.29 kJ/mol, indicating the non-spontaneous nature of raw PA pyrolysis [52]. These values are higher when compared with Typha Latifolia (173–175 kJ/mol) [52], rice husk (143 kJ/mol), coffee husk (143 kJ/mol), groundnut shell (166.11 kJ/mol), and tea waste (169.238 kJ/mol) [4]. This indicates that the pyrolysis of PA will provide more energy than Typha latifolia, rice husk, coffee husk, groundnut shell, and tea waste.
The negative ΔS-values obtained in this study reveal that the decomposition of PA takes place at low speed [68], and it is also close to its thermodynamic equilibrium with higher thermodynamic stability [37]. This is confirmed by the results of the studies carried out by Mumbach et al. [36] on cocoa shell pyrolysis (ΔS-values between −39.51 and −72.7 J/mol.K) and Bongomin et al. [4] on rice husk pyrolysis (ΔS-value of −190.3 J/mol⋅K).
3.5. Pyrolysis mechanism
The CR method was used to estimate the raw PA pyrolysis mechanism. It is based primarily on tracing the plots of Ln(g(𝛼)/T2) versus 1/T at all the heating rates (10, 20, 30, 40, and 50 °C/min) and for the two regions, R1 (0.1 ⩽ 𝛼 ⩽ 0.35) and R2 (0.35 ⩽ 𝛼 ⩽ 0.6). The slopes of these curves are used to calculate the activation energies for different reaction mechanism functions g(𝛼) presented in Table 1.
Finally, the comparison between the obtained values and those calculated with the isoconversional models KAS and OFW helps to estimate the appropriate model. In fact, the Ea-values, which are nearly equal, show that this mechanism function is the best fit for the pyrolysis in this region. Figure 7 shows the plots obtained with different functions g(𝛼) at a heating rate of 10 °C/min, and Table 6 regroups the Ea-values obtained from the slopes of these curves traced for all the heating rate values (from 10 to 50 °C/min).
Ea- and R2-values obtained for different reaction mechanisms using the CR method
| Reaction model | 10 °C/min | 20 °C/min | 30 °C/min | 40 °C/min | 50 °C/min | Average values | |||||||
|---|---|---|---|---|---|---|---|---|---|---|---|---|---|
| Ea (kJ/mol) | R2 | Ea (kJ/mol) | R2 | Ea (kJ/mol) | R2 | Ea (kJ/mol) | R2 | Ea (kJ/mol) | R2 | Ea (kJ/mol) | R2 | ||
| Reaction order | |||||||||||||
| R1 | F0 | 54.766 | 0.962 | 60.926 | 0.966 | 62.997 | 0.967 | 59.096 | 0.961 | 56.68 | 0.979 | 58.893 | 0.967 |
| F1 | 62.83 | 0.972 | 69.773 | 0.976 | 72.121 | 0.976 | 67.731 | 0.972 | 69.391 | 0.976 | 68.369 | 0.974 | |
| F1.5 | 76.316 | 0.984 | 84.57 | 0.986 | 87.388 | 0.977 | 82.172 | 0.979 | 84.162 | 0.987 | 82.921 | 0.982 | |
| F2 | 0.505 | 0.289 | 1.248 | 0.634 | 1.48 | 0.727 | 0.856 | 0.373 | 0.939 | 0.489 | 1.005 | 0.502 | |
| F3 | 6.465 | 0.929 | 7.786 | 0.934 | 8.225 | 0.943 | 7.23 | 0.909 | 7.463 | 0.926 | 7.433 | 0.928 | |
| F4 | 12.505 | 0.941 | 14.413 | 0.942 | 15.062 | 0.947 | 13.686 | 0.927 | 14.072 | 0.937 | 13.947 | 0.938 | |
| R2 | F0 | 27.355 | 0.998 | 29.652 | 0.991 | 30.869 | 0.988 | 30.294 | 0.991 | 44.997 | 0.957 | 32.633 | 0.985 |
| F1 | 42.053 | 0.973 | 45.237 | 0.984 | 47.04 | 0.985 | 46.264 | 0.988 | 50.292 | 0.985 | 46.177 | 0.983 | |
| F1.5 | 70.823 | 0.986 | 75.722 | 0.973 | 78.696 | 0.977 | 77.523 | 0.979 | 83.722 | 0.973 | 77.297 | 0.977 | |
| F2 | 11.955 | 0.892 | 13.087 | 0.856 | 13.89 | 0.883 | 13.528 | 0.885 | 33.863 | 0.824 | 17.264 | 0.868 | |
| F3 | 33.116 | 0.925 | 35.458 | 0.9 | 37.172 | 0.917 | 36.514 | 0.918 | 39.538 | 0.902 | 36.359 | 0.912 | |
| F4 | 59.316 | 0.932 | 63.538 | 0.908 | 44.365 | 0.947 | 65.374 | 0.925 | 70.328 | 0.909 | 60.584 | 0.924 | |
| Diffusion | |||||||||||||
| R1 | D1 | 118.57 | 0.967 | 131.078 | 0.971 | 135.31 | 0.971 | 127.553 | 0.967 | 130.62 | 0.972 | 128.626 | 0.969 |
| D2 | 248.21 | 0.971 | 273.597 | 0.974 | 282.243 | 0.974 | 266.638 | 0.971 | 272.99 | 0.975 | 268.735 | 0.973 | |
| D3 | 125.52 | 0.972 | 138.702 | 0.975 | 143.175 | 0.975 | 134.994 | 0.971 | 138.24 | 0.975 | 136.126 | 0.973 | |
| D4 | 250.27 | 0.972 | 275.858 | 0.974 | 284.571 | 0.975 | 268.841 | 0.971 | 275.25 | 0.975 | 270.958 | 0.973 | |
| R2 | D1 | 64.501 | 0.999 | 69.251 | 0.993 | 71.777 | 0.991 | 70.687 | 0.993 | 76.637 | 0.994 | 70.57 | 0.994 |
| D2 | 145.245 | 0.998 | 155.28 | 0.993 | 160.69 | 0.992 | 158.481 | 0.994 | 171.01 | 0.993 | 158.141 | 0.994 | |
| D3 | 152.121 | 0.998 | 162.55 | 0.992 | 168.25 | 0.991 | 165.955 | 0.993 | 178.99 | 0.992 | 165.573 | 0.993 | |
| D4 | 76.523 | 0.998 | 82.005 | 0.991 | 85.002 | 0.989 | 83.746 | 0.992 | 90.631 | 0.991 | 83.581 | 0.992 | |
| Nucleation and growth | |||||||||||||
| R1 | N1.5 | 38.874 | 0.968 | 43.441 | 0.972 | 44.974 | 0.973 | 42.034 | 0.967 | 43.089 | 0.973 | 42.482 | 0.97 |
| N2 | 26.896 | 0.962 | 30.276 | 0.968 | 31.401 | 0.968 | 28.185 | 0.961 | 29.938 | 0.968 | 29.339 | 0.965 | |
| R2 | N1.5 | 24.772 | 0.993 | 26.845 | 0.980 | 28.015 | 0.981 | 27.477 | 0.985 | 30.112 | 0.981 | 27.444 | 0.984 |
| N2 | 16.131 | 0.991 | 17.647 | 0.975 | 18.502 | 0.976 | 18.083 | 0.983 | 20.022 | 0.977 | 18.077 | 0.98 | |
| Phase interfacial reaction | |||||||||||||
| R1 | S1 | 58.705 | 0.967 | 65.248 | 0.971 | 67.453 | 0.972 | 63.315 | 0.967 | 64.872 | 0.972 | 63.918 | 0.969 |
| S2 | 60.06 | 0.969 | 66.733 | 0.973 | 68.986 | 0.973 | 64.765 | 0.968 | 66.356 | 0.973 | 65.38 | 0.971 | |
| R2 | S1 | 34.257 | 0.997 | 36.973 | 0.988 | 38.485 | 0.987 | 37.729 | 0.99 | 41.225 | 0.988 | 37.733 | 0.99 |
| S2 | 36.755 | 0.996 | 39.622 | 0.987 | 41.21 | 0.986 | 40.507 | 0.989 | 44.131 | 0.987 | 40.445 | 0.989 | |
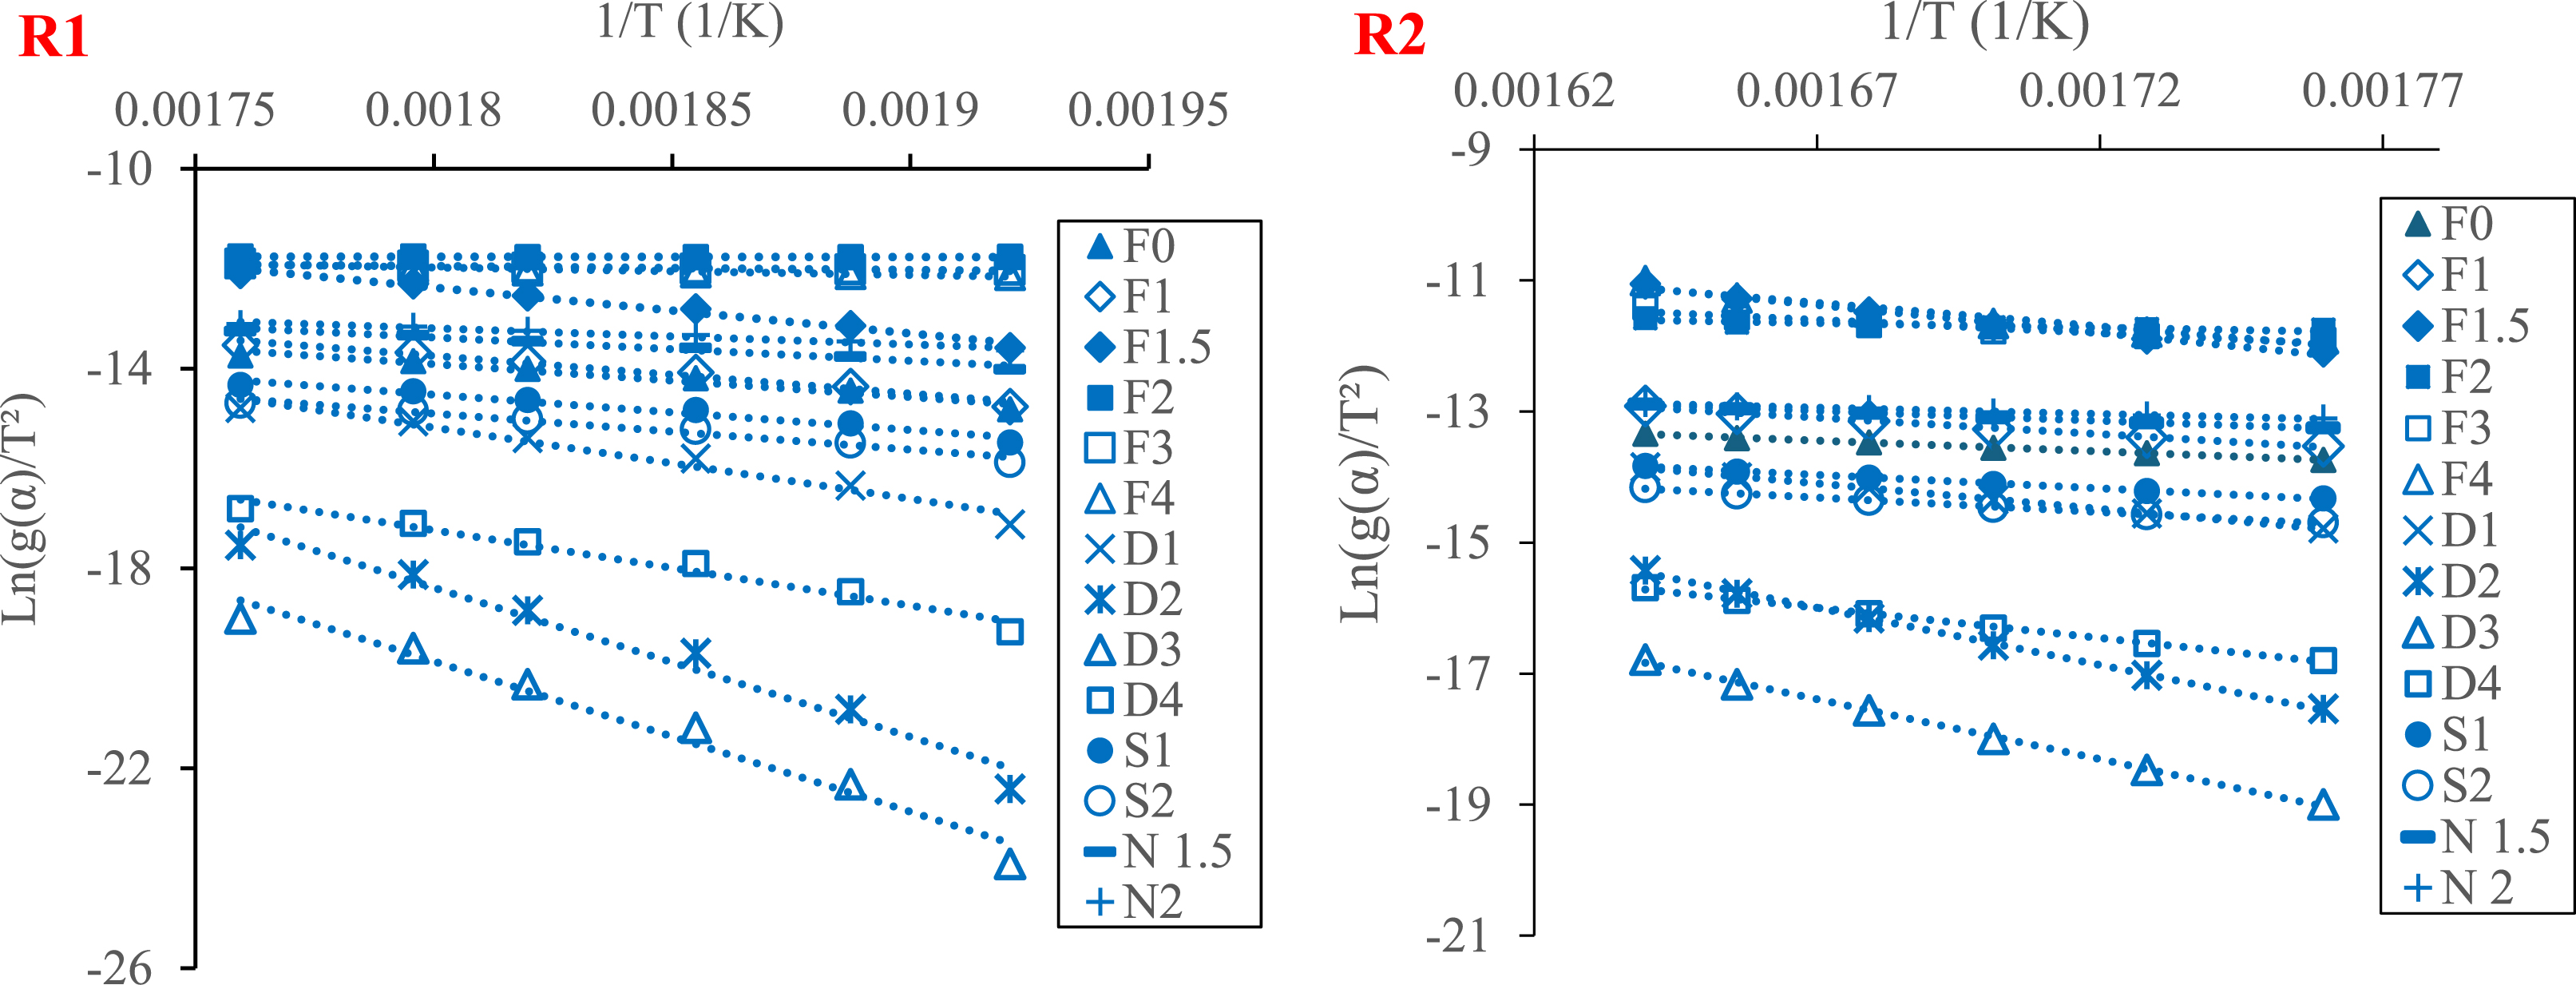
Coats–Redfern plots for pyrolysis of PA (for Regions R1 and R2 and 𝛽 = 10 °C/min).
In R1, the average Ea-value obtained from the application of the diffusion model D3 (about 136 kJ/mol) is the closest value to that obtained by KAS and OFW models (about 158 kJ/mol), with R2 equal to 0.9737, which shows that three-dimensional diffusion is responsible for the reaction of pyrolysis in Region 1. In R2, Ea-values obtained from the diffusion models D2 and D3 are closest to the values obtained from KAS and OFW models, with an R2-value nearly equal to 1. As a result, the most appropriate mechanism of raw PA pyrolysis in R2 is two- and three-dimensional diffusion described by Valensi and Ginstling–Brounshtein equations. Overall, the results suggest that PA pyrolysis is governed by diffusion mechanism across all regions. This mechanism is described as a solid-state reaction that often takes place between crystal lattices or with molecules that must enter lattices where motion is limited and may depend on lattice defects [2]. This result is also observed in the investigation conducted by Bongomin et al. [4] on the thermal behavior of coffee husk, ground shell, Macadamia nutshell, rice husk, and tea waste. They conclude that pyrolysis is predominately governed by different diffusion mechanisms in all regions, which reflect the complex thermal decomposition of these biomasses. A similar study was also conducted by Raza and Abu-Jdayil [69] on date seeds and cashew shells. They found that the pyrolysis mechanism of these biomasses is described by two diffusion models: Ginstling–Brounshtein and Jander models.
However, Mabrouki et al. [70] carried out a study on Ziziphus wood, date palm trunk, date palm leaflets, olive stones, vine stems, and almond shell. They reported that the pyrolysis of these biomasses could be described by a first-order chemical reaction model (F1) in R1 and second- and third-order chemical reaction models (F2, F3) in R2. Ahmad et al. [52], though, studied Typha latifolia pyrolysis; they showed that diffusion played a key role in Region 1, but Region 2 is governed by second- and third-order reaction models.
4. Conclusion
In this work, the pyrolysis behavior of Phragmites australis was investigated using TGA carried out at different heating rates (10, 20, 30, 40, and 50 °C/min). This analysis shows that PA pyrolysis occurs in three stages (the release of water molecules, hemicellulose and cellulose decomposition, and lignin decomposition). In addition, the activation energy values obtained by the OFW and KAS models are approximately equal, with a minimal deviation of approximately 1%, indicating high reliability of the results (with an average value of 157.72 kJ/mol). The pre-exponential factors obtained at different heating rates are in the range of 2.88 × 10¹¹–6.4 × 10¹¹ s−1, which shows the dominance of cellulose decomposition and the complexity of this biomass. Thermodynamic analysis shows that this reaction is endothermic, non-spontaneous, and it takes place at low speed and with high thermodynamic stability. Moreover, the CR method was used to estimate the reaction mechanism. It was found that the diffusion model (D3) characterized by the Ginstling–Brounshtein equation is the most appropriate mechanism in Region 1. However, in Region 2, the reaction mechanism can be described by two models: Ginstling–Brounshtein (D3) and Valensi (D2). All the results obtained from this study show that PA is an interesting source of thermal energy production. It is a promising energy feedstock and is also useful for biochar and activated carbon production with ecological and economic benefits, especially for liquid effluent treatment.
Greek symbols
| 𝛼 | conversion rate (−) |
| 𝛽 | heating rate (°C⋅min−1) |
| ΔH | enthalpy variation (kJ⋅mol−1) |
| ΔG | Gibbs free energy (kJ⋅mol−1) |
| ΔS | entropy variation (J⋅mol−1⋅K−1) |
Nomenclature
| A | pre-exponential factor (s−1) |
| CR | Coats–Redfern |
| DTG | derivative/differential thermogravimetric curve |
| Ea | activation energy (kJ⋅mol−1) |
| EDS | energy-dispersive X-ray |
| FC | fixed carbon (%) |
| FTIR | Fourier transform infrared |
| f(𝛼) | function of reaction mechanism |
| g(𝛼) | complex integral function |
| h | Planck constant (1.38 × 10⁻²³ m2⋅kg/s2⋅K−1) |
| KAS | Kissinger–Akahira–Sunose |
| KB | Boltzmann constant (6.626 × 10⁻³⁴ m2⋅kg⋅s−1) |
| m0 | initial mass (kg) |
| mf | final mass (kg) |
| m | mass at given time t (kg) |
| OFW | Ozawa–Flynn–Wall |
| PA | Phragmites australis |
| P(x) | temperature integral |
| R | universal gas constant (8.314 J⋅mol−1⋅K−1) |
| R1 | Region 1 |
| R2 | Region 2 |
| SEM | scanning electronic microscope |
| T | temperature (°C) |
| T0 | initial temperature (°C) |
| Tf | final temperature (°C) |
| Tp | maximum temperature (°C) |
| TGA | thermogravimetric analysis |
| TG | weight loss |
| t | time (s) |
| VM | volatile matter (%) |
Declaration of interests
The authors do not work for, advise, own shares in, or receive funds from any organization that could benefit from this article, and have declared no affiliations other than their research organizations.
Acknowledgment
This work was supported by the Ministry of Higher Education and Scientific Research in Tunisia.