


 CC-BY 4.0
1. Introduction
The construction industry is facing a growing challenge in balancing development and environmental responsibility. Researchers are actively exploring alternative binders, with alkali-activated concrete (AAC) emerging as a viable and hopeful resolution. AAC utilizes industrial byproducts such as fly ash and slag, in turn reducing CO2 emissions [1, 2]. The expanding scope of modern industrial operations produces significant amounts of waste materials, presenting substantial environmental and economic difficulties. The proliferation of industrial waste generated by modern society is increasing at a rapid pace, and therefore advanced methods are required to gather and repurpose these substances [3]. Due to the inadequacy of landfills and the rising costs of disposal, resource conservation is gaining popularity in developed countries. Roads, which necessitate a substantial quantity of aggregates, serve as a pragmatic avenue for recycling waste materials. Several waste materials may be recycled and then used to build roads. Some of these resources include broken concrete, steel slag, municipal solid waste, incinerator ash, recovered asphalt pavement, nonferrous slag, and discarded plastic fibers or granules [4]. In pavement construction applications, these supplementary materials have been utilized as aggregates or mineral fillers [5]. Marathe et al. [6] reported that air-cured AAC performed better when compared to ordinary Portland cement concrete (OPCC) mixes. Mithun et al. [7] showed that AAC mixes that are produced with a fractional replacement of fine aggregates by copper slag provided satisfactory performance, thereby paving the way for the replacement of aggregates in AAC. The construction and demolition (C&D) sector generates three billion metric tons of waste each year (predominantly consisting of nonhazardous and inactive materials) [8]. Waste from C&D operations makes waste management issues more severe by converting valuable land into dump sites and in turn increase the cost of landfills [9, 10, 11]. However, this seemingly innocuous waste stream harbors substantial potential for resource conservation and the implementation of a circular economy. The use of C&D waste (used as recycled concrete aggregates [RCAs]) as a substitute for natural coarse aggregates (NCAs) is advantageous for mitigating the environmental concerns brought on by the construction sector, and can potentially save up to 60% of NCA [12]. Using recycled aggregates in concrete composite leads to a 28% drop in carbon dioxide emissions as a result of both reduced energy consumption during production and lower transportation emissions when reprocessing facilities for recycling are in close proximity [13]. Recent studies have delved into incorporating RCA into AAC mixtures. Research by Yang et al. [14] examined how RCA affects the mechanical characteristics of AAC. Aggarwal et al. [15] explored methods for converting concrete waste into a usable AAC binder. RCA offers a dual benefit: reducing waste sent to landfills and conserving natural aggregates. Recent studies have shown that the incorporation of RCA into AAC can induce mechanical properties comparable to natural aggregate concrete while at the same time enhancing sustainability. These studies highlight the potential of AAC for reducing reliance on virgin materials and C&D waste.
Foundry sand, commonly composed of silica sand or lake sand, is utilized in the fabrication of cores and molds employed in the production of nonferrous and ferrous metal castings [3, 16, 17]. When it is not in use anymore, it is classified as waste foundry sand (WFS) and can be utilized to produce a desirable quality of concrete and also as a construction material [18]. In concrete, WFS can be used as a fractional replacement for ordinary sand to attain similar levels of strength. WFS is characterized by its fine granularity and high silica content, making it suitable as a fractional replacement for natural sand in concrete mixtures [19]. Incorporating WFS into AAC helps in creating high-performance concrete while also addressing the issue of foundry waste disposal [20]. Although Sithole et al. [21] explored the use of WFS in traditional concrete production, research on its use in AAC remains limited. Sheshadri et al. [18] reported that WFS can be used in AAC up to a maximum limit of 20% without any compromise in strength properties. This was confirmed by microstructure analysis.
Conventional road construction methods heavily depend on NCA, which results in environmental deterioration and nonsustainable depletion of resources. Therefore, the inclusion of recycled/waste materials as road construction materials has become a promising approach to reducing these negative effects [22]. RCA and WFS are among the most investigated alternative materials, and provide noteworthy financial and environmental advantages [23, 24]. Reusing RCA not only preserves primary resources but also reduces the volume of waste that is dumped in landfills. Additionally, the use of WFS promotes more environmentally friendly construction practices and lowers the expenses associated with waste disposal. Despite the promising potential of RCA and WFS in AAC, the literature reveals substantial gaps. First, even though there are studies on RCA and WFS individually, limited research explores their combined effect in AAC formulations. Understanding the synergistic effects of these materials could lead to more efficient and sustainable concrete mixtures. The goal of this study is to close the existing knowledge gap by conducting an exhaustive examination of the impact of integrating both RCA and WFS into a type of AAC mixture. The research assesses the effects of various levels of the replacement of recycled materials on fresh mechanical properties of slag-based AAC (viz., alkali-activated slag concrete [AASC]). The study uses a systematic experimental method and performs an analysis to study the significance of these materials in AASC through statistical (linear regression) analysis. The adaption of the regressor model predicts the compressive strength for the given mix design, thereby reducing the trials required for the optimization of the mix, in turn promoting resource efficiency. By addressing these objectives, this study seeks to advance the field of sustainable construction materials and provide practical insights for the large-scale adoption of AAC in the construction industry.
2. Materials and methodology
This research utilized the following ingredients: ground granulated blast furnace slag (GGBS), the properties of which are presented in Table 1, and river sand fine aggregate (RSFA). RSFA has a specific gravity of 2.62 and water absorption of 2.22% according to IS 2386: Part 3 [25], it belongs to zone II as per IS 383: 1970 [26], and it has a fineness modulus of 3.91 as per IS 2386: Part 1 [27]. NCA has a specific gravity of 2.71, and water absorption of 0.28% determined in accordance with IS 2386: Part 3 [25]; its fineness modulus is 6.13 according to IS 2386: Part 1 [27]. Similarly, WFS has a specific gravity of 2.4 and water absorption of 3.81%; it does not belong to any zone as it has a unimodal particle size distribution in the range of 150–300 μm. The specific gravity of the RCA used in the study is 2.48, its fineness modulus is 6.57, and water absorption is 4.87%. The alkaline activator solution (AAS) consists of sodium hydroxide (NaOH) flakes with a purity level of 97–98%. Additionally, it includes liquid sodium silicate (LSS), the composition of which is ascertained as per IS 14212: 1995 [28]. The specific gravity of the LSS is 1.57, and its activator modulus (Ms), which measures the proportion of SiO2 to Na2O, is 2.23. The AAS was prepared in order to obtain the desired Ms value by dissolving NaOH flakes in LSS. In order to modify the ratio of water to the binder, laboratory tap water was incorporated. Clean water, meeting the conditions specified in IS 456: 2000 [29], was used in the production of concrete.
Properties of GGBS
| Characteristics | F | IR | Mg | SS | S | LOI | Mn | Cl | G | M | CaO + MgO + SiO2 | CaO + MgO/SiO2 | CaO/SiO2 |
|---|---|---|---|---|---|---|---|---|---|---|---|---|---|
| Requirements as per IS: 12089-1987 | Min 275 | Max 1.5 | Max 14.0 | Max 2.0 | Max 2.5 | Max 3.0 | Max 2.0 | Max 0.1 | Min 67.0 | Max 1.0 | Max 66.66 | >1.00 | <1.40 |
| Test values | 360 | 0.3 | 8.32 | 0.18 | 0.26 | 0.05 | 0.08 | 0.021 | 92.84 | 0.09 | 75.96 | 1.21 | 0.96 |
F: fineness (m2/kg); IR: insoluble residue; (%), Mg: magnesia content (%); SS: sulfide sulfur (%); S: sulfite content (%); LOI: loss of ignition (%); Mn: manganese content (%); Cl: chloride content (%); G: glass content (%); M: moisture content (%).
The mix proportion for the standard OPCC employed in highways was developed according to the prescribed methods for creating traditional OPCC with a design strength for highways and a desired workability range of 25–75 mm slump, which is equivalent to a compaction factor value in the range of 0.78–0.85, in accordance with the specifications outlined in IRC: 44-2017 [30]. Concrete workability is indicated by the compaction factor value; a higher value represents greater workability, which in turn results in better compaction of concrete, improved density, and enhanced mechanical performance. This procedure aligns with the standard parameters for concrete formulation that are outlined in the Indian standard IS 10262: 2019 [31]. The original mix ratios were adjusted based on studies in the literature [2, 6, 32] in order to obtain the required AASC mix; the final water-to-binder (w/b) ratio was fixed at 0.36, the AAS Ms value at 1.25, and the Na2O concentration at 4.0% of the gross binder mass. Specific details for the first composition of the AASC mix are outlined in Table 2. This composition meets the criteria regarding both strength and workability, which are required for quality pavement (highway) composite mixes.
Preliminary mix proportion for the slag-based alkali-activated concrete mix
| Notation | GGBS | Ms | w/b | LSS | NaOH | NCA | RSFA | Water |
|---|---|---|---|---|---|---|---|---|
| Unit | kg | Ratio | Ratio | kg | kg | kg | kg | kg |
| A-0-0 | 493 | 1.25 | 0.4 | 75.12 | 11.18 | 1071.4 | 577.84 | 157.56 |
A subsequent study was conducted to evaluate the influence of RCA and WFS on the characteristics of AASC mixes. NCA was substituted with RCA at regular intervals of 25%, starting from 0% up to 100%. RSFA was replaced with WFS at consistent intervals of 5%, starting from 0% up to 30% in the reference mix. Therefore, considering the percentage replacement levels of RCA and WFS along the intervals of replacement, 10 mixes were obtained, including the reference mix. The final optimized mix is considered with 50% RCA and 20% WFS only as represented by the ID A-50-20 mix. Tests were conducted to assess workability, with the compaction factor value being used as a measurement. At the end of the 28 days, experiments were conducted based on density, water absorption, and compressive strength measurements to identify the optimal content of RCA and WFS. The AASC mixes were identified by the abbreviation A-0-0, where A stands for alkali-activated slag-based concrete mixes. The subsequent numbers indicate the proportion of replacement of RCA and WFS with NCA and RSFA, respectively. The optimized AASC blends were then employed for further investigations, including the assessment of split tensile strength (STS) and flexural strength. These measured parameters were then collated to the reference AASC mix. The test results of only the optimized mix are presented in Figure 1.
(a) Variation in compressive strength of optimized AASC mixes. (b) Variation in split tensile and flexural strengths of optimized AASC mixes.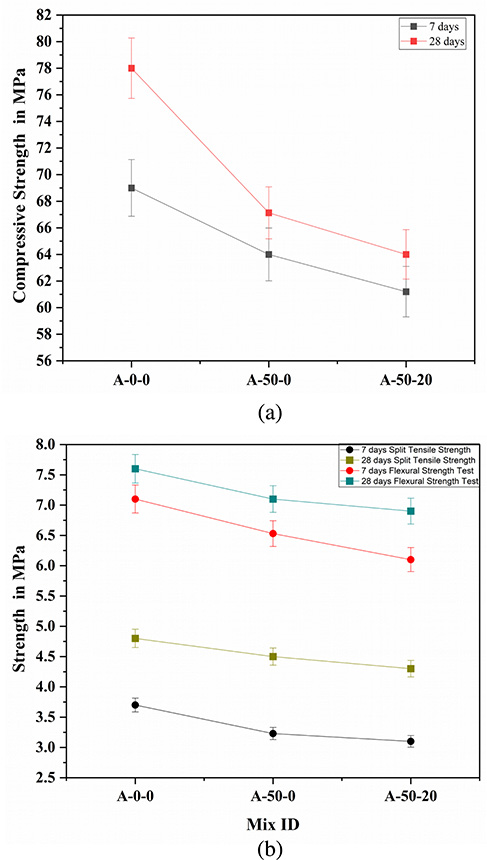
The ingredients were batched and mixed properly to achieve a homogeneous mixture, following the set mix proportion design. The mixing procedure involved the addition of NCA and RCA into the mixer, followed by RSFA, WFS, and GGBS. These materials are run as a dry mix for a couple of minutes before adding the alkaline solution and then in the end, a calculated quantity of water. The specimens employed in this experiment are 10 cm × 10 cm × 10 cm cubes, cylinders with 10 cm diameter and 20 cm height, and 10 cm × 10 cm × 50 cm beams. The specimens were demolded 24 h after the casting procedure. After being subjected to three days of moist curing, the AASC specimens were allowed to air-cure in a laboratory setting at a temperature of 27 ± 30 °C and a relative humidity of 85 ± 10% until the testing date. After the curing process, the cubes and beams were tested to assess their compressive strength and four-point flexural strength, respectively, using the requirements stated in IS 516: 2021 [33]. Furthermore, the cylinders underwent testing to assess their STS in accordance with the requirements outlined in IS 5816-1999 [34]. The test findings were documented at 7 and 28 days of curing periods for the compressive strength, STS, and flexural strength tests, with each data point being the engineered mean of the test results of three individual specimens.
3. Results and discussion
Figure 1 presents illustrations of the test results. The characteristics of hardened and fresh properties of AASC, partially incorporated with RCA and WFS, are analyzed. The study indicates that the optimum percentage replacement of RCA is 50% (A-50-0), whereas for WFS it is 20% (A-50-20).
The calculated values for the compaction factor value, density, water absorption, and volume of permeable voids (VPV) for each mix are as follows: 0.923 (slump: 65 ± 5 mm), 2580 kg/m3, 3.12%, and 8.03% for the A-0-0 mix; 0.893 (slump: 52 ± 5 mm), 2496 kg/m3, 5.13%, and 9.21% for the A-50-0 mix; and 0.866 (slump: 41 ± 5 mm), 2445 kg/m3, 5.79%, and 9.67% for the A-50-20 mix, respectively. The results indicate that a higher proportion of RCA replacement in the AASC mixes is linked to a decrease in compaction factor value, lowered density, increased water absorption, and VPV. Multiple factors might influence the test results, such as the effects of the RCA’s relatively high porous structure [35]. However, the increased calcium ion concentration in RCA affects the formation of the binder gel and the development of additional interfacial zones [36]. The adherence of old porous mortar accelerates the rate at which concrete hardens and reduces the workability of AASC. RCA is closely correlated with the amount of cement mortar that is attached [37]. Moreover, the inclusion of WFS in concrete leads to greater porosity as a result of the particles’ irregular shape and rough texture, which creates interconnected voids within the concrete matrix, in turn increasing the volume of voids per volume of concrete and the water absorption [38, 39]. Moreover, when WFS is utilized as a fractional replacement for RSFA in concrete, it introduces air voids within the concrete particles, thereby lowering the specific density of the material and consequently lowering the concrete’s density [18].
Figure 1 displays the results of the strength test for the optimized AASC systems at 7 and 28 days. The data indicate that an increase in amounts of RCA and WFS causes a decrease in compressive strength of the AASC mixtures. The experimental results provide significant insights into the mechanical performance of concrete mixes at both early and mature stages.
The compressive strength after 28 days of the A-50-0 mix was 67 MPa, which surpasses the target strength for pavement concrete requirements as per the IS 456: 2000 [29] standard. Therefore, this particular concrete mixture can be considered the best option because it maximizes the amount of waste products used while at the same time maintaining the necessary strength. This is in line with the work of Kisan and Sangathan in 2005 and the SP7 guidelines for replacing aggregates in pavement applications. The AASC mix A-50-20 exhibited a compressive strength of 64 MPa at 28 days. This mix is tailored to replace FA with 20% of WFS. It surpasses the target strength necessary for pavement grade concrete according to IS 456: 2000 [29]. The optimized mixes, AS-50-0 and A-50-20, were subjected to additional mechanical strength testing, including STS and flexural strength tests.
The A-50-0 mix demonstrated satisfactory mechanical properties over time. The compressive strength showed a 13.07% increase from 7 days to 28 days while STS exhibited a 2.72% increase over the same period. Additionally, the flexural strength displayed a 7.04% increase from 7 days to 28 days. However, at 28 days, there was a 13.94% decrease in compressive strength, a 6.3% decrease in STS, and a 6.6% decrease in flexural strength when compared to the reference A-0-0 mix. The AS-50-20 mix demonstrated acceptable mechanical properties over time. The compressive strength showed a 4.57% increase from 7 days to 28 days while STS exhibited a 9.67% increase over the same period. Additionally, the flexural strength displayed a 20.3% increase from 7 days to 28 days. However, at 28 days, there was a 4.66% decrement in compressive strength, a 4.44% decrease in STS, and a 0.56% decrease in flexural strength when compared to the optimized A-50-0 mix. The mean values obtained for the modulus of elasticity (MOE) were analyzed. A decrement in MOE is observed upon examination of the outcomes when RCA and WFS are incorporated. The reference mix A-0-0 attained 49.7 GPa. The percentage decrease in MOE for the A-50-20 mix when compared to the A-50-0 mix was 4.66% while for the A-50-0 mix when compared to the reference mix, it was 11.72%. The variation in these mechanical properties can be attributed to the poorer qualities of RCA in comparison to NCA [40], such as lower impact and crushing strengths, and the occurrence of a new interfacial transition zone (ITZ) in addition to the existing one. The diminished compressive strength might be associated with the old adhered mortar on the RCA, which renders the concrete more porous [41]. A potential drawback of RCA is its heightened propensity for irregularity in its behavior when used in composites [42]. The rough texture and uneven shape of WFS particles, when incorporated into concrete, can lead to increased porosity and interconnected voids within the concrete [43]. The RCA concrete typically contains three distinct types of ITZ zones: one situated between the newly applied cement mortar and aggregates; another located between the old and freshly affixed cement mortar; and a third zone within the RCA between the aggregate and old adhered mortar [41]. As a consequence of rapid propagation of innate microcracks in the ITZ, which is subject to a large concentration of stress, the final category is typically the weakest. These microcracks, which are concentrated under high stress, tend to spread quickly. The feeble nature of the contact between aggregate and mortar contributes to the inferior strength of recycled aggregate concrete when compared to natural aggregate concrete [44, 45].
Moreover, WFS has irregular particle shapes and surface characteristics that are dissimilar from those of typical fine aggregates because of their unimodal particle size distribution [18]. These irregularities contribute to a less uniform stress distribution within the matrix as well as discontinuities and stress concentration points that result in reduced bond strength between the matrix and the aggregate. This results in areas within the concrete matrix that are weakened and more likely to break under flexural loading, which in turn reduces bond strength and compromises the material’s resilience to bending forces. Therefore, with an increment in the proportion of WFS, the mechanical performance of AASC is diminished.
4. Statistical analysis
The compressive strength of concrete is a pivotal feature in ascertaining the structural integrity and performance of any concrete structure. This analysis delivers a comprehensive understanding of the individual influences of several factors on the compressive strength of concrete. The utilization of simple linear regression (SLR) provides an understanding of the specific impact of each independent variable, such as GGBS, NaOH, LSS, water, NCA, RCA, RSFA, and WFS. The objective is to unravel the intricate relationships of these variables and to offer crucial insights for optimizing AASC mixes. The current methodology centers on the application of SLR for the meticulous examination of each independent variable’s influence on the compressive strength of AASC. For each variable of interest, a dedicated SLR analysis is conducted, treating compressive strength as the dependent variable and the chosen factor as the sole predictor. This targeted approach enables a focused understanding of the linear relationship between a specific factor and compressive strength. The SLR model is formulated as follows:
| (1) |
CS is the predicted compressive strength;
β0 represents the intercept;
β1 is the coefficient of independent variables;
X1 is the value of independent variables;
ε is the error term capturing unexplained variation.
A large number of datasets were obtained from the experiments performed on the AASC mixes. Initially, the trials were considered at very small intervals, resulting in a total of 15 trial mixes. For each trial mix, 10 test specimens were cast. There were a total of 150 specimens, based on which a large set of data points were obtained. However, since the variations in strength at such small intervals were not significant, they were not incorporated into the experimental results of the research paper but were incorporated into statistical modeling to improve the accuracy of the R-squared value. Data was collected from experimental analysis, each varying the levels of the independent variables under consideration, that is, NCA, RCA, RSFA, and WFS were systematically varied to encompass a broad spectrum of scenarios. This dataset serves as the foundation for the SLR analyses, enabling the unique impact of each factor on the compressive strength of AASC to be discerned.
The outcomes from the SLR analysis reveal insightful patterns between individual factors and the compressive strength of AASC. In the analysis for NCA, the estimated intercept is 51.280958, suggesting a baseline compressive strength when NCA is zero. The coefficient for NCA is 0.024950, indicating that for each unit increment in NCA, the compressive strength is anticipated to rise by 0.024950 units. Both coefficients are highly statistically significant, affirming the strength and significance of the linear relationship. For RCA, the estimated intercept of 79.802711 represents the expected compressive strength when the RCA is zero. The coefficient for RCA is −0.026315, signifying a decrease in compressive strength by −0.026315 units for each unit increase in the RCA. Similar to NCA, RCA is highly significant, underlining the robustness of the model. Interpreting the coefficients for FA and WFS, the estimated intercepts of 32.84472 and 70.37998, respectively, represent the baseline compressive strength. The coefficients for FA of 0.09684 and WFS of −0.13476 indicate the expected change in compressive strength for each unit increase in the respective aggregates. All these coefficients are statistically significant and provide meaningful understanding of the associations between compressive strength and the independent variables.
Additionally, substantial R-squared values for both NCA and RCA, of 0.8633 and 0.8632, respectively, emphasize the models’ ability to explain a considerable proportion of the variability in compressive strength. This signifies a robust fit of the models to the data and provides confidence in their predictive capabilities. The interpretation of coefficients for RSFA and WFS similarly highlights their impact on compressive strength, with the R-squared values of 0.4984 and 0.4985 indicating a moderate but still significant explanatory power. In summary, the combination of statistically significant coefficients and high R-squared values underscores the reliability and explanatory strength of SLR models in capturing the relationships between individual factors and compressive strength in AASC mixes. Furthermore, it was observed that variables, namely GGBS, NaOH, LSS, and water, did not exhibit any impact on the dependent variable compressive strength due to their constant values across all observations.
The observed patterns and statistical significance revealed in the SLR analysis provide a foundation for formulating predictive equations that capture relations among individual factors and the compressive strength of concrete. When expressing these relationships in the context of the obtained coefficients, the equations take the following form:
| (2) |
| (3) |
| (4) |
| (5) |
4.1. Assessing model assumptions: residual plots
To determine the precision of the analysis, a number of residual plots were employed to inspect the model assumptions. Residuals versus leverage, residuals versus fitted, Q–Q residuals, and scale–location are all presented in these graphs.
4.1.1. Residuals versus fitted plot
Figure 2 displays the residuals versus fitted plot. This graph is used to verify the linearity and homoscedasticity assumptions of the regression model [46]. The residuals are shown on the vertical axis while the fitted values of the dependent variable, compressive strength, are represented on the horizontal axis. The plot shows the residuals dispersed randomly along the horizontal axis (zero line). This randomness implies that there is no apparent pattern or systematic structure in the residuals, in turn indicating that the relationship between the independent variables (e.g., NCA, RCA, RSFA, WFS) and the dependent variable (compressive strength) is appropriately linear. This satisfies the linearity assumption and confirms that a linear regression model is suitable for this dataset. The residuals do not exhibit any clear forms or trends, and instead are uniformly distributed over the range of fitted values. This uniformity in the spread of residuals indicates that the variance of the residuals is constant across different levels of predicted compressive strength. This observation satisfies the homoscedasticity assumption, suggesting that the model’s predictions are reliable and that the estimated standard errors of the coefficients are valid.
Residuals versus fitted plot.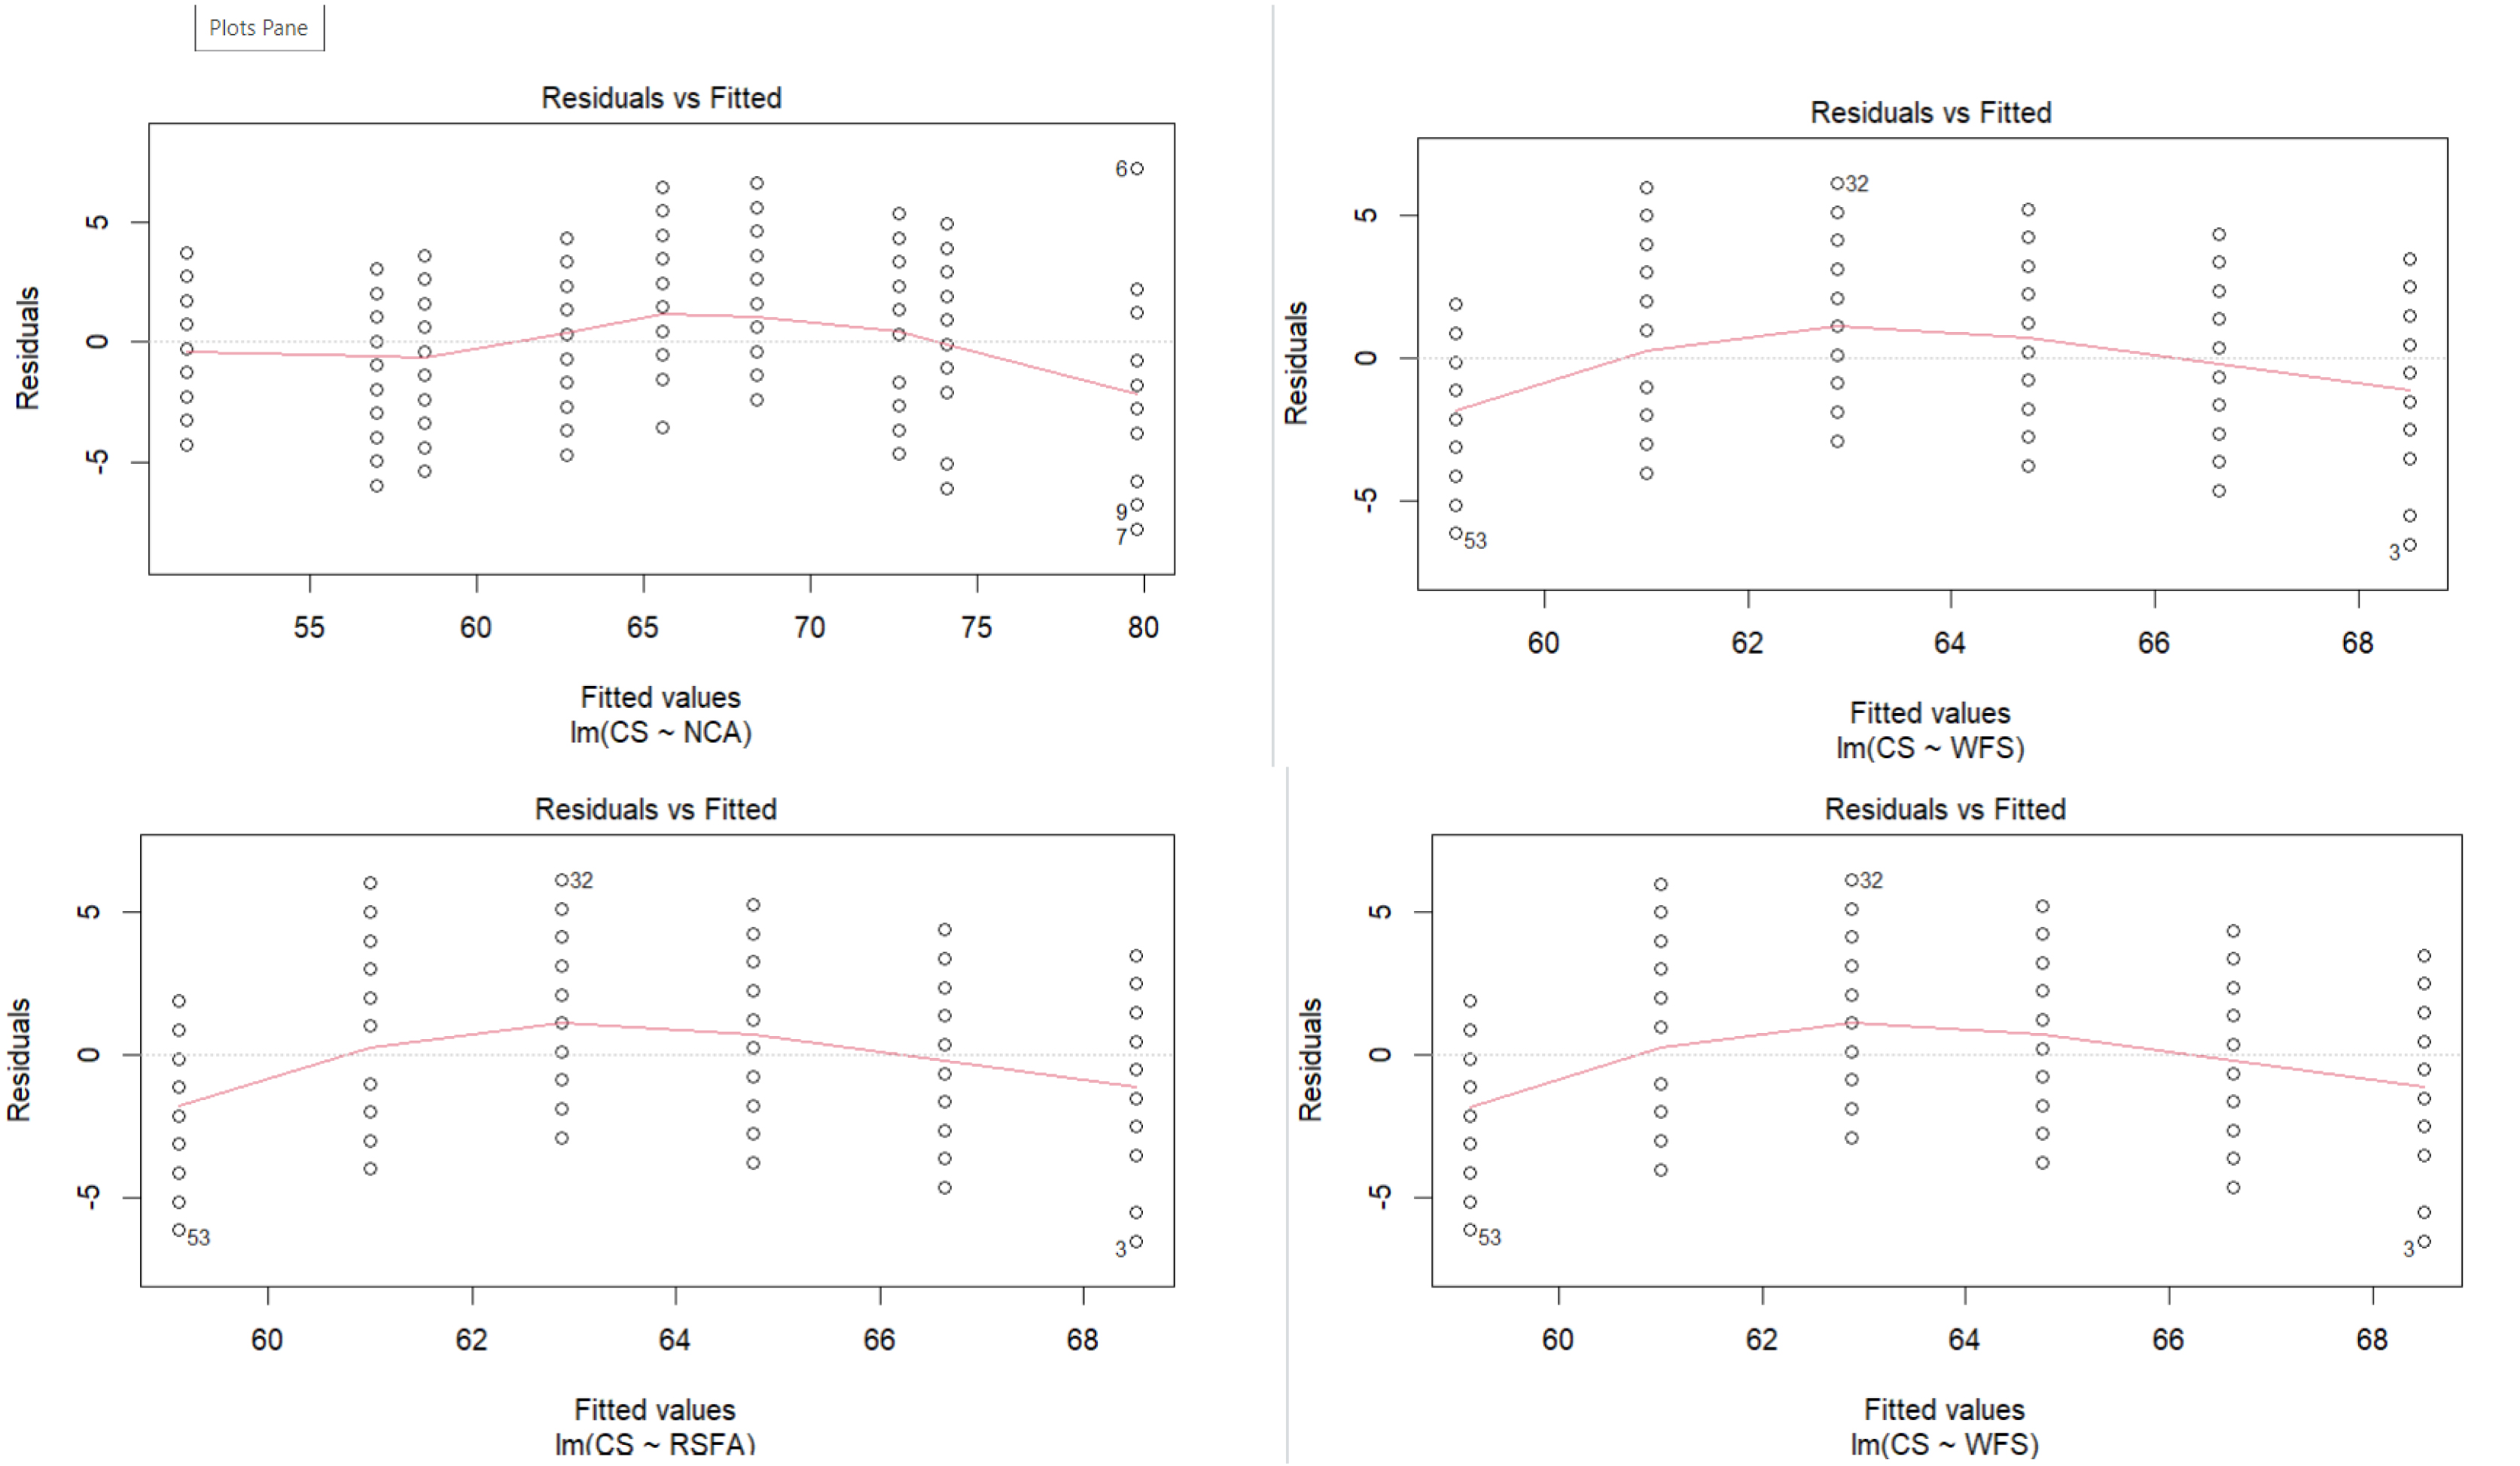
4.1.2. Q–Q residuals
The quantiles of the residuals and the quantiles of a hypothetical normal distribution are compared using the Q–Q plot. This helps to evaluate the normality assumption of the residual [47]. The residuals are assumed to follow a normal distribution if the points are nearly aligned with the 45° reference line. In Figure 3, the 45° reference line is closely followed by the Q–Q plot points, indicating that residuals are roughly normally distributed. The close adherence to the 45° line indicates that the residuals do not deviate significantly from normality, confirming the robustness of the regression model and the reliability of the statistical inferences drawn from it. Normal residuals ensure that the t-tests and F-tests used to determine the significance of the regression coefficients are valid. Non-normal residuals can lead to incorrect p-values, affecting the interpretation of which predictors are significant.
Q–Q residual plot.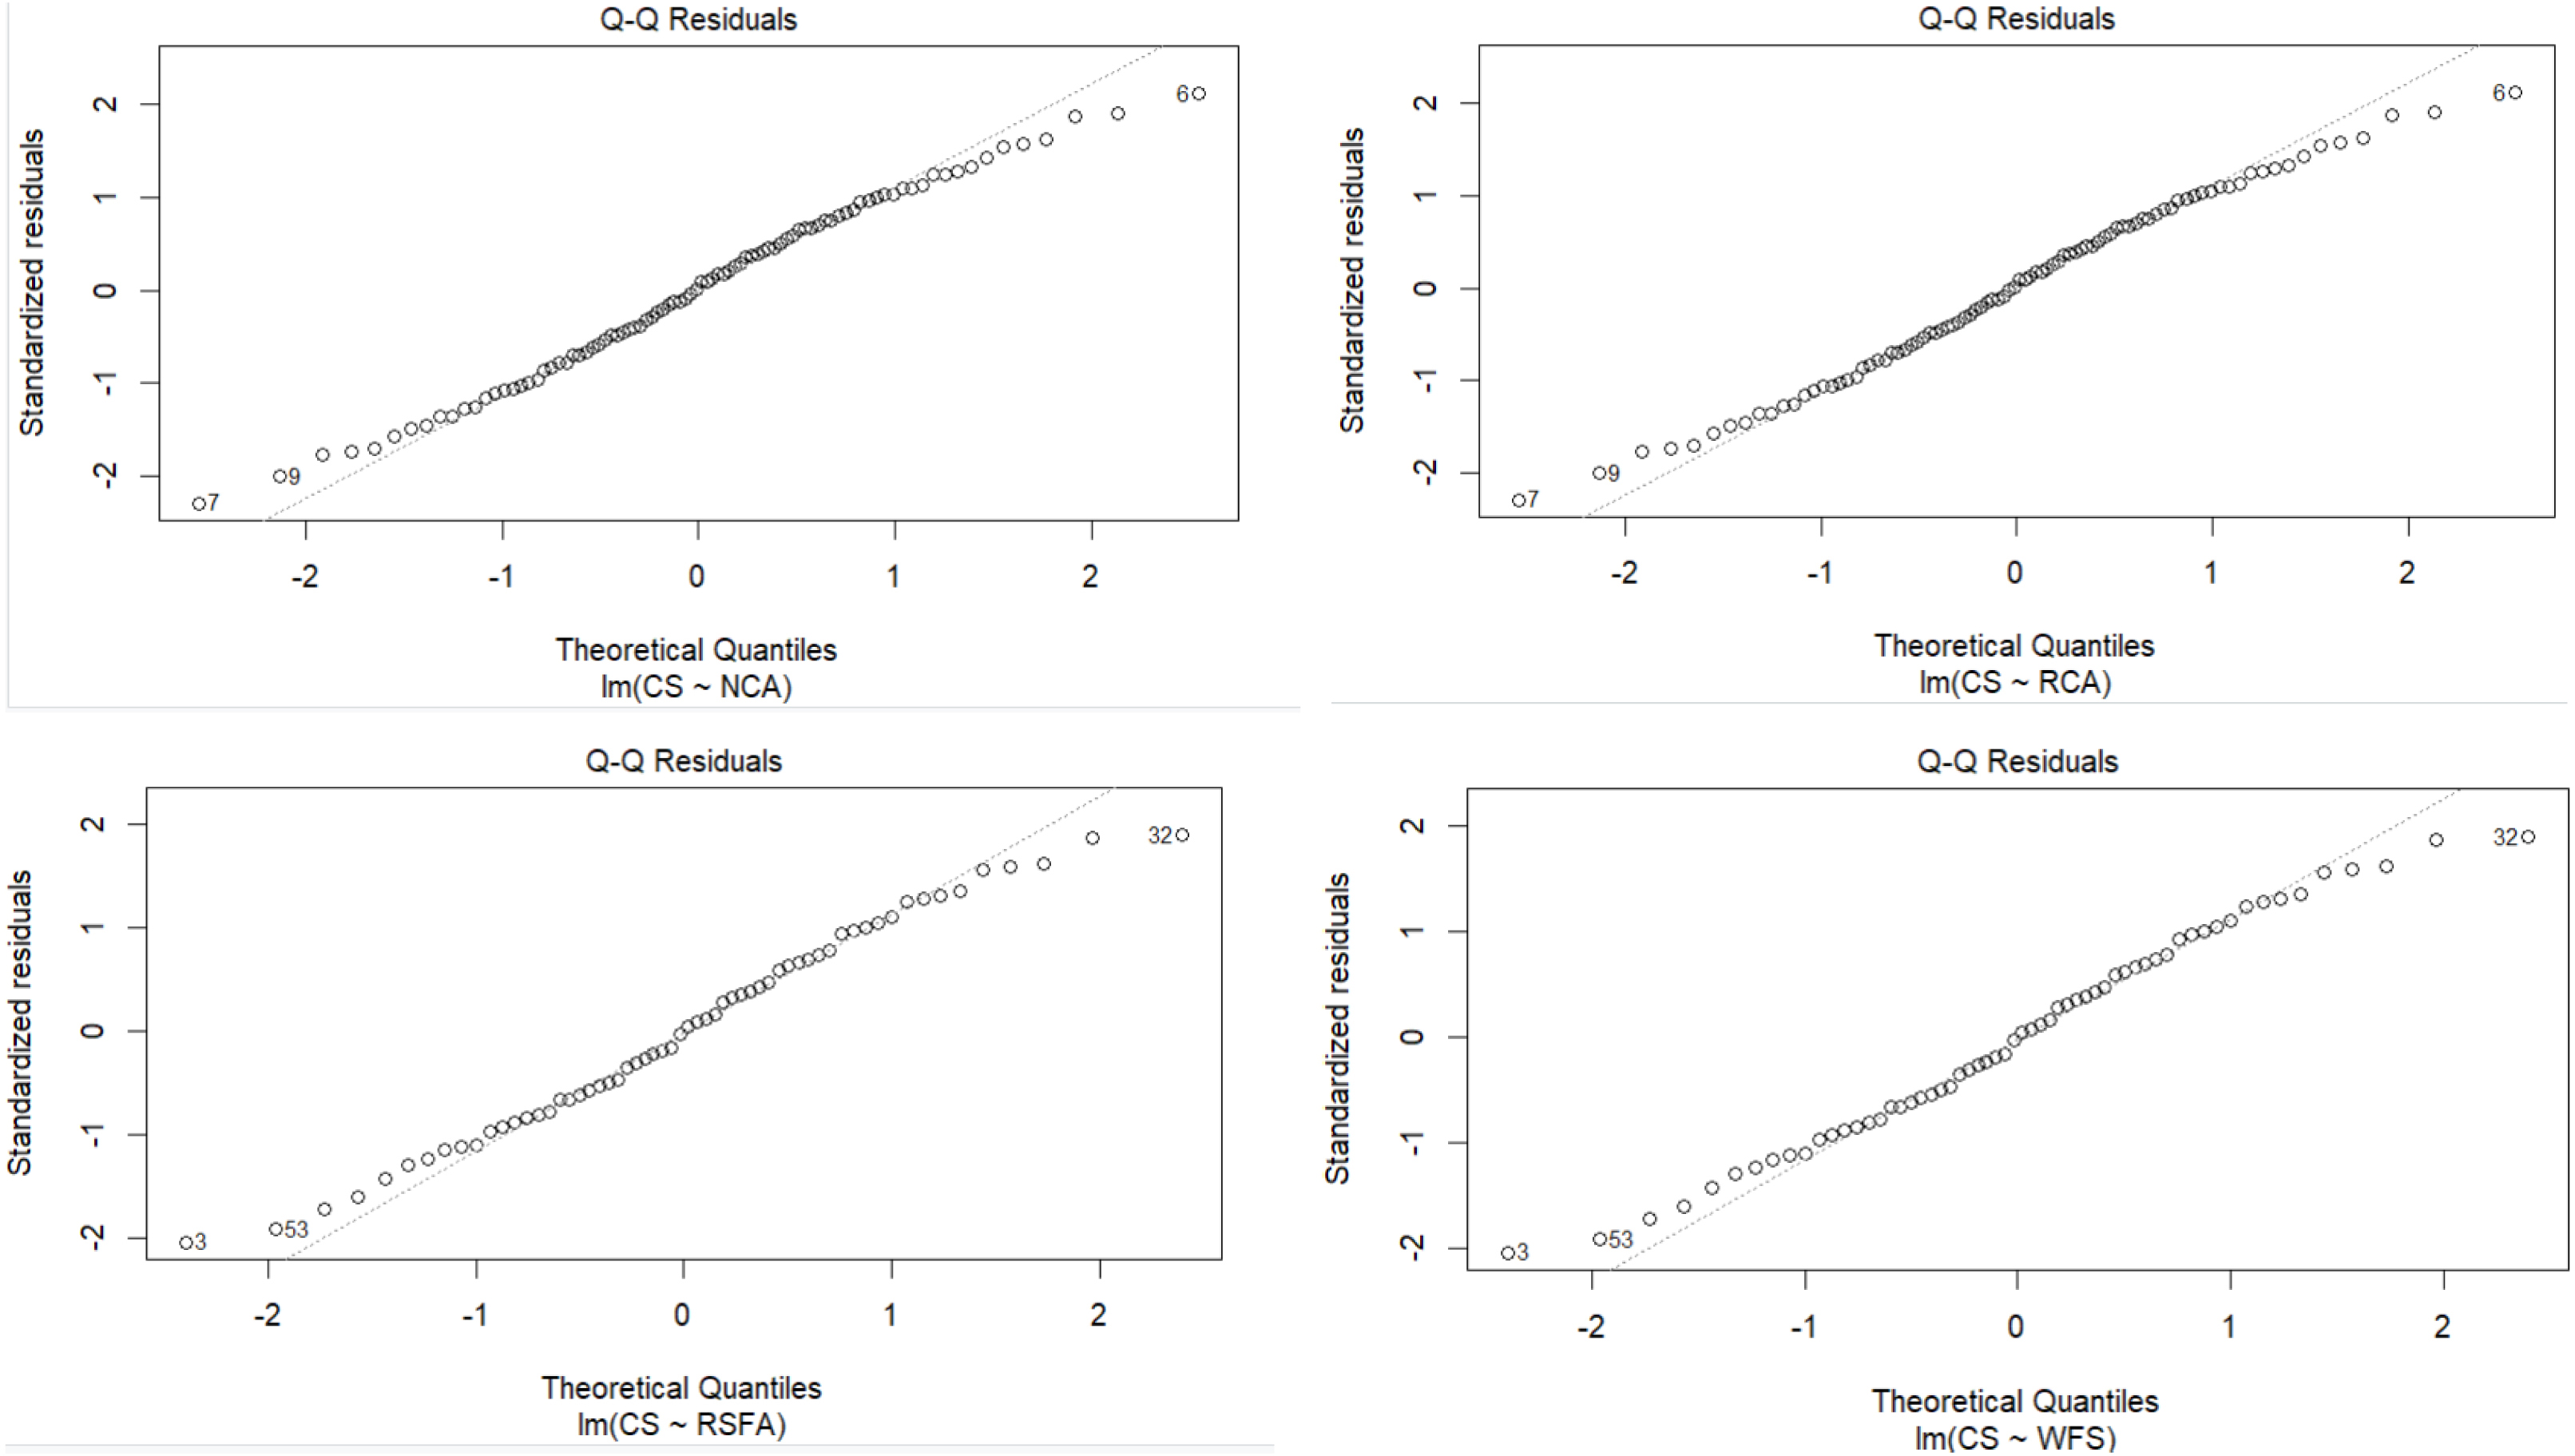
Scale–location plot.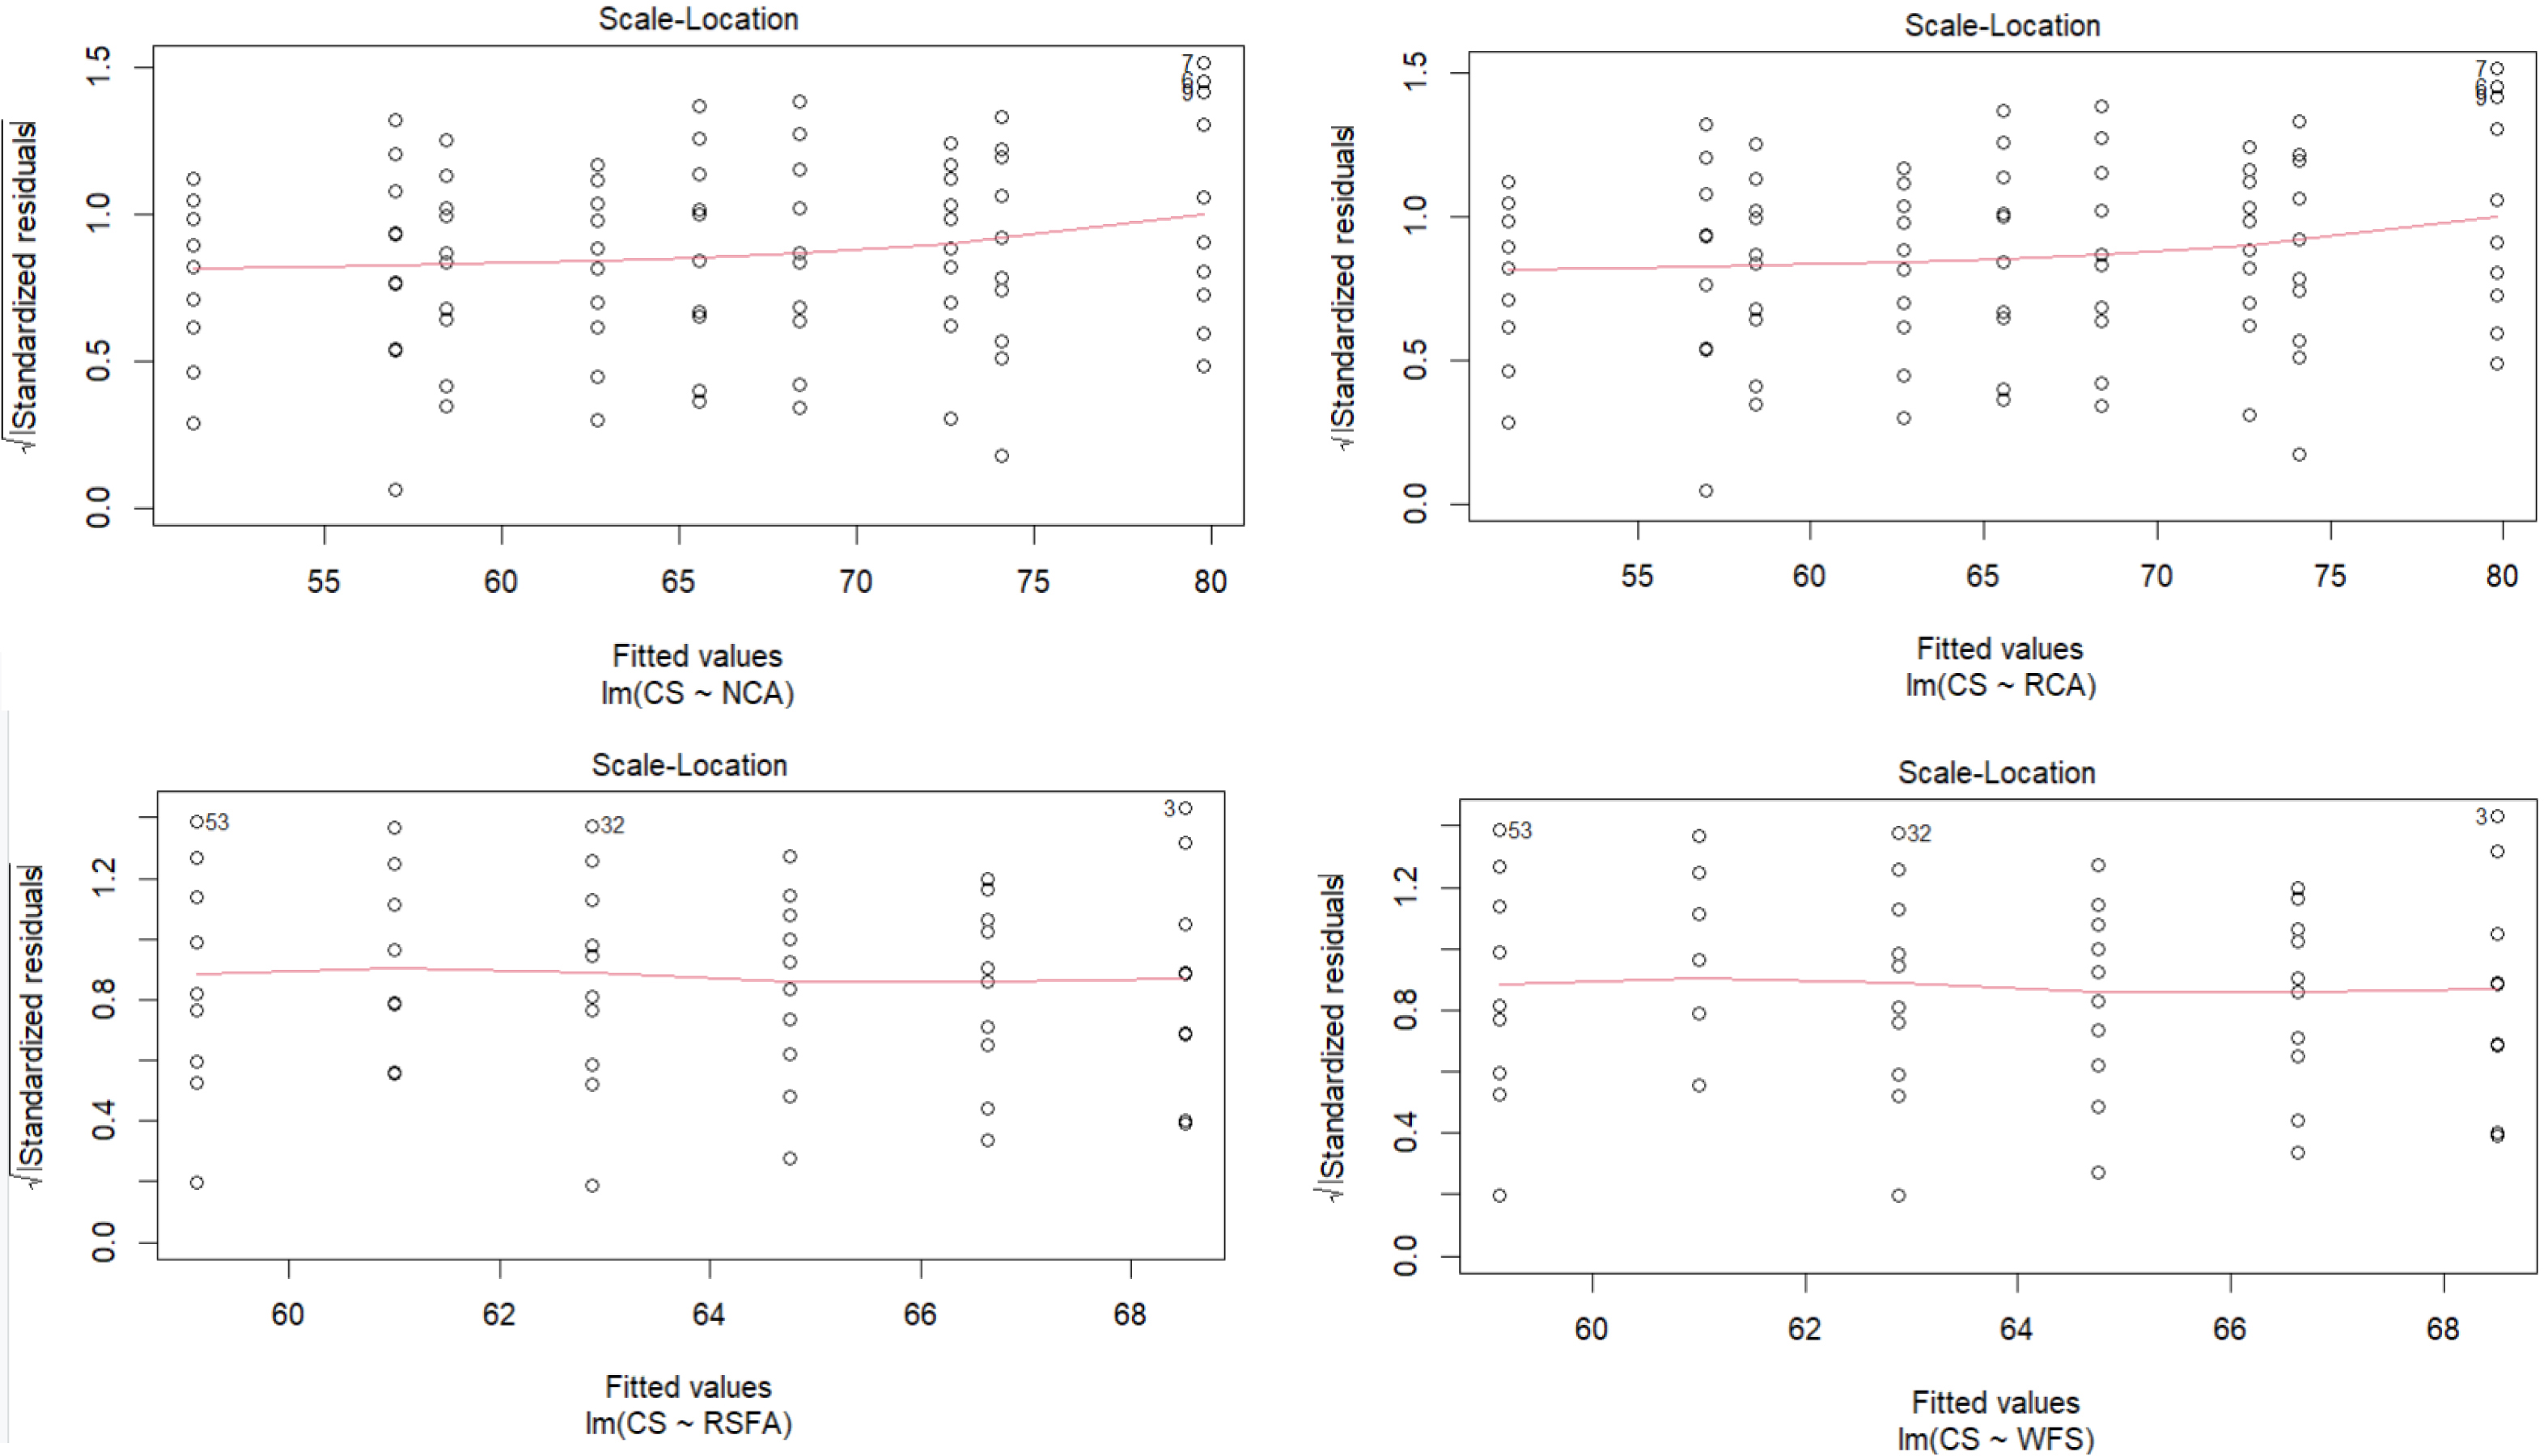
4.1.3. Scale–location plot
The scale–location diagram in Figure 4 is utilized to confirm the regression model’s homoscedasticity assumption. The plot shows the fitted values on the horizontal axis and the square root of the standardized residuals on the vertical axis. Plot points are dispersed at random around a horizontal line. The random scatter shows that the residuals’ distribution across various fitted value levels lacks any discernible structure. The spread of the residuals does not exhibit any obvious pattern or systematic structure, which implies that the variance of the residuals is constant. This shows that the model’s predictions are consistently correct over the whole range of observed data, thereby supporting the homoscedasticity assumption. There is no funnel shape or fanning out of the plot. The residuals’ continuous variance is supported by this fact. Reliable hypothesis tests and confidence intervals are produced when the residuals are uniformly distributed across all fitted value levels, ensuring that the regression coefficients are effectively computed and the standard errors of the coefficients are valid. This result strengthens the robustness of the model and its findings by validating the regression coefficients, standard errors, and related inferential statistics.
4.1.4. Residuals versus leverage plot
The residuals versus leverage plot in Figure 5 was examined to determine which data points have high leverage and also to evaluate how they affect the regression model. The plot displays several high-leverage data points. These points have a large impact on the fitted values because their predictor variable values deviate greatly from the mean. The standardized residuals, which represent each residual’s standard deviation from the mean, are displayed on the plot’s vertical axis. Potential outliers are indicated by points with significant standardized residuals. This study’s residuals versus leverage graph offers important insights into how different data items affect the regression model. The graph aids in detecting significant points that may disproportionately impact the model’s coefficients and overall fit by highlighting high-leverage points and evaluating their standardized residuals. The overall validity and reliability of the regression analysis are supported by the study, which makes sure that a small number of data points do not have an excessive impact on the model’s coefficients.
Residuals versus leverage plot.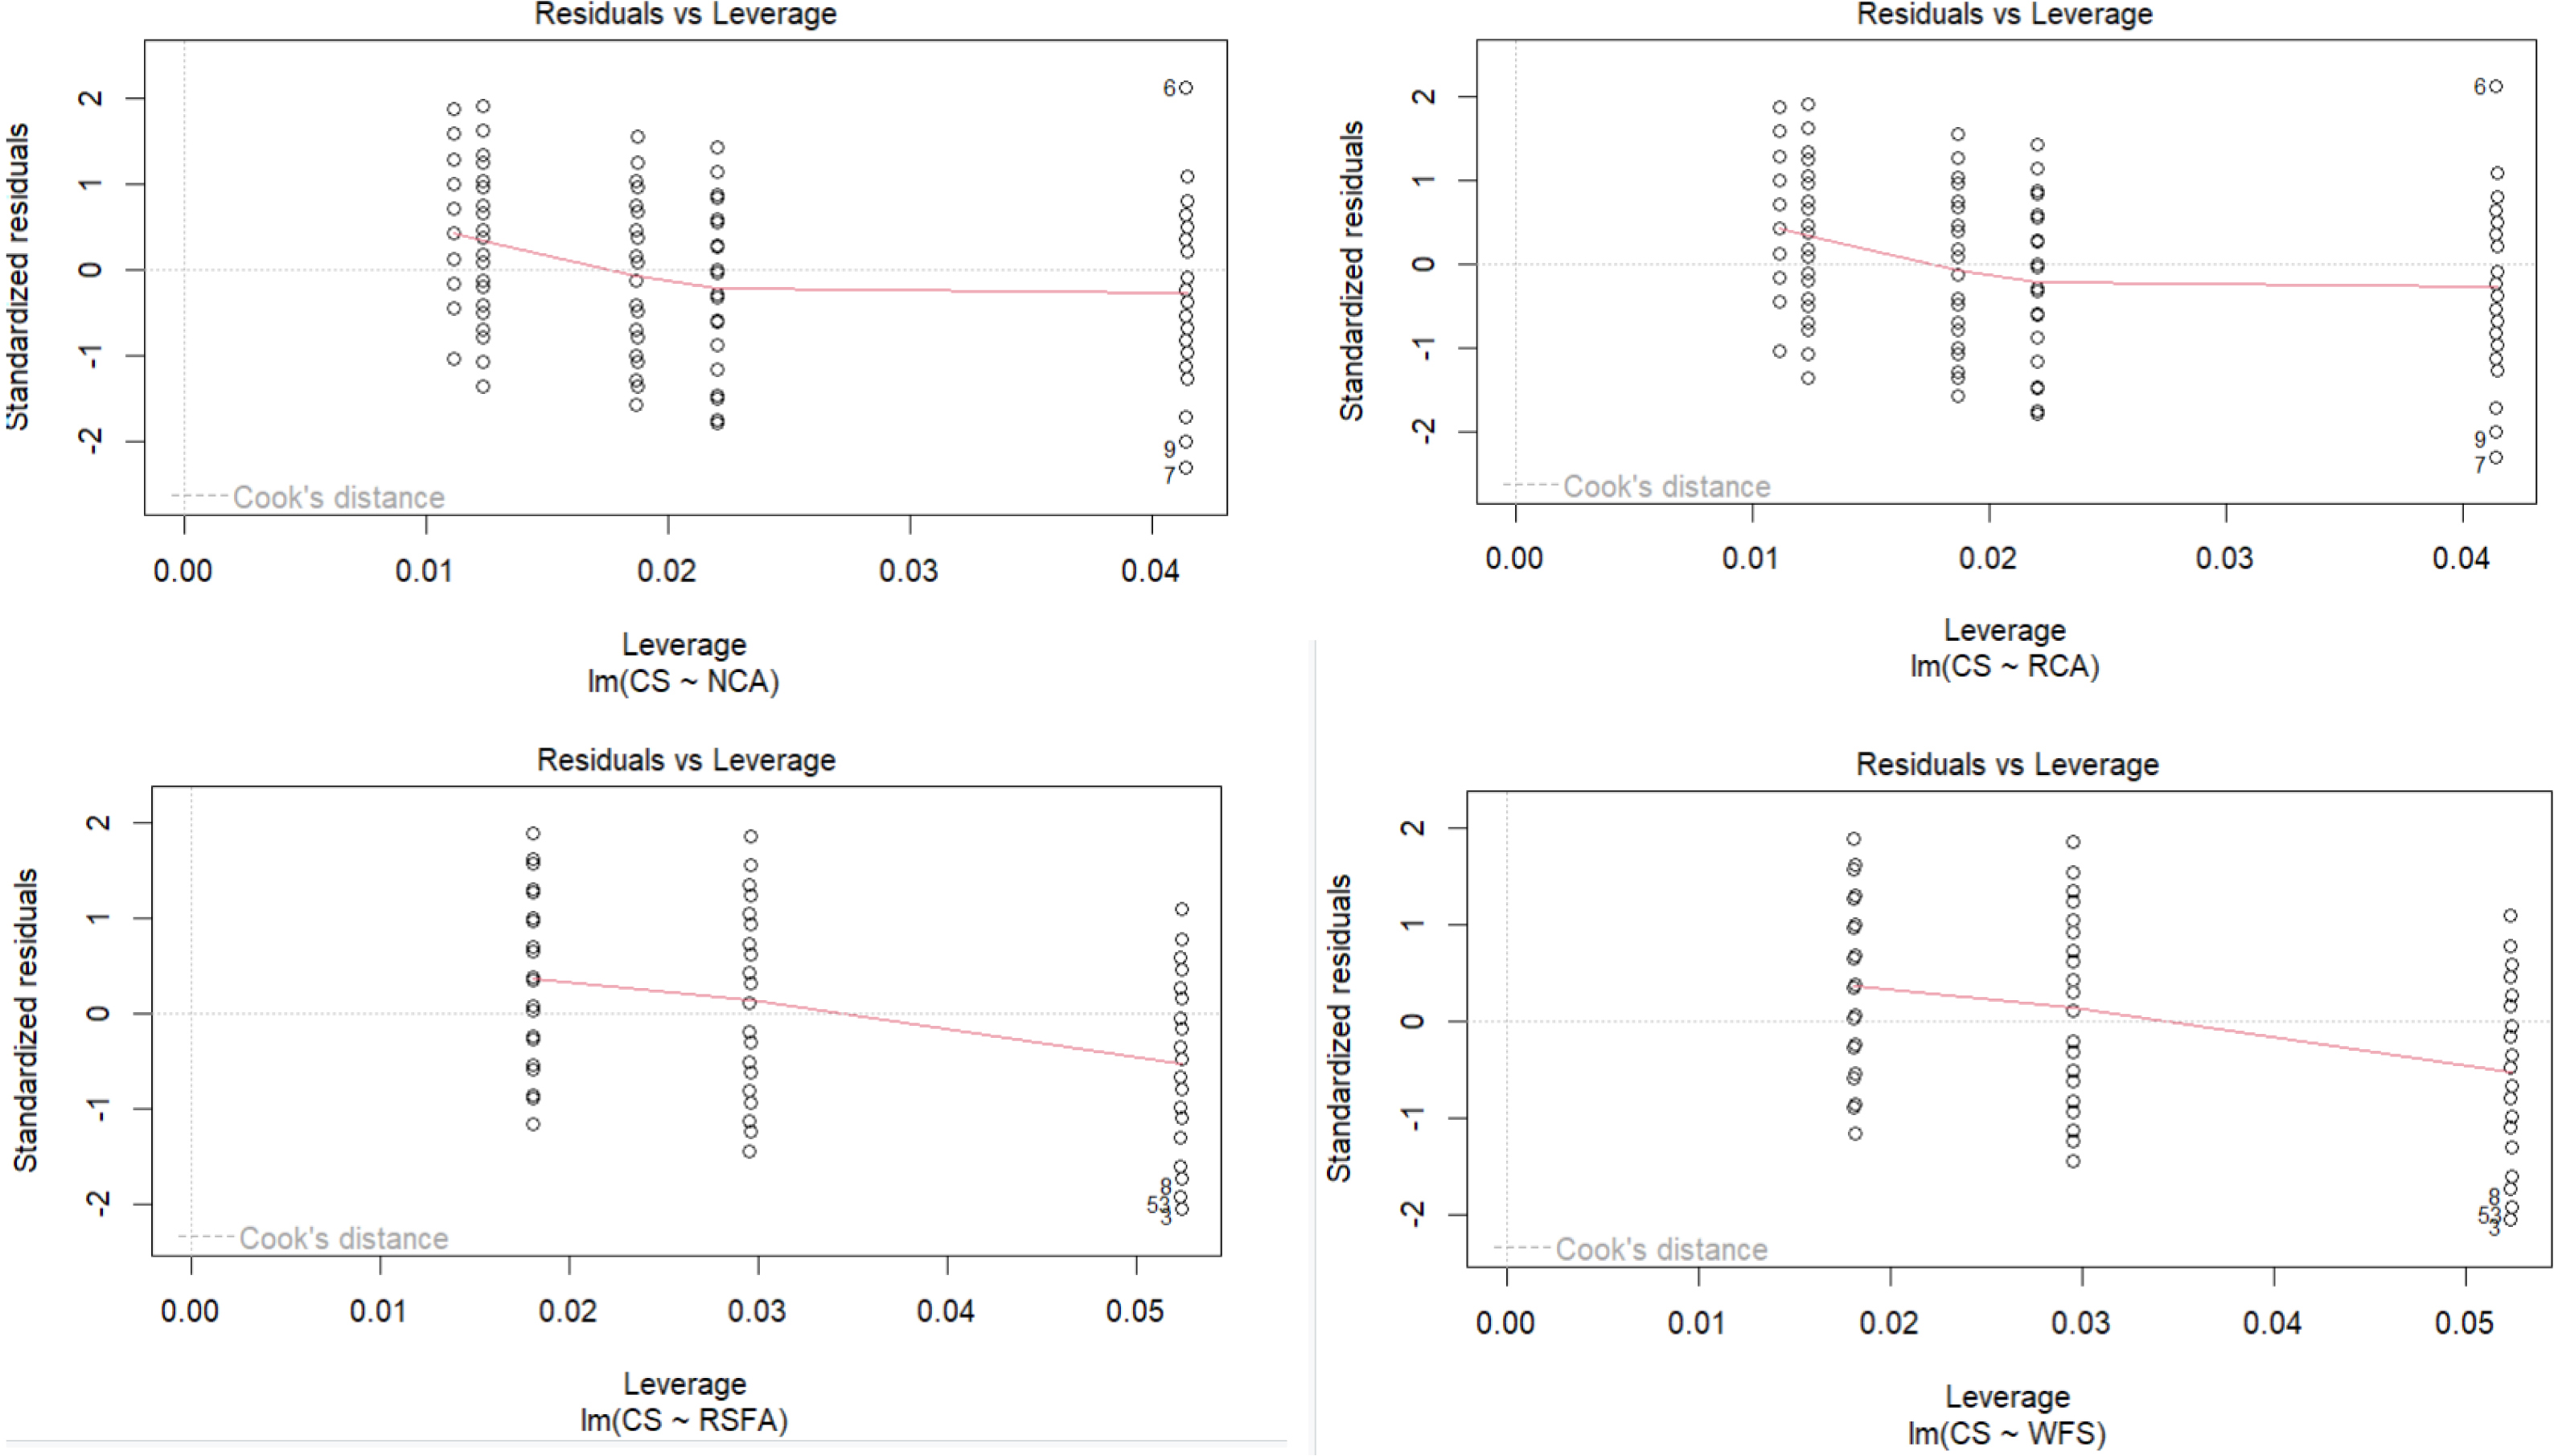
4.2. Multiple linear regression
Continuing the analysis from examining the individual effects of SLR, advancements were made in the investigation with the use of multiple linear regression (MLR) to enhance the understanding of how these factors collectively shape compressive strength. The results revealed that the regression model performs well as evidenced by the high R-squared value of 0.8044, which shows that nearly 80.44% of variance in the dependent variable is explained by the model. This is in agreement with previous studies [48, 49]. The F-statistics also confirmed the overall importance of the model. The results of the MLR analysis have furnished a robust regression equation—represented by (Equation (6))—for predicting the compressive strength of the developed AASC composites.
| (6) |
4.3. Scatter plot of predicted values versus actual values
The predicted values versus actual values scatter plot serves as a visual tool for gauging the alignment between the regression model’s predictions and the actual data [50]. The plot highlights assessing the proximity of data points to a diagonal reference line. This reference line signifies an ideal scenario where the model’s predictions and actual values perfectly coincide. When data points cluster closely around this line, it signifies the model’s precision in making predictions [51].
In Figure 6, the predicted and actual compressive strength values derived from the MLR model are compared. The objective is to evaluate the prediction accuracy of the MLR model in determining the compressive strength of the AASC mixtures. The scatter plot illustrates the correlation between the expected and actual compressive strength values. The graph demonstrates the degree of alignment between the model’s predictions and the experimental data. Data points that tightly cluster around the diagonal line in the figure signify precise predictions by the model. Points that considerably diverge from the line indicate disparities between the expected and actual values. The research indicates that most data points are situated close to the diagonal line, suggesting that the model has a high degree of prediction accuracy. The absence of observable trends or systematic departures indicates that the model is resilient and accurate for forecasting compressive strength in the tested AASC blends. The concordance between the predicted and actual values is essential as it validates the model’s ability to generalize beyond the training dataset and reliably forecast the compressive strength of future AASC mixtures. The stochastic dispersion of errors around the diagonal line substantiates the assertion that the model exhibits consistent performance across various mix patterns. Validation of the model using the scatter plot indicates that the MLR model is appropriate for forecasting compressive strength results and may effectively optimize mix designs without the need for significant physical testing. This method conserves materials and enhances resource efficiency and sustainability in concrete manufacturing.
Scatter plot of predicted values versus actual values.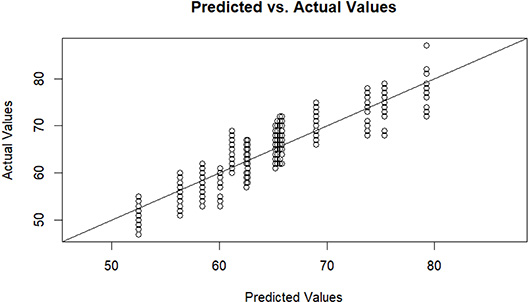
This study employed both SLR and MLR to examine the variables that have an impact on the compressive strength of AASC. Significant coefficients and the direction of their impacts were revealed using SLR, which shed light on the specific effects of each variable. The scope was constrained to interactions involving a single variable. In contrast, several predictors were included in MLR, which also provided higher predictive power, adjustments for confounding variables, and interaction effects. It may lead to overfitting, which is more complicated and which may also require careful interpretation. The analysis also depends on multiple assumptions. However, with a high R-squared value of 0.8044, the MLR model was able to explain a significant amount of the variance in compressive strength. The study concluded that although SLR presented insightful information about the distinct impacts of each variable, MLR provided a more thorough and reliable analysis. This is due to the fact that it considered the combined impact of several predictors on the compressive strength of AASC. This method aids in the creation of concrete mixtures that are optimal for environmentally friendly pavement materials. The developed concrete mixes utilize a major amount of waste materials such as RCA and WFS, which are used as replacement for natural aggregates. Aggregates generally occupy 70 to 80% of the volume of concrete. Replacing natural aggregates with waste materials helps in conserving natural aggregates. Furthermore, the MLR model has better predictive accuracy in determining the compressive strength of AASC mixes. The analysis helps in optimizing the mix design without the need for trial mixes, which in turn further reduces the use of materials. Therefore, the considered methodology contributes to the creation of optimal AASC paving mixes that are ecologically viable.
5. Conclusion and future scope
This study emphasizes the significant advancements that can be achieved via the incorporation of RCA and WFS into AASC mixes. The outcomes of the research work indicate the potential use of these combinations in highway pavement infrastructure. Moreover, the use of RCA and WFS aligns with sustainable construction practices and the circular economy, offering the dual benefit of preserving the environment by enabling the creation of eco-friendly high-performing construction materials. The following points show the research’s main findings and key conclusions:
- The inclusion of RCA and WFS in AASC resulted in reduced workability and increased water absorption when compared to the reference mix. The A-50-0 mix showed a compaction factor value of 0.893, VPV of 9.21%, and water absorption of 5.13%. The A-50-20 mix showed a compaction factor value of 0.866, VPV of 9.67%, and water absorption of 5.79%.
- The optimal replacement percentages for RCA and WFS in AASC mixes were determined to be 50% and 20%, respectively. These mixes showed optimal compressive strengths of 67 MPa for the A-50-0 mix and 64 MPa for the A-50-20 mix after 28 days, with both exceeding the target strength for pavement grade concrete.
- The A-50-0 mix and A-50-20 mix exhibited a flexural strength of 7.4 MPa and 7.3 MPa, respectively, which is greater than the minimum requirement of flexural strength for pavement applications, which is 4.5 MPa as per IRC.
- The A-50-0 mix exhibited a 13.07% increase in compressive strength, a 2.72% increase in STS, and a 7.04% increase in flexural strength from 7 to 28 days. The A-50-20 mix showed a 4.57% increase in compressive strength, a 9.67% increase in STS, and a 20.3% increase in flexural strength over the same period.
- The natural aggregates in AASC mixes are reduced by nearly 70%, with them being replaced by C&D wastes (up to 50%) and WFS (up to 20%). This contributes to sustainability and a circular economy. Moreover, using industrial byproducts (viz., GGBS) as a replacement for conventional OPC binders could additionally reduce CO2 emissions and improve ecological balance.
- The SLR analysis revealed significant negative impacts of RCA and WFS on compressive strength, with coefficients of −0.026315 and −0.13476, respectively.
- The MLR model performed well and exhibited a high R-squared value of 0.8044, indicating the robust predictive capability for compressive strength outcomes. This model will help optimize the mix design, thereby reducing the number of trials to obtain the optimized content, and also improve resource efficiency.
Overall, this investigation provides valuable information on the influence of RCA and WFS on slag-based AAC mixes. Based on the findings, the formulation of an AASC mix will effectively provide waste-derived concrete with equal or better properties when compared to OPCC mixes. This will enable buildings to adopt greener production practices and conserve resources. It is suggested that further research should be conducted to examine the characteristics of sustainable concretes that were generated as part of this work, namely their durability and time-dependent behavior (such as contraction and creep).
List of abbreviations and symbols
| β0 | Intercept |
| β1 | Coefficient of independent variables |
| X1 | Value of independent variables |
| ε | error term capturing unexplained variation |
| AAC | Alkali-activated concrete |
| AAS | Alkaline activator solution |
| AASC | Alkali-activated slag concrete |
| CS | Compressive strength |
| GGBS | Ground granulated blast furnace slag |
| LSS | Liquid sodium silicate |
| MLR | Multiple linear regression |
| NCA | Natural coarse aggregate |
| OPCC | Ordinary Portland cement concrete |
| RCA | Recycled concrete aggregate |
| RSFA | River sand fine aggregate |
| SLR | Simple linear regression |
| VPV | Volume of permeable voids |
| WFS | Waste foundry sand |
Declaration of interests
The authors do not work for, advise, own shares in, or receive funds from any organization that could benefit from this article, and have declared no affiliations other than their research organizations.
Acknowledgments
The Civil Engineering Department’s laboratory at the NMAM Institute of Technology, Nitte, was the site of all significant work. The Nitte Education Trust provided financial assistance through the NMAMIT Research Fund for Civil Engineering 2021-22 and the NURF Research Grant (Sanction number N/RG/NUFR1/NMAMIT/2022/09 dated 28.12.2022). The authors wish to express their heartfelt thanks to the Dean (R&D), HoD (Civil), and Principal of NMAMIT-Nitte, Directorate of Nitte (DU), Nitte Education Trust (R), and NITTE (Deemed to be University) for providing timely financial and other essential assistance for this research. The authors would also like to thank the undergraduate students of B.E. (Civil) for their extremely valuable help in conducting the laboratory experimental investigations.