


 CC-BY 4.0
1. Introduction
The important role played by water in our daily lives makes it one of the most fragile natural resources. The sustainable management as well as the preservation of this resource against pollution from uncontrolled industrial and urban effluent discharge is a worldwide challenge, especially in countries suffering from water scarcity [1, 2, 3]. Textile industry is considered as one of the highly water-polluting sectors in the world [4]. Indeed, the resulting discharged effluents are generally characterized by high salinity and heavy metal content (especially iron and zinc) as well as important dissolved organic concentrations [5, 6]. The polluting effects of some dyes on fauna and flora have been well documented over the years [7, 8]. Moreover, various dyes could be highly toxic, carcinogenic and even mutagenic to humans [9].
Scientific awareness has grown considerably in the last decades in order to find adequate and innovative methods for the treatment of this source of pollution. A large variety of techniques were accordingly investigated such as membrane separation [10], coagulation–flocculation [11], biological degradation [12] and electrochemical and advanced oxidation processes [13, 14]. Despite the reportedly high purification yields of some of these techniques, they could necessitate the implementation of expensive operating plants, increased use of “already” polluting chemicals, and generating byproducts that might require further treatment. Adsorption onto biomasses was considered as an ecological and sustainable alternative for the removal of dyes from aqueous solutions and has proved its flexibility, low cost and efficiency in the elimination of organic pollution [15, 16].
The mechanism of dye adsorption onto biomasses was found to be physical and/or (in the majority of cases) chemically driven. In the latter case, the uptake of dye is mainly performed by means of functional groups present on the surface of the adsorbent that establishes strong covalent bonds with the targeted molecules [17, 18]. However, when all the adsorption sites are filled with polluting molecules, the support is said to be saturated. If the contact with the fluid to be treated is maintained, the support will no longer be able to play its role. At this time, it is therefore necessary to change the saturated adsorbent support which becomes ineffective or conveniently return it to its initial state for a new application. Desorption is a process by which a substance, called desorbate, is released from/through a saturated surface, in the presence of an eluent which reacts with this surface, called desorbent [19]. It is a process that opposes adsorption with a transfer of mass amount from the solid to the liquid phase [20]. Several studies have considered desorption as a means of regeneration of the pollutants-loaded-solid-supports as well as for the recovery of the desorbate for a possible reuse in the industrial processes employing multiple methods such as physical (i.e., ultrasound waves and vacuum [21, 22]), thermal (generally microwave assisted [23]) and biological [24] approaches. For instance, Shende and Mahajani [25] followed the regeneration of a spent biochar under partial oxygen pressures at temperatures varying between 150–250 °C. The reported results showed a significant regeneration capacity after four consecutive adsorption/desorption cycles of 98.4% and 96.7% for “cibacron turquoise blue G” and “brilliant blue R”, respectively. In another study, Walker and Weatherley [26] investigated the regeneration of a nonactivated bone char using a consortia of four bacteria for the degradation of “acid red 361” adsorbed molecules. The authors highlighted degradation efficiency of about 266 mg⋅g−1 presenting 52% of the total adsorbed quantity of dye.
However, the regeneration of loaded biomasses with low-cost eluents is usually constrained by economical, technical and environmental reasons [27]. The application of salts, acids and bases along with organic solvents showed its feasibility for the regeneration of dye-loaded biomasses and allowed their reuse for multiple adsorption/desorption cycles [28, 29]. Bhatti et al. [30] studied the regeneration of “direct red 31”-loaded-rice-husk by using various eluents. They reported desorption efficiencies of 81%, 30% and 35% when using aqueous solutions at pH = 12, aqueous solutions containing NaOH at 0.1 M and aqueous solutions containing Na2CO3 at 0.1 M, respectively. A larger number of eluents were employed by El Messaoudi et al. [31] to investigate the desorption of “Congo red” from two lignocellulosic materials, namely date stones and jujube shells. This dye recovery efficiency varied between 48.4% and 88.2% for date stones and between 42.8% and 85.6% for jujube shells and occurs according to the following order: bases > salts > alcohols > distilled water > acids.
Sodium chloride represents an interesting desorbing agent for positively charged molecules onto lignocellulosic materials. In fact, it is an abundant, low cost, sustainable and ecofriendly agent. Moreover, and unlike the conventionally used organic and mineral solvents, the elimination of NaCl after desorption is technically easier to perform, either by reverse osmosis [32] or by advanced oxidation process where Cl− ions could be transformed into strong oxidizing radicals, i.e., hypochlorous acid (HClO) and the hypochlorite ions (ClO−) [27, 33]. It has been widely used to study the effect of aqueous ionic strength on the adsorption process of various dyes. The co-presence of NaCl with dye molecules was usually highlighted as a competing agent for the saturation of adsorbent’s surface functional groups [34, 35].
On the other hand, the majority of related studies have used the conventional method for regeneration of the adsorbents by varying only one parameter at a time. Such an approach does not allow a proper comprehension of the possible reactions that might happen on the desorbate’s surface in case of using more than one desorbing agent and/or by varying different experimental setup parameters simultaneously. Only few studies have investigated organic pollutant desorption process optimization by using statistical factorial designs. They mainly concerned pesticide desorption from soils [36] or acid violet-7 from a magnetic nanocomposite adsorbent [37]. To the best of our knowledge, there are no published studies suggesting an optimization method for the regeneration of MB-loaded-lignocellulosic-adsorbents that takes into account multiple process variables by the means of statistical tools. Moreover, there is a lack of sufficient and proper investigation regarding the dye desorption involved mechanisms and the physiochemical changes that might occur on the biomasses’ surface.
In the current work, the desorption of MB from a saturated ROS was followed under different experimental conditions in batch mode. The main targeted objectives are: (i) to investigate the effect of solution’s pH, solution’s sodium chloride concentration and the MB-loaded biomass content on the desorbing yield efficiencies, (ii) to determine the possible interactions between these parameters and their statistical significance and finally (iii) to explore the probable mechanisms governing the recovery of MB.
2. Materials and methods
2.1. Biomass and preparation of chemicals
Raw orange tree (Citrus sinensis L.) wood was collected from a local farm in the region of Menzel Bouzelfa (Nabeul, Tunisia). The feedstock was initially rinsed with distilled water to remove any impurities, then progressively ground to obtain particles having size less than 2 mm. The obtained sawdust, named ROS, was then dried at 60 °C for 24 h and stored in airtight bags for later use.
Methylene blue, acquired from Panreac Scientific (Barcelona, Spain), was used as an adsorbate during batch experiments. A MB stock dye solution of 1 g⋅L−1 was prepared using distilled water and used throughout this study for the preparation of solutions at desired concentrations. Sodium chloride solutions, acquired from Panreac Scientific (Barcelona, Spain), was used as an eluent during desorption experiments. A stock solution of 1 M was prepared using distilled water. The desired concentrations were then prepared by further diluting this stock solution with distilled water. Nitric acid purchased from Alfa Aesar (Massachusetts, USA) was used to modify the NaCl solution’s pH during the desorption experiments. The solution’s pH values were determined using a 827 pH Lab Meter (Metrohm, Herisau, Switzerland).
Level of the factors used for study of MB desorption from ROS using a full factorial design
| Factor | Coded symbol | Levels | |
|---|---|---|---|
| −1 (Lower) | +1 (Upper) | ||
| NaCl aqueous pH | X1 | 3 | 5 |
| NaCl concentration (M) | X2 | 0.2 | 0.5 |
| MB-loaded-ROS dose (g⋅L−1) | X3 | 1 | 3 |
(X1: solution pH, X2: NaCl aqueous concentration, X3: MB-loaded-ROS dose in the desorbing solution).
2.2. Preparation of methylene blue-loaded adsorbent
Adsorption experiments were performed following the experimental protocol presented in our previous paper [17]. Briefly, 100 mL of MB solution at an initial concentration of 50 mg⋅L−1 was agitated with 0.1 g of ROS at 400 rpm for 180 min and at ambient temperature (20 ± 2 °C). Once adsorption equilibrium was reached, the MB-loaded biomass was recovered by vacuum filtration using a 0.45 μm Whatman® filter paper (VWR, Leuven, Belgium). The aqueous dye concentrations before and after the adsorption process were followed by using a Thermo Fisher UV–Vis spectrophotometer (Massachusetts, USA) at an absorbance wavelength of 𝜆max = 664 nm. This procedure was repeated multiple times in order to obtain a sufficient MB-loaded-ROS quantity for the desorption experiments. The MB-loaded-ROS was dried in an oven at 60 °C for 24 h and then stored in airtight dissectors. It is important to note that this prepared MB-loaded-ROS has an average MB content of 30.04 mg⋅g−1 [17].
2.3. Design of desorption experiments
During this study, the effect of three independent experimental factors and their possible interactions on MB desorption yield (Y , %) from ROS was assessed by using the two-level full factorial design approach. The parameters followed include: the solution pH (X1), the NaCl aqueous concentration (X2; Mole) and the MB-loaded-ROS dose in the desorbing solution (X3; g⋅L−1) (Table 1). The variation range of these parameters (Table 1) was fixed on the basis of preliminary experiments.
A set of 24 runs on the basis of three replicates for each experiment were performed according to the model provided by the Minitab V.17 software (Centre County, Pennsylvania). The full factorial design is a statistical method that uses outputs from an appropriate set of experiments to determine the polynomial regression equation that suitably describes the possible interactions between the operating parameters [38]. Accordingly, the general form of the MB desorption from ROS can be described by the following equation:
| (1) |
| (2) |
| (3) |
| (4) |
2.4. Exploration of desorption mechanisms
2.4.1. Scanning electron microscope and X-ray spectroscopy
Morphological characterization of the raw sawdust as well as the MB-loaded-ROS before and after MB desorption was elaborated by using an XL30 electron microscope (Phillips, Eindhoven, Netherlands). Elementary composition was determined via an energy-dispersive X-ray spectrometer (X-sight EDX model, Oxford Instruments, Oxfordshire, UK).
2.4.2. X-ray diffraction analysis
Powder X-ray diffraction (XRD) was used to identify the crystalline phases in the raw sawdust as well as for the MB-loaded-ROS before and after desorption experiments. It was carried out on a Panalytical X’Pert powder diffractometer equipped with a copper anode (Malvern Panalytical, Malvern, UK). Diffractogram analysis and phase identification were achieved by using the Panalytical X’Pert HighScore software and the International Center for Diffraction Data (ICDD) database, respectively.
2.4.3. Fourier transform infrared spectroscopy
To have a proper understanding on the surface chemistry of the MB-loaded-ROS before and after the MB desorption process, Fourier Transform Infrared (FTIR) analyses were performed by an Equinox 55 Brucker spectrometer (Ettlingen, Germany). For each sample, an exact MB-loaded-ROS to KBr mass ratio of 1∕200 was ground in a mortar and pressed into 1 cm diameter disk with 3.5 ton pressure. The disk-like sample was then analyzed at a spectral resolution of 4 cm−1, measured between 4000 cm−1 and 400 cm−1.
3. Results and discussion
3.1. Design of desorption experiments
3.1.1. Fitting the design model
In the current investigation, two levels of factorial design with three variables (solution pH, solution NaCl concentration and MB-loaded biomass dose) were used as a design of the experimental model. Afterwards, in order to establish the statistical significance of these parameters, the theoretical MB desorption yields and ANOVA tests were determined (Tables 2 and 3). Such analysis is fundamental to understand the impact of variation of parameters on the linear, 2-way and 3-way interactions between the factors.
The obtained results from the design matrix were employed to determine the regression equation model describing the desorption model as follows:
| (5) |
The final response (Desorption yield, (%)) is presented as a function of simultaneous variations of the studied parameters. Positive and negative signs of their respective coefficients indicate that the parameter variation is either synergistic or antagonistic to the final desorption yield, respectively [40]. Accordingly, the model’s coefficient and the adjusted determination coefficient (R2 and , respectively) were calculated and found to be statistically significant at 98.961% and 96.630%, respectively, which confirms the good suitability of the theoretical model to the experimental results [41, 42].
The mathematical presentation of the design used (Equation (5)) was made use for the determination of the MB theoretical desorption yields. These values are given in comparison to the experimental ones in Table 2.
Experimental and predicted desorption yields of MB from ROS resulting from polynomial regression analysis
| Experience | Coded parameters | Uncoded parameters | Measured Y (%) | Predicted Y (%) | |||||
|---|---|---|---|---|---|---|---|---|---|
| X1 | X2 | X3 | pH | [NaCl] (M) | Dose (g⋅L−1) | ||||
| 1 | −1 | −1 | −1 | 3 | 0.2 | 1 | 80.28 | 81.32 | |
| 2 | +1 | −1 | −1 | 5 | 0.2 | 1 | 57.18 | 59.23 | |
| 3 | −1 | +1 | −1 | 3 | 0.5 | 1 | 67.13 | 69.86 | |
| 4 | +1 | +1 | −1 | 5 | 0.5 | 1 | 67.90 | 64.45 | |
| 5 | −1 | −1 | +1 | 3 | 0.2 | 3 | 57.11 | 59.53 | |
| 6 | +1 | −1 | +1 | 5 | 0.2 | 3 | 43.10 | 43.23 | |
| 7 | −1 | +1 | +1 | 3 | 0.5 | 3 | 64.34 | 63.92 | |
| 8 | +1 | +1 | +1 | 5 | 0.5 | 3 | 52.43 | 55.02 | |
| 9 | −1 | −1 | −1 | 3 | 0.2 | 1 | 81.28 | 81.32 | |
| 10 | +1 | −1 | −1 | 5 | 0.2 | 1 | 60.60 | 59.23 | |
| 11 | −1 | +1 | −1 | 3 | 0.5 | 1 | 72.46 | 69.86 | |
| 12 | +1 | +1 | −1 | 5 | 0.5 | 1 | 62.31 | 64.45 | |
| 13 | −1 | −1 | +1 | 3 | 0.2 | 3 | 62.90 | 59.53 | |
| 14 | +1 | −1 | +1 | 5 | 0.2 | 3 | 43.18 | 43.23 | |
| 15 | −1 | +1 | +1 | 3 | 0.5 | 3 | 65.78 | 63.92 | |
| 16 | +1 | +1 | +1 | 5 | 0.5 | 3 | 55.16 | 55.02 | |
| 17 | −1 | −1 | −1 | 3 | 0.2 | 1 | 82.39 | 81.32 | |
| 18 | +1 | −1 | −1 | 5 | 0.2 | 1 | 59.91 | 59.23 | |
| 19 | −1 | +1 | −1 | 3 | 0.5 | 1 | 69.99 | 69.86 | |
| 20 | +1 | +1 | −1 | 5 | 0.5 | 1 | 63.16 | 64.45 | |
| 21 | −1 | −1 | +1 | 3 | 0.2 | 3 | 58.58 | 59.53 | |
| 22 | +1 | −1 | +1 | 5 | 0.2 | 3 | 43.42 | 43.23 | |
| 23 | −1 | +1 | +1 | 3 | 0.5 | 3 | 61.64 | 63.92 | |
| 24 | +1 | +1 | +1 | 5 | 0.5 | 3 | 57.48 | 55.02 | |
On the basis of Table 2, it could be clearly seen that the theoretical MB desorption yields were in good agreement with the experimental ones. Indeed, the differences between the experimental and the predicted MB desorption yields
| (6) |
ANOVA analysis for MB desorption from ROS
| Source | DF | Seq SS | Adj SS | Adj MS | F-value | p-value |
|---|---|---|---|---|---|---|
| Model | 7 | 2577.81 | 2577.81 | 368.26 | 72.83 | 0.002 |
| Linear | 3 | 2137.72 | 2137.72 | 712.57 | 140.92 | 0.001 |
| 2-way interactions | 3 | 407.81 | 407.81 | 135.94 | 26.88 | 0.005 |
| 3-way interactions | 1 | 32.29 | 32.29 | 32.29 | 6.38 | 0.002 |
| Error | 16 | 80.91 | 80.91 | 5.06 | ||
| Total | 23 | 2658.72 | ||||
It could be remarked initially that the sequential and adjusted sum of squares (Seq SS and Adj SS, respectively) are high for all set of sources. These high values could be explained by the fact that the variability within the data of the parameters followed (linear, two-way and interactional) presents a significant deviation from each respective mean value. This suggests that the variation of pH, NaCl concentration and the MB-loaded-ROS dose solely or altogether is statistically significant [43]. It is worth mentioning that the ANOVA test for factorial design models implies the use of an orthogonal matrix, meaning that the columns presenting the effects and the interactions of the parameters followed are orthogonal to each other [44]. This explains the fact that “Seq SS” and “Adj SS” were found to be the same for each studied source (Table 3).
The Fischer’s test (F-values) and probability coefficients (p-values) were also determined in order to underline the statistical importance of the variables (Table 3). For all sources, the F-values were high in the exception of the coefficients corresponding to 2-way and 3-way interactions. According to Venkataraghavan et al. [45], high values of Fischer’s test coefficients reflect important significance of the regression model. In the current case, the variation of only one parameter presents the highest statistical significance (F = 140.92, p < 0.05), while the simultaneous variation of more than one parameter seems to be less significant (F = 26.88 and 6.38 for 2-way and 3-way interactions, respectively; p < 0.05). On the other hand, the p-values presented in the Table 3 were found to be lower than 0.05 with a 95% confidence level which confirms that the experimental data fitted well the experimental findings [46].
Normal probability plot between residual and error percentages describing the desorption of MB from ROS (response Y is the MB desorption yield (%); p < 0.05).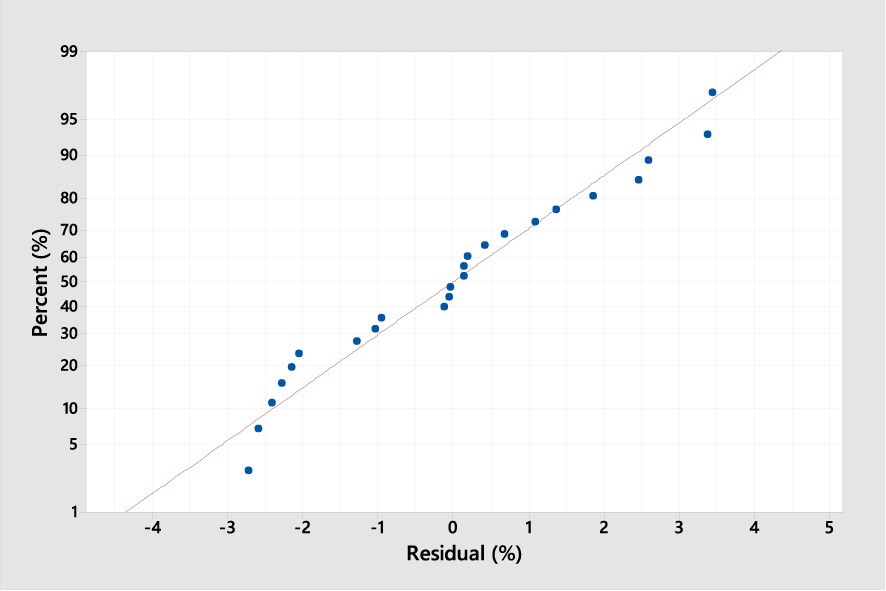
Main effect plots of MB desorption yields from ROS under the studied experimental conditions (p < 0.05).
Interaction plots of solution pH, NaCl aqueous concentration and exhausted ROS dose for the desorption of MB yield (p < 0.05).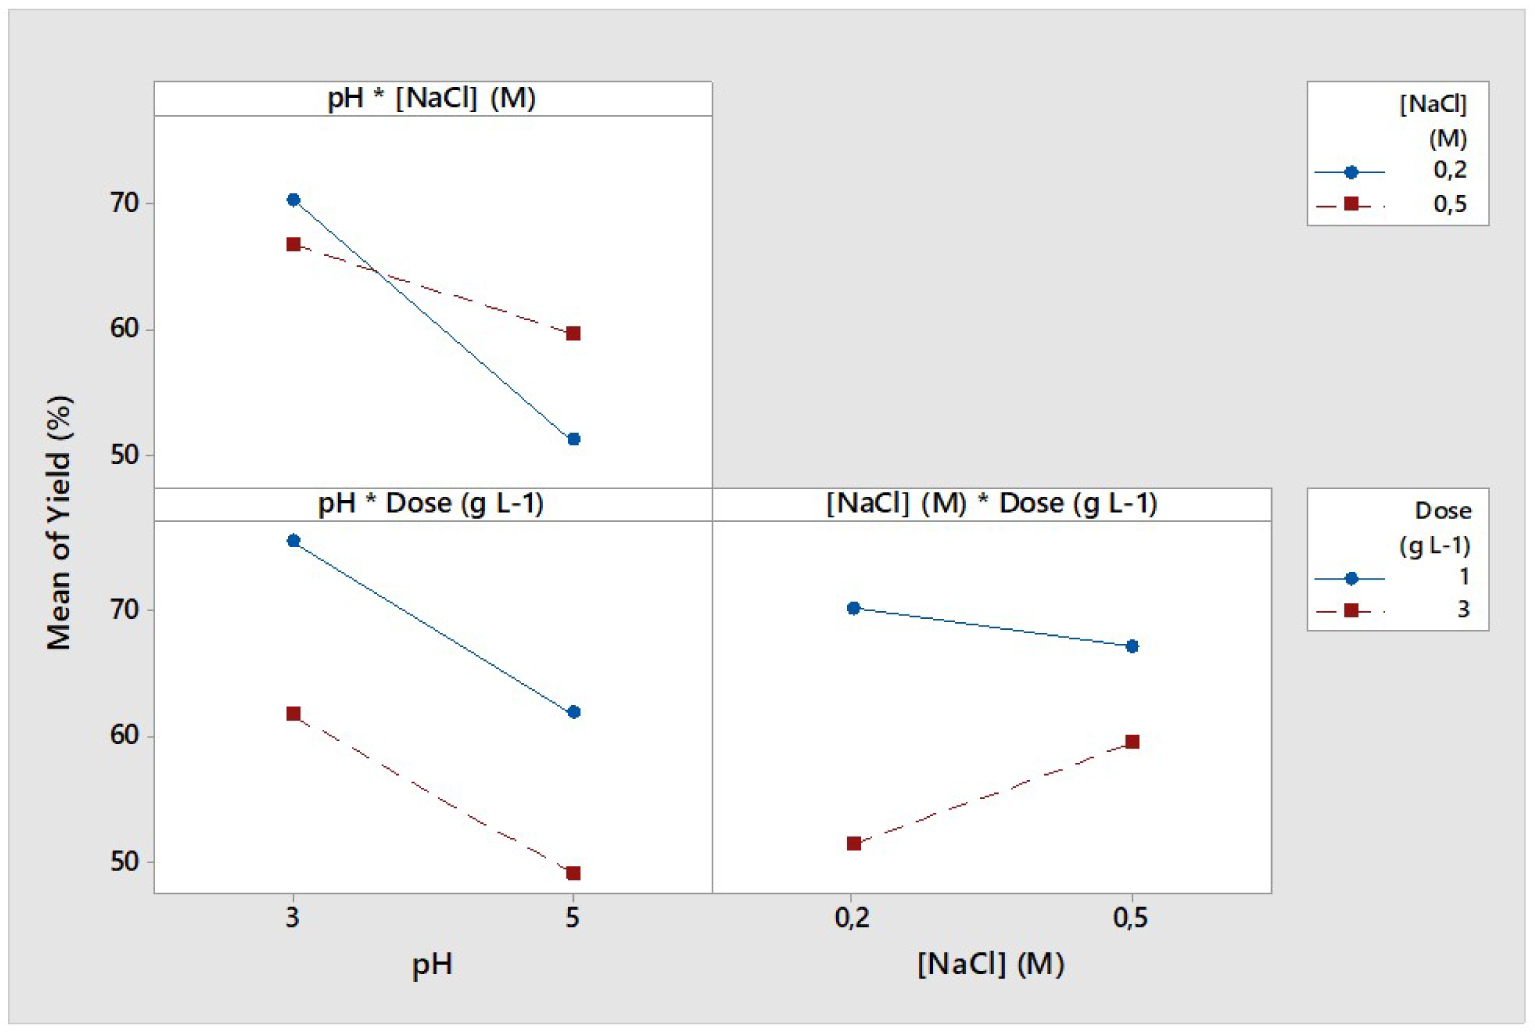
3.1.2. Effect of process parameters on MB desorption and interaction plots
It is important to determine the main effects of the parameters studied on the MB desorption yields and the resulting interactions in case of simultaneous variations within the range of levels given in Table 1. Firstly, the main effects of the parameters are presented in the Figure 2.
As all parameters studied were presented at 95% confidence level (p < 0.05), the plots showcased their deviation compared to the mean value in function of their extremum levels. Therefore, for an effect to be judged positive, the corresponding desorption yield (Y (%)) value should increase. Such a result was observed when varying the aqueous NaCl concentration from 0.2 M to 0.5 M (Figure 2). On the other hand, when the effect is negative, a positive variation of the parameter results in a decrease in the final “Y (%)”, which is the case for pH and the ROS dose (Figure 2). It can be clearly seen that the mean variation plots for ROS dose (g⋅L−1) and pH presented steep slopes, while the slope corresponding to NaCl aqueous solution variation was less steep. It suggests that the variation between the −1 and +1 levels for the parameters X1 (pH) and X3 (Dose) impacted the most the MB desorption yields. Similar findings were reported by Bingol et al. [47] when studying the sorption of brilliant yellow onto sepiolite clay, where the variation plot corresponding to the effect of pH presented the biggest slope compared to the other two parameters, namely process temperature and solution’s ionic strength.
The two-by-two variation of the three studied parameters and the interaction plots are presented in Figure 3. It could be remarked that the simultaneous variation of unique pH and ROS dose led to parallel plots (lower-left graph, Figure 3) while in the other two cases nonparallel or even intercepting curves are presented.
According to Momina et al. [46], when the parameters are judged independent, their corresponding interaction plots were found to be parallel. However, when the mean interaction plots presented different slopes, the covariation of one of the two parameters could affect the trend of the other. These findings suggest that a possible chemical interaction favoring or slowing down the desorption of MB could occur while varying (i) NaCl concentration at different pH and (ii) NaCl concentration at different ROS doses. In fact, the increase in NaCl concentration while increasing the MB-loaded-ROS dose will result in a decrease in dye desorption yield (lower-right graph, Figure 3). Similar outcome was obtained when increasing NaCl concentration along with an increase in solution pH resulting in a significant decrease in the final value of Y (%) (upper-left graph, Figure 3). Meanwhile, the simultaneous increase in pH and ROS dose will result in an important decrease in the desorption rate of the MB (lower-left graph, Figure 3).
3.1.3. Significance of parameters
The statistical significance of these parameters resulting from their main and interaction effects could be deduced from Pareto chart (Figure 4). The Student’s test (t-test) is generally performed to determine whether the parameters followed are statistically significant and different from zero [48]. The t-value was calculated to 2.12 (p < 0.05). According to the Figure 4, the factors presenting a statistical significance are X3, X1, X1 X2, X2 X3, X2 and X1 X2 X3. These results confirm those presented in the Figure 2 suggesting that the variation in ROS dose (X3, g⋅L−1) and solution pH (X1) are the most influential parameters in the model presenting the highest standardized effects. Moreover, the standardized effect related to the covariation of X1 and X3 was under the t-value (Figure 4) which suggests their insignificance to the final desorption yield (p < 0.05).
Pareto chart of the standardized effects for the desorption of MB from ROS (p < 0.05).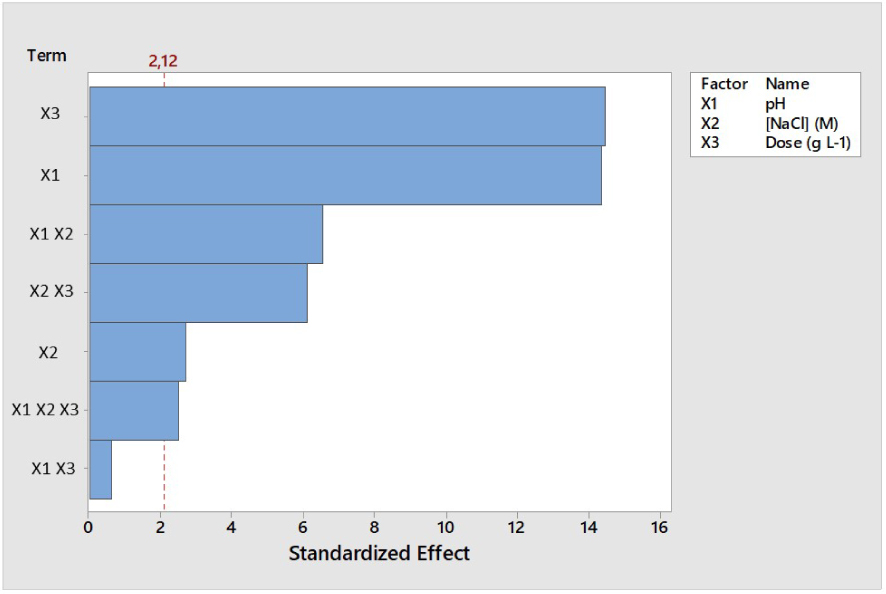
To sum up the statistical findings, the desorption of MB from ROS in the current factorial design system depends on the following ordered factors in terms of significance: Dose of MB-loaded-ROS (X3; g⋅L−1) > Desorbing solution’s pH (X1) > Desorbing solution’s NaCl concentration (X2, M). The variation of the ROS dosage impacts directly the number of functional sites loaded with MB molecules and available for a possible ion exchange with the surrounding solutes. For instance, the increase in ROS dose begets an increase in the amount of dye susceptible of reacting with the dissolved Na+ and hydronium ions and to be consequently released in the water. However, it is important to underline that the MB desorption kinetic step is slower than during the adsorption phase [39]. Therefore, the increase in MB-loaded-ROS doses leads to dye release in the solution which could be adsorbed back on the biomass [49]. To counteract this effect, the use of smaller doses of the ROS reduces the number of freed functional groups after desorption reaction and therefore the released dye molecules enter into competition with other cations to be re-adsorbed.
On the other hand, the effect of pH solution on the MB desorption was found to be more pertinent compared to NaCl concentration. The decrease in pH values did not only increase the solution’s acidity but also the proton concentrations on the surface of the biomass which led to a higher MB releasing rate through cation exchange process. Similar findings were confirmed by Daneshvar et al. [50] when investigating the desorption of MB from a brown microalgae. These authors reported that the increase in hydrochloric acid concentration from 0.125 M to 1 M enhanced the desorption of dye from the biomass from 30.75% to 41.20%.
Increasing the NaCl concentrations presented the same effect as reducing pH values (Figure 2). The use of salts was confirmed to be efficient when regenerating biomasses loaded with cationic dyes [39]. For instance, Bennani Karim et al. [51] studied the desorption of methylene blue from Moroccan clay using various salts as desorbing eluents. They showed that when using NaCl and CaCl2 as desorbing agents, the desorption yield increased from 5 to 9% and from 16 to 22% when increasing salt/MB mass ratio from 1 to 5, respectively. However, the co-presence of salt and nitric acid seems to reduce the standardized effect of the latter approximately by half (Figure 4). This could be explained by the competition effect between hydronium (coming from HNO3) and sodium (coming from NaCl) cations to occupy the liberated surface functional groups. According to the results of Tables 2 and 3, the retention of acid cations (H+) seems to be more preferred compared to Na+. In this context, Mucha et al. [52] reported that salts and acids present in a given electrolyte affect differently the interfacial tension between water and a gas/solid media. In fact, the presence of salts corresponding to alkali and alkaline earth metals (AAEM) decreases significantly the ROS’ surface tension compared to water, which leads to a depletion of minerals and molecules from the solid surface. On the other hand, it has been reported that the presence of hydronium ions increases significantly the tension on the boundary layer with biomass, which enhances its adsorption onto the ROS. According to the reported desorption results, the highest experimental MB yield percentage was reported for the experiment no. 17 (Table 2) performed at the following conditions: pH = 3, [NaCl] = 0.2 M and Dose = 1 g⋅L−1. The resulting biomass after desorption experiment was retained and used for the subsequent characterization analyses.
Comparison of MB desorption from ROS in batch mode using NaCl aqueous solutions as eluents from lignocellulosic/lignocellulosic-derived adsorbents
| Adsorbent | NaCl concentration | Experimental conditions | Initial adsorbed amount (qe,ads) (mg⋅g−1) | Desorption yield (%) | Reference |
|---|---|---|---|---|---|
| Alkali treated orange tree sawdust | 0.5 M | pH = 6.0; T = 20 °C; D = 1 g⋅L−1 | 74.5 | 58.7 | [39] |
| Brown algae | 1 M | pH = 6.0; T = 20 °C; D = 0.2 g⋅L−1 | 35.1 | 22.1 | [50] |
| Agarose | 0.3 M | pH = 7.0; T = 55 °C; D = 0.3 g⋅L−1 | 50.0 | 5.0 | [53] |
| Almond shell powder | 1 M | pH = 6.0; T = 30 °C; D = 10 g⋅L−1 | 51.0 | 13.0 | [54] |
| Rice husk | 0.1 M | pH = 9.2; T = room temperature; D = 100 g⋅L−1 | 18.2 | 0.03 | [55] |
| Banana peel derived biochar | 0.01 M | pH = 6; T = 20 °C; D = 1.5 g⋅L−1 | 385.1 | 12.0 | [56] |
| Alkali treated orange tree sawdust | 0.2 M | pH = 3.0; T = 20 °C; D = 1 g⋅L−1 | 30.0 | 81.3 | This study |
In order to highlight the significance of these statistically optimal conditions, our current results were compared to previous findings dealing with the desorption of MB from other adsorbents using NaCl as a desorbing eluent (Table 4). It could be remarked that ROS shows a significant affinity toward NaCl ions in terms of MB release efficiency compared to various other adsorbents such as rice husk [55], almond shell powder [54] or highly porous biochars [56].
3.2. Exploration of desorption mechanism
In order to get a better understanding of the involved mechanisms during the MB desorption from ROS particles, various analyses were carried out according to the protocols given in Section 2.4.
3.2.1. Scanning electron microscopy and X-ray spectroscopy
In order to investigate the possible physical modifications occurring during the MB adsorption/desorption experiments, SEM imagery was obtained and results are presented in the Figure 5. Initially, the ROS presents an irregular and heterogeneous surface with few porosities and kinky fibrous structures (Figure 5(a)). These aspects are similar to the majority of lignocellulosic materials presented in literature [35, 57, 58]. After dye adsorption, a layer of dye appeared on the surface and partially covered some pores [59] (Figure 5(b)). After the MB desorption through the use of HNO3 and NaCl solution, some of these pores that were saturated during the adsorption process were liberated (Figure 5(c)). Moreover, light-colored particles appeared on the adsorbent surface that could correspond to NaCl particles [27].
SEM imagery of (a) ROS, (b) MB-loaded-ROS before and (c) after desorption process.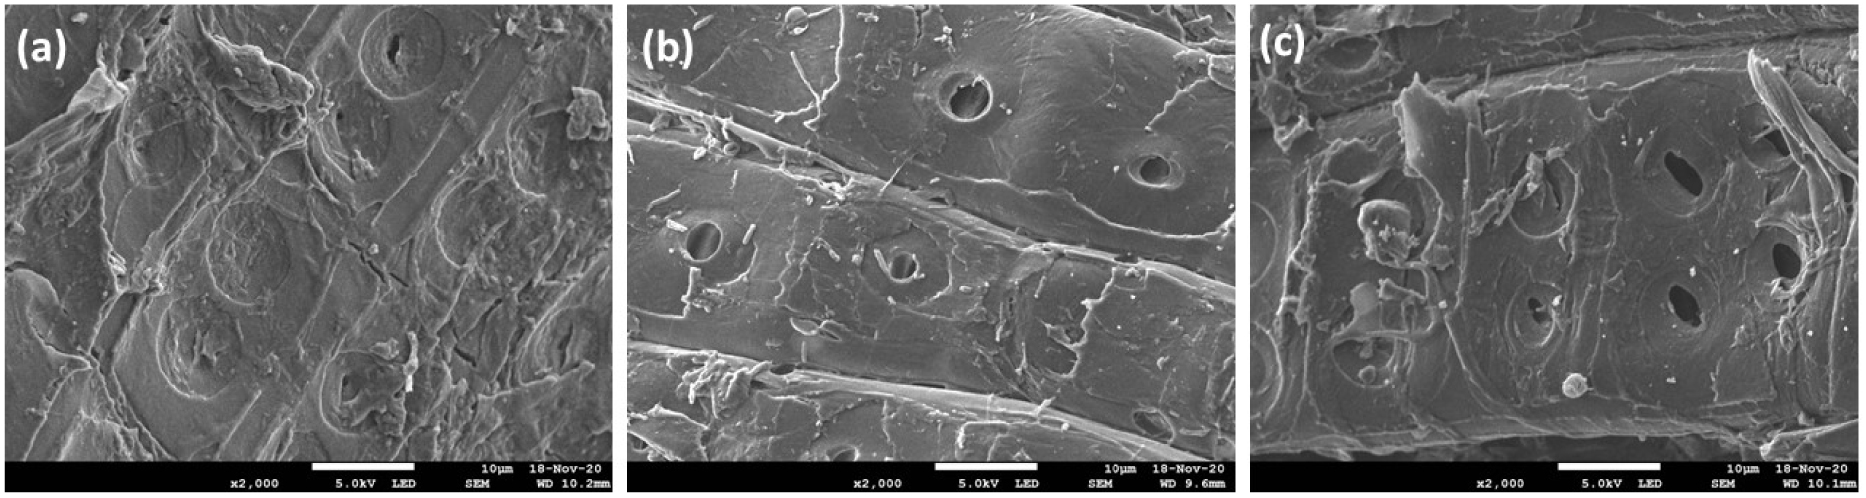
In terms of elemental significance, the EDX analysis was carried out for the three latter samples and results are reported in the supplementary materials. The ROS presents a large number of metals that are commonly found in the majority of lignocellulosic feedstocks, namely calcium, magnesium, potassium and sodium (Annex A1.a). After MB adsorption, the biomass spectrum did not present any trace of these metals (Annex A1.b). The presence of MB in the solution increased the counter-migration force of these ions from solid to liquid media, thus leaving free functional spaces for dye molecules to be adsorbed on ROS [40]. On the other hand, the intensity of sulfur peak increased as an indicator of the successful MB adsorption onto the biomass. Comparable findings were reported by Dao et al. [60] when studying the adsorption of MB onto activated carbon. After MB desorption at a pH of 3 and NaCl concentration of 0.2 M, we can remark that the corresponding EDX spectrum presents traces of sodium and chloride ions on the ROS’ surface (Annex A1.c). Since the concentration of salt used was relatively high, possible deposition of NaCl on the regenerated ROS could have occurred [27]. Moreover, the intensity of sulfur peaks decreased after adsorption, this confirms the release of MB and regeneration of biomass’ matrix. This observation also showed that the use of NaCl and HNO3 at relatively high concentrations did not cause any major changes in the structure of the lignocellulosic matrix. Such an outcome suggests the possible reuse of the adsorbent for recurrent adsorption/desorption cycles.
3.2.2. X-ray diffraction analysis
The structural and crystalline modifications endured by the ROS after the MB adsorption/desorption were followed using the XRD analysis (Figure 6). The diffractogram representing ROS’ crystallography showed three distinctive peaks that are typical of lignocellulosic materials [61, 62]. The first peak recorded at 14.88° (2𝜃) followed by another broad one at 22.46° (2𝜃) correspond to the aromatic sheets of the amorphous structure of Cellulose I [40, 63]. The third peak was registered at 34.75° (2𝜃) and was assigned to 1/4th of cellobiose molecule length presenting the constituting unit of the long-chained Cellulose I biopolymer [64]. After adsorption, a small shift of these three peaks was remarked in the MB-loaded-ROS diffractogram. These peaks were registered at 15.09°, 22.58° and 34.59° (2𝜃), respectively. This small shift could be explained by the effect of MB retention by the cellulosic structure. Indeed, dye adsorption at early kinetic stages could be physically driven, mainly by establishing low-energy hydrogen bonds with aromatic fractions and the saturation of macro- and mesopores present in hemicellulosic fibers [35, 65]. After MB desorption, the overall structure of Cellulose I remained intact with minor shifts to lower diffraction angles compared to the loaded biomass, notably at 15.02°, 22.54° and 34.51° (2𝜃), respectively (Figure 6). These observations suggest that the desorption of MB at low pH of 3 and an NaCl concentration of 0.2 M was partially effective in the regeneration of the dye-loaded ROS.
XRD diffractograms for ROS, ROS loaded with MB (ROS + (MB)) and MB-loaded-ROS after desorption (ROS − (MB)).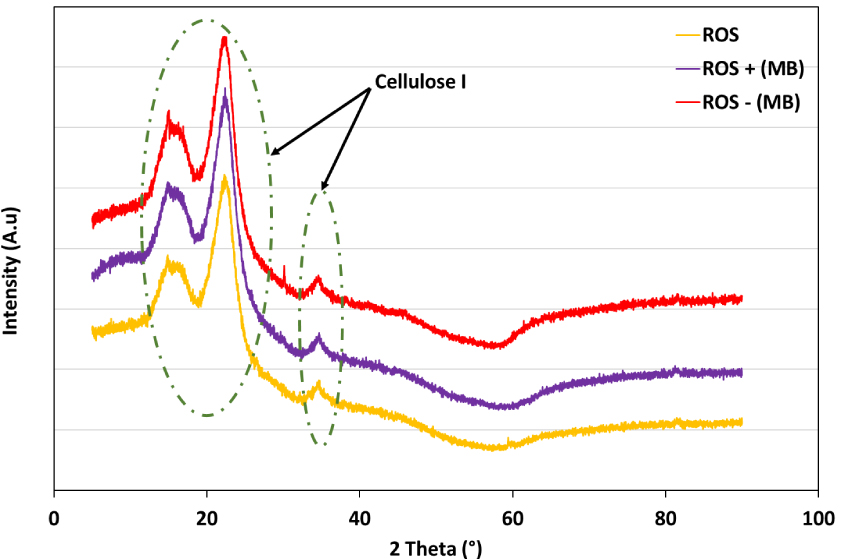
3.2.3. Fourier transform infrared spectroscopy
Infrared spectroscopy is a very useful characterization technique that allows the identification of the surface functional groups involved in the adsorption/desorption reaction. The spectra of ROS, MB-loaded-ROS before and after MB desorption are presented in Figure 7.
First of all, it is important to underline that the ROS presents a very heterogeneous surface with a multitude of acid and basic functional groups. A wide concentration of bonded and free hydroxyl groups (–OH and O–H, respectively) where detected at wavenumbers between 3500 cm−1 and 3390 cm−1, characterizing the content of this biomass in lignin, cellulose and hemicellulose. The stretch detected at 1702 cm−1 corresponds to C=O bond stretching in aldehydes or carboxylic acids while the peak noted at 1406 cm−1 is related to C–O. Finally, the aromatic groups (out of plan –CH groups) were identified with the peaks recorded between 780 cm−1 and 590 cm−1.
FTIR spectra of ROS, ROS loaded with MB (ROS + (MB)) and MB-loaded-ROS after desorption (ROS − (MB)).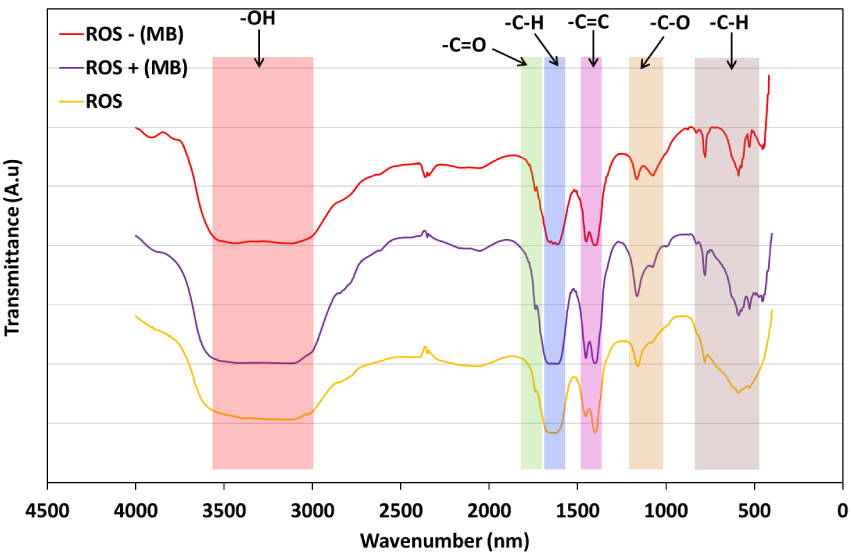
After dye adsorption (Figure 7), few peak shifts were detected on some specific functional groups namely C=O bonds (−14 cm−1), C–O esters (−20 cm−1) and aromatic –C–H groups (+11 cm−1). This finding suggests the involvement of both acid and basic functional groups in the adsorption of MB onto ROS either by electronic binding with negatively charged sites such as hydroxyl and ester groups or by an ion exchange reaction with positively charged functional groups such as carboxylic and aromatic groups. After the MB desorption, it has been found that except for the hydroxyl group peak, all other peak intensities in the related spectrum have significantly decreased when compared to the MB-loaded-ROS one (Figure 7). This could be attributed to the freeing of some surface functional groups under the effect of NaCl and HNO3. Indeed, the hydroxyl band range remained wide between 3500 cm−1 and 3380 cm−1 but increased in intensity, which confirms that some –OH groups were freed during the desorption process. Moreover, peak shifting was observed for esters (−4 cm−1) and aromatic groups (−10 cm−1) (Figure 7) indicating that these functional groups were involved during the MB desorption process. Comparable observations were reported by Jing et al. [66] when following the desorption of dimethyl phthalate (DMP) and diethyl phthalate (DEP) from peanut hull and wheat straw biochars using CaCl2-based eluents. During their study, specific changes for oxygen-containing functional groups were spotted, namely for hydroxyl (–OH), aromatic (C=C), amides and carboxylic acids groups (C=O), which significantly decreased in intensity when adsorbing DMP/DEP molecules, which subsequently increased after CaCl2/leaching. Similar outcomes were also exhibited by Momina et al. [67] when studying the desorption of MB from bentonite adsorbent using HCl solutions. The peaks characterizing the hydroxyl and carboxylic groups have significantly increased after dye removal groups, allowing the freeing of oxygen functional groups and the release of MB molecules with an efficiency estimated at about 70%. According to Liu et al. [68], the presence of salts and acids in aqueous solutions causes the inversion of the adsorbent’s pHZPC into a dominating cation charge surface. Such conditions might lead to the liberation of MB molecules from MB-loaded-ROS to establish a thermodynamic equilibrium between liquid and solid media.
According to the analysis results cited above, it can be deduced that the MB desorption from ROS at low pH (3) and high NaCl concentrations (0.2 M) could be driven by two different but complementary mechanisms: (i) physical and (ii) chemical processes. For the first one (physical), the MB release might occur at very early kinetic periods where the simple contact with the salty solution triggers a leaching-like reaction leading to the liberation of small MB amounts. The desorbed MB might concern mainly the molecules that have been physically adsorbed through low-energy type of bonds such as Van der Waals and hydrogen bonds [39, 54]. The second desorption type (chemical) is susceptible of being the most prominent mechanism explaining the release of MB from the MB-loaded-ROS. Indeed, according to the FTIR and EDS results, the desorption of MB is mainly driven by an ion exchange reaction between the cations existing in the eluent solution (Na+ and H3O+) and the MB molecules occupying the functional groups present on the ROS’ particle surfaces. At important NaCl concentrations and high acidity, the protons resulting from the desorbent’s ionization (Equations (7) and (8)) could cause a thermodynamic imbalance between the liquid and the solid fractions [50]. An overall decrease in Stern’s surface tension of the biomass (Equations (9) and (10)) and a significant decrease in the adsorbent pHzpc value due to the presence of HNO3 (Equations (11) and (12)), lead to the release of MB molecules along with other metals, notably Mg2+, K+ and Ca2+. This tendency is therefore characterized by the liberation of many negatively charged functions that were previously occupied by the protons (H3O+) and cations (Na+) [39, 69].
(i) HNO3 ionization equations:
| (7) |
| (8) |
(ii) MB desorption with regards to sodium chloride ions:
| (9) |
| (10) |
(iii) MB desorption with regards to hydronium ions:
| (11) |
| (12) |
4. Conclusions
This research paper investigated, under different experimental conditions the simultaneous use of NaCl and HNO3 solutions as efficient and low-cost eluents for the regeneration of orange tree sawdust loaded with methylene blue. The simultaneous variation of three experimental parameters through a factorial design showed that MB desorption could reach about 83% of the total adsorbed dye quantity. The statistical study suggested the following significance order: Dose of MB-loaded-ROS Desorbing solution’s pH > Desorbing solution’s NaCl concentration. The characterization of the biomass before and after desorption experiments suggested that the release of MB was mainly performed via the breaking of strong electronic covalent bonds between dye molecules and the carboxylic, aromatic and hydroxyl groups on the surface of the biomass. Moreover, the desorption process did not affect the crystalline structure of the lignocellulose which confirms its possible use for multiple adsorption/desorption cycles. Further examination is required regarding the recovery/treatment of the desorbing solution.
Acknowledgments
This research work has been carried out in the framework of a Tunisian national project. Financial support of this work by the Tunisian Ministry of Higher Education and Scientific Research is gratefully acknowledged.
Supplementary data
Supporting information for this article is available on the journal’s website under https://doi.org/10.5802/crchim.83 or from the author.