

1 Introduction
Thermochemical conversion of biomass could reduce the dependence on conventional fossil fuels and the carbon dioxide emission into the atmosphere.
Gasification of residues from agricultural production can reduce the volume of waste, allow energy recovery and increase the economic returns of rural communities. Worldwide there is an increasing interest among researchers in the downdraft gasification of biomass (Fig. 1) due to its suitability to produce a gas with a very low tar content (1%) in comparison with other gasification technologies [1].
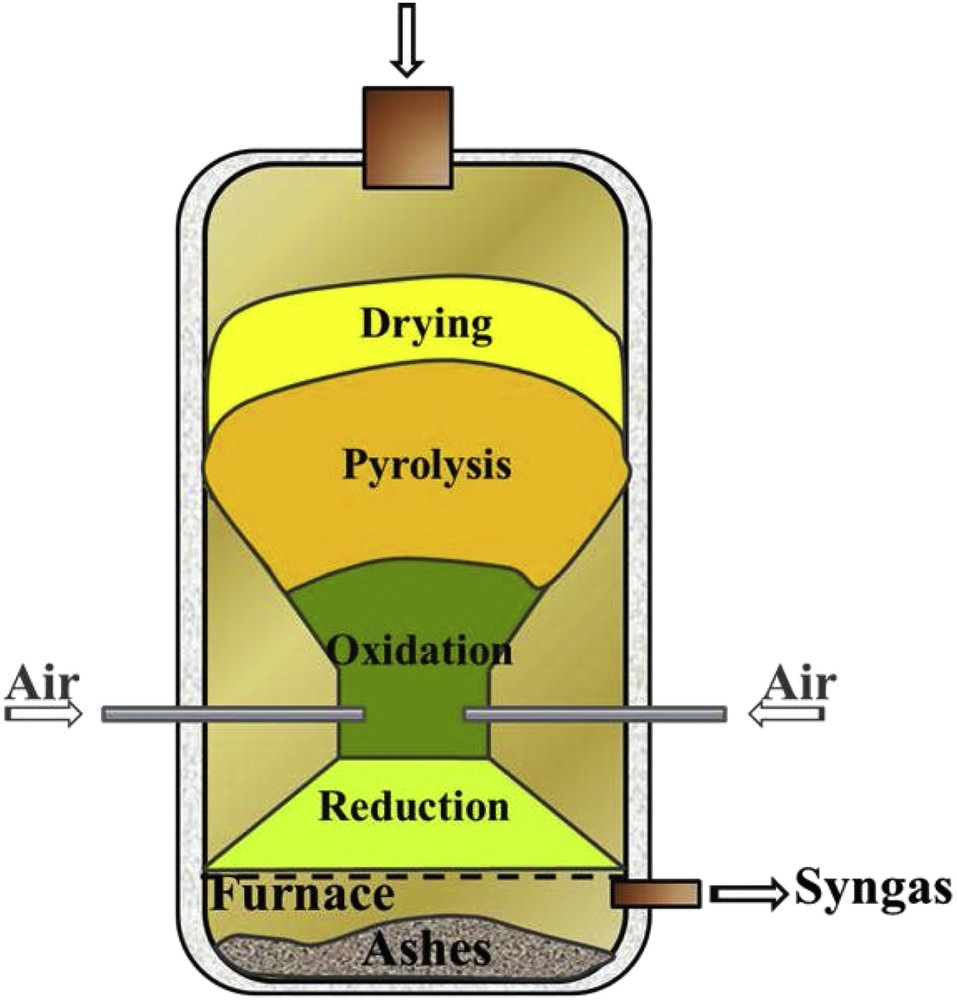
Scheme of a downdraft gasifier.
Biomass gasification is carried out under substoichiometric conditions of the oxidant. The gasification is a very complex and sensitive process affected by a great number of factors: chemical composition, size and moisture content of biomass, characteristics of the input air to the gasifier (in terms of flow, temperature and quantity as compared with stoichiometric air), process temperature and pressure, heating rate, gasifier design and so on. Therefore, the physical and chemical properties of producer gas such as its chemical composition, heating value and temperature significantly vary as a function of the above-mentioned factors.
Many experimental research studies have been carried out to evaluate the influence of different biomass characteristics (e.g. moisture content, chemical composition and heating value) and operating conditions (e.g. equivalence ratio, reaction temperature and use of catalysts) on the performance of a gasifier [2–8].
It can be very useful to develop gasification process models, which predict the “quality” of producer gas as a function of the gasifier operating conditions and biomass characteristics. Modeling the gasification process is very complex because it requires the knowledge of thermodynamic, fluid dynamic and chemical phenomena. Thermodynamic equilibrium, kinetic, and computational fluid-dynamic (CFD) models or artificial neural networks (ANN) may be used to carry out the gasifier simulation.
The main advantage of the equilibrium models is that they are relatively easy to implement and rapidly convergent [9, 10].
Even if thermodynamic equilibrium models are an approximation of the reality and have some inherent limitations, they give the theoretical performance of the conversion process in the long time limit and it is suitable as a simulation tool for processes whose duration is usually quite long with respect to the reaction timescale [11, 12].
Their application to thermochemical biomass conversion processes (pyrolysis and gasification) can often give a useful insight: these processes are usually quite slow and then, given the long residence time, the products are not far from equilibrium. Anyway, thermodynamic equilibrium models could not give a real representation of the process when the operating temperatures are relatively low (below 800 °C), because in this case the thermodynamic equilibrium is not attained [13].
Particularly, although the application of these kinds of models has inherent thermodynamic limitations, they can describe gasification processes with good approximation, especially in the case of downdraft gasifiers. Indeed, this kind of gasifier usually operates close to equilibrium conditions [14]. This can be attributed to the fact that, in downdraft gasifiers, gasification products are forced through the oxidation zone which has the highest temperature. This enables the establishment of the equilibrium in a relatively brief time period.
Many studies have demonstrated the successful application of the global stoichiometric equilibrium approach to model downdraft gasifiers [15–19]. However, other studies propose different approaches to model the piro-oxidation and the reduction zone of the downdraft gasifier, an equilibrium approach for the pyro-oxidation zone and a kinetic approach for the reduction zone [20–22]. Reference [9] has compared experimental data with the theoretical predictions obtained through an equilibrium model and a kinetic model in the reduction zone for a downdraft gasifier.
Another advantage of the thermodynamic equilibrium models is that they are independent of the gasifier dimensions and typology, so they may be more suitable for studying the influence of fuel and process parameters [23–25]. Anyway, this advantage is also a disadvantage of this kind of method, in fact, if the geometry of the gasifier is not taken into account in the methodology which predicts the yield and the composition of the producer gas, the model cannot provide the appropriate gasifier dimensions to the designer [26].
The thermodynamic equilibrium models can be non-stoichiometric or stoichiometric [27]. The first type of model is based on the Gibbs free energy minimization. It does not need to know the gasification process chemistry [28]. The second type of model is based on the calculation of the thermodynamic equilibrium constants. This approach requires the exact knowledge of the chemical reactions that take place [15, 16]. Anyway the two approaches (non-stoichiometric or stoichiometric) are essentially equivalent [23].
This study proposes a global stoichiometric equilibrium model for a biomass downdraft gasifier, which allows evaluating the chemical composition, the heating value and the temperature of the producer gas. The stoichiometric equilibrium models are preferred when the fuel chemical formula is exactly known (e.g. derived through the ultimate analysis). Otherwise, non-stoichiometric equilibrium models are suitable for fuels whose chemical composition is not exactly known.
The equations of mass and energy balance and thermodynamic equilibrium equations have been implemented and solved in the Matlab environment. Therefore, we have validated the model through experimental data and subsequently we have calibrated it on this basis. Furthermore, we have carried out a sensitivity analysis for investigating the influence of the variation in the biomass moisture content and in the equivalent ratio.
2 Materials and methods
The equilibrium model was based on the following assumptions. The gasifier operates under steady state conditions at a pressure of 101.13 kPa. The vapor residence time inside the gasifier is sufficient to reach the chemical equilibrium under adiabatic conditions. We assumed that the supplied air is dry at a temperature of 25 °C and a pressure of 101.13 kPa. Ashes are inert. The producer gas is an ideal gas constituted by CO, CO2, H2, CH4, H2O, N2 and tar.
Based on the above assumptions, the global reaction of the biomass gasification process used is:
| (1) |
With reference to 1 mol of biomass, in (1): the subscripts h, o and n are the number of atoms of hydrogen, oxygen and nitrogen; w is the number of moles of H2O; a is the number of moles of gasifier input air; the terms xi (i = 1–6), on the right hand side of the (1), indicate the number of moles of the chemical species in the producer gas.
The terms xtar and xchar respectively indicate the number of moles of tar and char produced from the gasification of 1 mol of biomass.
According to the results of the study of Yamazaki et al. [29], the maximum tar yield for the downdraft biomass gasification is 4.5% (mass percentage). Therefore, the present study considered the same value of the tar yield. The corresponding mole number, xtar, is an input parameter in the gasification model as in other literature studies [30, 31].
In accordance with the typical product yield suggested by Bridgewater [32], for pyrolysis and gasification of wood, this study considered a char yield of 10.5% (mass percentage). Similar to the tar, the mole number of char, xchar, was an input parameter in the gasification model [31].
Particularly, tar yield estimation is a difficult task through a thermodynamic equilibrium model, because tar is typically a non-equilibrium product.
Due to this difficulty, for example, the tar yield is neglected during the combustion-gasification stage, in the study of Vera et al. [33]. In the study, the ER was regulated to set the temperature above 1000 °C to promote thermal tar cracking [34, 35]. In another thermodynamic equilibrium model, instead, it is assumed that the tar fraction can be added to the char fraction, i.e. it is assimilated to solid carbon [11].
In our model, the tar yield was considered and reasonably fixed equal to 4.5%, on the basis of the following considerations:
- • the model simulates the gasification process in a downdraft gasifier, that is well known to produce a very low percentage of tar, variable between 1% and 5% [36];
- • high temperatures result in less char and tar formation and high gas yields (the last almost 85% wt of the biomass fueled) due to improved carbon conversion and steam cracking and reforming of tars independent of operating conditions [37, 38];
- • the tar yield must be very low and, above all, its production would be almost constant, considering that the tar cracking occurs at 950–1000 °C and that the temperature reached was about 950 °C in all the examined cases, independent of the oxidation air supplied. Moreover, the percentage of 4.5 was fixed independent of the operating conditions, since it was the one that gave the best agreement with the experimental data, on the chemical composition of the producer gas, in all the different experiments taken into account (with ER varying between 0.230 and 0.379).
The char yield was fixed on the basis of tar and gas yields.
Mathematical models on the gasification process showed that model predictions improved substantially when the tar formation was included in the model [39]. The same was verified in our case, even if the dependence of tar and char yield on operating conditions was not considered.
The chemical formula used for representing tar is C6H6O0.2 [9,40–43] and the thermochemical properties of tar assumed are the same as benzene [40, 44].
The char chemical formula is “C” and its thermochemical properties are assumed to be the same as graphite [40–42, 45].
The biomass chemical formula, CHhOoNn, was derived through its ultimate analysis.
The number of moles of water w was calculated as a function of the biomass initial moisture content (MC) [18].
The equivalent ratio (ER) was defined as the ratio between the supplied and the stoichiometric air. The number of moles, a, of the gasifier input air was calculated as a function of ER [46]:
| (2) |
The unknown quantities of reaction (1) are the mole numbers xi, except for x6 as nitrogen is considered inert. The equilibrium temperature, T, is also unknown. Globally, the unknown quantities are six, so they can be calculated solving a system of six equations: three mass balance Equations, (3), (4) and (5); two Equations, (8) and (9), for the equilibrium constants, k1 and k2, of the chemical reactions taken into account; one equation of the gasifier energy balance, (13).
The mass balance equations of carbon, hydrogen and oxygen are:
| (3) |
| (4) |
| (5) |
Two independent equilibrium reactions are sufficient for modeling the gasification process [31], the methanation reaction (6) and the water-gas shift reaction (7) [16]:
| (6) |
| (7) |
The equilibrium constants, k1 and k2, of the reactions (6) and (7) are expressed as [16, 22, 47, 48]:
| (8) |
| (9) |
The constants k1 and k2 are calculated as a function of the absolute temperature T and the Gibbs free energy, which is in turn a function of the formation enthalpy, :
| (10) |
R is the ideal gas universal constant.
The formation enthalpy, , which is a function of the temperature and specific heat at constant pressure Cp(T), is calculated through (11) according to reference [15]:
| (11) |
The value of Cp(T) is evaluated according to [49] and [16]. Therefore, the generic equilibrium constant k is obtained by:
| (12) |
The global energy balance equation is [17]:
| (13) |
In Equation (13), r indicates the reagents and p indicates the products of the (1), while x is the number of moles and ΔhT,p is the enthalpy difference between the temperature T and the standard conditions. The biomass formation enthalpy in the first member of (13) is calculated according to ref. [50], as a function of the lower heating value LHV.
The iterative resolution of model equations allows obtaining the number of moles x1, x2, x3, x4, and x5 and the equilibrium temperature T.
Fig. 2 shows the algorithm scheme of the numerical model developed in the Matlab environment.
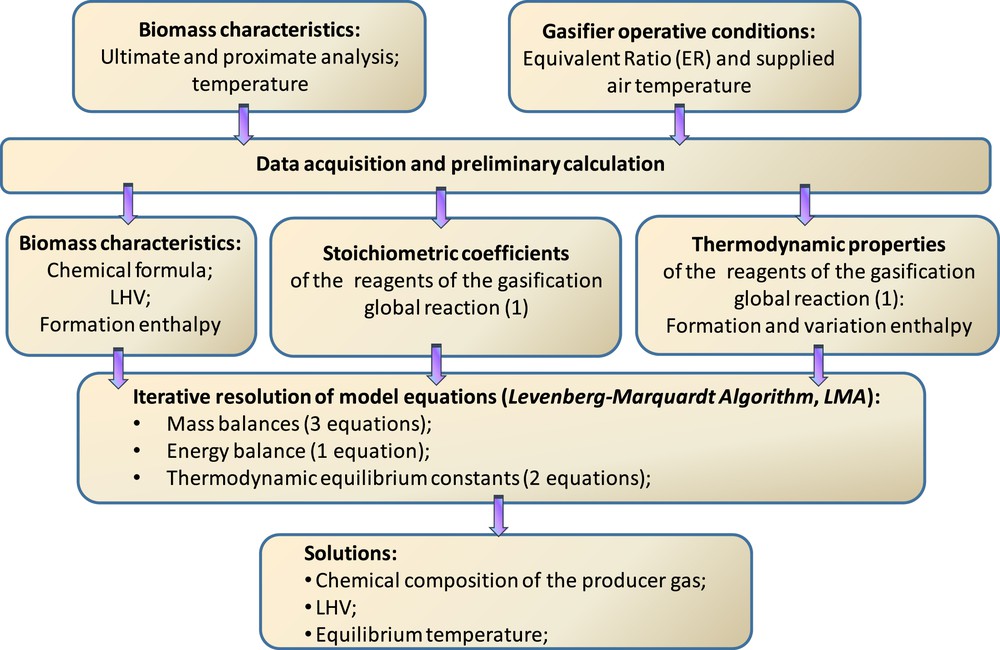
Matlab resolution scheme of the developed model.
3 Results
3.1 Validation of the model
We have validated the mathematical model comparing the results of the simulation with the experimental data of [2] and [3], which are referred to a process of gasification in a downdraft gasifier.
The comparisons, between the simulated and the experimental results, were done considering all the main combustible gases in the producer gas (CO, H2, and CH4) and the LHV. Such comparisons were repeated for different ERs and moisture contents for a total of 16 cases.
Tables 1 and 2 summarize the biomass chemical composition and the gasifier operating conditions used for the model validation. It is possible to notice that although the two biomasses have a very similar chemical composition, the two sets of experiments were carried out using different moisture contents (MCs) and equivalent ratios (ERs).
Ultimate analysis of the biomasses used for the model validation.
| Ref. | Biomass | C (%) | H (%) | N (%) | O (%) | Ash (%) | LHV (MJ/kg) |
| [2] | Pellets (Biomass 1) | 50.7 | 6.9 | <0.3 | 42.4 | 0.39 | 18.86 |
| [3] | Rubberwood (Biomass 2) | 50.6 | 6.5 | 0.2 | 42 | 0.7 | 19.6 |
Gasifier operating conditions of the experiments used for model validation.
| Ref. | Biomass | MC (%) | ER |
| [2] | Pellets (Biomass 1) | 6.38–8.00 | 0.23–0.27 |
| [3] | Rubberwood (Biomass 2) | 12.5–18.5 | 0.30–0.38 |
Figs. 3, 4, 5 and 6 show the comparison, for H2 and CH4, between simulated and experimental data, as a function of the biomass moisture content (MC).
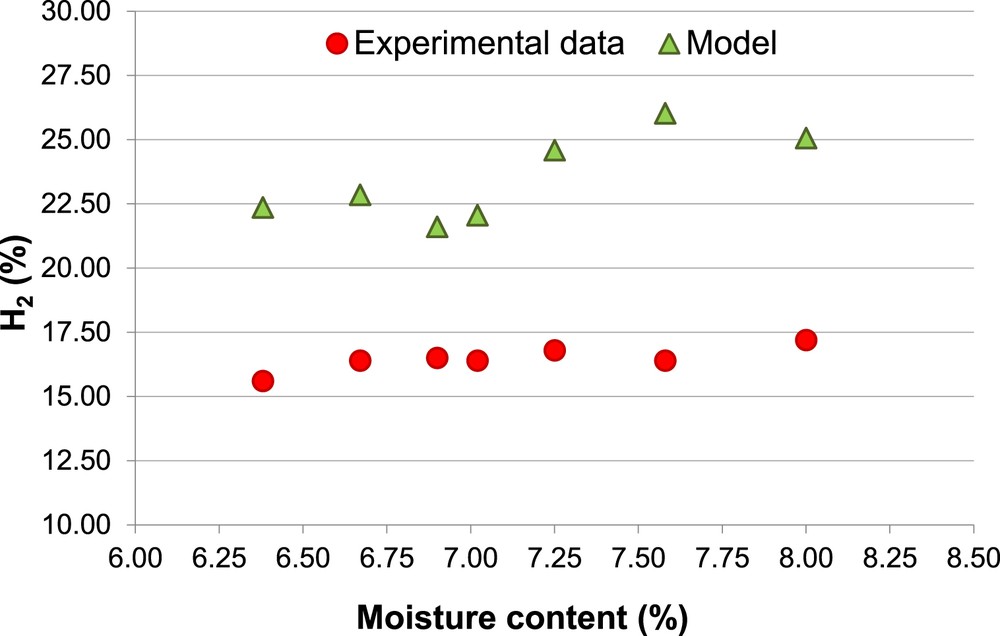
Percentage of H2, Biomass 1 (non-calibrated model).
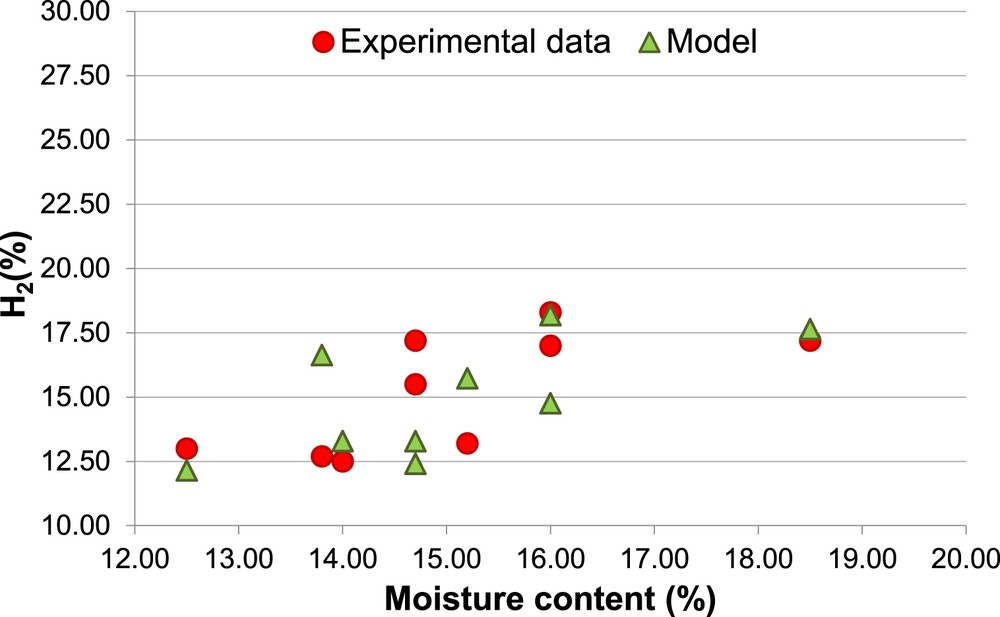
Percentage of H2, Biomass 2 (non-calibrated model).
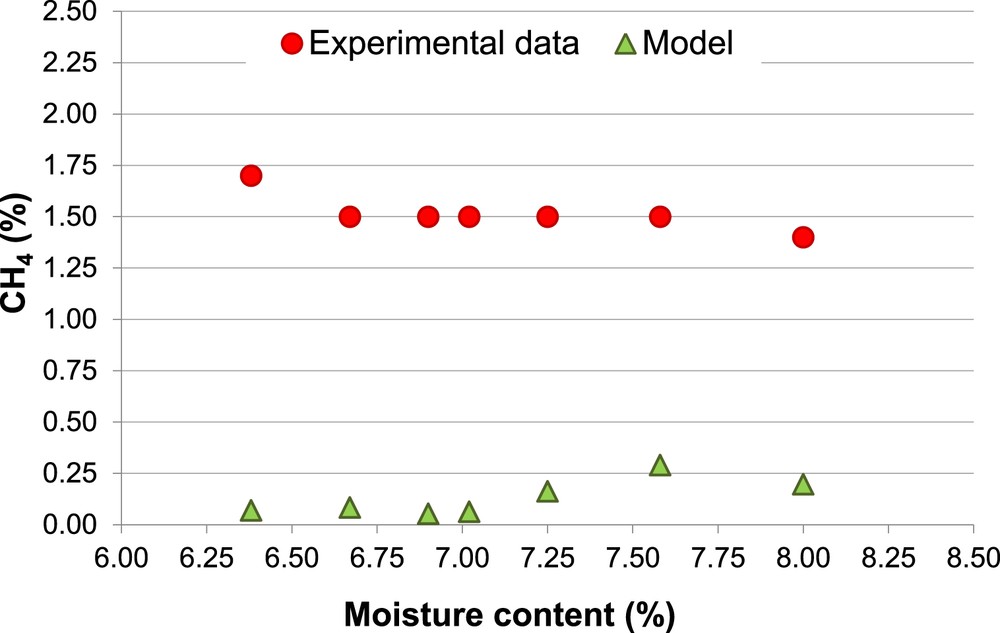
Percentage of CH4, Biomass 1 (non-calibrated model).
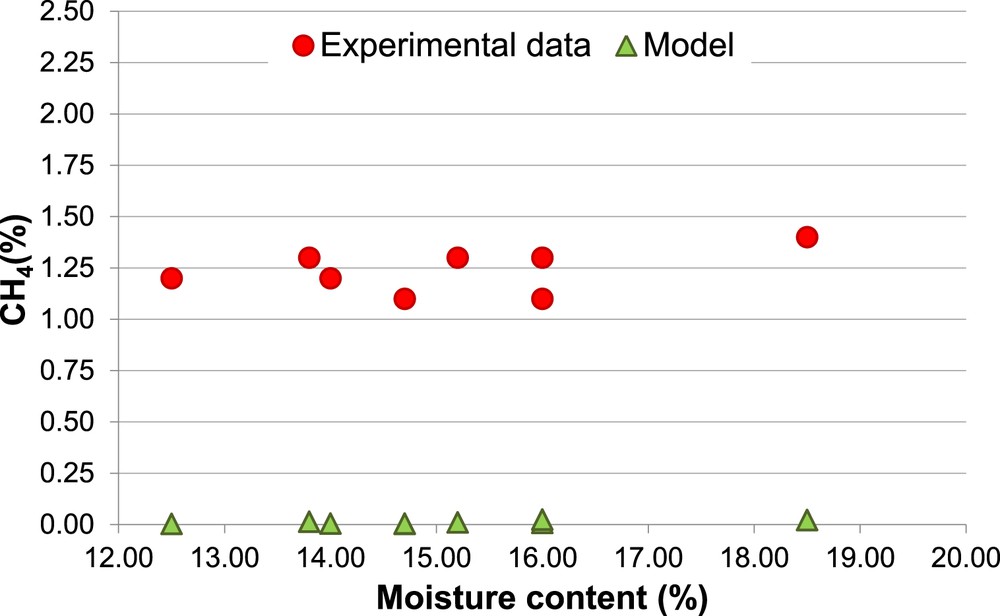
Percentage of CH4, Biomass 2 (non-calibrated model).
The different percentages of H2 and CH4 (Figs. 4 and 6) associated with the same MC (14.7% and 16.0%) are due to the different values of ER used in the experimental procedure.
It is possible to observe that the amount of H2 is overestimated by the model, for Biomass 1, with an average error (Ea) of 43%, while, for Biomass 2, the model prediction of H2 shows both overestimation and underestimation, with an average error (Ea = 15%).
Moreover, the predicted increase of the amount of H2 with the MC, for both the biomasses, is in agreement with the experimental data. This result is a consequence of the “equilibrium moving” of the water-gas shift reaction versus the products when the MC increases.
The model results always underestimate the amount of CH4, CO and LHV. Moreover, there is a further inconsistency between the experimental and the predicted amount of CH4, the first ones show modest variations of CH4 as a function of both MC and ER, while the second ones are much more sensitive at the variations of those two parameters.
The average error of the model in the prediction of the amount of CO and LHV are, respectively, 16% and 13%.
Regarding the amount of N2 and CO2 predicted by the model, there is a very good correspondence for N2 (Ea = 5%), whereas the CO2 percentage is overestimated by the model with an Ea of 15%. The error in CO2 prediction increases with the moisture content because of the equilibrium moving of the water-gas shift reaction versus the product.
The above presented results, particularly the prediction of H2 and LHV, are quite satisfactory; thanks to the introduction, in the numerical model, of the char and tar formation.
Even if the model shows a general tendency to overestimate the H2 percentage and to underestimate the CH4 percentage in the producer gas, this is a typical behavior of the thermodynamic equilibrium models. Particularly, the underestimation of the CH4 mole fraction is due to the fact that, in the real gasification processes, the producer gas does not achieve complete equilibrium conditions inside the gasifier (as indicated by the presence of methane in the experimental data). For this reason, to prevent the complete consumption of methane, in literature models different strategies were chosen. Some models use a correction coefficient to move the methanation reaction to the CH4 production (avoiding its consumption). Some studies on gasification modeling do not include a fraction of CH4, formed during the pyrolysis process, in the combustion-gasification stage bypassing it to the gas outlet [33, 51, 52].
3.2 Calibration of the model
Based on the previous comparison, it is necessary to proceed with the calibration of the model for improving its reliability.
It was observed that the modification of the equilibrium models by incorporating empirical parameters or correlations based on experimental studies helps in increasing the accuracy of the models.
In accordance with literature studies [16, 53], the equilibrium constant, k1, of the methanation reaction was modified by introducing a correction coefficient, Ck1, for moving the reaction equilibrium versus the CH4 production and the H2 consumption. Moreover, the equilibrium constant, k2, of the water-gas shift reaction was modified by introducing a correction coefficient, Ck2, for moving the reaction equilibrium versus the CO production and the H2 consumption. The correction coefficients Ck1 and Ck2 were assigned taking in account the different moisture contents of the two biomasses.
Then, to reduce one of the main limits of the thermodynamic models that, as well known, tend to underestimate CH4, a new correlation between the biomass moisture content (MC) and the equivalent ratio (ER) has been introduced.
Some studies indicate that too small ER tends to reduce the reaction temperature and, consequently, the biomass gasification is not facilitated. On the other hand, too large ER results in the consumption of more H2 and other combustible gases, through oxidization reactions, causing the decrease in the LHV of the producer gas. Thus, the ER has two opposing effects and the appropriate choice of the ER is a very important task [37, 54].
The biomass moisture content is one of the operating variables that can drive the choice of the most appropriate ER. The moisture content in the feedstock has been found to have a very deteriorating effect on the quality of the producer gas.
It was observed that an increase of the fuel moisture content causes the decrease of the average temperature of the gasifier due to the production of water vapor.
On the basis of these considerations and in accordance with the energy balance equation, the ER must increase when the moisture content also increases. In this way, the higher mass of air provides the energy for vaporization of the moisture avoiding the temperature decrease.
Therefore, for improving the model accuracy and solving one of the main limits of the thermodynamic model (i.e. CH4 underestimation), we have introduced a new correlation which links the ER with the biomass moisture content.
The following preliminary correlation is proposed:
| (14) |
The coefficients in Equation (14) were obtained through the best fit with the experimental results. The R2 value of the (14) was 0.98.
Consequently, for improving the prediction of the CH4 concentration, we have fixed the ER value in the simulations. The chosen values were calculated through Equation (14) considering the average values of the MC of the two biomasses. Thereby, the values of 0.23 and 0.294 were chosen, respectively, for Biomass 1 and Biomass 2.
Figs. 7, 8, 9 and 10 show the comparison, for H2 and CH4, between the results of the calibrated model and the experimental data, as a function of the biomass moisture content (MC).

Percentage of H2, Biomass 1 (calibrated model).
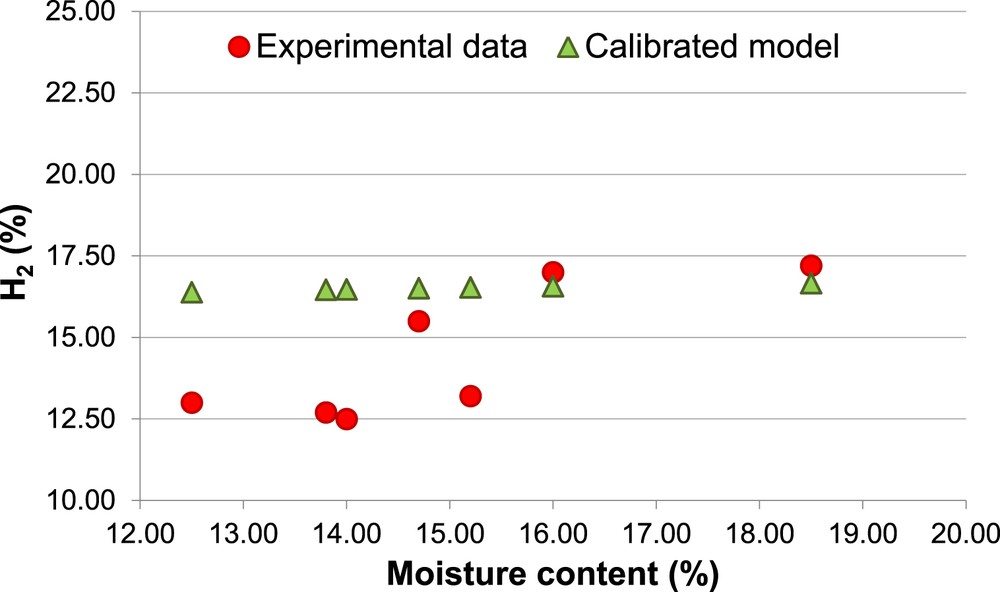
Percentage of H2, Biomass 2 (calibrated model).
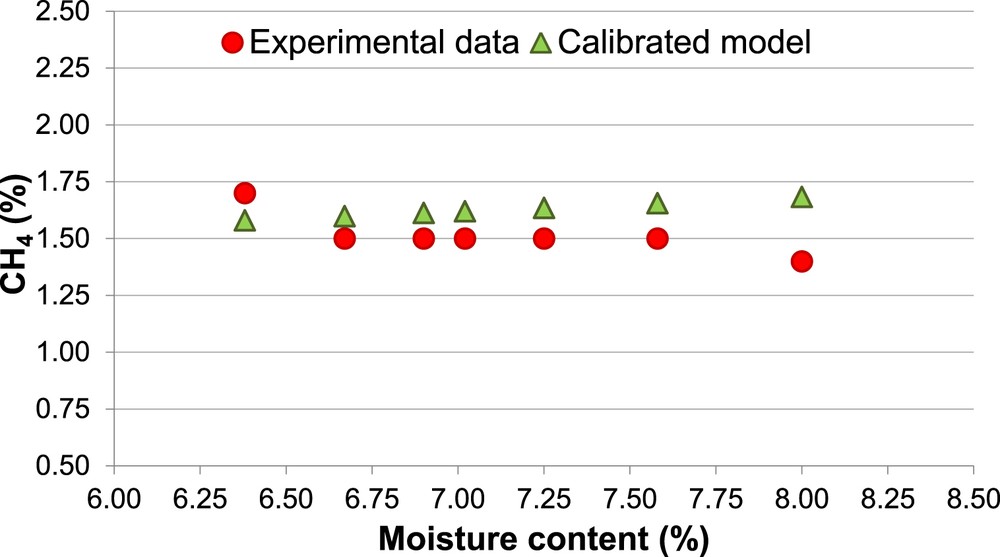
Percentage of CH4, Biomass 1 (calibrated model).
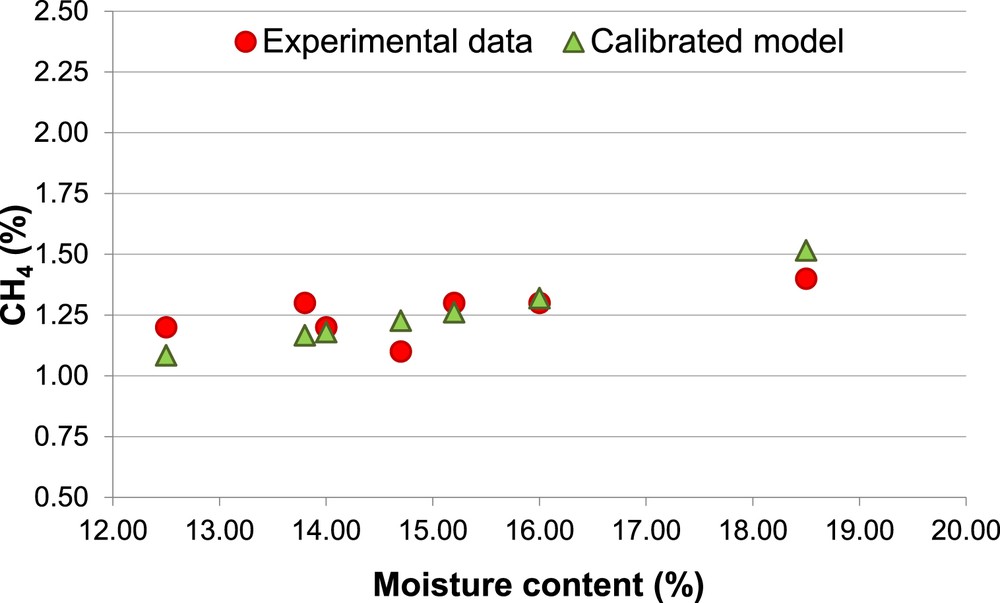
Percentage of CH4, Biomass 2 (calibrated model).
The calibrated model shows a clear enhancement in the prediction of the concentration of both H2 and CH4. The prediction of H2 percentage keeps slightly overestimated for both biomasses (Ea = 15%). Therefore, it is confirmed that the equilibrium models tend to overestimate the H2 content in the producer gas [55]. With regard to the CH4 and CO concentration, the calibrated model allows to reduce the Ea respectively to 6% and 9%.
Figs. 11 and 12 show the comparison between experimental data, non-calibrated and calibrated model, for all the gaseous species in the producer gas under specific operating conditions, that are MC = 8% and ER = 0.266 for Biomass 1 and MC = 16% and ER = 0.314 for Biomass 2.
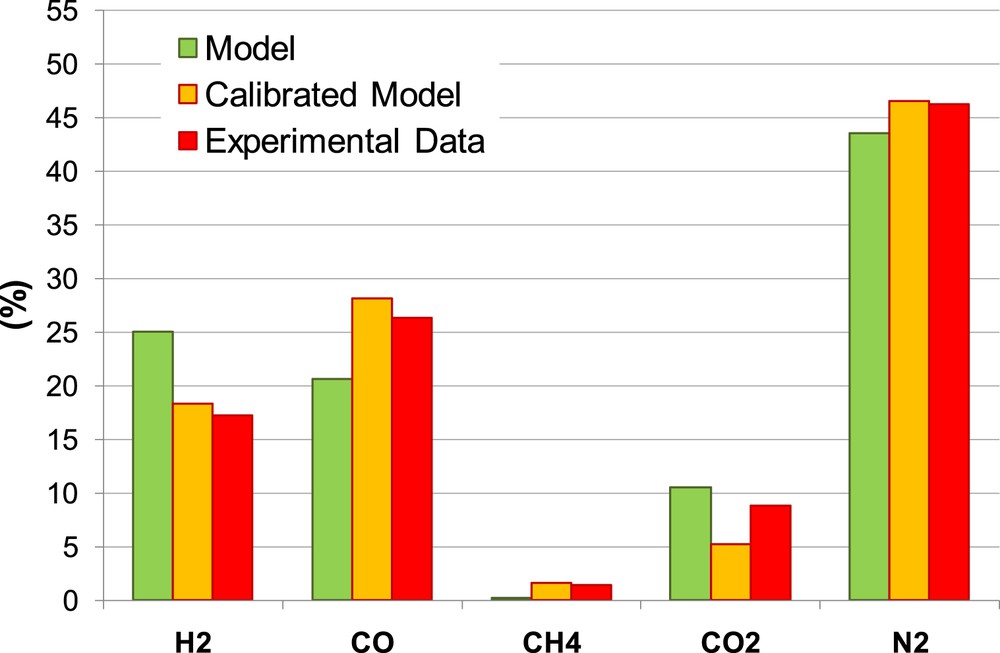
Producer gas composition Biomass 1.
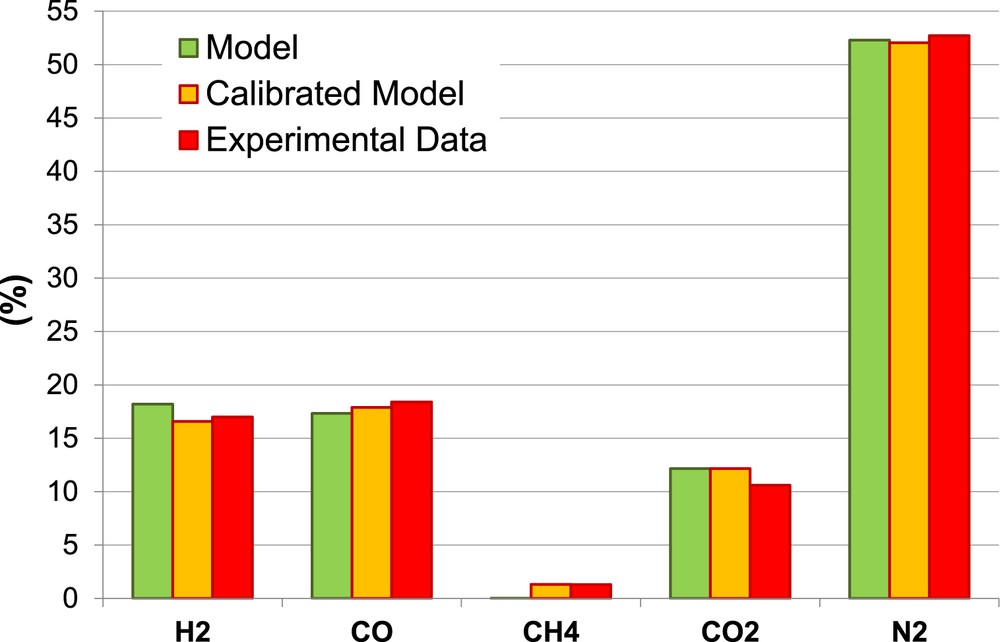
Producer gas composition Biomass 2.
The calibrated model shows a remarkable enhancement in the prediction of all gaseous species except for CO2 prediction. The calibration allows reducing considerably the overestimation of H2, and underestimation of CH4 and CO.
Globally, considering both biomasses and all the gasifier operating conditions, the calibrated model shows an enhancement in the prediction of LHV (Ea = 8%) compared to the non-calibrated model due to the enhancement in the prediction of the combustible gases: H2, CH4 and CO.
3.3 Sensitivity analysis
From the results, the biomass moisture content MC and the equivalent ratio ER are two of the most important parameters that influence the chemical composition of the producer gas. Thus, a parametric study has been performed to predict the producer gas reaction temperature, chemical composition and the LHV varying MC and ER in accordance with Equation (14).
Figs. 13 and 14 show the results of model sensitivity analysis.
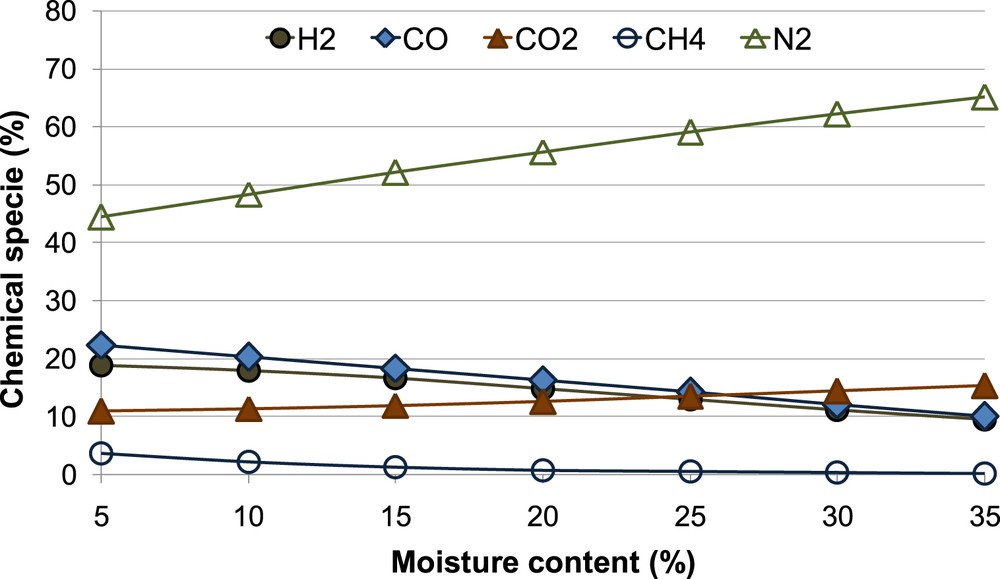
Producer gas composition as a function of increasing MC and ER.
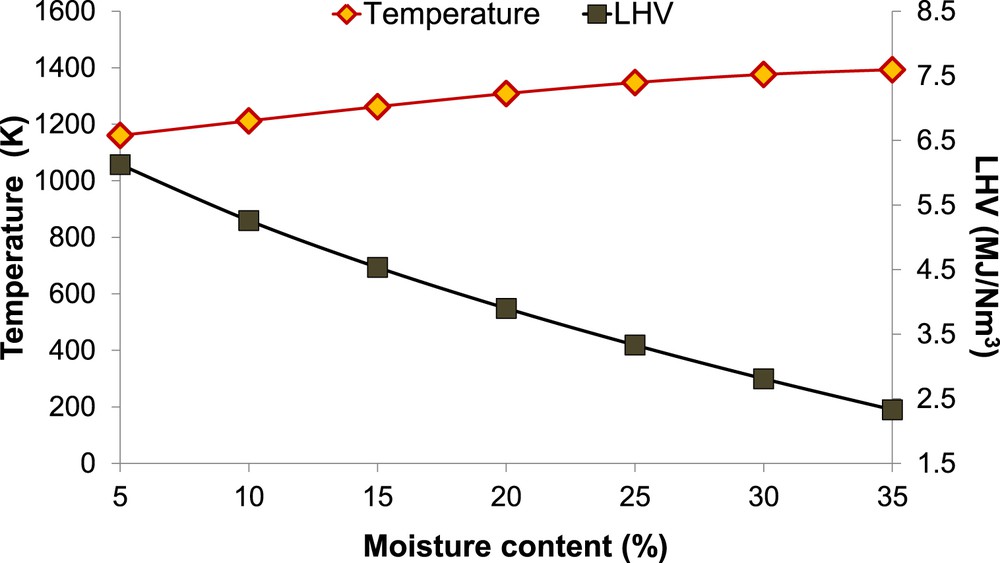
Temperature and LHV of the producer gas as a function of increasing MC and ER.
It is possible to notice that when the MC increases from 5% to 35%, the CO2 percentage also increases, while the CO percentage decreases to about 55%. This behavior depends on the moving of the water-gas shift reaction equilibrium versus the reaction products when the MC increases. Furthermore, it is possible to observe that the H2 percentage and the CH4 percentage decrease respectively by 50% and 95%. The N2 concentration obviously increases with the MC. These results are in good agreement with other numerical gasifier models [16, 17, 21].
It is possible to highlight that the LHV decreases by 62% when the biomass moisture content increases between 5% and 35% since much of the heat generated in the gasifier is necessary for the vaporization of the moisture and the subsequent superheating. It is further observed that at a fuel moisture content of 10%, the decrease in the LHV is of about 14% of the initial value (MC = 5%).
Other literature downdraft gasifier models [16–18, 21, 22, 56, 57] obtained similar results concerning the reduction of the LHV if MC or ER increases.
It is also possible to notice that the equilibrium temperature increases with the increase of the moisture content and the simultaneous increase of the ER. It is due to the fact that the heat energy required for water vaporization is extracted from the supplied air without reducing the gas temperature. This result, for example, is new knowledge with respect to the sensitivity analysis conducted by other authors increasing only the MC, where the process temperature decreased due to the increase of moisture alone.
4 Conclusions
This study presents a numerical model able to simulate the gasification process in a downdraft gasifier. The process of gasification is essentially described through a global reaction that includes all the gaseous species and the yields of char and tar.
Experimental data available from other literature studies were used for validating the results of the proposed model. Thereby, a good agreement between experimental data and the percentage of the chemical species in the producer gas (H2, CH4, and CO) predicted by the model was found. The average error was about 10% with reference to the chemical species and lower than 10% on the predictions of the LHV. Moreover, it was observed that the biomass MC and ER have a large influence on gasifier performance. Thus, we propose a novel correlation, which links the MC and ER, that was used for developing a sensitivity analysis of the model by varying the above-mentioned parameters.
This analysis shows that the LHV decreases and the temperature increases if the MC increases; we observed that the LHV decreases by 62% when the biomass moisture content increases between 5% and 35%.
Globally it is possible to affirm that the validated model is reliable for predicting the trend of the gas composition, heating value and equilibrium temperature, by varying the MC and ER.
Therefore the proposed model could be used to perform engineering simulations of downdraft gasification systems and to guide process design, evaluation and optimization of the gasification technology.
However, other validations of the proposed model are necessary and, in this context, biomasses with different chemical compositions will be tested, e.g. olive kernel, etc.
Moreover, to overcome the limitations of the hypothesized thermodynamic equilibrium, a further improvement of the present model will be performed considering the kinetic rates of the chemical reactions that take place in the reduction zone of the downdraft gasifier.
Acknowledgment
We gratefully acknowledge funding from the Italian Ministry of Education, University and Research (MIUR) through ProgrammaOperativoNazionaleRicerca e Competitività 2007–2013 “Valorizzazione Biomolecolare ed Energetica di biomasse residuali del settore Agroindustriale ed Ittico” (BIO4BIO PON02_00451_3362376).