





 CC-BY 4.0
1. Introduction
Graphene has demonstrated excellent mechanical [1], thermal [2], optical, and electronic properties [3], offering the potential for a range of applications in energy storage [4], catalysis [5], sensing [6], molecular separation [7], and protective composite coatings [8]. However, producing graphene in an environmentally friendly and cost-effective way remains a significant challenge [9]. One promising solution is the electrochemical exfoliation of graphite, which requires an electrolyte containing intercalation species, a graphite electrode as a source of graphene, and a power supply [10]. One approach that addresses these concerns is the utilization of recycled graphite waste as a sustainable and cost-effective source of graphene [11]. Other research has explored using graphene and graphene oxide, synthesized economically via the modified Hummers method, in battery manufacturing [12, 13, 14].
Efficient graphite exfoliation into graphene depends on both anion intercalation and water oxidation. Sulfate anions, due to their strong binding energy and reversible behavior, facilitate the entry of water into the graphite, which makes the exfoliation more effective [15]. Gupta et al. [16] demonstrated that the materials’ electrical properties enable an open-circuit voltage of around 250 mV and a maximum power of 22 μW. This study suggests that graphene oxide could be a cost-effective material for producing compact energy devices, highlighting its potential in the field of microbatteries. Commonly used anionic intercalation species include sulfate (SO42−) [17], perchlorate (ClO4−) [18], trifluoroborate (BF4−) [19], and hexafluorophosphate (PF6−) [20]. Sulfate is one of the most commonly used anions. It is highly effective in facilitating the exfoliation process in aqueous solutions of acidic or neutral inorganic salts, including those containing sulfuric acid and ammonium sulfate [21]. Graphene has emerged as a potential leader in the development of high-performance nanofluids thanks to its unique mechanical, thermal, and electrical properties [22, 23]. Even at low concentrations, graphene sheets are known to enhance thermal conductivity, enabling the development of high-performance cooling technologies, particularly for electronic devices [24, 25]. Furthermore, graphene can stabilize nanofluids by forming a protective layer around most of the released nanoparticles [26].
Nanofluids have found numerous scientific and industrial applications [27, 28]. However, due to their highly complex nature, predicting the thermophysical properties of these fluids has become a major research challenge [29, 30]. Some studies on the rheological behavior of nanofluids have focused on determining whether they are Newtonian or non-Newtonian fluids [31]. However, many factors influence the viscosity of nanofluids, such as temperature, pH, volume fraction, particle size, particle size distribution, zeta potential, and base fluid [32, 33, 34]. The influence of nanofluid viscosity on nanoparticle loading has been extensively studied [35, 36, 37]. The viscosity of nanofluids containing various types of nanoparticles, such as metals, oxides, and carbon nanotubes, has been studied as a function of nanoparticle concentration [38, 39]. Despite extensive experimental studies on the effect of nanoparticle loading on nanofluid viscosity, there is no universal equation that can predict this property with any great accuracy [40, 41]. Furthermore, almost all studies on nanofluid viscosity have demonstrated a positive correlation between viscosity and increasing nanoparticle volume fraction [42, 43]. However, this has not been observed in all nanofluids, except for those based on carbon nanotubes, which exhibit an inverse relationship between viscosity and particle loading [44]. Moreover, Nadooshan et al.’s comprehensive study of the rheological behavior of nanofluids concluded that most nanofluids exhibit Newtonian behavior at low volume fractions and non-Newtonian behavior at high nanoparticle volume fractions [45]. Additionally, an increase in volume fraction has been shown to lead to nanoparticle aggregation and consequently an increase in fluid viscosity [46, 47]. This increase in viscosity is due to the increase in the surface/volume ratio during aggregate formation [48, 49]. The effect of aggregation on the viscosity of Al2O3–water nanofluids was studied, and the results confirmed that relative viscosity increases with increasing aggregate formation. The results also showed that the nanofluid’s volume fraction does not directly affect viscosity and that an increase in particle loading leads to aggregate formation. Consequently, viscosity increases with aggregation size [50]. However, research into the effect of temperature on the viscosity of nanofluids has not resulted in a universal formula describing the viscosity behavior of these complex fluids as a function of temperature [51, 52]. This may be because other factors, such as the type of base fluid, volume fraction, and particle size, affect the viscosity [53].
Consequently, relative viscosity (𝜇rel = 𝜇nanofluid/𝜇basefluid) has been found to be more advantageous than absolute viscosity, as this makes it easier to understand the temperature dependence of viscosity [54]. Relative viscosity remained virtually stable with increasing temperature for low to moderate particle loading for almost all nanofluid types. However, at high nanoparticle concentrations, relative viscosity began to grow with temperature [55]. A few studies have shown hysteresis of nanofluid relative viscosity with temperature, where relative viscosity increases and decreases with temperature [56]. This behavior was observed in the study by Namburu et al. [57]. Other researchers have concluded that relative viscosity decreases with increasing temperature. The study by Li et al. [58] on zinc oxide nanoparticles dispersed in ethylene glycol (ZnO-EG nanofluids) demonstrates a clear correlation between nanoparticle size, volume fraction, and the resulting relative viscosity of the suspension. Most studies on the influence of nanoparticle size have shown a decrease in viscosity as the particle size increases. Viscosity of the water–graphene nanofluid increases with nanoparticle concentration and decreases with temperature. Surface tension also decreases in both cases [59, 60]. Other studies [61] have demonstrated a direct relationship between viscosity and nanoparticle size. Ahammed et al. have explored how varying volume concentration and temperature influences the viscosity and surface tension of a water–graphene nanofluid. Their results demonstrate that viscosity is more sensitive to volume concentration than to temperature, indicating its potential as an effective coolant for real-time thermal applications [62]. The novelty of our study lies in its sustainable and economical approach to producing high-quality graphene. Rather than using conventional methods that are energy-intensive and polluting, our research proposes recycling graphite from battery waste using a simple, low-cost, electrochemical exfoliation technique.
2. Experimental section
2.1. Synthesis of graphene
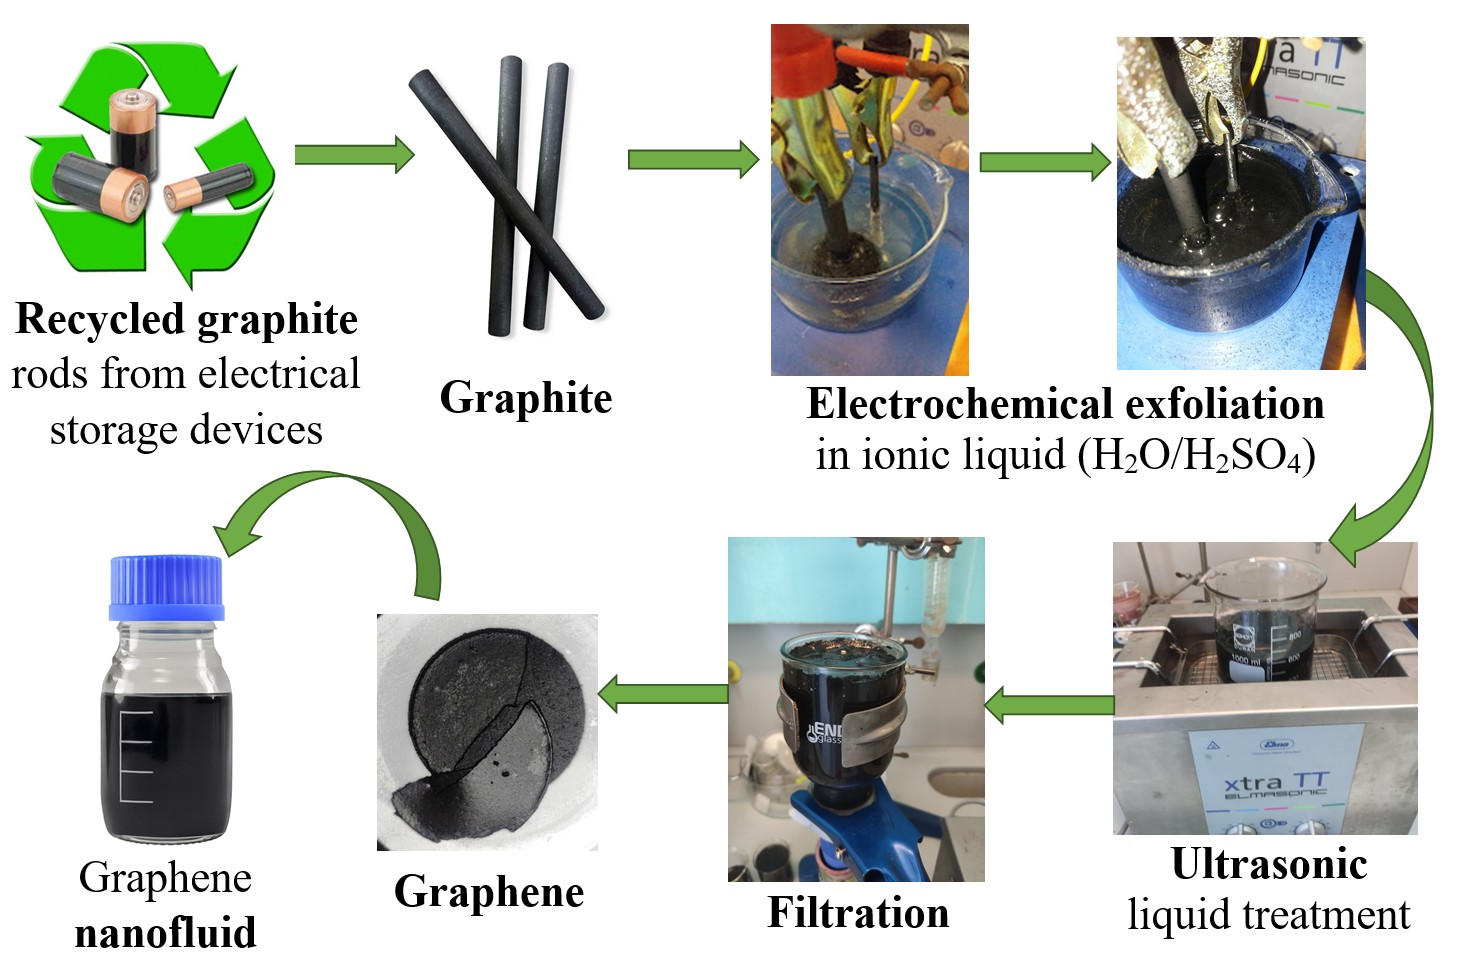
High-quality, large-area graphene sheets were produced by synthesizing graphene through electrochemical exfoliation of graphite rods from used electric batteries. These rods act as electrodes, serving as both the anode and the cathode in an aqueous solution of sulfuric acid (H2SO4). Applying a constant direct current voltage of 10 V to the electrodes initiated an electrochemical reaction that intercalated sulfate ions into the graphite layers. This intercalation process expanded the graphite structure, resulting in its exfoliation into graphene sheets. The process typically required 1.5 h to completely consume the graphite anode. The aqueous electrolyte of graphene was then subjected to centrifugation at 10 000 tr/min for 5 min and the pellet washed multiple times with distilled water to remove residual acid and impurities. A 1:10 (w/v) solid-to-liquid ratio was used during the washing steps. After undergoing a half-hour sonication process, the graphene was dried under vacuum for 24 h at 333 K [8].
2.2. Characterization of graphene
The microscopic morphology of the samples was characterized using scanning electron microscopy (SEM on a Quanta FEG 250). The materials’ structures were characterized by Fourier transform infrared spectroscopy (FT-IR on a JASCO V 770 spectra analyzer), X-ray diffraction (XRD on a D8 Advance Eco Bruker diffractometer, which operated using a copper tube at 𝜆 = 1.54 Å). Raman spectroscopy was also used (inVia from Renishaw, with monochromatic Ar+ laser radiation at a wavelength of 514.5 nm). A BET analyzer (Gemini VII 4.00) was used to determine the materials’ specific surface area, pore size, and volume. The specific surface area was determined by relating the amount of nitrogen adsorbed to the nitrogen pressure. These parameters were calculated using the Brunauer–Emmett–Teller (BET) and Barrett–Joyner–Halenda (BJH) methods.
2.3. Preparation of nanofluid
Nanofluids were prepared by dispersing the exfoliated graphene in deionized water (as the base fluid), achieving a uniform and homogeneous dispersion. The density of graphene is 2.1 g/cm3. In its natural state, graphene exists as sheets with a two-dimensional structure. It has excellent mechanical, thermal, and electrical properties. However, its dispersion is complex due to its large specific surface area. The use of high-power ultrasonic equipment enabled the dispersion of graphene. The results show the consistency and stability of the nanofluid. Five samples of graphene–deionized water were prepared with different concentrations (0.001, 0.002, 0.003, 0.004, and 0.005 g/L). All prepared samples were then subjected to ultrasonication (200 W, 20 to 40 kHz) for approximately 2 h at room temperature to ensure homogeneity and stability. To ensure the stability and reproducibility of the viscosity measurements, samples stored for extended periods were re-dispersed via ultrasonication for 30 to 60 min prior to analysis.
3. Results and discussion
Scanning electron microscopy (SEM) is an excellent technique for studying the micro- and/or nanostructure, topography, and distribution of different phases in samples. Figure 1 shows images of graphene at different magnifications: 200, 12 000 and 24 000×.
SEM of graphene [10] (© 2022 IOP Publishing. Reproduced with permission. All rights reserved).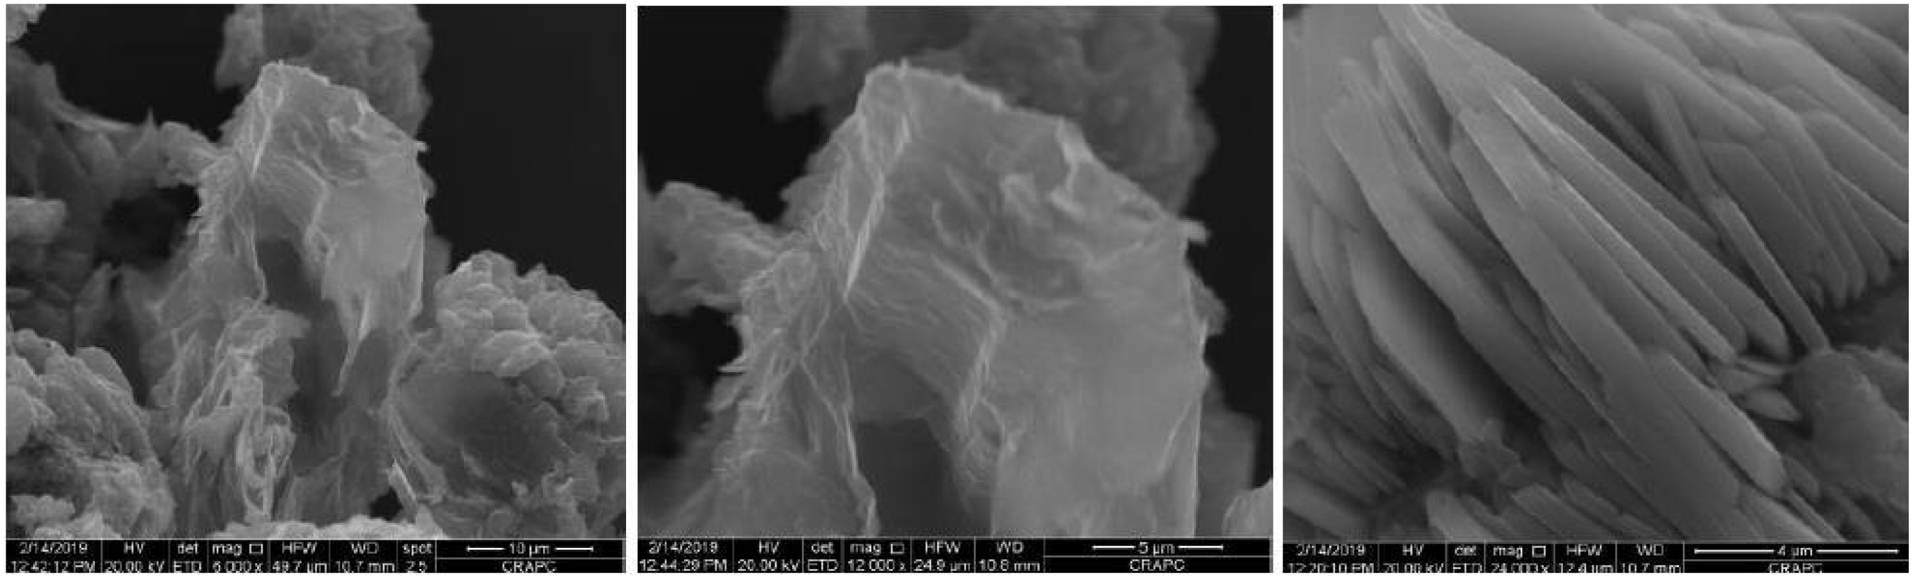
The SEM images in Figure 1 confirm the exfoliation of the graphite into multi-layered graphene sheets, which are entangled due to their overlap. They also show a smooth structure for the synthesized graphene.
The FTIR spectrum of graphene (Figure 2) shows a broad band centered around 3500–2800 cm−1, which is characteristic of O–H stretching vibrations. This indicates the presence of adsorbed water molecules and hydroxyl groups [62]. The band at 1559 cm−1 is assigned to the stretching and bending modes of water molecules. The peak at 1624 cm−1 corresponds to the aromatic C=C sp2 stretching vibration. The band at 1014 cm−1 corresponds to the C–O of the alkyl groups.
FT-IR of graphene.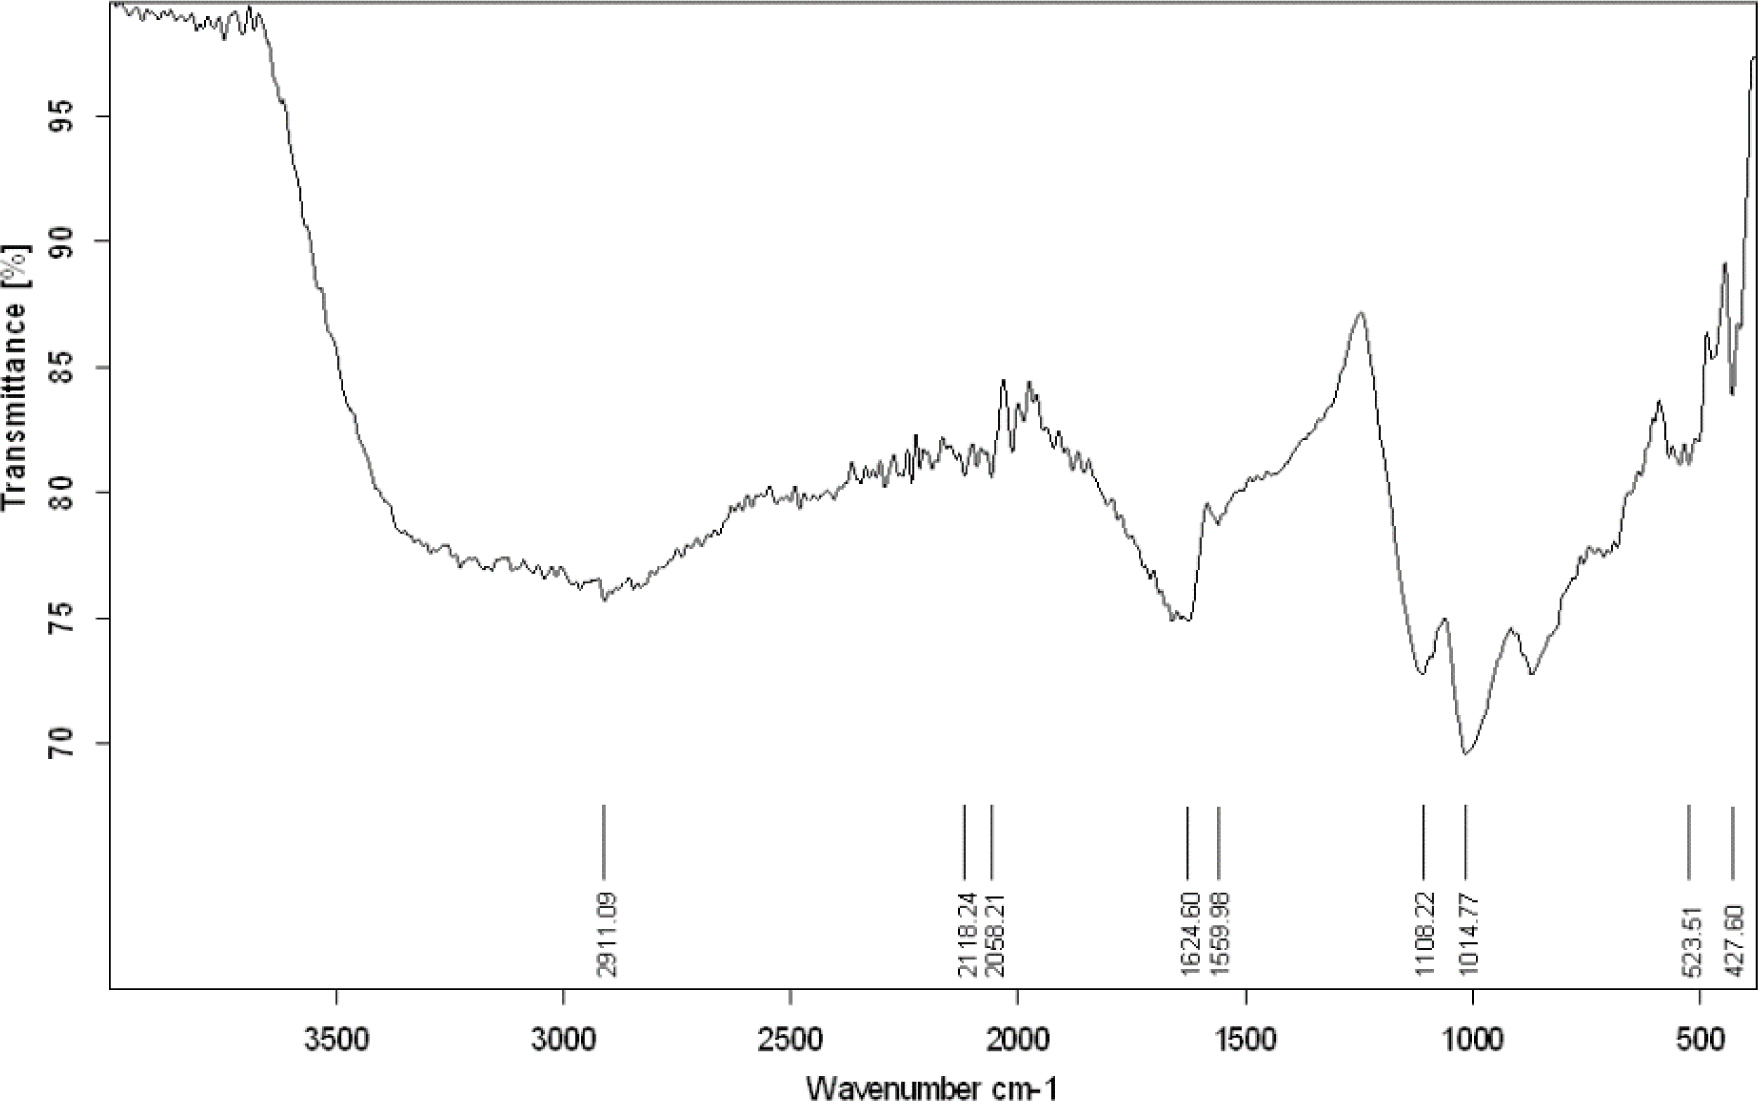
X-ray diffraction (XRD) is the gold standard for characterizing crystalline materials. The XRD patterns of graphite and synthesized graphene are shown in Figure 3.
The XRD of (a) graphite and (b) graphene (reproduced with permission from [8]).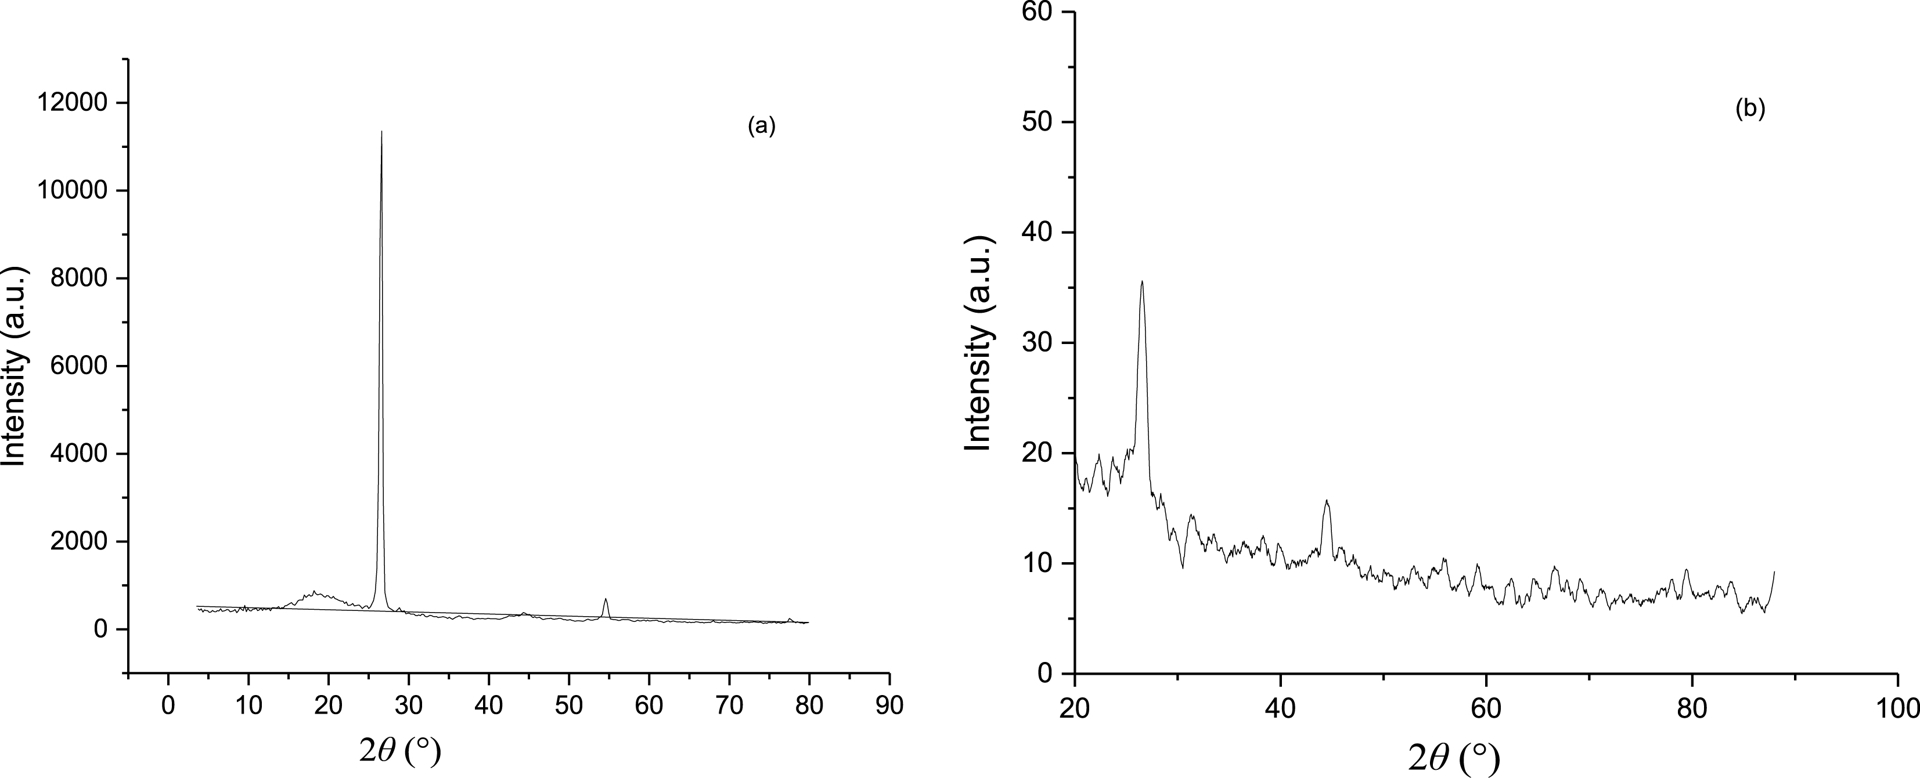
Analysis by XRD enables the determination of crystal lattice parameters, including interplanar spacing. The XRD pattern provides crucial information on the degree of exfoliation, the number of layers, and the extent of structural order or disorder in graphite-derived carbon materials. The most striking feature of the graphite XRD pattern (Figure 3a) is the sharp, intense peak at approximately 2𝜃 = 26.5°. The (002) interlayer spacing of graphite is usually around 0.335 nm. The sharpness of this peak indicates a high degree of crystallinity and long-range order in the stacked layers. Following electrochemical exfoliation to produce graphene, the XRD pattern exhibits a sharp peak at 2𝜃 = 23°, which corresponds to the (002) interlayer spacing of the graphene sheets. An additional peak at 2𝜃 = 44.9° is attributed to the (100) planes [63]. The decreased intensity of all diffraction peaks indicates a decrease in the crystallinity of graphite after exfoliation. The increased interlayer distance (d) in the synthesized graphene indicates the intercalation of oxygen-containing functional groups between the layers, confirming the successful formation of graphene [64]. These results demonstrate the structural rearrangements from graphite to graphene.
Raman spectroscopy is a powerful, non-destructive technique used to analyze the molecular composition and structural properties of materials. It is widely used to characterize sp2 and sp3 hybridized carbon atoms. The Raman spectra of graphene typically exhibit three distinctive peaks known as the D, G, and 2D bands. The G band arises from the in-plane vibration of sp2 hybridized carbon atoms in the graphitic lattice and is sensitive to strain and defects. The D band is associated with structural defects and disorder in the sp2 carbon network. The intensity ratio of the D and G bands is often used as a quantitative measure of disorder, providing insight into the quality of graphene. Figure 4 shows the Raman spectrum of graphite, with the characteristic D and G bands appearing at 1349 cm−1 and 1573 cm−1, respectively. Additionally, a 2D band is observed at 2663 cm−1, arising from a double resonance process involving two phonons [65, 66].
Raman spectrum of graphite (reproduced from [67] under license CC BY-NC-SA 4.0).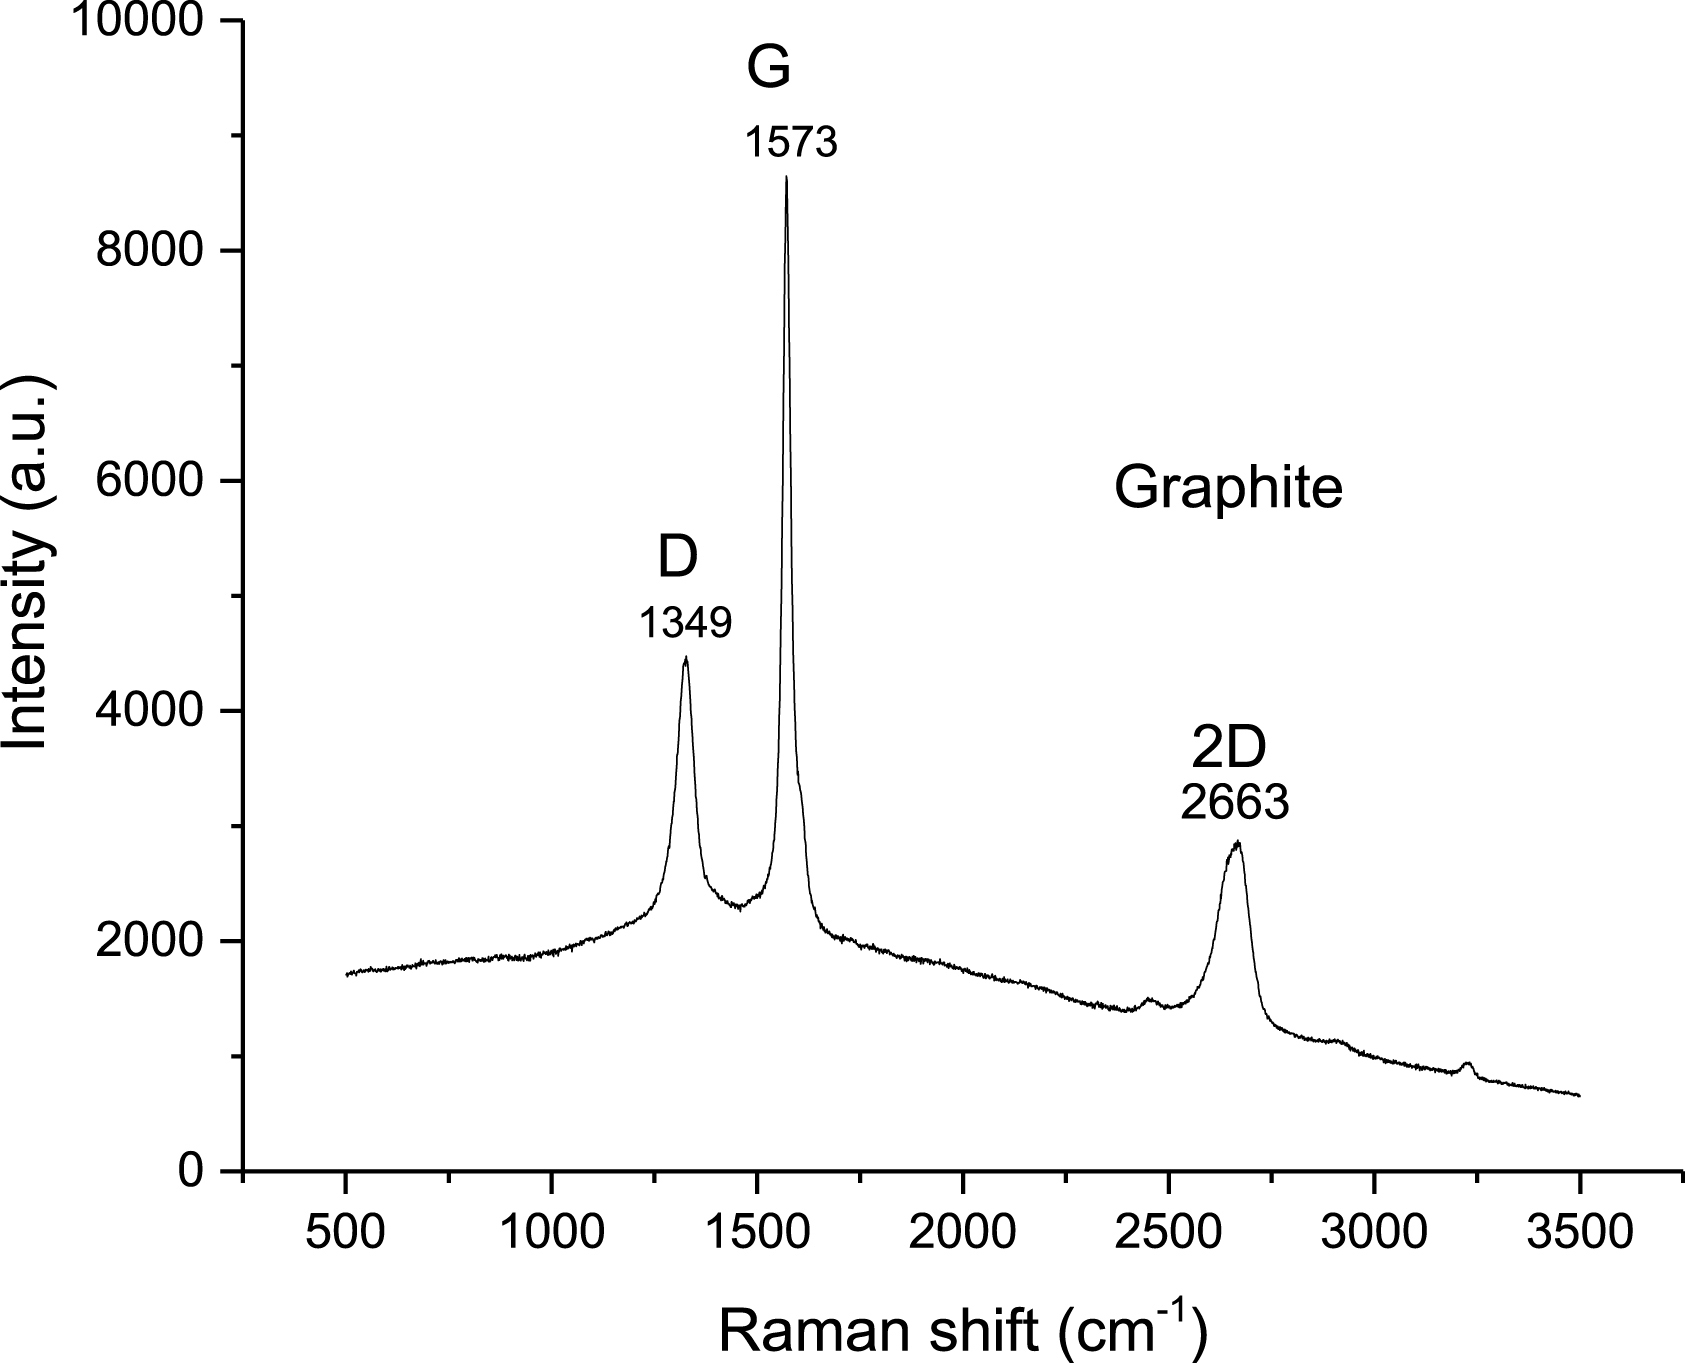
Figure 5 shows the Raman spectrum of graphene, which exhibits four prominent peaks in the 1300–3300 cm−1 region at 1328 and 1574 cm−1. The peak at 1328 cm−1 is attributed to the D band, the one centered at 1574 cm−1 to the G band.
Raman spectrum of graphene (reproduced from [67] under license CC BY-NC-SA 4.0).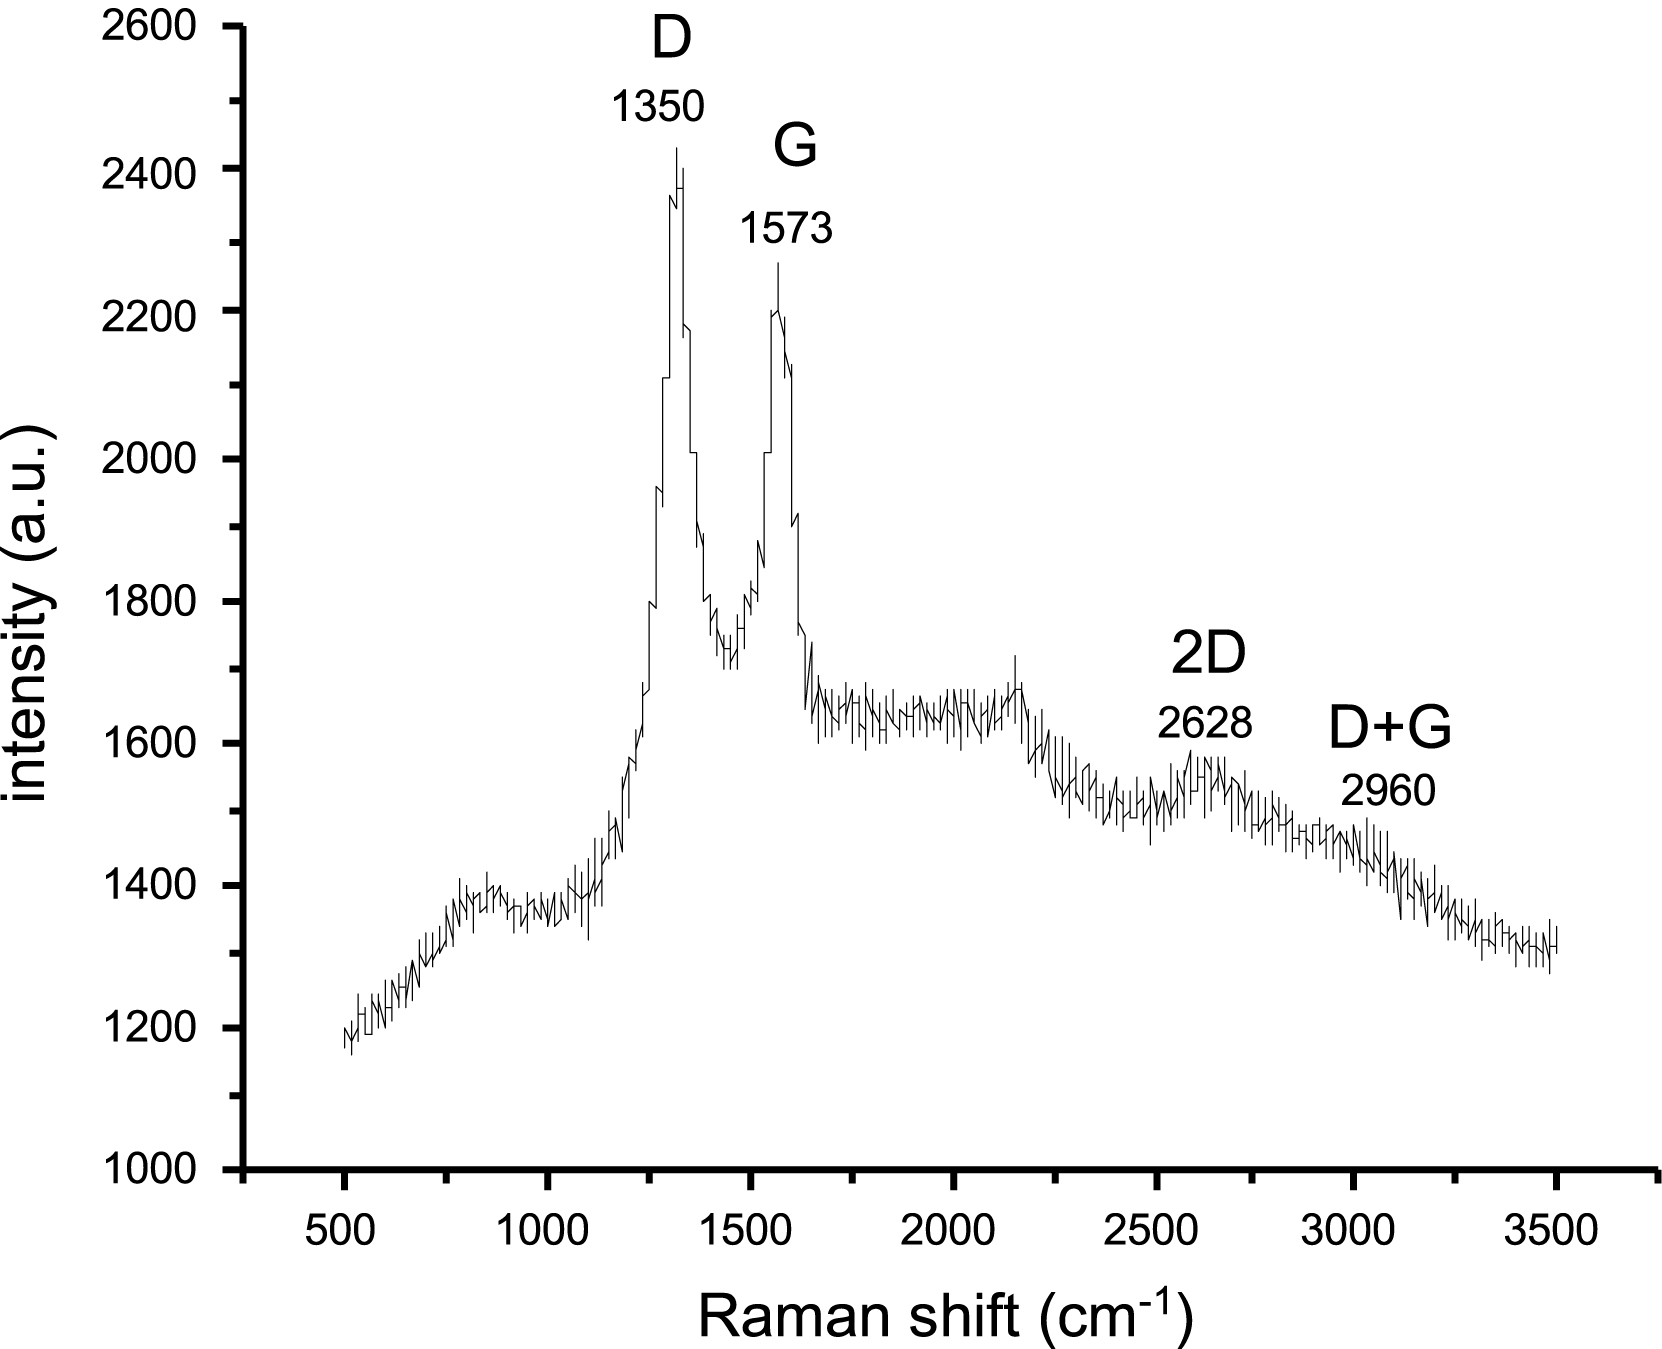
The ID/IG intensity ratio of the D and G bands is a quantitative measure of defect density in the graphene lattice. An increase in disorder within the graphene structure leads to a corresponding increase in the ID/IG ratio due to increased elastic scattering from defects. However, in highly amorphous carbon materials, the ID/IG ratio tends to decrease. The tabulated data below (Table 1) summarize the Raman analysis results for graphite and graphene.
Raman analysis values of different materials
| Sample | D | D | G | G | ID/IG |
|---|---|---|---|---|---|
| Position (cm−1) | Intensity (a.u.) | Position (cm−1) | Intensity (a.u.) | ||
| Graphite | 1328 | 4411 | 1573 | 8565 | 0.52 |
| Graphene | 1322 | 2427 | 1573 | 2260 | 1.07 |
The ID/IG ratio was found to be 0.52 for graphite and 1.07 for graphene. This increase suggests a reduction in sp2 domain size and the incorporation of oxygen-containing functional groups during exfoliation, resulting in greater disorder at carbon edges due to extensive oxidation [44]. To quantify the specific surface area of graphene, nitrogen (N2) adsorption–desorption isotherms were measured and are shown in Figure 6.
Nitrogen adsorption–desorption isotherm of graphene.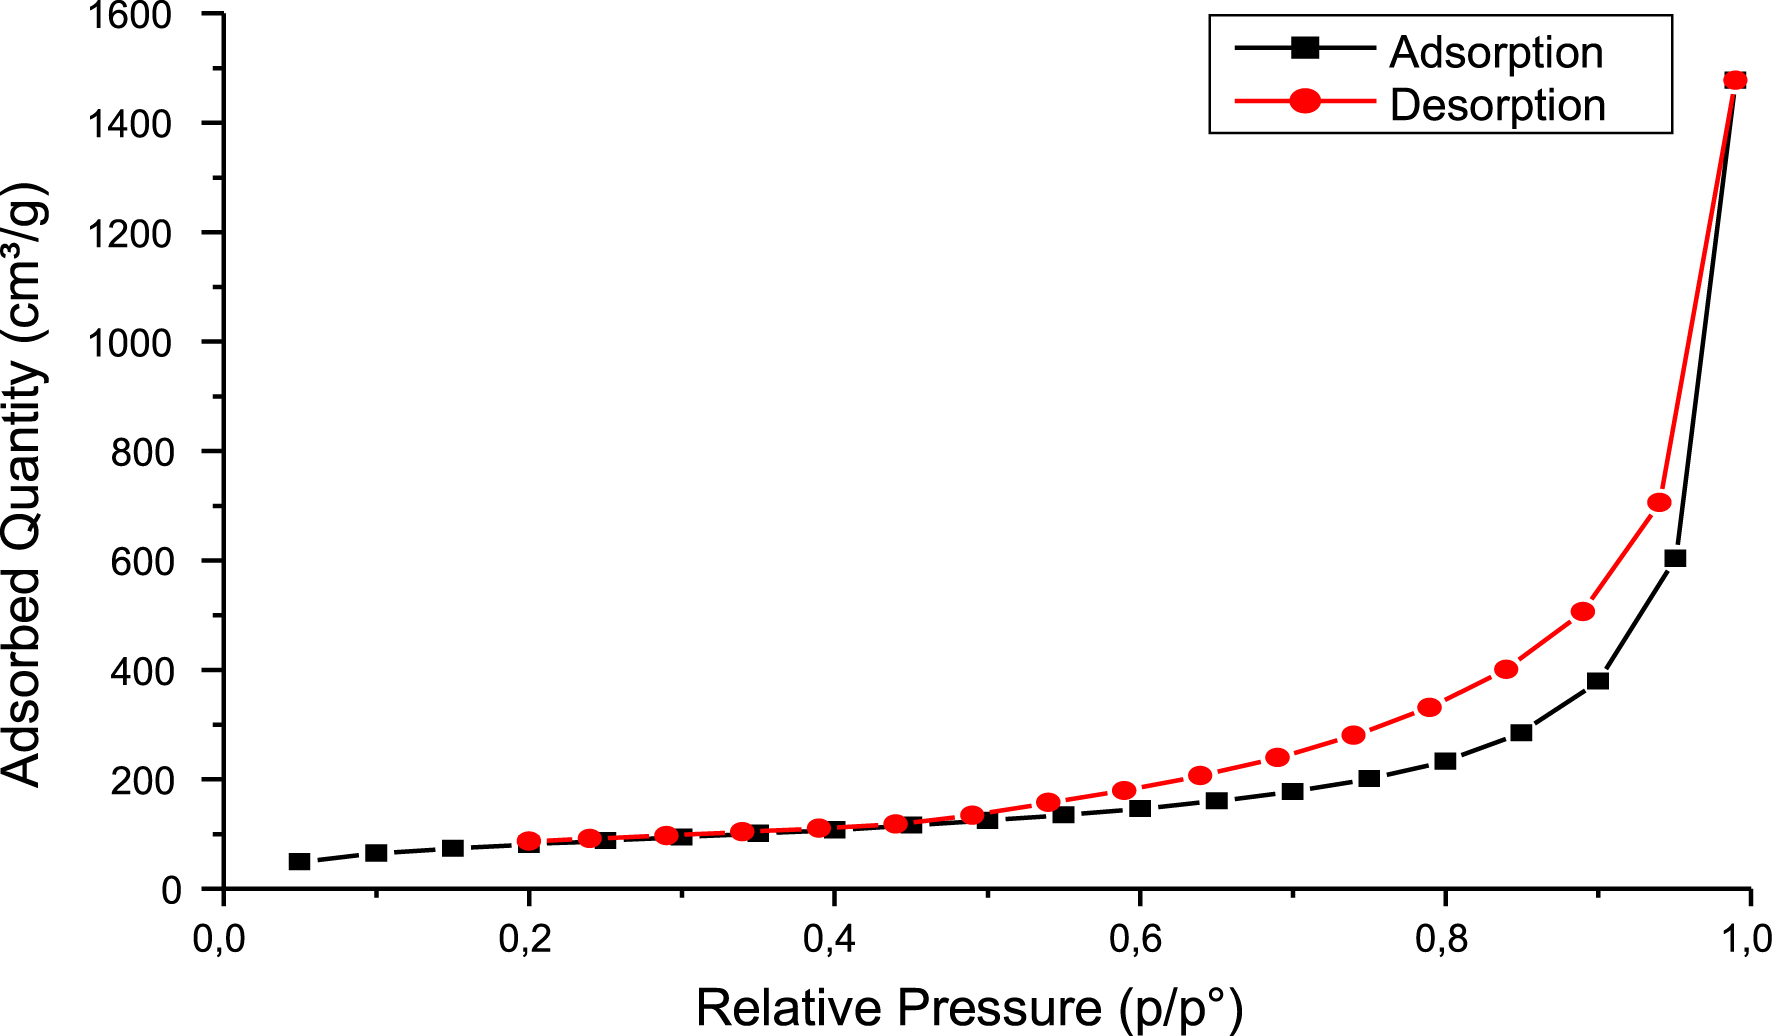
According to the IUPAC classification, the isotherm of graphene is classified as type IV, indicating capillary condensation within the mesopores. The increase in adsorbed volume within the relative pressure range of 0.7–1.0 is attributed to capillary condensation, which is accompanied by a hysteresis loop. The specific surface area, pore volume, and pore size distribution were determined using the BET and BJH methods and are summarized in Table 2.
BET and BJH analysis results
| Sample | SBET (m2/g) | SLangmuir (m2/g) | SBJH (m/g) | VP (cm3/g) | DP (Å) |
|---|---|---|---|---|---|
| Graphene | 300.312 | 771.768 | 354.89 | 0.588 | 65.05 |
VP: Pore volume (cm3/g); DP: Pore diameter (Å).
The specific surface area of graphene usually ranges from 200 to 2500 m2/g, depending on the preparation method and the extent of exfoliation. Our graphene sample exhibited an SBET of 300.3126 m2/g, which is attributed to the presence of larger, stacked graphene sheets. The higher Langmuir surface area of 771.768 m2/g highlights the sensitivity of the method to smaller surfaces. Using the BJH method, we determined a surface area of 354.89 m2/g, which suggests that there is significant stacking of graphene sheets. The BJH method is particularly sensitive to larger pores. The pore volume (VP) was found to be 0.588 cm3/g, which also indicates substantial stacking of graphene layers.
4. Viscosity measurements
Viscosity was measured using a Cannon–Fenske capillary viscometer. The viscosity of the graphene-based nanofluids was determined at the lowest concentrations. A thermostatic bath was used to control the ambient temperature. The viscosity of all nanofluids was measured at temperatures of 25, 35, 45, 55, and 65 °C.
The experimental flow time was converted into kinematic viscosity (𝜈) using the viscometer constant (C), according to the following equation:
| \begin {equation*} {\nu } = C\times t_{\mathrm {f}} \end {equation*} |
The results of the viscosity measurements are shown in Figure 7.
Viscosity measurements of graphene samples.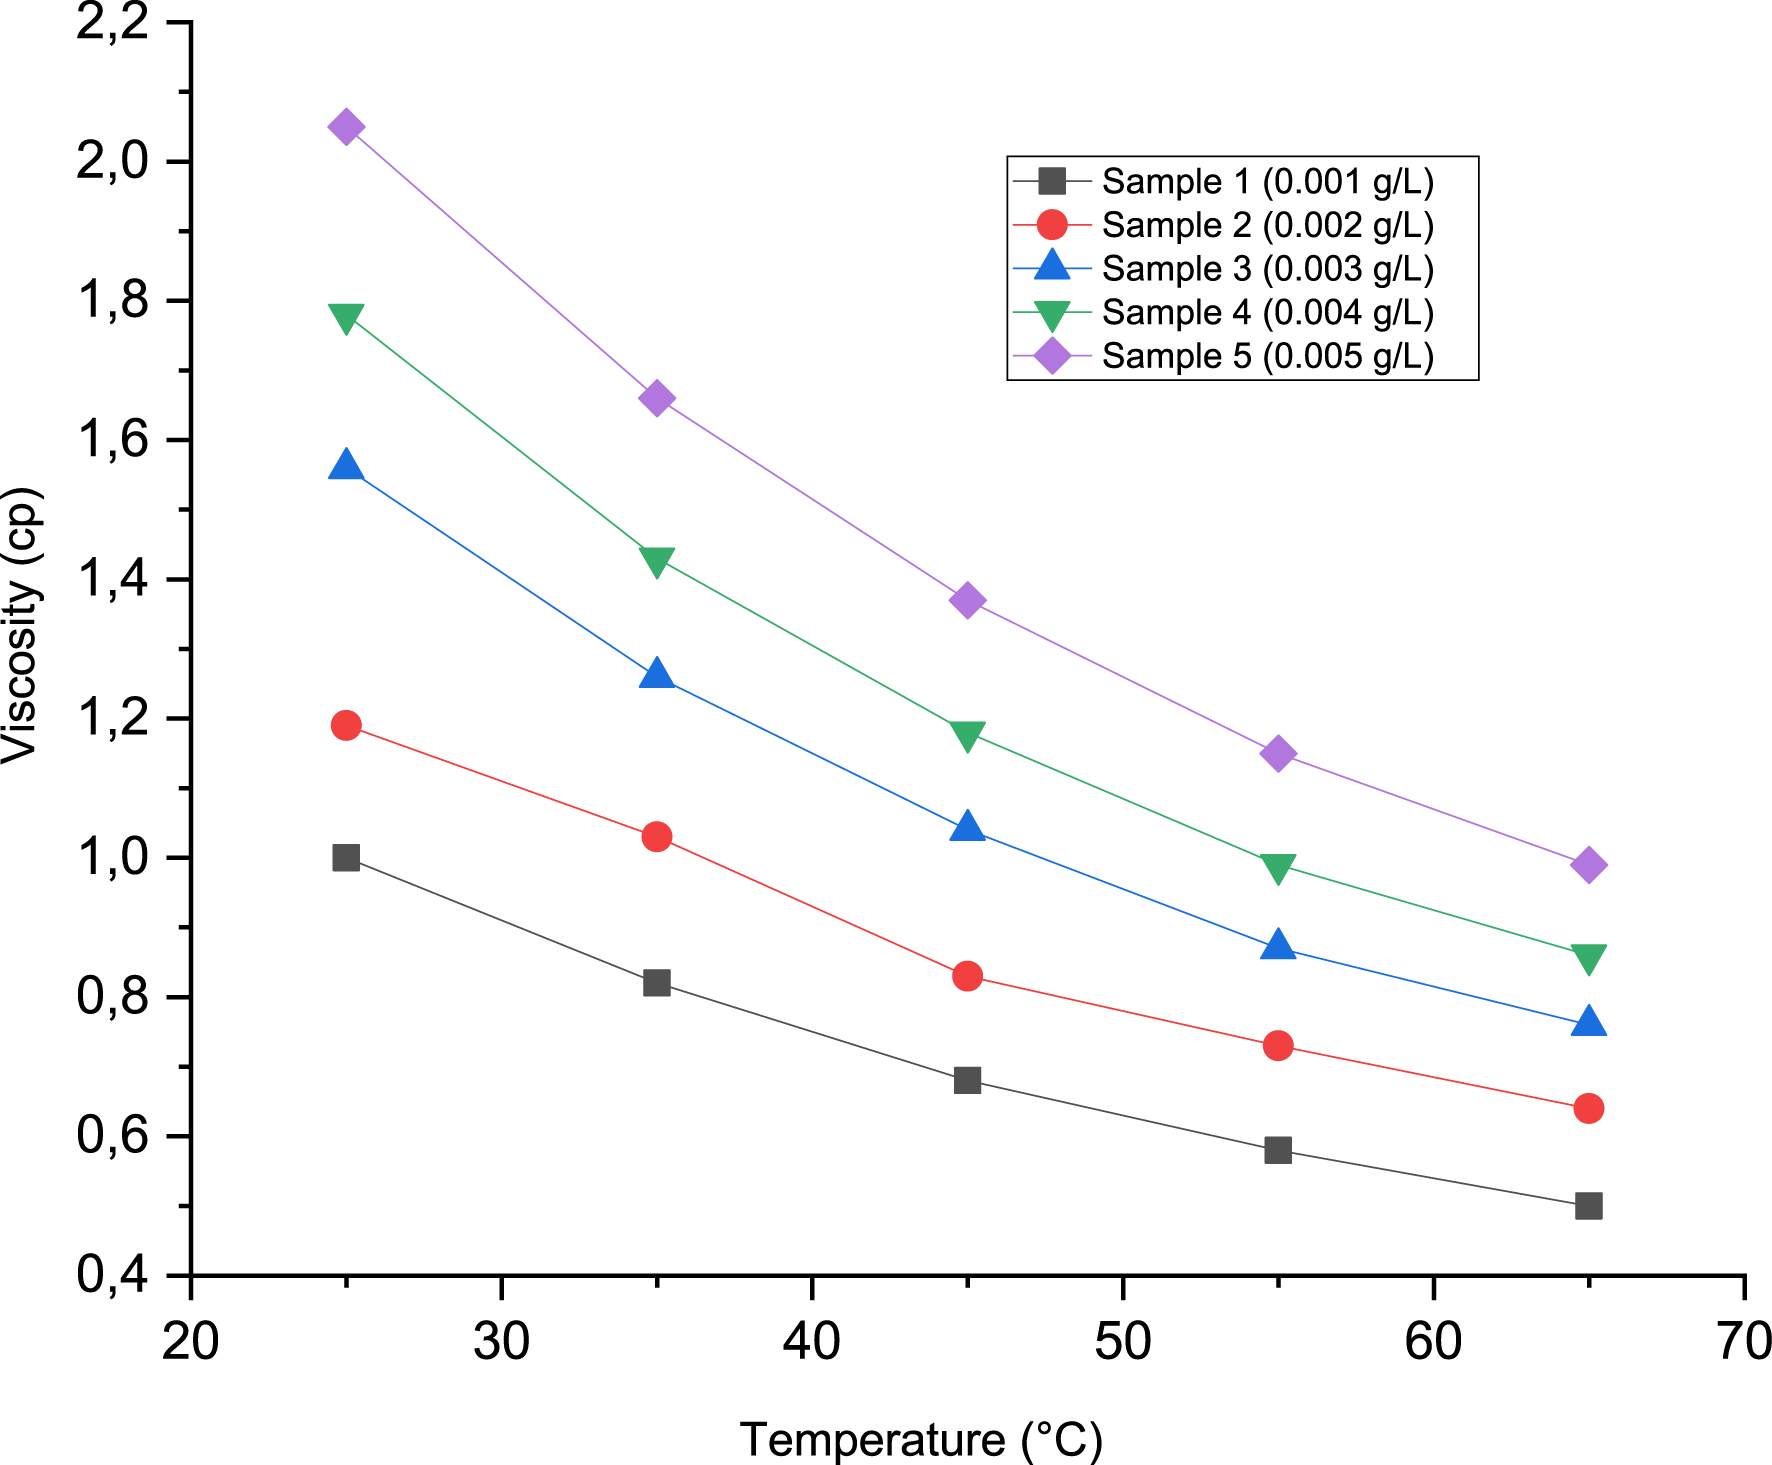
Figure 7 shows how the viscosity of five graphene-based nanofluids changes with temperature at different concentrations. The measurements were carried out at five specific temperatures: 25, 35, 45, 55, and 65 °C. As expected, viscosity decreases with increasing temperature. Conversely, viscosity increases with the concentration of graphene nanoparticles. Increasing temperature promotes the thermal agitation of molecules, thereby increasing their kinetic energy. This weakens the intermolecular attractive forces, thereby reducing the fluid’s internal resistance to flow.
A comparative summary of the results obtained for graphene-based nanofluids is provided in Table 3.
Comparative synthesis of results for graphene-based nanofluids: Impact of concentration and temperature
| Concentration range | Temperature range (K) | Key results/remarks | Reference |
|---|---|---|---|
| 0.03 wt% | 298–348 | Viscosity lower than that of the base fluid and decreases from 217.4 to 40.6 cP as the temperature increases from 298 to 348 K. | [68] |
| 0.5–1 wt% | 278–298 | 𝜇nanofluid decreased with rising temperature but increased with the mass fraction of graphene nanoparticles. 𝜇rel ranged from 1.24 to 2.35. | [69] |
| 0.025–0.1 wt% | 293–333 | 𝜇 decreases 4–44% with rising T and increases with the concentration of graphene nanoparticles. 𝜇rel increases with rising T. | [70] |
| 0.025–0.1 wt% | 293–333 | Viscosity decreases for higher temperatures and increases for higher concentrations of graphene nanoparticles (+44% compared to the viscosity of the base fluid for 0.1 wt% graphene nanoparticles). | [71] |
| 0.05–0.1 wt% | 293–333 | Viscosity increases with concentration and decreases with temperature. | [72] |
| 0.001–0.005 g/L | 298–333 | A decrease in viscosity was observed with increasing temperature. Conversely, viscosity increased with the graphene nanoparticle concentration. | This work |
This table shows that the viscosity behavior of graphene-based nanofluids can be predicted and is governed by well-established physical laws, even when different base fluids and concentrations are used. Our results are in perfect agreement with those in the scientific literature, which lends credibility and importance to our contribution to the field.
5. Conclusion
We present a method of synthesizing graphene through the electrochemical exfoliation of graphite derived from recycled batteries. Sulfuric acid and water were used as electrolytes to enhance exfoliation. Graphene was then dispersed into individual sheets of graphene using ultrasonic treatment in distilled water. The synthesized graphene was characterized using various techniques, confirming the successful production of high-quality graphene. This study focused on measuring the viscosity and conducting a behavioral analysis of graphene-based nanofluids. The viscosity of the nanofluids was measured at different volume fractions ranging from 0.001 to 0.005. All viscosity measurements were performed using a capillary viscometer at temperatures ranging from 25 to 65 °C. The studied nanofluids exhibited an increase in viscosity with nanoparticle loading and a decrease with temperature.
Declaration of interests
The authors do not work for, advise, own shares in, or receive funds from any organization that could benefit from this article, and have declared no affiliation other than their research organizations.