





 CC-BY 4.0
1. Introduction
The dye industry is one of the activities that produces the most toxic industrial waste and represents a great risk to human health and environment. Globally, dye production is estimated at around 700 000 tons per year [1, 2, 3], about 70% of which are azo dyes, widely used in textile, paper, pharmaceutical, food, cosmetics, and leather industries [4]. Some studies have established a link between tartrazine (TRZ) and sensitivity to food dyes, and recent research suggests a possible link between ingestion of TRZ and the worsening of behavioral disorders, especially in children, including symptoms such as hyperactivity and irritability. In addition, TRZ can induce oxidative stress and contribute to cellular damage, where it presents a potential role in carcinogenesis [5]. The release of azo dyes into aquatic systems is a major environmental concern due to their persistent nature and toxicity [6, 7]. Their complex molecular structure renders them stable and largely non-biodegradable [8, 9].
In recent years, significant progress has been achieved in developing various treatment methods for the removal of azo dyes from industrial wastewater. Physical methods such as adsorption [10, 11, 12], membrane filtration [13], forward osmosis [14], coagulation–flocculation [15, 16] are considered simple and efficient for dye removal. However, they do not achieve complete degradation of the contaminants. Biological methods using microorganisms [17, 18] or enzymes [19] mainly lead to decolorization rather than complete degradation of azo dyes, resulting in the formation of aromatic amines, which are often toxic and resistant to further biodegradation. Chemical methods such as advanced oxidation processes, including Fenton processes [20, 21], ozonation [22], electrochemical processes [23, 24], photocatalysis [25, 26] have been widely studied for the degradation of azo dyes and have shown the greatest potential to achieve complete mineralization. The efficiency of photocatalytic processes for decolorization and mineralization of azo dyes is strongly influenced by multiple parameters. Factors such as initial pollutant concentration, catalyst dosage, pH of reaction medium, and intensity of UV–Vis irradiation may exert both individual and interactive effects on the degradation kinetics. However, optimizing this process by varying only one factor at a time (OFAT) is not only inefficient and resource-consuming, but also unable to reveal the interaction among parameters, which may lead to overlooking the truly optimal operating conditions. To overcome this limitation, the design of experiments (DOE) approach provides a rigorous and systematic statistical framework. It enables the simultaneous evaluation of the effects of several critical factors and their interactions on the degradation efficiency while minimizing the number of experiments required. This method is therefore essential for accurately modeling the photocatalysis.
2. Results and discussion
The objective of this work is to use an experimental design to optimize the operating conditions for the heterogenous photocatalysis of the azo food dye tartrazine. A Box–Behnken design was employed to evaluate the impact and interactions of the main factors (TiO2 mass, initial TRZ concentration, and pH) on the degradation efficiency response (%). The analysis of the results provides a basis to develop a predictive model and the determination of the optimal conditions to maximize the degradation efficiency.
Tartrazine (E102) or 4,5-dihydro-5-oxo-1-(4-sulfophenyl)-4-[(4-sulfophenyl)azo]-1H-pyrazole-3-carboxylic acid, trisodium salt is a water-soluble mono-azo yellow dye that undergoes tautomerism between its enolic (hydroxy) and keto (oxo) forms (Figure 1) [27, 28].
Chemical structure of tartrazine in its two tautomeric forms, (1) enolic and (2) keto.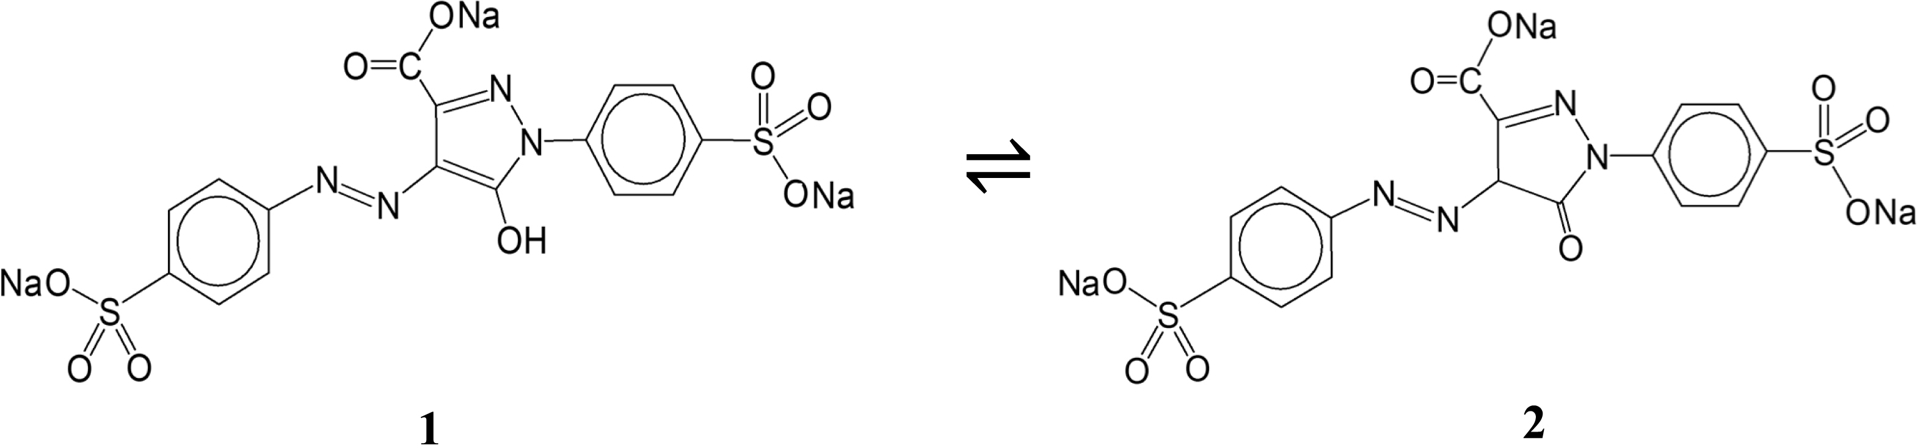
2.1. Photocatalysis
Photocatalytic degradation experiments were carried out in a reactor (see Figure S1). For each trial, a TRZ solution was prepared with varying concentrations by adding a mass m of TiO2 at different pH levels. The practical removal photodegradation yield (Y %) of the dye was calculated according to Equation (1):
| \begin {equation}\label {eq1} Y(\%) = \dfrac {C_{0}-C_{t}}{C_{0}} \times 100, \end {equation} | (1) |
The factors studied, the low (−1), central (0), and high (+1) levels of each factor are presented in Table 1. The response variable considered in the optimization process was the practical removal–degradation yield, determined for each run after photocatalysis testing. The combinations of experimental conditions for each run were generated using the Minitab program, and statistical analysis was performed to evaluate the effects and interactions of the parameters studied.
Parameters and levels of controlled factors for photocatalysis optimization
| Factors | Low (−1) | Central (0) | High (+1) |
|---|---|---|---|
| X1: initial concentration of TRZ (mg/L) | 5 | 15 | 25 |
| X2: mass of TiO2 (mg) | 10 | 30 | 50 |
| X3: pH | 5 | 7 | 9 |
The experimental design was developed according to a Box–Behnken Design (BBD) with three factors–three levels (Table 2) and three repetitions at the central points, resulting in fifteen experimental runs. The experimental conditions were optimized by the design of the response surface method (RSM). Initial dye concentration (X1), photocatalyst mass (X2), and pH of the solution (X3) were examined as key factors affecting TRZ removal efficiency (Y ). The quadratic response model, which represents all linear terms, square terms, and interaction elements, can be presented as follows (Equation (2)):
| \begin {equation}\label {eq2} Y = \beta _{0} + \sum \beta _{i}X_{i} + \sum \beta _{ii}{X}_{i}^{2} + \sum \sum \beta _{ij}X_{i}X_{j}, \end {equation} | (2) |
Box–Behnken design matrix with TRZ removal yield Y
| Coded variables | Uncoded variables | Response | ||||||
|---|---|---|---|---|---|---|---|---|
| Assay | X1 | X2 | X3 | [TRZ] (mg/L) | mTiO 2 (mg) | pH | Observed (Y %) | Predicted (Y′%) |
| 1 | −1 | −1 | 0 | 5 | 10 | 7 | 53.5 | 53.7 |
| 2 | +1 | −1 | 0 | 25 | 10 | 7 | 18.0 | 19.4 |
| 3 | −1 | +1 | 0 | 5 | 50 | 7 | 87.3 | 85.9 |
| 4 | +1 | +1 | 0 | 25 | 50 | 7 | 45.1 | 45.0 |
| 5 | −1 | 0 | −1 | 5 | 30 | 5 | 83.0 | 80.3 |
| 6 | +1 | 0 | −1 | 25 | 30 | 5 | 36.9 | 33.9 |
| 7 | −1 | 0 | +1 | 5 | 30 | 9 | 59.1 | 62.1 |
| 8 | +1 | 0 | +1 | 25 | 30 | 9 | 31.7 | 33.3 |
| 9 | 0 | −1 | −1 | 15 | 10 | 5 | 25.8 | 27.3 |
| 10 | 0 | +1 | −1 | 15 | 50 | 5 | 55.2 | 58.3 |
| 11 | 0 | −1 | +1 | 15 | 10 | 9 | 23.1 | 20.0 |
| 12 | 0 | +1 | +1 | 15 | 50 | 9 | 48.2 | 46.7 |
| 13 | 0 | 0 | 0 | 15 | 30 | 7 | 57.0 | 55.0 |
| 14 | 0 | 0 | 0 | 15 | 30 | 7 | 55.9 | 55.0 |
| 15 | 0 | 0 | 0 | 15 | 30 | 7 | 52.2 | 55.0 |
Experimental values were obtained from the mean of repeated measurements (n = 3). Predicted values were derived from the fitted model (see ANOVA section for details).
Unlike a conventional OFAT strategy, the experimental design and the operating protocol in this work are intrinsically linked. Each trial corresponds to a specific point in the BBD matrix.
2.2. Structural characterization of the TiO2 catalyst and tartrazine
The X-ray diffraction pattern of the commercial TiO2 catalyst is represented in Figure S2 (SI). The dominant diffraction peaks observed at 2𝜃 values of approximately 25.52°, 37.96°, 48.23°, 54.04°, 55.27°, and 62.86° correspond to the (101), (004), (200), (105), (211), and (204) crystal planes of the anatase phase respectively. They match the theoretical pattern for the anatase phase of TiO2 from Crystallography Open Database (COD, ID 1526931). A weak peak at 27.64° with an intensity of 4.06% can be attributed to the rutile (110) plane (COD ID 1534781), indicating the presence of a trace amount of rutile. The significant density of surface hydroxyl groups is critical to the material’s photocatalytic activity, providing active sites for the generation of radical species responsible for the degradation of organic dyes. The Fourier-transform infrared spectroscopy (FTIR) spectrum of the commercial TiO2 catalyst (Figure S3 in SI) identifies key surface functional groups, such as hydroxyl groups and Ti–OH bonds.
The molecular structure of TRZ was verified using FTIR spectroscopy (Figure S4 in SI), and the calibration curves of TRZ were established at three different pH values (5, 7, and 9) using UV–Vis spectrophotometry. A linear relationship between absorbance and concentration was observed at all pH values, confirming the validity of the Beer–Lambert law, as shown in Figure 2a. Standard solutions with known concentrations were prepared, and their absorbance was measured at the dye’s maximum absorption wavelength (426 nm), which was confirmed by preliminary UV–Vis spectra presented in Figure 2b.
Calibration curves of TRZ (a) UV–Vis absorption spectra of TRZ, (b) at different pH values.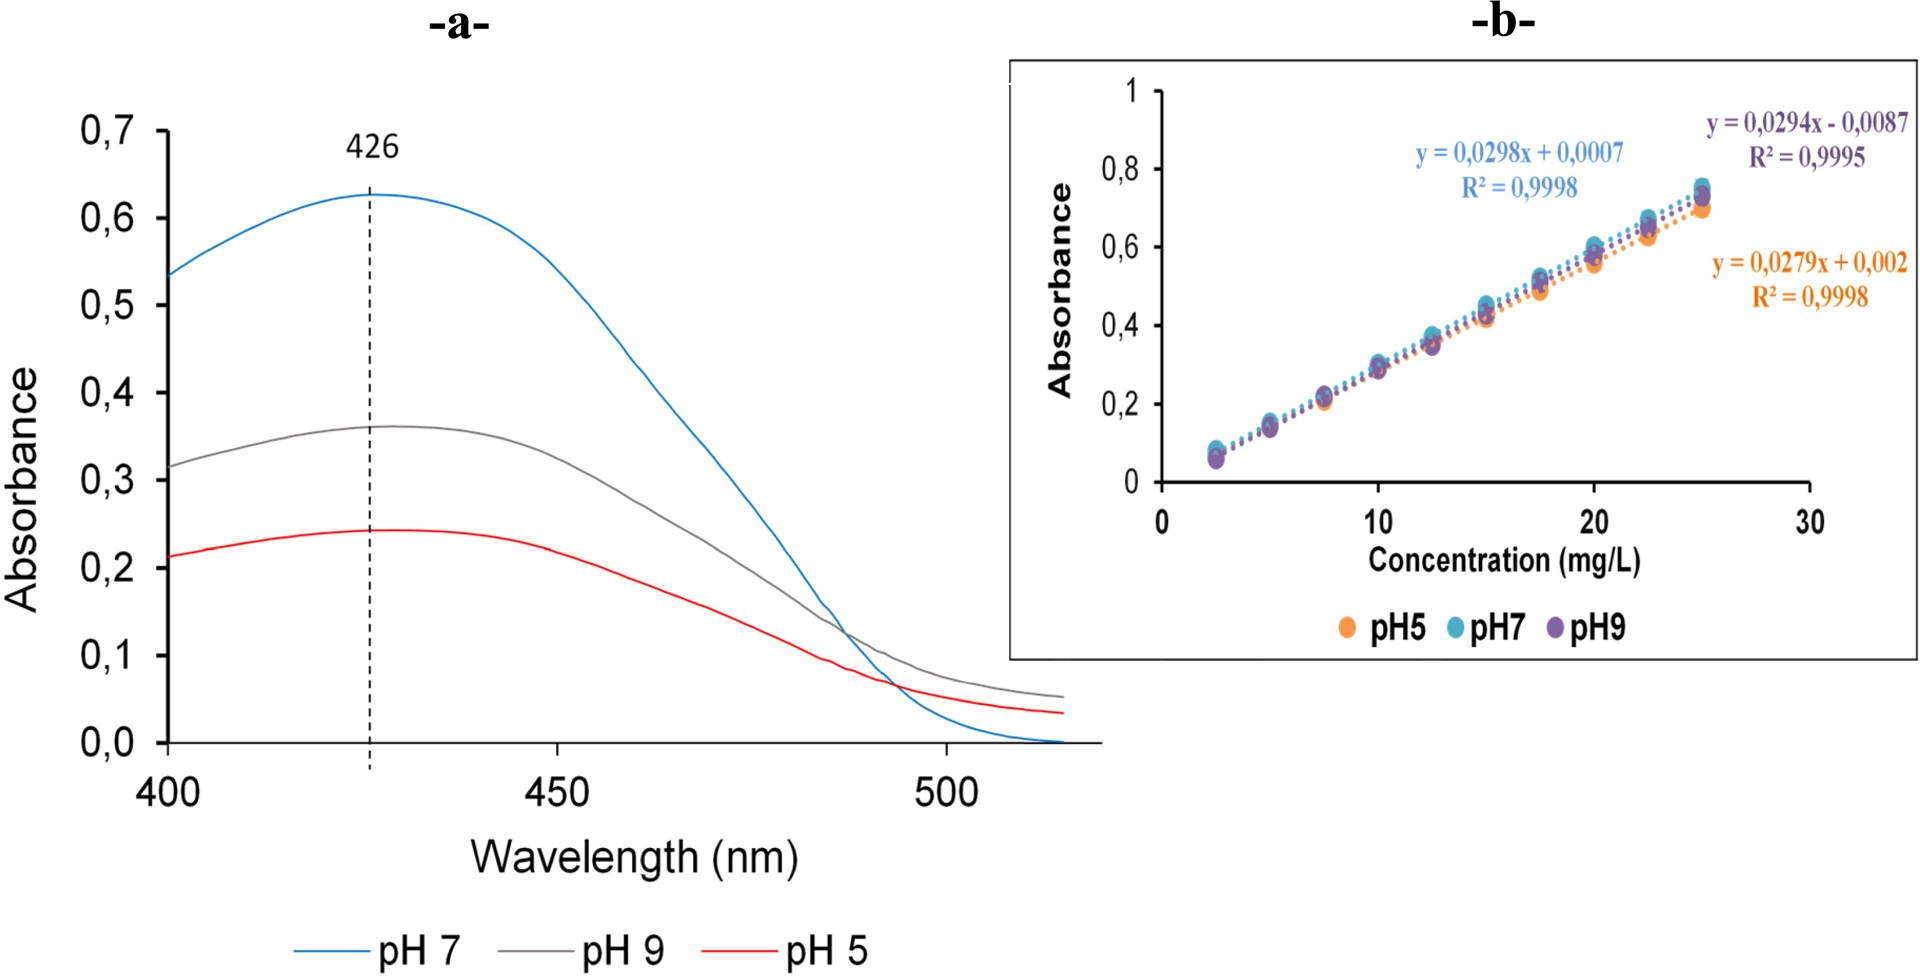
2.3. Model fitting and statistical analysis
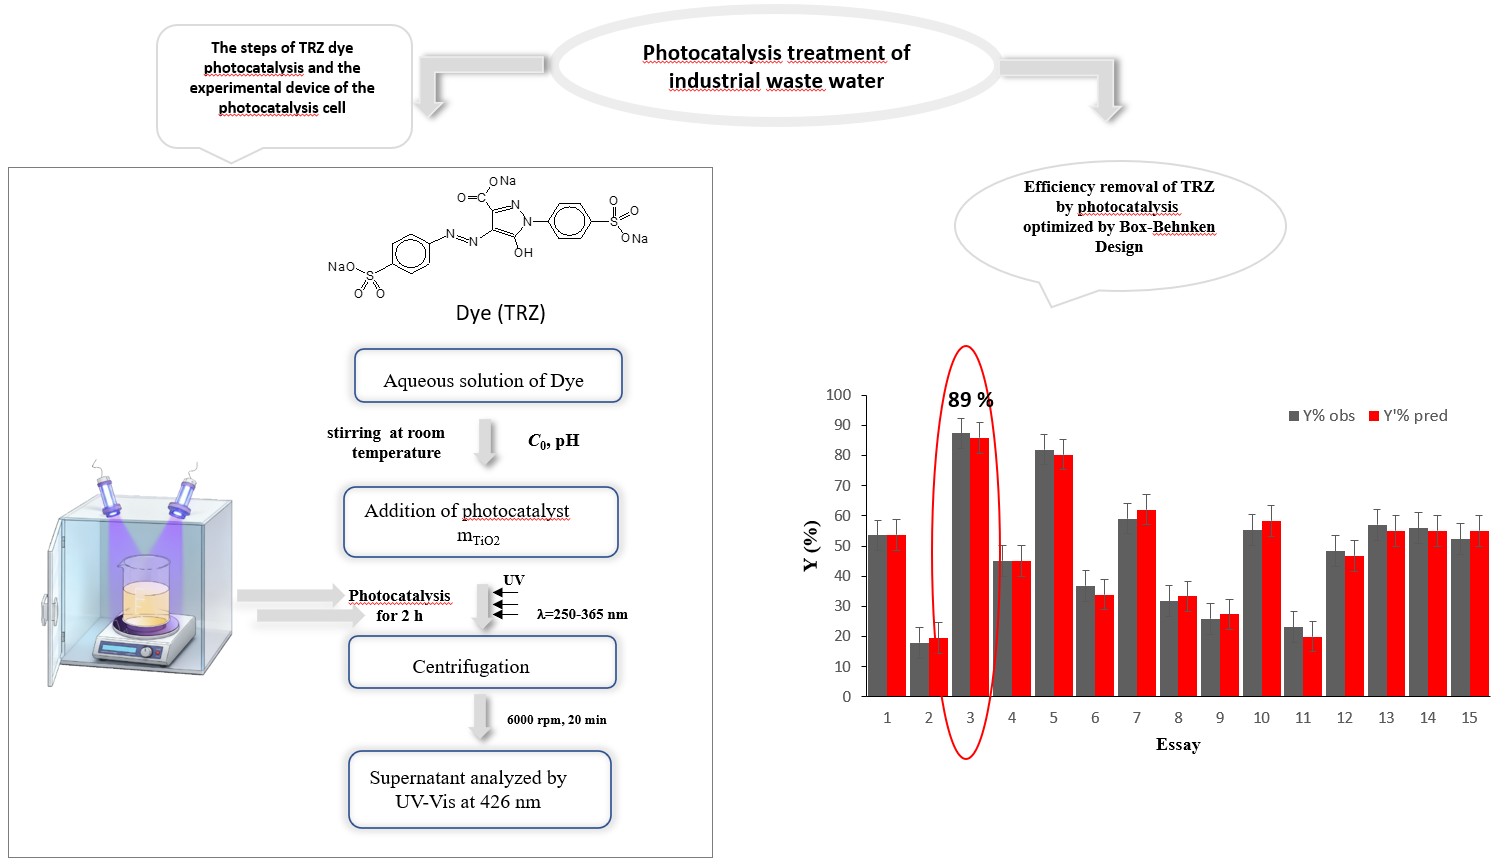
Results for the efficiency of TRZ photodegradation are presented in Figure 3. The best yields are obtained for Assay 3 with 87.3% and 85.9% for the experimental and predicted values, respectively.
The observed and predicted amounts of TRZ removal by photocatalysis.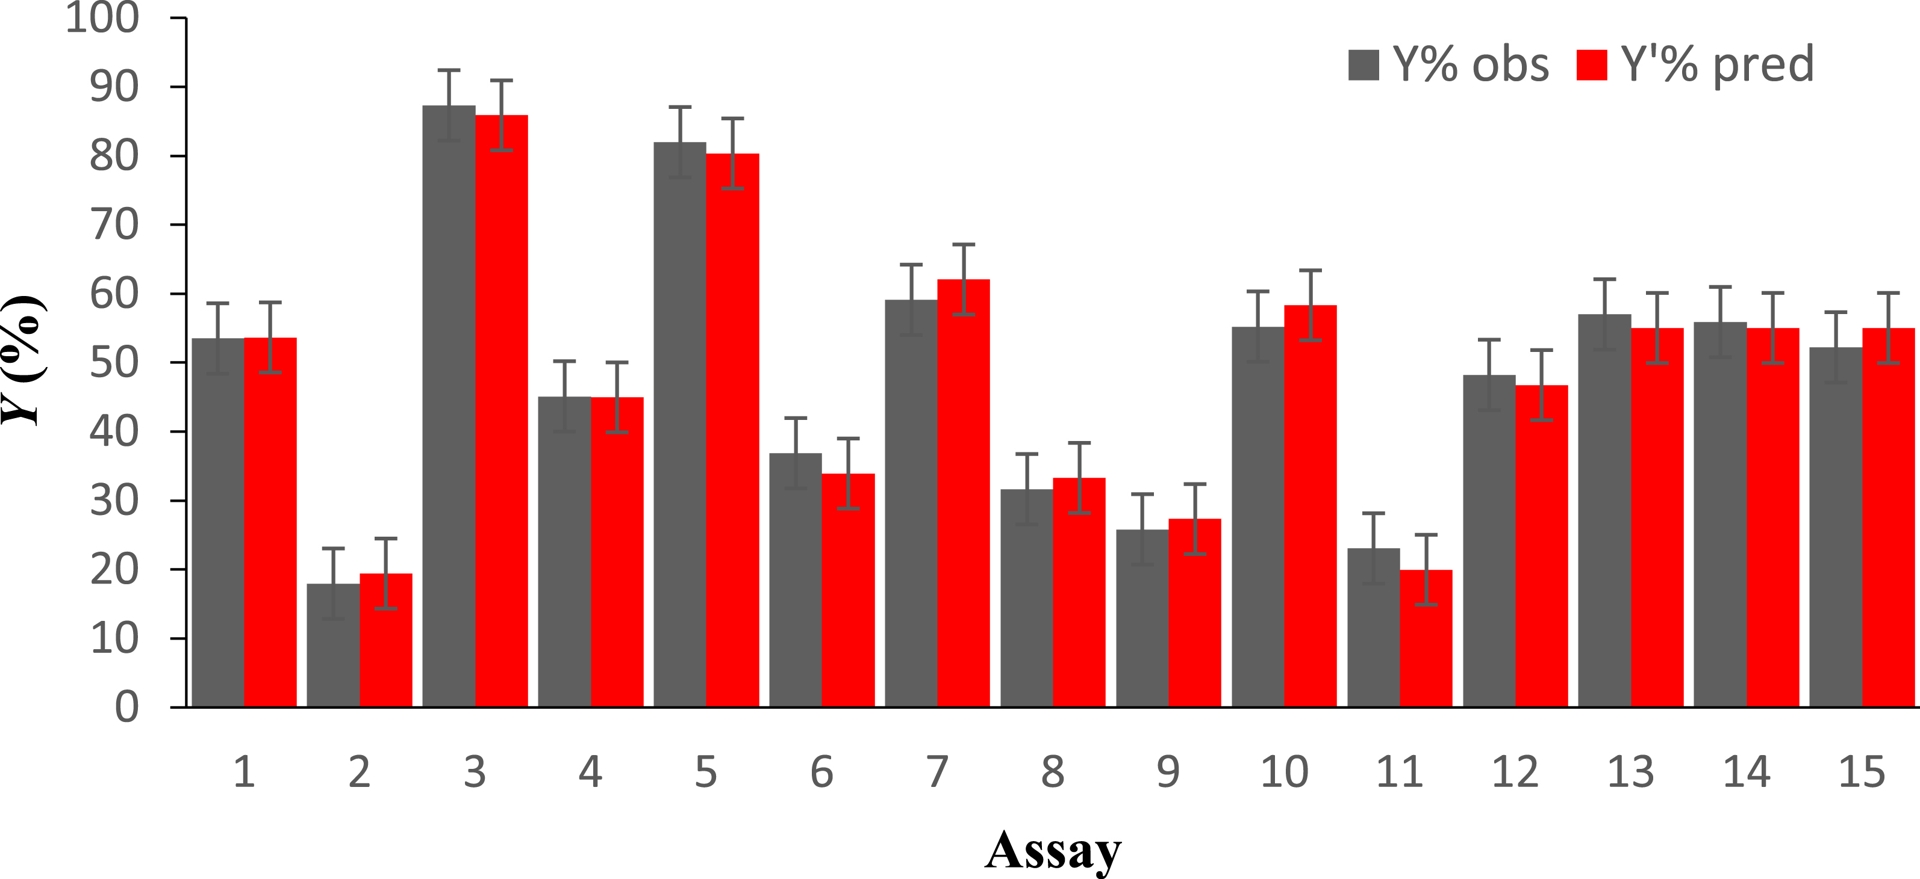
Experiments under the various working conditions are presented in Table 2, which gives the coded and uncoded values for each assay, including both observed and predicted responses.
In order to evaluate the effect of the factors on the response (the removal of TRZ), a second-order polynomial model was developed based on the experimental data, where Y represents the removal yield; as presented in Equation (3).
| \begin {eqnarray} Y (\%) = -12.2 - 4.713 X_{1} + 2.409 X_{2} + 22.27 X_{3} +\, 0.0513 X_{1}^{2} -0.02296 X_{2}^{2} - 1.940 X_{3}^{2} - 0.00831 X_{1}X_{2} + 0.2206 X_{1}X_{3} - 0.0264 X_{2}X_{3}. \label {eq3} \end {eqnarray} | (3) |
2.3.1. Statistical analysis and ANOVA
The adequacy and statistical significance of the regression model were assessed using analysis of variances (ANOVA) which included evaluation of the F-value, p-value, and lack-of-fit test. The results are reported in Table 3.
Analysis of variance (ANOVA) and model summary
| Source | DF | Adj SS | Adj MS | F-Value | p-Value |
|---|---|---|---|---|---|
| Model | 9 | 5410.74 | 601.19 | 47.80 | 0.000 |
| Linear | 3 | 4671.22 | 1557.07 | 123.81 | 0.000 |
| X1 | 1 | 2824.51 | 2824.51 | 224.59 | 0.000 |
| X2 | 1 | 1667.82 | 1667.82 | 132.62 | 0.000 |
| X3 | 1 | 178.89 | 178.89 | 14.22 | 0.013 |
| Square | 3 | 646.13 | 215.38 | 17.13 | 0.005 |
| X12 | 1 | 97.14 | 97.14 | 7.72 | 0.039 |
| X22 | 1 | 311.39 | 311.39 | 24.76 | 0.004 |
| X32 | 1 | 222.25 | 222.25 | 17.67 | 0.008 |
| 2-Way interaction | 3 | 93.39 | 31.13 | 2.48 | 0.176 |
| X1X2 | 1 | 11.06 | 11.06 | 0.88 | 0.391 |
| X1X3 | 1 | 77.88 | 77.88 | 6.19 | 0.055 |
| X2X3 | 1 | 4.45 | 4.45 | 0.35 | 0.578 |
| Error | 5 | 62.88 | 12.58 | ||
| Lack-of-fit | 3 | 50.37 | 16.79 | 2.68 | 0.283 |
| Pure error | 2 | 12.52 | 6.26 | ||
| Total | 14 | 5473.62 | |||
| Model summary | S = 3.54631 R2 = 98.9% R2(adj) = 96.8% R2(pred) = 84.8% | ||||
The statistical significance of the model terms depends on the F-values and corresponding p-values. Significant terms are characterized by large F-values coupled with small p-values (p < 0.05), while non-significant terms have low F-values and high p-values (p > 0.05) [29]. The F-value for the model as reported in Table 3 is 47.8 and the p-value is less than 0.05, indicating that the model is significant. This suggests that the model is statistically useful and accurately represents the form of the relationship between the variables and the response. Therefore, the model can be considered reliable.
Statistical adjustment indicates that the model adequately describes the experimental data. This is further confirmed by the high value of R2 (98.9%), adjusted R2 (96.8%), and predicted R2 (85.8%) as shown in Figure 4, indicating the model’s high ability to explain and predict the response variable.
Predicted data versus observed data.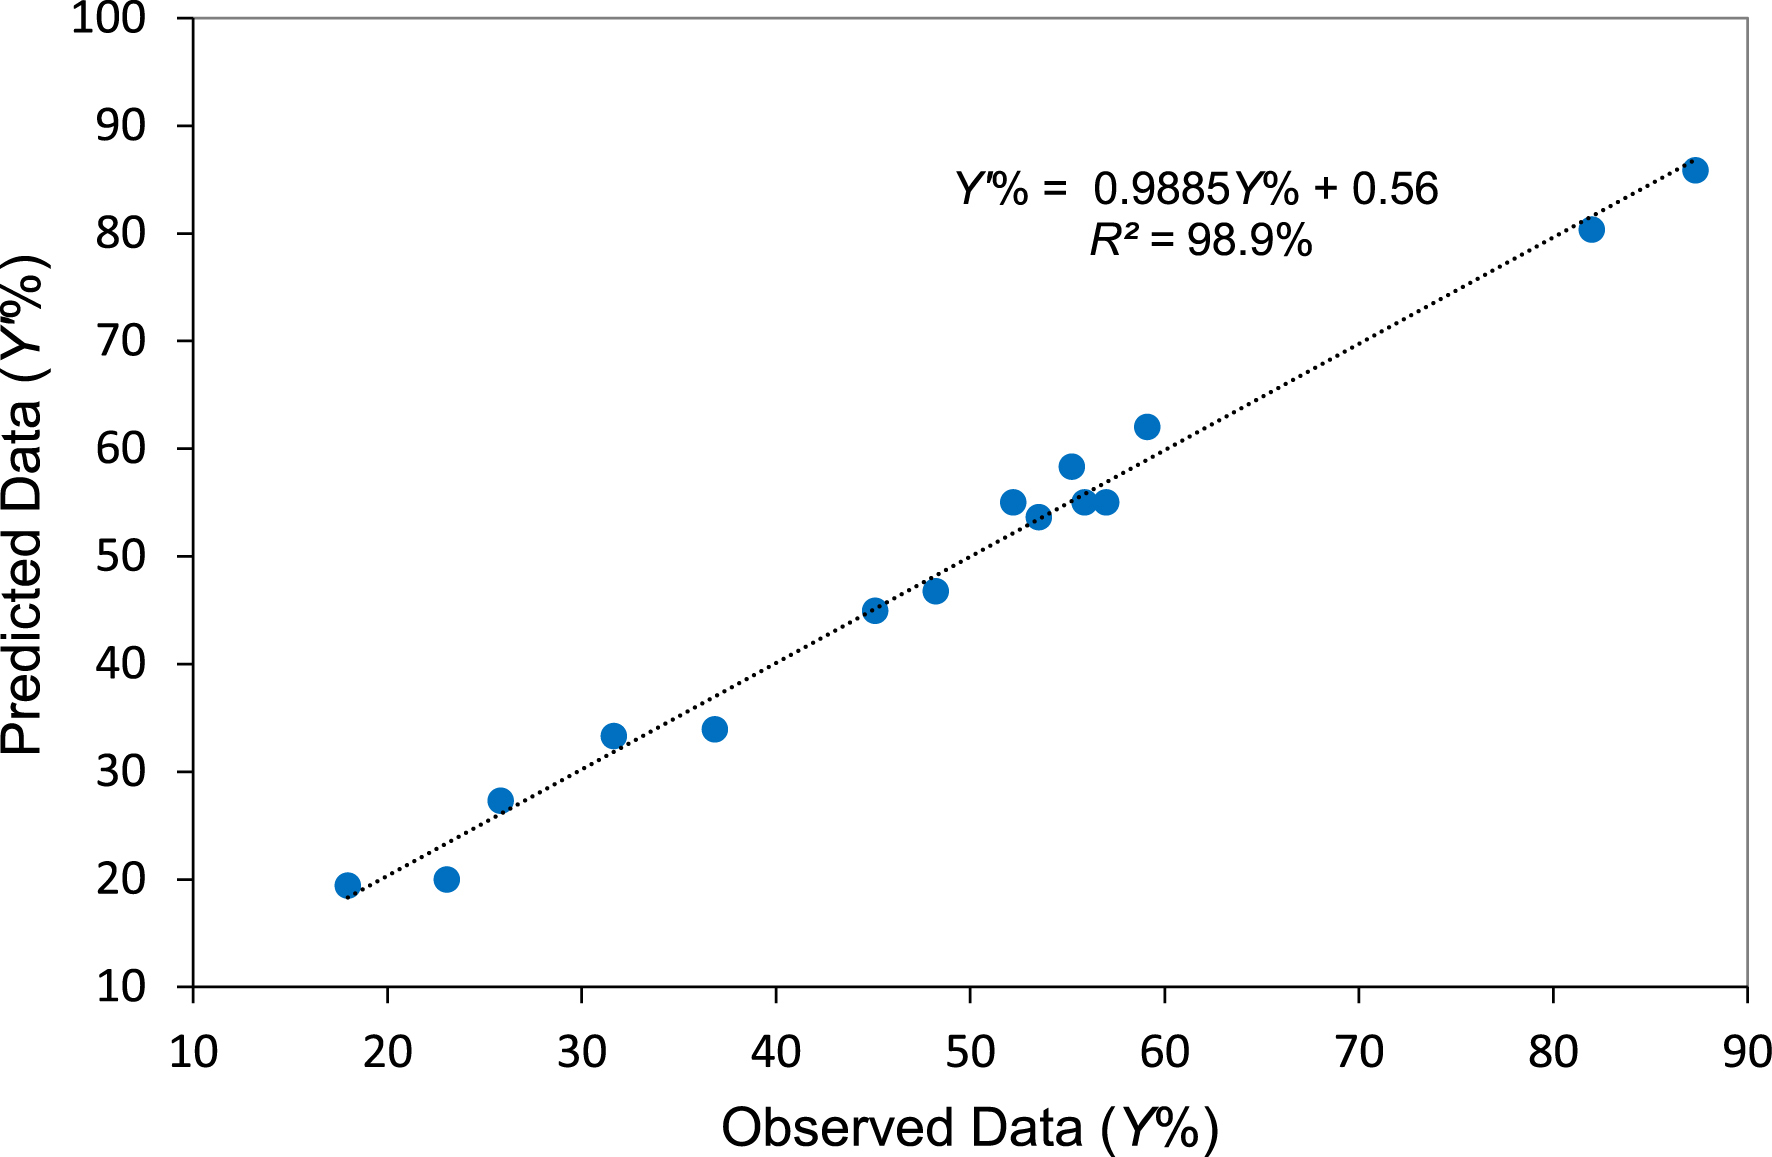
The model terms X1, X2, X3, X12, X22, and X32 are significant (p-value < 0.05), whereas the interaction terms X1X2, X1X3, and X2X3 are not significant (p-value > 0.05). The p-value of the lack-of-fit is non-significant (p = 0.283 > 0.05).
2.3.2. Analysis of response surface and effects of the factors
From the fitted model, a 3D response surface plot and contour plot were generated to investigate two-way interactions between the factors affecting the removal of TRZ (response) as shown in Figure 5.
3D surface and contour plot of factor interactions: (a,b) Initial TRZ concentration–pH vs Y (%). (c,d) Initial TRZ concentration–mass of photocatalyst vs Y (%). (e,f) Mass of photocatalyst–pH vs Y (%).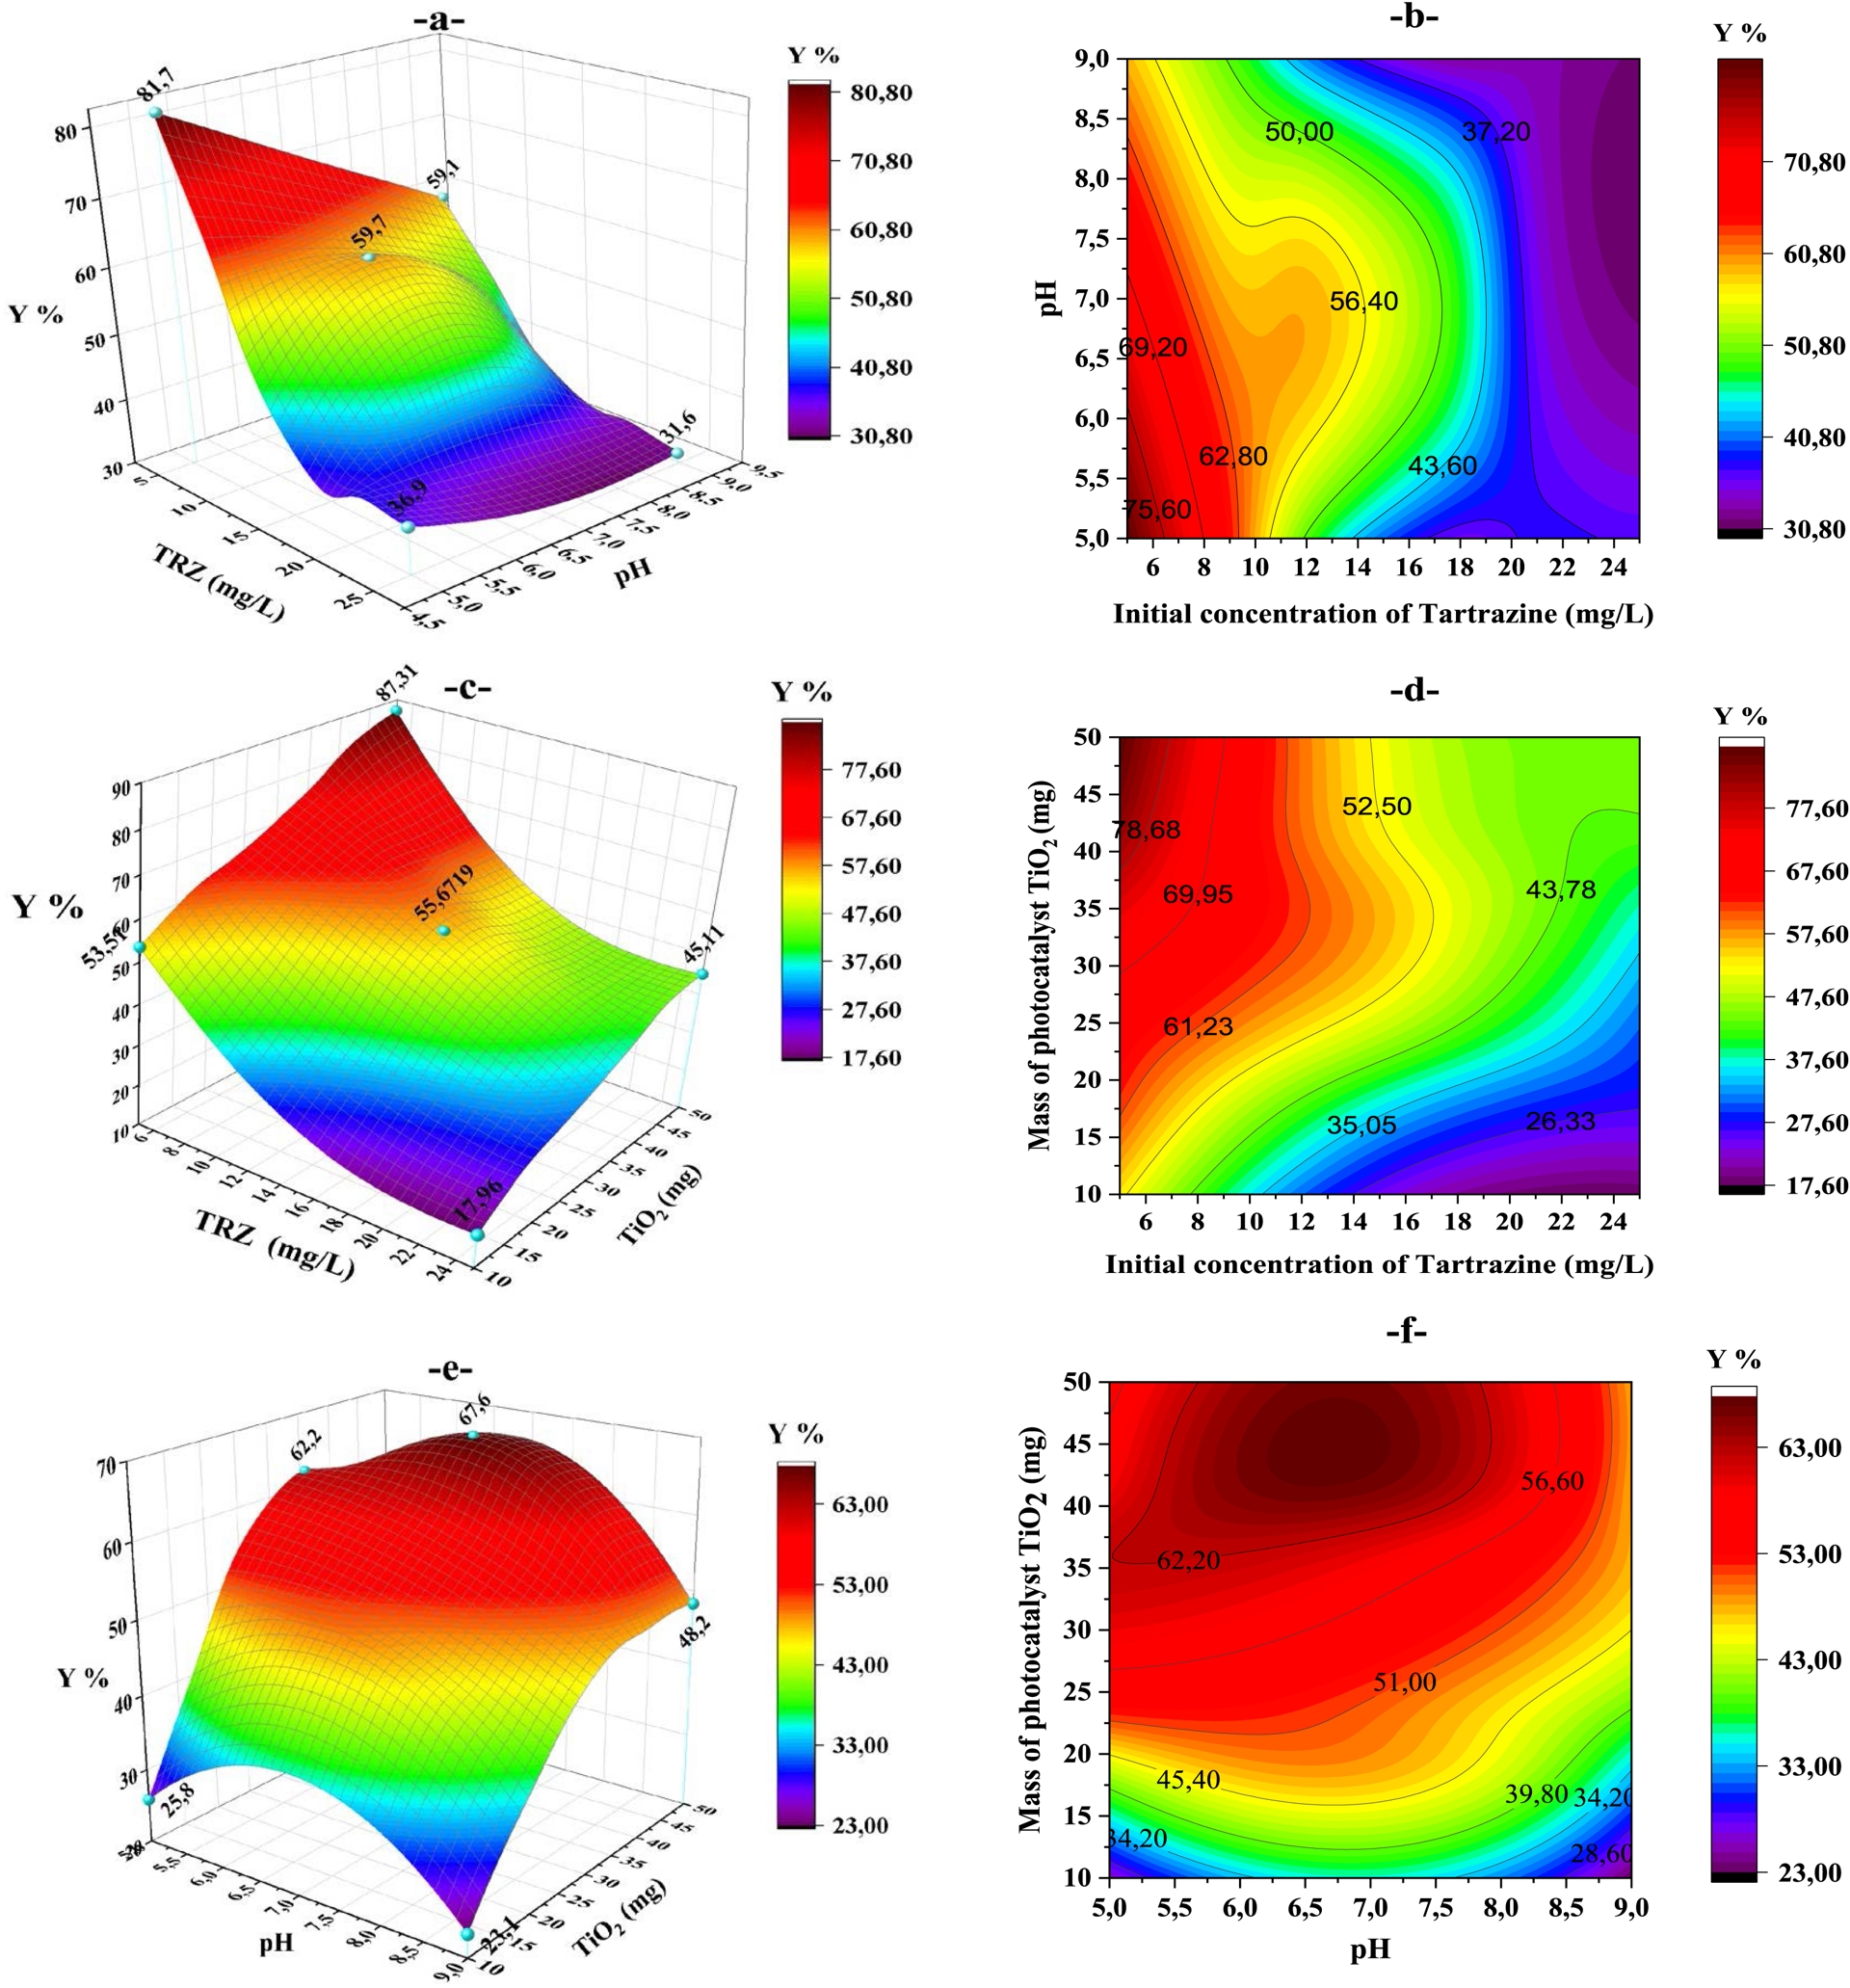
The interaction effect between pH and initial TRZ concentration on the removal efficiency is depicted in Figure 5a,b. For any range of pH (from 5 to 9), degradation efficiency increases as the initial TRZ concentration decreases. For an initial TRZ concentration of 25 mg/L, degradation efficiencies of 31.6% and 36.9% were obtained at pH = 9 and pH = 5, respectively. As the initial concentration increases, the number of active sites required at the catalyst surface also increases. Since illumination time and amount of catalyst are constant, the OH• radical (primary oxidant) formed at the surface of TiO2 is also constant.
Therefore, the relative number of free radicals interacting with TRZ decreases as the amount increases [30]. In contrast, a significant effect of pH was observed at a lower concentration (5 mg/L); yields of 59.1% and 81.7% were obtained for pH = 9 and pH = 5, respectively, which represents a significant increase compared to the yield values at a higher concentration (25 mg/L). When pH is too high, competitive adsorption occurs between OH− and the negatively charged material surface. The predominant OH− groups interact primarily with TRZ molecules, reducing the interaction efficiency of the materials [31]; that could explain the difference in degradation efficiency between pH = 9 and pH = 5. The highest degradation efficiency was observed for initial TRZ concentrations in the range 5–8 mg/L and for pH values between 5 and 6.
The interaction effect of initial TRZ concentration and photocatalyst mass on removal efficiency is presented in Figure 5c,d. As it can be seen in the 3D response surface plot of Figure 5c, as soon as the initial TRZ concentration decreases and the mass of TiO2 increases, degradation efficiency increases. For an initial concentration of 25 mg/L, removal efficiency increases from 18.0% to 45.1% when TiO2 mass is increased from 10 to 50 mg. Similarly, when the initial concentration of TRZ is lower (5 mg/L), removal efficiency rises from 53.5% to 87.3% when TiO2 mass is increased from 10 to 50 mg. The dark red area in the contour plot presented in Figure 5d shows that the highest removal efficiencies (78.7%–87.3%) were observed for the lowest initial TRZ concentrations (5–8 mg/L) and highest TiO2 mass (40–50 mg). A comparable trend was also observed by Buu et al. and Rostami-Javanroudi et al. [32, 33]. Increasing the amount of catalyst led to an increase in the number of photons absorbed and, consequently, improved degradation efficiency [34, 35]. In contrast, the “colder” areas in the contour plot, where degradation efficiency remains below 40%, can be explained by a much more significant absorbance of UV light by TRZ itself at higher TRZ concentrations. As a result, fewer photons reach the surface of TiO2 and the hydroxyl radical flux on the catalyst surface is thus reduced [36]. Certain adsorption phenomena promote competition between adsorbed molecules and the solvent, which can slow down or prevent the formation of a large quantity of OH• radicals on the surface of the catalyst. Consequently, the photocatalytic effect of these radicals on TRZ will also decrease.
The interaction effect of pH and photocatalyst mass on TRZ removal is presented in Figure 5e,f. Below 35 mg TiO2, degradation efficiency increases with photocatalyst mass across the entire pH range. It can be attributed to the enhanced adsorption of photons, which promotes the generation of reactive species. Degradation efficiency decreases beyond 35 mg TiO2 at pH 5.0–5.5, beyond 45 mg TiO2 at pH 6.0–7.5. This behavior is likely due to an increase in solution opacity, which leads to a reduction in photon flux penetration, thereby decreasing the photocatalytic degradation rate [37]. Moreover, a loss in surface area by agglomeration (particle–particle interactions) at high solid concentration is also observed [38]. The highest degradation efficiency was observed at pH 6.0–7.5 and photocatalyst mass 40–45 mg.
Optimizing the conditions for photocatalytic degradation is essential. In this study, the optimal levels of the process variables leading to maximum degradation efficiency were determined using an approach based on the concept of desirability. The composite desirability score is based on transforming the response variable into a scale-free value that reflects how desirable a particular outcome is: 0 (completely undesirable) to 1 (fully desirable) [39].
According to Table 4, the conditions for initial TRZ concentration, TiO2 mass, and pH that yielded the highest degradation rate predicted (89.3%) were: 5 mg/L, 48.4 mg, and 5.7, respectively. Under similar conditions (Assay 3), the experimental response was 87.3% which confirms accuracy of the predicted value.
Optimal conditions and corresponding predicted response value
| Optimal conditions | Desirability | Predicted | Error | ||
|---|---|---|---|---|---|
| Initial concentration of TRZ (mg/L) | Photocatalyst mass (mg) | pH | |||
| 5.0 | 48.4 | 5.7 | 1 | 89.3 | 3.27 |
2.4. Kinetic study of photocatalytic degradation
The kinetics of the photocatalytic degradation for many organic compounds in TiO2 suspensions exposed to intense UV light has been modeled using the equation of Langmuir–Hinshelwood (L–H) applied for heterogeneous catalytic processes according to the work reported by Kiani et al. [40]. The model considers that the reaction rate v is proportional to the photocatalyst surface fraction covered by the substrate (𝜃). In order to study the mechanism of photocatalysis degradation, a first-order kinetic model was applied in accordance with the following equations (Equations (4)–(8)):
| \begin {equation}\label {eq4} v = - \dfrac {\mathrm {d}C_{t}}{\mathrm {d}t} = k \theta \end {equation} | (4) |
| \begin {equation}\label {eq5} \theta = \dfrac {KC_{t}}{(1+KC_{t})}. \end {equation} | (5) |
| \begin {equation}\label {eq6} v = - \dfrac {\mathrm {d}C_{t}}{\mathrm {d}t} = k \dfrac {KC_{t}}{(1+KC_{t})}, \end {equation} | (6) |
| \begin {equation}\label {eq7} -\dfrac {\mathrm {d}C_{t}}{\mathrm {d}t} = k K C_{t} = k_{\mathrm {app}}C_{t}. \end {equation} | (7) |
| \begin {equation}\label {eq8} \ln \left (\frac {C_{0}}{C_{t}}\right ) = k_{\mathrm {app}} t, \end {equation} | (8) |
Kinetic profiles of TRZ photodegradation with TiO2 (see Table 2 for conditions 1–15) and control tests (TRZ/TiO2, TRZ/UV).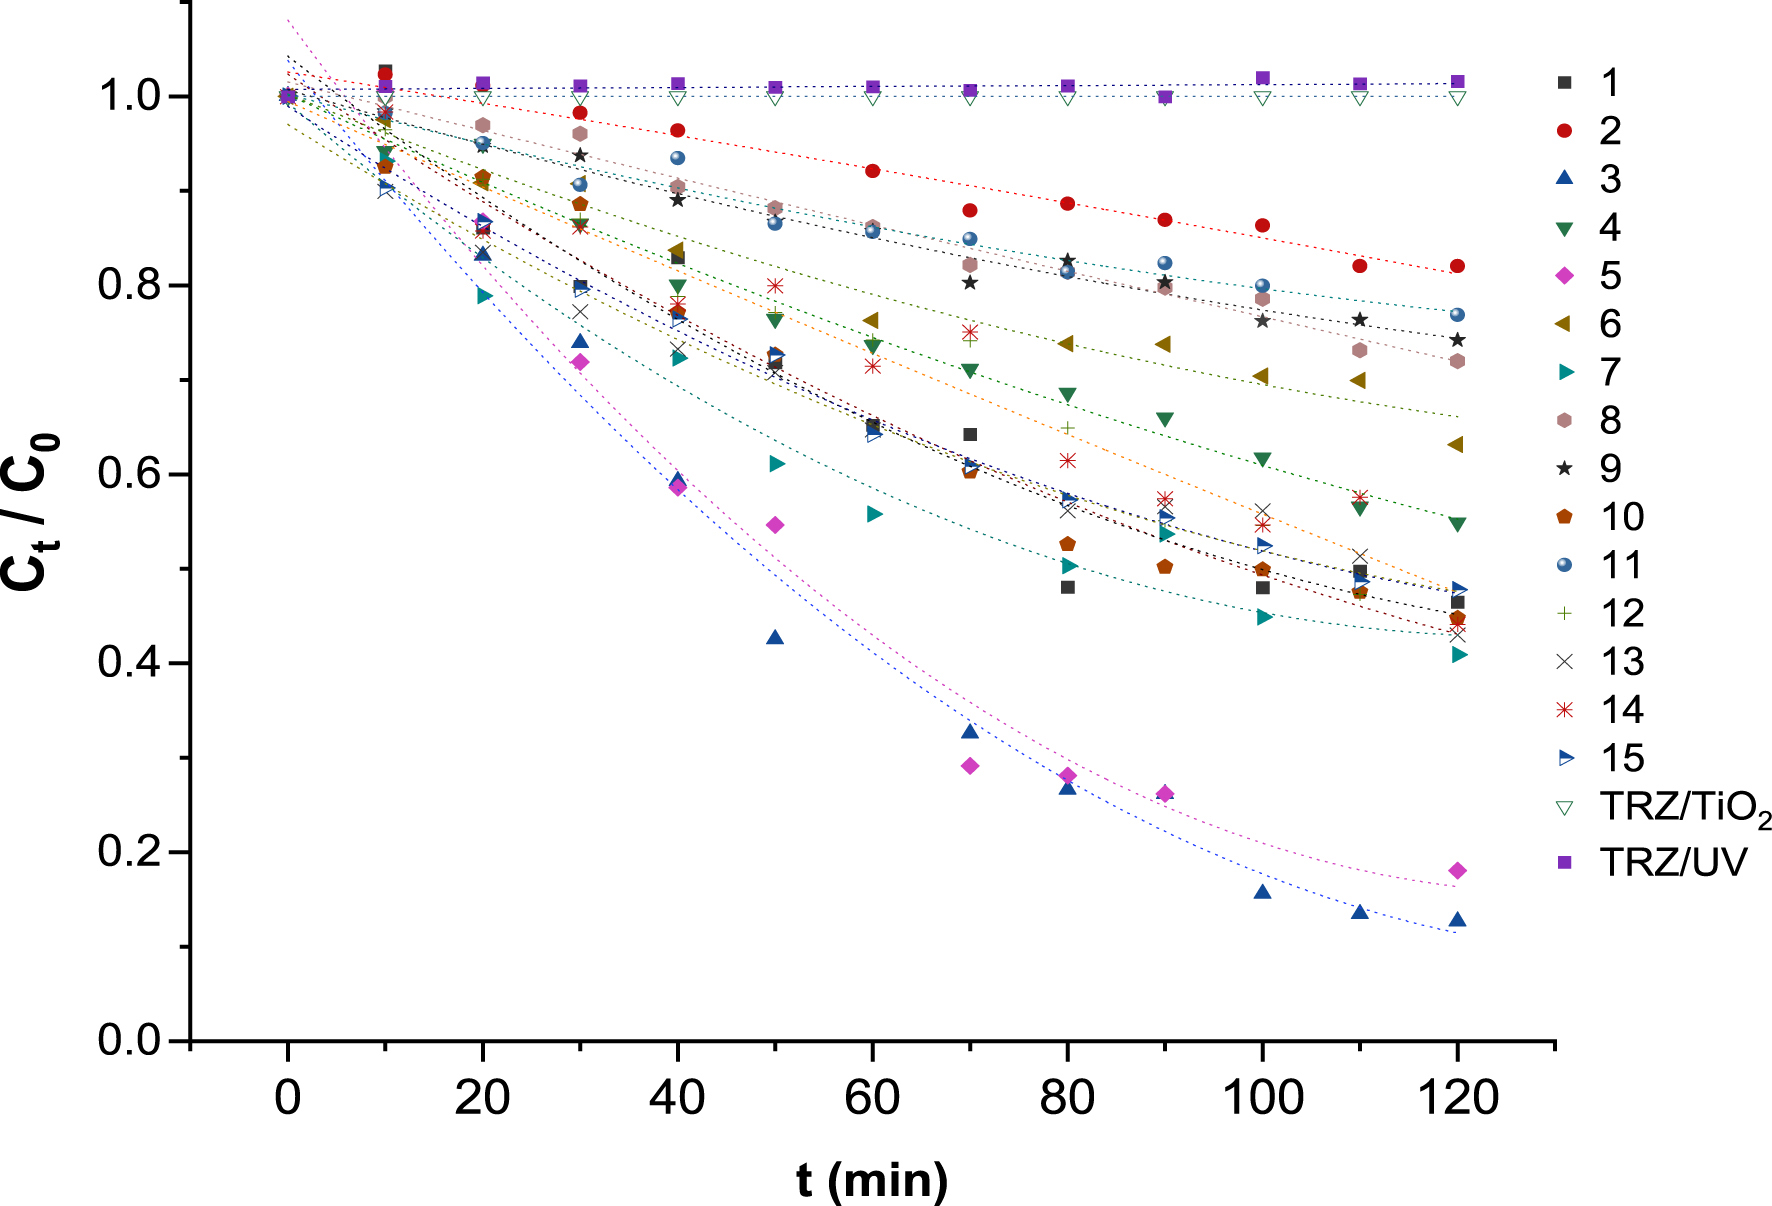
A significant decrease in TRZ concentration, confirming the high performance and efficient TRZ removal within two hours only, particularly for Assay 3 conducted with a TRZ concentration of 5 mg/L (−1), a TiO2 mass of 50 mg (+1), and at pH 7 (0). The results also demonstrate that efficient degradation occurred only when both TiO2 and UV irradiation were combined, emphasizing the photocatalytic nature of the process.
Most of the runs exhibited good linearity with correlation coefficients R2 ranging from 0.88 to 0.99, confirming the suitability of this model under the conditions studied (Table 5).
First-order kinetic parameters of TRZ photocatalysis under various experimental conditions
| Assay | Design conditions | Kinetic parameters | |||
|---|---|---|---|---|---|
| [TRZ] (mg/L) | mTiO 2 (mg) | pH | kapp (min−1) | R2 | |
| 1 | 5 | 10 | 7 | 0.0007 | 0.93 |
| 2 | 25 | 10 | 7 | 0.0019 | 0.92 |
| 3 | 5 | 50 | 7 | 0.0019 | 0.92 |
| 4 | 25 | 50 | 7 | 0.0049 | 0.99 |
| 5 | 5 | 30 | 5 | 0.0121 | 0.74 |
| 6 | 25 | 30 | 5 | 0.0035 | 0.95 |
| 7 | 5 | 30 | 9 | 0.0072 | 0.94 |
| 8 | 25 | 30 | 9 | 0.0028 | 0.98 |
| 9 | 15 | 10 | 5 | 0.0027 | 0.97 |
| 10 | 15 | 50 | 5 | 0.0072 | 0.93 |
| 11 | 15 | 10 | 9 | 0.0021 | 0.85 |
| 12 | 15 | 50 | 9 | 0.0062 | 0.95 |
| 13 | 15 | 30 | 7 | 0.0061 | 0.97 |
| 14 | 15 | 30 | 7 | 0.0061 | 0.94 |
| 15 | 15 | 30 | 7 | 0.0063 | 0.99 |
However, among the tests, two kinetic profiles (Assays 5 and 11 in Table 5) showed lower correlation value, suggesting partial deviation from the pseudo-first-order behavior. These discrepancies can be attributed to non-ideal adsorption–desorption equilibrium on the TiO2 surface, variation in catalyst dispersion, or light intensity fluctuations during the reaction [41].
The kinetic data were fitted to the pseudo-first-order model by plotting ln(C0/Ct) versus time t (Figure 7).
TiO2 photocatalysis is a heterogeneous kinetic process, comprising several successive steps initiated by the electron–hole pair formation reaction (e−/h+), which depends on the value of the energy gap, according to the following equation at the point of zero charge (PZC) of the photocatalyst (6.3) and close to it in a neutral medium:
| \begin {equation*} \mathrm {TiO}_{2} \overset {h\nu (\mathrm {UV})}{\longrightarrow } \mathrm {TiO}_{2} (\mathrm {h}_{\mathrm {VB}}^{+} + \mathrm {e}_{\mathrm {CB}}^{-}). \end {equation*} |
But in an acidic medium at a pH lower than the photocatalyst’s PZC (6.3), the TiO2 surface is positively charged by protonation of the oxygens oriented toward the surface, producing the TiOH2+ form, favorable to the adsorption of anionic functional groups or electronegative ones (electron donors such as nitrogen or oxygen doublets). Conversely, in a basic medium or at pH > PZC, the surface is negatively charged (TiO−) and preferentially attracts cations.
Linearized kinetic curves according to the pseudo-first-order of Langmuir–Hinshelwood (L–H) model for photocatalyzed TRZ degradation (see Table 2 for conditions 1–15, with TRZ/TiO2 and TRZ/UV control tests).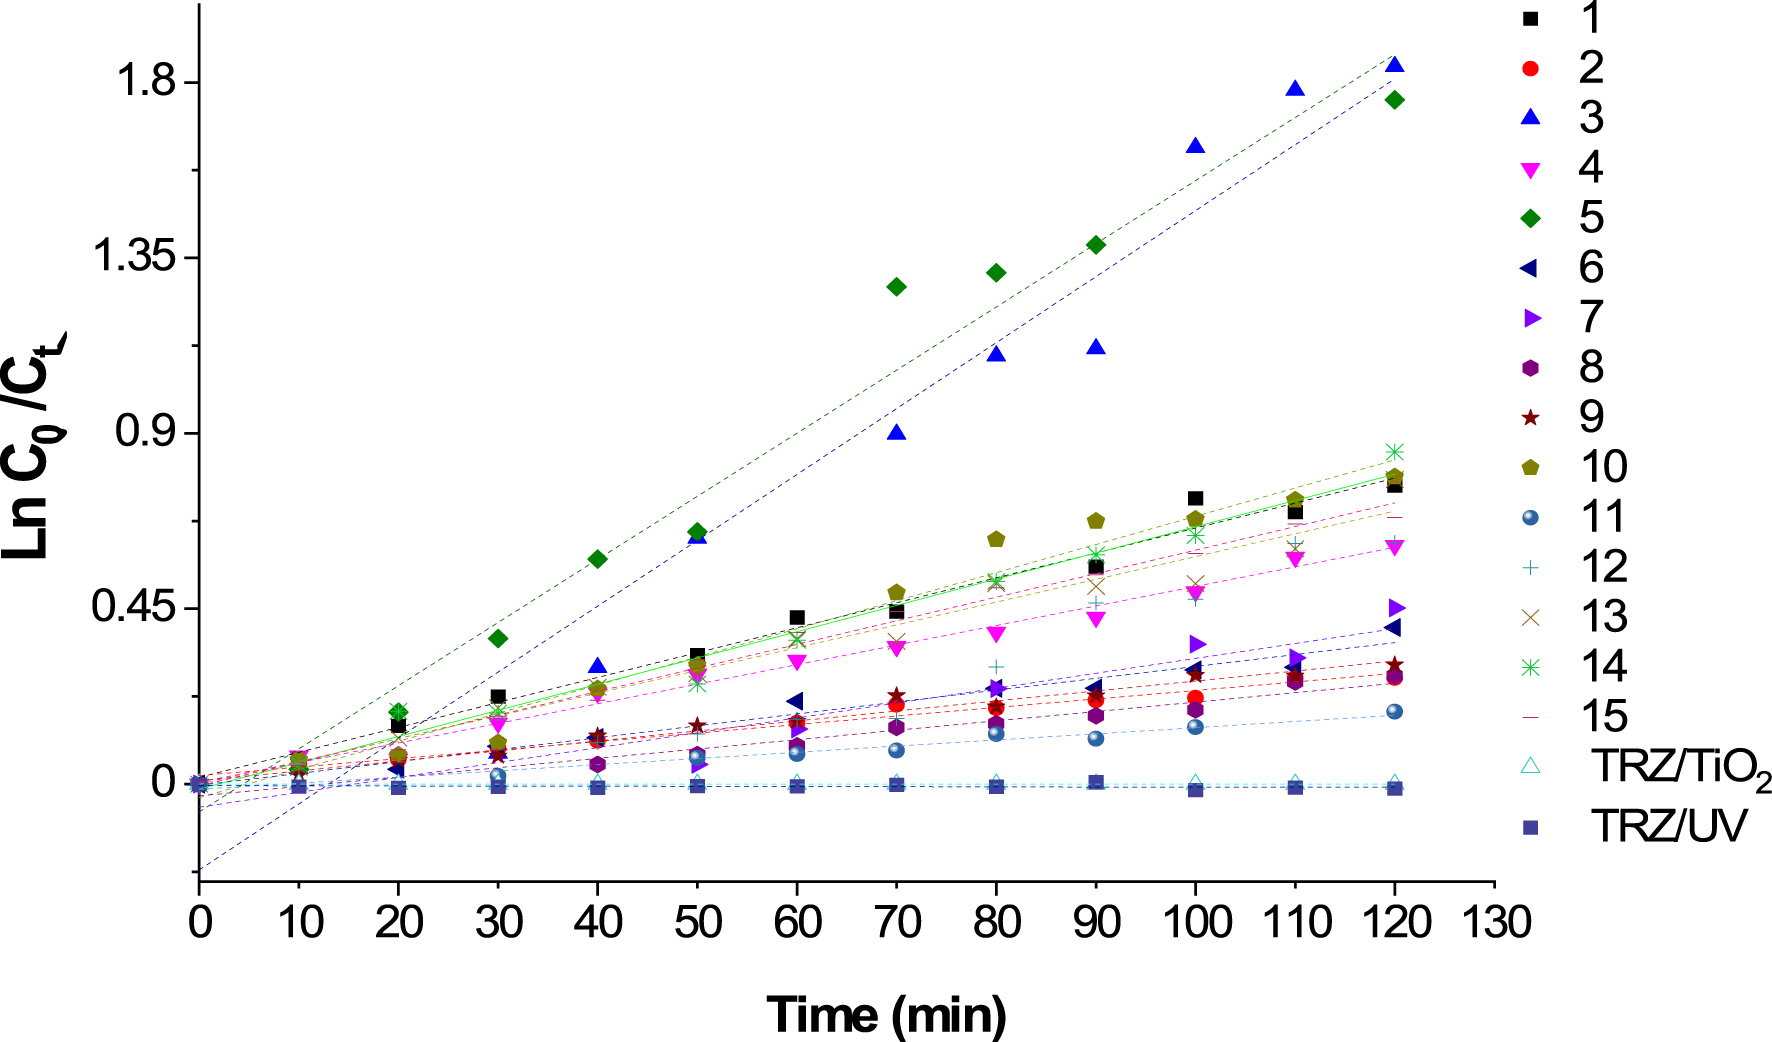
Furthermore, since TRZ possesses lone electron pairs on the oxygens of functional groups, such as sulfonates (SO32−), carboxylate (COO−) and azo N=N, the photocatalytic activity of TiO2 and its adsorption property toward TRZ increase significantly in acidic medium, while they decrease in neutral and basic medium (Table 2). In addition, H+ excess promotes the formation of a large number of holes, by recombining more with the mobile electrons of the photoconduction band (CB). This increases the number and speed of hopping of the electrons from the valence band (VB) to the CB and thus increases the number of active holes with respect to the adsorbed pollutant.
| \begin {eqnarray*} \mathrm {TiO}_{2} + \mathrm {H}_{2}\mathrm {O} & \longrightarrow & [\mathrm {TiO}{-}\mathrm {OH}] + \mathrm {H}^{+} \quad \mbox {at } \mathrm {pH} = 6.3 \\ {}[\mathrm {TiO}{-}\mathrm {OH}] + \mathrm {H}^{+} &\longrightarrow & [\mathrm {TiO}{-}\mathrm {OH}_{2}]^{+} \quad \mbox {at } \mathrm {pH} < 6.3 \\ {}[\mathrm {TiO}{-}\mathrm {OH}] + \mathrm {OH}^{-} &\longrightarrow & [\mathrm {TiO}{-}\mathrm {O}]^{-} + \mathrm {H}_{2}\mathrm {O} \quad \mbox {at } \mathrm {pH} > 6.3 \\ {}[\mathrm {TiO}{-}\mathrm {OH}]^{+} &\overset {h\nu }{\longrightarrow }& [\mathrm {TiO}{-}\mathrm {OH}]^{+} (\mathrm {h}_{\mathrm {VB}}^{+} + \mathrm {e}_{\mathrm {CB}}^{-}) \\ \mathrm {H}_{2}\mathrm {O}_{\mathrm {ads}} + \mathrm {h}_{\mathrm {VB}}^{+} &\longrightarrow & \mbox {}^{\bullet } \mathrm {OH}_{\mathrm {ads}} + \mathrm {H}_{\mathrm {ads}}^{+} \\ \mathrm {OH}_{\mathrm {ads}}^{-} + \mathrm {h}_{\mathrm {VB}}^{+} &\longrightarrow & \mbox {}^{\bullet } \mathrm {OH}_{\mathrm {ads}} \\ \mathrm {O}_{2\mathrm {ads}} + \mathrm {e}_{\mathrm {CB}}^{-} &\longrightarrow & \mathrm {O}_{2}^{\bullet -} \end {eqnarray*} |
| \begin {eqnarray*} \left .\begin {array}{ccl} [\mathrm {TRZ}]_{\mathrm {ads}} + {}^{\bullet }\mathrm {OH}_{\mathrm {ads}} & \longrightarrow & [\mathrm {TRZ}{-}\mathrm {OH}]^{\bullet }_{\mathrm {ads}} \\[3pt] {}[\mathrm {TRZ}]_{\mathrm {ads}} + \mathrm {O}_{2\,\mathrm {ads}}^{\bullet -} &\longrightarrow & [\mathrm {TRZ}]^{\bullet -}_{\mathrm {ads}} + \mathrm {O}_{2} \\[3pt] {}[\mathrm {TRZ}]_{\mathrm {ads}} + \mathrm {h}_{\mathrm {VB}}^{+} &\longrightarrow & [\mathrm {TRZ}]^{\bullet +}_{\mathrm {ads}} \\[3pt] {}[\mathrm {TRZ}]_{\mathrm {ads}} + \mathrm {e}_{\mathrm {CB}}^{-} &\longrightarrow & [\mathrm {TRZ}]^{\bullet -}_{\mathrm {ads}} \end {array}\right \} \longrightarrow \mbox {Photodegradation products.} \end {eqnarray*} |
It appears that the main factor influencing the photocatalytic activity and the photocatalyst surface is the pH of the solution. Indeed, one of the intrinsic properties of the molecule is its acid–base dissociation equilibrium in aqueous solution. In the case of TRZ, three dissociation equilibria are observed, characterized by their pKa values of 2, 5, and 10.86, attributed to the sulfonate (SO32−), carboxylate (COO−), and azo (N=N) attracting groups, respectively [42, 43].
In this study, TRZ most often exists in anionic sulfonate form (the most stable), for all our tests of the experimental design, since, as the pH ranged between 5 and 9, that is higher than the first value of pKa = 2. For some tests carried out at pH = 5, an equilibrium between the anionic carboxylate and neutral carboxylic form could make the two forms coexist in solution. For the tests at pH = 9, the values are higher than that of the second pKa = 5, hence the predominance of the anionic carboxylate form. Conversely, the tests at pH = 9 could favor the cationic form of the azo group (N=NH+) by protonation of the latter. For tests at pH = 7, slightly higher than the PZC, the surface of the photocatalyst has both positive and negative charges, so that both forms [TiO–OH]+ and [TiO−] can exist at the same time and adsorb anionic and cationic groups, respectively. At the same time, for tests at pH = 5 (< PZC = 6.3), the dispersion of the photocatalyst in solution promotes the formation of positives charges on the catalyst surface by protonation of the Ti(IV) sites, producing the [TiO–OH]+ species, which orients the hydroxyl cation (OH+) outside of the TiO2 surface.
Attractive electrostatic forces and hydrogen bonds can thus be created with the anionic sulfonate and carboxylate groups, which further promotes the adsorption and subsequently the interaction of these groups with the hVB+ holes (Intermediate I) in a Kolbe reaction and the radical species •OH formed (Intermediates II, III, IV, and V). This increases the speed and efficiency of the photocatalytic reaction with respect to TRZ, which could react more easily and in a more quantitative manner with the photocatalyst (Figure 8).
Photodegradation mechanism of TRZ by TiO2 at pH ⩽ PZC and under optimal conditions.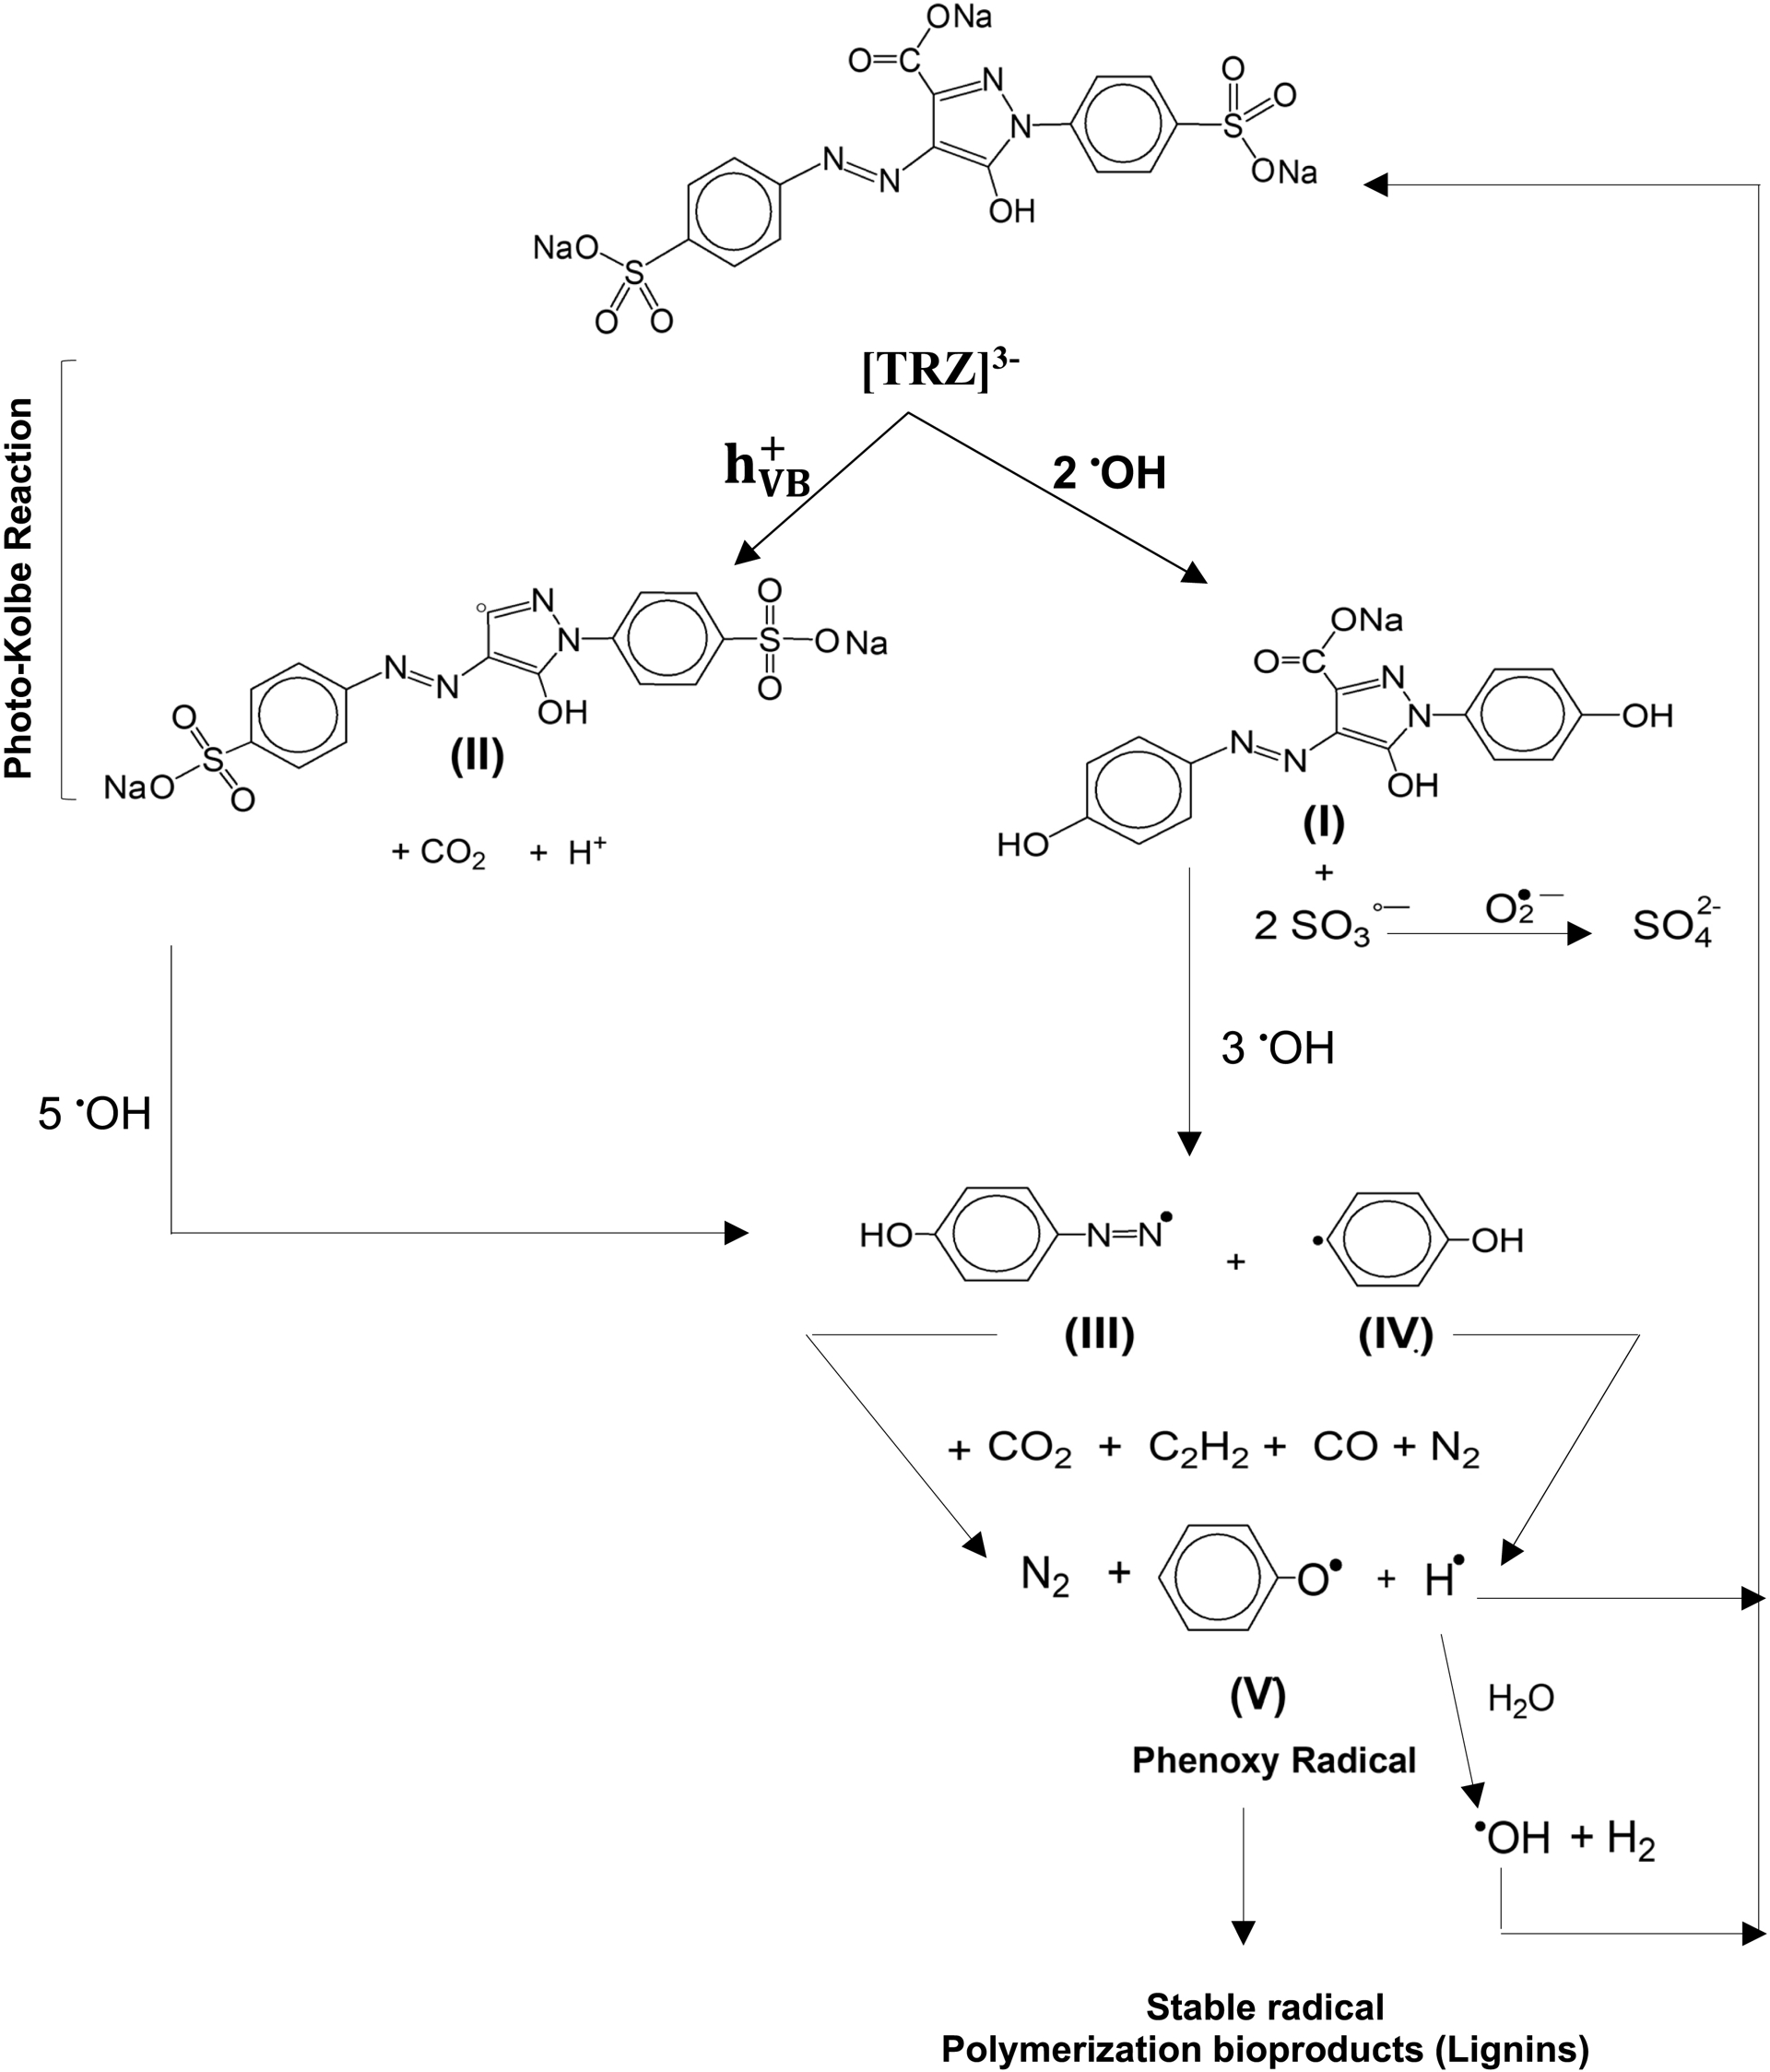
Therefore, it is likely that the mechanism of adsorption–photocatalysis of TRZ on TiO2 involves a series of steps as follows:
A schematic diagram is presented in Figure 9 which summarizes the processes involved in the adsorption–photocatalysis of TRZ under optimal pH conditions (pH = 5 and 7). The photocatalytic activity increases with the interactions created on the one hand between TRZ and the •OH radical (therefore, with the lower energy species hVB+) and on the other hand with eCB− of high energy. These different combinations as well as the recycling of the •OH, O2•−, and •H radical species increase the photocatalytic efficiency of the process.
Diagram of TRZ photodegradation by TiO2/UV under optimal pH conditions.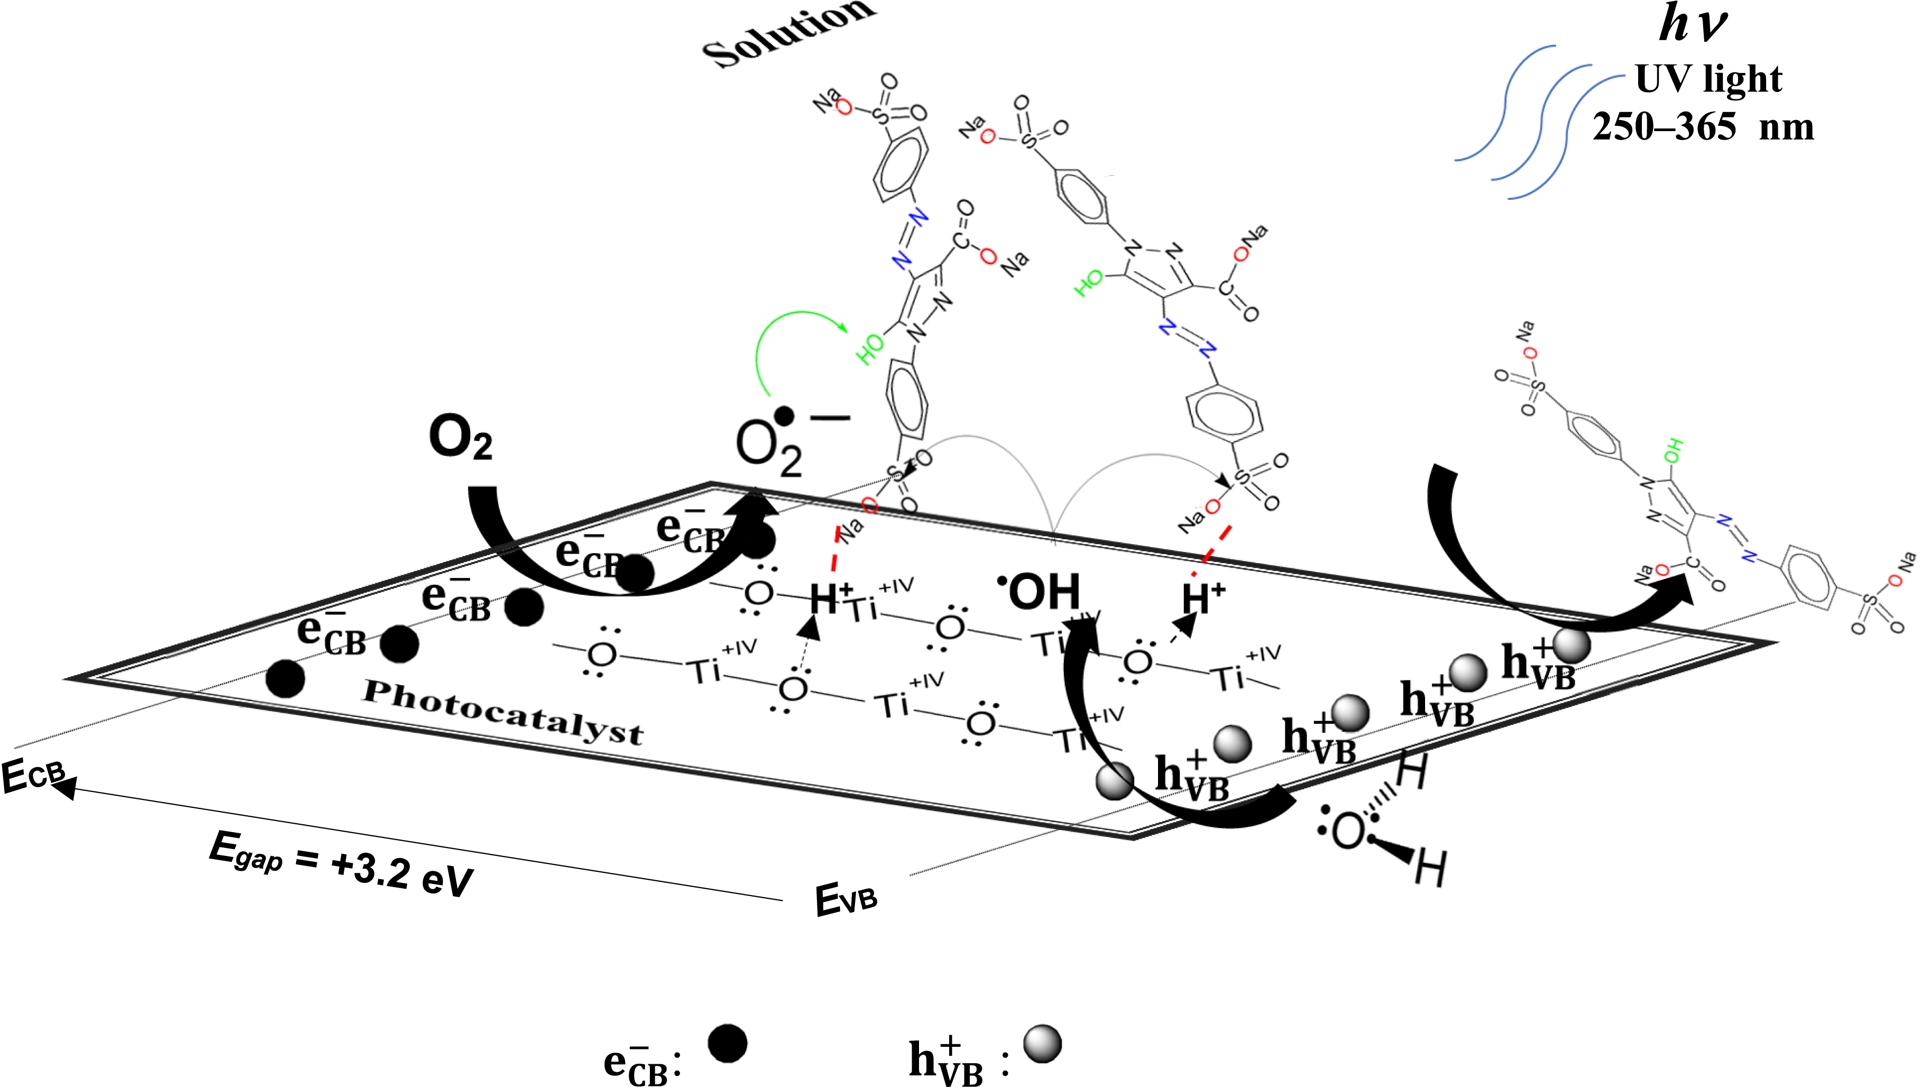
Furthermore, the photoproducts formed at the end of the process are essentially gas and water molecules with stable polymerization bioproducts (lignin) of the phenoxy radical, which do not present any risk to the environment. Recent work by Klett et al. [43] has shown that the number of negatively charged sites increases significantly when the solution’s pH is higher than PZC. Therefore, the repulsion between TRZ’s anionic groups and the negatively charged sites on the surface of the photocatalyst is significantly favored. This decreases the adsorption capacity with increasing pH of TRZ solutions.
Moreover, at pH = 9, the only cationic group formed is the azo group by protonation of one of the two nitrogens (N=NH+). However, because this group is directly linked to two bulky substituents, the sulfophenyl and pyrazole rings, this creates steric constraints that prevent the approach of the N=NH+ group toward the negative sites of the catalyst surface and its adsorption/photocatalysis.
3. Conclusion
To prove the efficiency of the heterogeneous TiO2-catalyzed photocatalytic degradation of azo food dye tartrazine, a method based on statistical control using a design of experiments was developed. The application of the Box–Behnken design of experiments significantly reduced the number of experiments required, while simultaneously revealing key interactions between operating parameters and overcoming the limitations of the traditional “one-factor-at-a-time” approach.
Statistical analysis, performed using ANOVA and response surface method (RSM), confirmed the relevance and reliability of the model developed. The high coefficients of determination (R2 = 0.98, Radj2 = 0.96, and Rpred2 = 0.85) showed excellent correlation between experimental and predicted values, thus validating the model and confirming its predictive power for optimizing operating conditions. The optimal factor values and the associated model-predicted response were as follows: dye concentration 5 mg/L, catalyst mass 48.4 mg, and pH 5.7, resulting in a degradation efficiency of 89.3%. Furthermore, the kinetic study indicated that the reaction followed a pseudo-first-order model, corresponding to a photocatalytic mechanism under ideal and optimized conditions.
These results confirm the reliability of the model proposed and the effectiveness of the statistical optimization method for designing high-performance photocatalytic treatment systems.
Ultimately, this research highlights the effectiveness of statistical optimization in improving the photocatalytic degradation of azo dyes and contributes to promoting the sustainable and economical treatment of industrial wastewater containing food dyes that are highly toxic to the environment and human health.
4. Experimental section
4.1. Materials and methods
4.1.1. Reagents
Reagents and catalysts employed in this work, including titanium dioxide (TiO2, 99%), sodium dioxide (NaOH, 97%) were purchased from Biochem Chemopharma. Nitric acid (HNO3, 52.4%) was given by ProLabo. Tartrazine (TRZ), with chemical formula C16H9N4Na3O9S2 and molecular weight 534.4 g⋅mol−1, was supplied by an agri-food industry (Algeria).
4.1.2. Photocatalytic reactor and experimental procedure
Photocatalytic degradation experiments were carried out in a reactor that included a magnetic stirrer with a 100 mL beaker placed at 10 cm below two UV lamps (250–365 nm) as shown (Figure S1 in the SI). Kinetic monitoring was performed over a 2-hour period, with 5 mL aliquots withdrawn at 10 min intervals followed by centrifugation at 6000 rpm for 20 min. Residual dye concentration was determined by UV–Vis absorbance measurements using a Thermo Scientific Genesys 10S spectrophotometer at 𝜆max = 426 nm, using a calibration curve at different pH values.
4.2. Characterization of TiO2 and tartrazine
4.2.1. X-ray diffraction (XRD) analysis
The crystal structure of the commercial TiO2 photocatalyst was determined by XRD (Figure S2 in the SI). The analysis was performed using an Empyrean diffractometer equipped with a reflection–transmission spinner configuration. Cu Kα radiation was employed as the X-ray source, with wavelengths of 1.54 (Kα1) and 1.54 Å (Kα2) and a Kα1/Kα2 intensity ratio of 0.5. The diffraction patterns were collected in a 2𝜃 range of 8–80° with a step size of 0.02626 and a counting time of 27.54 s per step. The patterns were then compared to reference patterns from Crystallography Open Database (COD).
4.2.2. Fourier-transform infrared (FTIR) analysis
FTIR Spectroscopy was employed to identify the characteristic functional groups present in commercial TiO2 and TRZ, using an IR-ATR Nicolet Thermos Scientific iS5 spectrometer. The solid samples were prepared as potassium bromide (KBr) pellets. The spectra were acquired in transmittance mode over a wavenumber range of 4000–500 cm−1.
TiO2 (Figure S3 in SI)
The broad band at 3420 cm−1 is characteristic of O–H stretching vibrations from surface hydroxyl groups (Ti–OH). A distinct peak at 1635 cm−1 is attributed to the in-plane angular deformation vibrations of physisorbed water molecules (δ H–O–H). The peak at 1413 cm−1 can be attributed to deformation vibrations of Ti–O–H. The intense broad absorption below 1000 cm−1 centered around 726 cm−1 corresponds to the deformation vibrations of Ti–O bonds within the TiO2 lattice under a tetrahedral TiO4 structure.
TRZ (Figure S4 in SI)
The broad band at ∼3459 cm−1 correspond to O–H stretching, while the peak at ∼1635 cm−1 is assigned to C=O stretching. Critically, the strong absorption at ∼1560 cm−1 signals the N=N azo bond stretch, TRZ’s key chromophore and the main target for photocatalytic degradation [44]. The aromatic C=C stretching shows at ∼1480 cm−1 confirming the presence of benzene rings in the structure. And the strong bands between 1250 and 1000 cm−1 are attributed to S=O stretching of the sulfonate groups, which contribute to the dye’s hydrosolubility [45].
Acknowledgements
We wish to express our gratitude to the staff of the PTAPC research center at the University of Bejaia, and more particularly to its director, for their invaluable support and for their valuable analyses.
Declaration of interests
The authors do not work for, advise, own shares in, or receive funds from any organization that could benefit from this article, and have declared no affiliations other than their research organization.
Supplementary materials
Supporting information for this article is available on the journal’s website under https://doi.org/10.5802/crchim.454 or from the author.