


 CC-BY 4.0
1. Introduction
According to the International Energy Agency report entitled “key world energy statistics” natural gas provided about 20.3% of the total world energy consumption in 2014 [1]. The methane is the main component of natural gas and can be used as a fuel or as a feedstock in the chemical industry, depending on the quality of the processed gas. Biogas can be considered as a replacement for fossil gas fuels used in transport and power production, in order to handle environmental concerns [2, 3, 4]. It can be produced by the anaerobic digestion (AD) of organic matter contained in food processing wastes, lignocellulosic biomass, and animal manures, which contain carbohydrates, fats and proteins. Often, these feedstocks are available at a low cost, thus making the production of biogas economically more profitable [5].
The dairy industry was an important world economic driver for many years, and it remains so today, it accounts since almost $400 billion in 2015 [6]. In addition, among the food processing industries, the processing of milk consumes substantial amounts of water to ensure the quality control and hygiene standards, thus, large quantities of effluents are generated [7]. For example, the Algerian dairy industry generates nearly 47,000 t only for the whey, which can produce up to 1.41 million m3 of methane [8].
The physico-chemical characteristics of the related produced effluents are variable. They depend on the targeted dairy products and the used cleaning procedures [9]. For instance, the chemical oxygen demand (COD) contents of effluents from dairy industry vary regarding the applied processing. According to Matos et al. [5], the milk processing generate effluents with average COD value around 3000 mg⋅L−1. While, this value becomes much higher in the case of cheese production and can reach about 50,000 mg⋅L−1 [8]. Several dairy industries, particularly, those using cheese whey, discharge effluents with low alkalinity. The use of these substrates for biogas production, increases the volatile fatty acids production which could significantly inhibit the activity of methanogenic bacteria [10].
Demirel et al. [11] emphasize that the presence of certain compounds such as fats, suspended solids and nutrients (nitrogen and phosphorus) also contribute in the increase of the COD level. If dairy effluents are not properly disposed, they may result in significant environmental hazards [12]. Indeed, ineffective and inefficient treatment of these wastes may contribute to the eutrophication of waters. The latter can lead to serious water related quality problems such as loss of biodiversity and toxic effects of algal toxins on the whole ecosystems [13].
Among the available techniques for biological waste treatment, anaerobic digestion (AD) of dairy industries is suggested as a truly sustainable process which can handle the contained high organic contents. The effluents from dairy industries have a high organic matter and low alkalinity due to the by-products generated, several solutions have been advanced, such as the co-digestion by using biomasses with large buffering capacity or the addition of chemicals compounds [13, 14, 15, 16].
Macroalgae accumulation in the near-shore areas and their subsequent decomposition can constitute a particularly serious threat to the marine ecosystem [17]. Particular interest may be assigned to the macroalgae or microalgae biomasses as feedstocks to produce energy [18]. Indeed, macroalgae biomass can be used as potential materials for the biogas and bioethanol production, because of their high level of carbohydrates and low contents of lignins [3].
Ulva species, well known as sea lettuce is easily biodegradable and can provide several nutrients and minerals to sustain bacterial growth [19]. This species remains less valued than other algal biomass at industrial scale due to the seasonality of the seaweed availability and the high H2S content in the biogas produced by anaerobic digestion of this macroalgae [20, 21].
Co-digestion can improve AD performance and stability by monitoring the ratio of carbon/nutrient, overcoming deficiencies of some elements, improving the buffering effect, and reducing the effect of some inhibitors compounds [22, 23, 24, 25]. The use of Ulva sp. as co-substrate with the dairy raw effluents may enhance therefore the properties of the feedstock mixture and methane production, thus promoting the activity of methanogen bacteria compared to the sulfate-reducing ones, given that these properties were underlined during the co-digestion of this algae with other substrates [23, 26, 27]. Indeed, the algal biomass has the advantage to be biodegradable and has a high content of organic matter and other macronutrients [28].
The bicarbonate ion is often used in some applications as a buffering effect and can be added in the medium to buffer the pH variation [8, 9]. Furthermore, bacterial activity could also be improved by adding compounds that stimulate their growth [29]. The production of biogas using industrial effluents including additives media to activate methanogens bacteria remains a better way to treat these wastes, while reducing greenhouse gas emissions.
Previous studies have treated the effect of nitrogen, contained in the urea, and the oligo-elements on biogas production from sugarcane vinasse [16], and showed that a stable biogas production is obtained. This result is explained by the sufficient alkalinity of the medium even at higher OLR (9.6 gCOD⋅L−1⋅d−1) and lower HRT (2.5 days), since the addition of essential micronutrients stimulated the methanogenic activity avoiding major VFA accumulation. While the addition of phosphate in the form of KH2PO4 induced volatile fatty acids accumulation [16].
During the anaerobic digestion of raw by-products, it is necessary to add a buffering medium, since the rapid degradation of the soluble compounds causes the pH drop and could compromise the digester stability [30]. Co-digestion of a mixture containing dairy effluents is often responsible of the production of VFA. It is therefore important to test the effect of some additives media to remedy this problem. The aim of this study was to highlight the energetic valorization, using anaerobic digestion, of local wastes generated from dairy industry. The co-digestion of this effluent with the macroalgae Ulva sp. was also performed in order to explore this substrate present in significant quantities in the Algerian coast and responsible of the release of a large amount of H2S by natural fermentation. Additives media including bicarbonate or glucose for methanogen bacteria activation or pH stabilization have been used on the basis of our previous study [31] and the yields of anaerobic digestion have been compared to the co-digestion of DRM by-products and Ulva biomass. Biogas production and volatile fatty acids (VFAs) accumulation have been assessed during this study.
2. Materials and methods
2.1. Substrate and inoculum characterization
The DRM selected in this study are the effluents provided from the washing unit and the expired dairy products, characterized by their high COD. The plant is located at Boudouaou, near of Algiers (Algeria). This plant is ranked amongst the top ten in term of producing and selling of fruit juices in Algeria. The substrate to inoculum ratios (S/I) are taken 14.79 and 22.13 respectively for batch with nutrient medium I and medium II, respectively. The used Ulva sp. was collected from Bordj-El Bahri coastal marine areas, north of Algiers (Algeria). The macroalgae was dried at 70 °C during 24 h and then crushed according to Vergara-Fernández et al. [32]. The dairy raw material samples were collected fresh and stored immediately at 4 °C until subsequent use throughout the experimentation period.
2.2. Analytical methods
The organic matter degradation has been investigated by monitoring COD evolution according to the procedure reported by Wolf and Nordmann [33]. For carbohydrates characterization before and after the AD process, the phenol-sulfuric acid method has been used [34]. Proteins and lipids concentrations are determined respectively by using Lowry et al. [35] and Bligh and Dyer [36] methods. A high performance liquid chromatography (HPLC) (Agilent YL9100) has been used in order to estimate the evolution of the VFA concentrations using a C8 column (5 μm–25 × 0.46). The mobile phase is the sulphuric acid (0.005 M) at the flow rate was fixed to 0.7 mL/min. The column temperature was set at 30 °C and the detection was made spectrophotometrically at a wavelength of 210 nm. The pH, the redox potential, the conductivity and the temperature have been measured using an Inolab multi-parameter 720 device (Prolabmas, MurniSwadaya, Indonesia). Concerning the biogas composition, a coupling between gas chromatography and mass spectrometry (GC/MS) (Perkin Elmer Clarus 600, Perkin Elmer, Waltham, MA, USA) has been used. Percentages of methane and carbon dioxide (% v/v) present in the biogas have been determined by comparing the sample biogas with pure standard gases. The GC has been fitted with an Rtx®-VMS Column (60 m × 250 μm ID) (Restek Corporation, Bellefonte, PA, USA). Helium has been used as the carrier gas at a flow rate of 1 mL/min. The oven temperature has been set to 40 °C with a rate increase of 3 °C/min until the temperature of 180 °C has been reached, then it has been kept at this temperature for 3 min. The injector and detector temperatures have been set to 180 °C.
2.3. Experimental set-up
Experiments have been carried out in a cylindrical stainless steel digester at with a conical bottom (Figure 1). This digester has 15 cm of diameter and 30 cm of height with a total volume of 5 L. This geometry is well suited to perform anaerobic digestion of low-viscous effluent [37]. The mixing was promoted by an impeller of 0.14 m diameter, which was located at a distance about 1/3 above the bottom. This impeller turns at 150 rpm, inducing a radial flow inside the fermenter. The ratio of bioreactor diameter to impeller one was about 1.071. To heat and control the operating temperature during the AD process, the bioreactor was equipped wi th an integrated heating element and a thermostat. On the top of the reactor, several ports have been placed in the tight fitting lid, one serves to monitor the output of biogas, while the other control several parameters through inserted probes such as: pH, temperature, and to collect liquid samples for consequent analysis. The digester is fitted with a purge valve at the bottom of the conical arrangement for an easy draining of the effluent. A stainless steel flange has also been included in the digester in order to prevent gas leakage. The experiments have been carried out for an initial pH of 7.1 which is adjusted by adding NaOH or HCl (respectively at 2 N and 1.6 N).
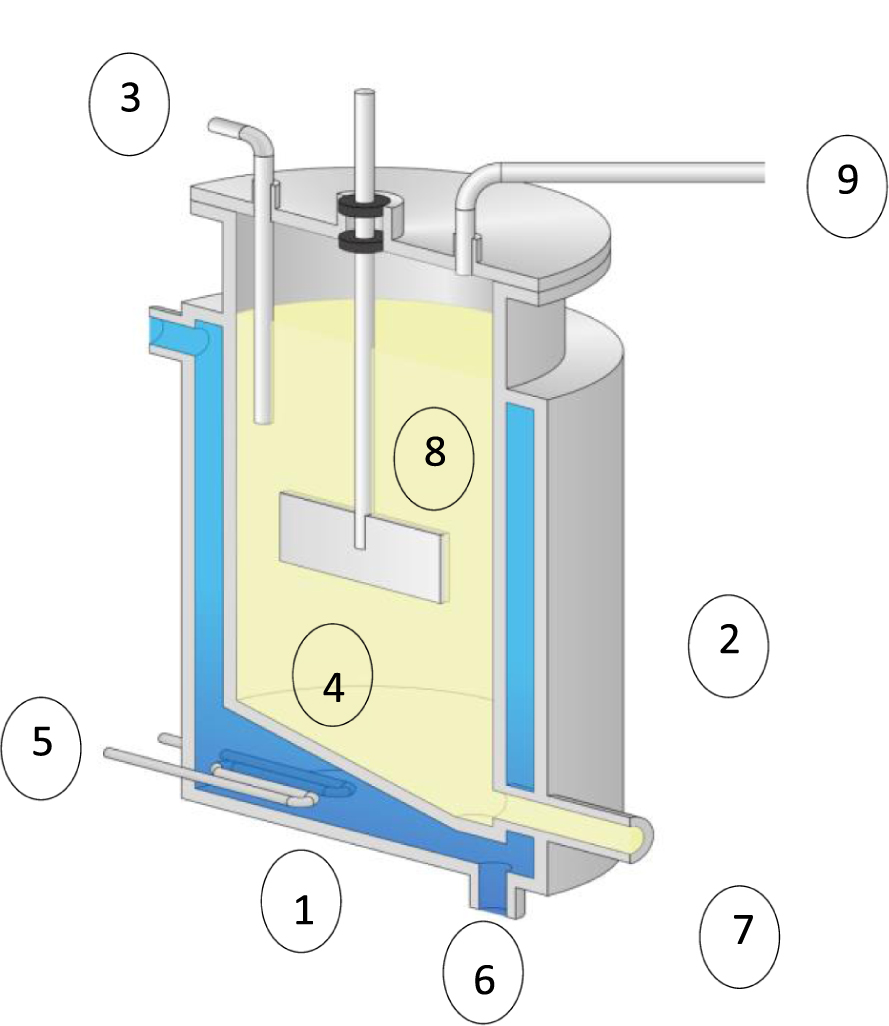
Experimental set-up. (1) bioreactor; (2) jacket; (3) pH control; (4) Rushton turbine; (5) electric heater; (6) drain valve; (7) recycling valve; (8) substrate; (9) gas outlet.
Four batch experiments (batch 1, batch 2, batch 3 and batch 4) were performed. The volume of dairy raw material of each digester was about 4 L. 0.5 L of inoculum contained medium I or medium II were added to the dairy raw material in the case of batches 2, 3 and 4 to activate methanogenic bacteria or to ensure stable operation, the volume choice is based on the C/N ratio and according to Zerrouki et al. [37]. The AD of the batch 1 has been performed without inoculum in order to highlight the contribution of endogenous lactic acid bacteria of the substrate in biogas production. 3 g of Ulva sp. having a COD of about 52 g/L was used as a co-substrate in batch 4. This algae mass choice is based on the corresponding I/S ratio, according to the study of Karray et al. [17], which showed that an optimal yield of biogas production was obtained at this condition.
Samples were taken daily from the sampling port to measure COD, VFA, lipids, protein, carbohydrates and pH and the tests were performed in duplicates. The digester was operated during 35 days.
2.4. Kinetic modeling
2.4.1. Biogas yield
Biogas yield was expressed as a function of the COD equivalent using the following equation:
| (1) |
2.4.2. Biogas production kinetics
Kinetic study of anaerobic digestion of DRM with additive mediums and Ulva sp. macroalgae as a co-substrate was carried out using a nonlinear kinetic model. Kinetic parameters are estimated by fitting the experimental cumulative biogas data with the modified Gompertz model [38]:
| (2) |
Equation (2) has been regarded as a valuable empirical non-linear model to predict data of anaerobic digestion using different types of reactors [39, 40].
2.4.3. Kinetics of substrates biodegradation
The biogas production depends mainly of the amount of COD, presents under carbohydrates, proteins and lipids compounds. Food waste consists of this three main organic compounds, which lead into different biogas yields and bioconversion rates [41]. The removal rate of these substrates can be modelled using the following equation [42]:
| (3) |
2.4.4. Statistical analysis
Regression coefficients (R2) between experimental data and estimated during fermentation process, were estimated. Standard deviations (SD) and coefficients of variation (CV) were calculated for the kinetic parameters for each batch. The Tuckey-Kramer test (p < 0.05) was used for analysis of variance (ANOVA).
3. Results and discussion
3.1. Composition of dried Ulva sp.
Elementary analysis, provided the elementary composition of Ulva sp., is presented in Table 1. The values found revealed a high percentage of carbon and oxygen, this macroalgae contains N, S and microelements such as Cu, Ca, P, K and Fe which are considered as beneficial for the AD. In many previous works, these elements were used as additive elements to improve the AD yield [43]. Thus, the used of this algal biomass as a co-substrate is an important advantage due to its high content of nutrients and its thinner and simpler morphological structure, and a large surface area, with more efficient digestion compared to other macroalgae [44]. Moreover, this biomass offers more ecological characteristics, such as, biodegradability.
Elemental composition of Ulva sp.
| Element | wt% | Element | wt% |
|---|---|---|---|
| C | 48.05 | ||
| N | 5.93 | Cl | 0.09 |
| O | 31.92 | K | 0.09 |
| Na | 0.12 | Ca | 4.84 |
| Si | 0.28 | Fe | 0.19 |
| P | 0.18 | Cu | 0.30 |
| S | 4.73 | ||
Composition of additives media
| Medium I | Medium II | ||
|---|---|---|---|
| Component | Concentration (g⋅L−1) | Component | Concentration (g⋅L−1) |
| NaHCO3 | 1.68 | C6H12O6 | 4.00 |
| NH4Cl | 1.44 | Na2HPO4 | 0.90 |
| MgSO4, 7H2O | 0.28 | MgSO4, 7H2O | 0.20 |
| KH2PO4 | 0.60 | FeCl3 | 0.04 |
| CaCl2, 2H2O | 0.05 | CaCl2, 2H2O | 0.10 |
| Yeast extract | 0.10 | ||
Substrate and inoculum characterization
| Experiment | Batch 1 | Batch 2 | Batch 3 | Batch 4 |
|---|---|---|---|---|
| Dairy raw materials (L) | 4.5 | 4 | 4 | 4 |
| Inoculum (L) | — | 0.5 | 0.5 | 0.5 |
| Ulva sp. macroalgae (g) | — | — | — | 3 |
| Additive medium | — | Nutrient medium I | Nutrient medium II | Nutrient medium I |
| C/N ratio | 40.81 | 27.87 | 41.82 | 22.57 |
| VS (g⋅L−1) | 96.6 ± 6.489 | 99.4 ± 6.677 | 99.5 ± 6.684 | 55.89 ± 3.754 |
| COD (gO 2⋅L−1) | 100 ± 6.717 | 132 ± 8.867 | 136 ± 9.135 | 96 ± 6.448 |
| pH | 6.8 | 7 | 7 | 7 |
| Conductivity (μS⋅cm−1) | 4.28 | 7.44 | 4.93 | 4.59 |
| Carbohydrates (g⋅L−1) | 87.23 ± 5.859 | 91.92 ± 6.175 | 84.41 ± 5.670 | 72.23 ± 4.852 |
| MSS (mg⋅L−1) | 31 ± 2.081 | 7 ± 0.470 | 4 ± 0.268 | 24 ± 1.612 |
| Lipids (g⋅L−1) | 0.085 ± 0.006 | 0.098 ± 0.006 | 0.056 ± 0.004 | 0.034 ± 0.002 |
| Protein (g⋅L−1) | 5.347 ± 0.359 | 5.937 ± 0.398 | 5.285 ± 0.355 | 3.855 ± 0.258 |
| Ammonium Nitrogen (g⋅L−1) | 0.435 ± 0.029 | 0.493 ± 0.033 | 0.839 ± 0.056 | 0.903 ± 0.061 |
| Acetic acid (g⋅L−1) | 0.090 ± 0.006 | 0.018 ± 0.001 | 0.210 ± 0.014 | 0.500 ± 0.034 |
| Propionic acid (g⋅L−1) | 0.006 ± 0.0004 | 0.004 ± 0.003 | 0.116 ± 0.008 | 0.027 ± 0.002 |
| Butyric acid (g⋅L−1) | 0.050 ± 0.003 | 0.018 ± 0.001 | 0.009 ± 0.0006 | 0.035 ± 0.0023 |
COD: Chemical Oxygen Demand; VS: Volatile solid; MSS: Dry matter in suspension.
3.2. Batch experiments
The composition and characteristics of substrates and inocula are given in Tables 2 and 3. Additives media compositions were chosen based on the synthetic salt often used in the sludge activity tests. Glucose was chosen in medium II because it was often used as a co-substrate to support microbial activity [45] and enhances methane production [37]. The iron was often supplied in the form of FeCl3 in nutrient medium to reduce the H2S content in the biogas composition and to further reduce the cost for H2S treatment. AD process required macronutrients that can be supplied in the form of Na2HPO4, MgSO4, CaCl2, they were considered as essential elements of biomass and can be used as buffering agent to keep digester stability [46, 47]. The effluents were selected according to their organic loads and C/N ratios. The initial C/N was about 40.81, 27.87, 41.82 and 22.57, respectively for batches 1, 2, 3 and 4. According to Chandra et al. [48], the optimum C/N ratio is between 20 and 40. The C/N ratio in algal biomass is low, it is about 10 which leads to ammonia accumulation. To overcome this accumulation, addition of organic materials at high COD rate is often required in order to enhance the digestion process. The initial chemical organic load was about 100, 132, 136 and 96 gO 2⋅L−1 respectively for batch 1, batch 2, batch 3 and batch 4. The analysed samples are characterized by a high COD load which corresponds to the values reported by Escalante et al. [49]. The chemical composition of effluents is characterized by high carbohydrates and proteins and low lipids contents making them more suitable for methane production.
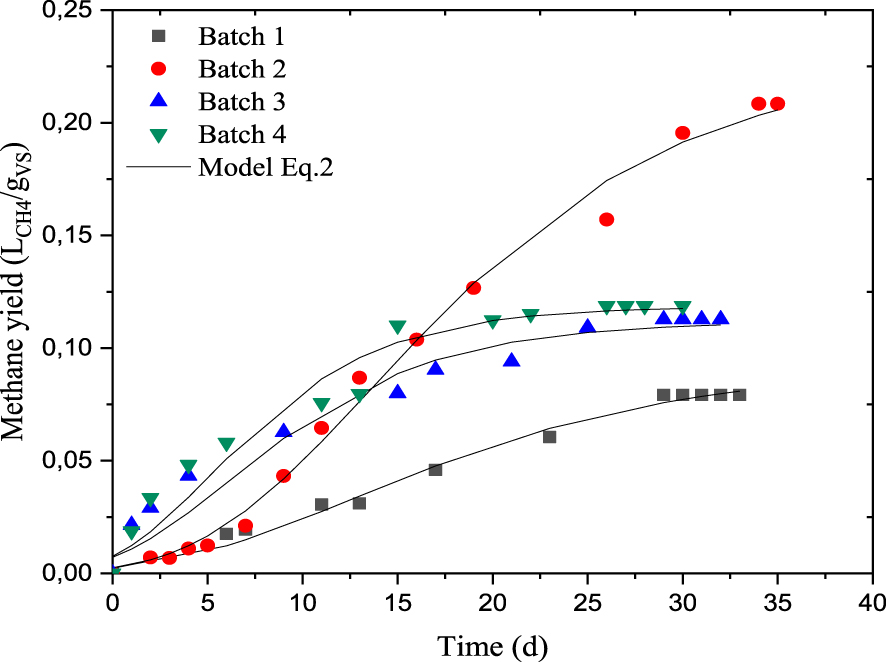
Methane yield production in batch reactors (T = 35 °C, pH = 7).
Kinetic model parameters of modified Gompertz model
| Batch 1 | Batch 2 | Batch 3 | Batch 4 | |
|---|---|---|---|---|
| Methane yield (LCH 4∕gVS) | 0.0792 | 0.208 | 0.112 | 0.118 |
| P (LCH 4∕gVS) | 0.091 | 0.227 | 0.112 | 0.118 |
| Rmax (LCH 4∕gVS⋅d) | 0.0034 | 0.0091 | 0.0068 | 0.0086 |
| 𝜆 (d) | 3.057 | 4.625 | 0.075 | 0.063 |
| R2 | 0.993 | 0.995 | 0.974 | 0.973 |
| RMSE | 0.0027 | 0.0052 | 0.0077 | 0.0082 |
3.3. Methane production analysis under the different substrates mixing
The experimental profiles of the cumulative biogas volume for batch reactors performed under mesophilic digestion (35 °C) are depicted in Figure 2. It can be seen that the cumulative methane tends towards a maximum value of 0.208 LCH4∕gVS in the case of batch 2, which shows the high potential of this complex substrate for methane production with longer production period. While, the cumulative biogas production exhibits an asymptotical profile for batches 1, 3 and 4. Table 4a summarizes the kinetic parameters of the modified Gompertz model. The maximum methane production rate (Rm) was more important in batch 2 than the other batches, it was about 0.0091 LCH4∕gVS⋅d, while it was only about 0.0034, 0.0068 and 0.0086 LCH4∕(gVS⋅d) in batches 1, 3 and 4, respectively. This could be explained by the high methane yield after 15 days of AD with a high slope compared to the other batches (Figure 2). This result allows to expect a high methane productivity during the co-digestion of DRM and Ulva sp. biomass. Modelled lag phase duration, 𝜆, was significantly reduced in batches 3 and 4, the values obtained were 0.075 d and 0.063 d, respectively, which indicates that the methane production was beginning immediately on the first day of digestion. Thus, the addition of nutrient medium I with Ulva sp. biomass (batch 4) or the use of nutrient medium II (batch 3) shows a low lag phase, while this parameter is higher in batches 1 and 2 (3.057 d and 4.625 d, respectively). In this case, the undissolved compounds such as proteins and fats take more time to decay into monomers [50]. In this study, the hydrolysis constant remains low compared to other studies which used the dairy by-products. It was in the range of 0.0009–0.104 d−1 for all batches (Table 4b). Indeed, the value of 0.084 d−1 was previously reported by Kafle and Chen [39] for dairy manure, while the range of 0.36–0.55 d−1 has been previously reported by Mainardis et al. [51] for some cheese whey varieties. It should be noted that a good agreement is observed between the methane yield reached (LCH 4∕gVS) and the predicted data using (2), with correlation coefficients R2 varied from 0.973 to 0.995 and the RMSE value fell within the range of 0.0027–0.0082.
Kinetic model parameters of first order model
| Batch 1 | Batch 2 | Batch 3 | Batch 4 | |
|---|---|---|---|---|
| k (d−1) | 0.0075 | 0.0009 | 0.0894 | 0.1040 |
| R2 | 0.993 | 0.980 | 0.979 | 0.975 |
| RMSE | 0.0024 | 0.0106 | 0.0053 | 0.0064 |
The specific methane yields gradually increasing and then levelling off at 0.208 LCH 4∕gVS, 0.112 LCH 4∕gVS, 0.118 LCH 4∕gVS and 0.079 LCH 4∕gVS, for batches 2, 3, 4 and 1, respectively after 35 days of AD. Macroalgae added in batch 4 allowed to bring essential elements and to create a synergistic effect by alleviating the imbalance of nutrients. However, lipids accumulation in batch 4 causes a slower hydrolysis rate, resulting in a lower methane yield compared to batch 2 and confirms results obtained by Rodolfi et al. [52]. The methane production is more meaningful in batch 2 than the other batches, certainly due to the presence of inorganic additive (medium I) which ensures an appropriate nutrient balance between C and N, in addition to the digester stability. This substrate has a good biodegradability of the complex organic matter without any inhibitory effect upon the biomass. These findings were consistent with BMP values of the literature for dairy wastes and Ulva sp. It was about
Compared to the literature, the methane production from batch 2 can be considered as a promising way forward regarding the use of combined treatment of dairy residues in AD. Lhanafi et al. [53] previously reported a maximum methane yield of about 0.093 LCH 4∕gVS. These authors added a mixture of dairy residues into inoculum which included diluted sludge of methanogenic bacteria in addition to formic, propionic and lactic acids. Some authors have underlined a methane yield of 0.197 LCH 4∕gVS from anaerobic digestion of manufacturing milk. Their yield has been improved on the basis of mixing ratios performed between food waste leachate from dairy factory and wastewater treatment sludge, the methane produced varied from 0.118 to 0.223 LCH 4∕gVS [54]. Low methane yield has been recorded from cheese whey wastewater effluents; it was only about 0.065 LCH 4∕gVS [55]. Significant methane yields have been reported by Mainardis et al. [51] which ranged from 0.353 to 0.437 NL CH4∕gVS from a variety a cheese whey. The difference may be due to the operating conditions and the composition of substrate. Indeed, these authors have mixed the sludge with dairy substrate at different ratios and the obtained mixtures are characterized by low organic content (50.10–78.73 g/L) compared to our study (96–136 g/L). Besides that, no-pretreatment of substrate has been performed in this work. Moreover, the co-digestion of the mixture of cow dung and Ulva sp. led to methane yield of 0.195 LCH 4∕gVS at Ulva sp.: cow dung ratio of 1:1 [56] which is higher to the methane yield found in this study at Ulva sp. DRM ratio of 1/10.
In addition, it was also known that the AD of this macroalgae specie gave low potential methane (0.097 L∕gVS according to Vanegas and Bartlett [57]). This low biogas yield was due to the low VS content and a late methanogenic phase [58]. However, in this study, it was shown that it is possible to valorize this type of waste, which invades the Algerian coasts, by anaerobic digestion. Even if the biogas yield was lower in the batch containing this macroalgae, it is observed that the quality of this biogas is better with higher methane content.
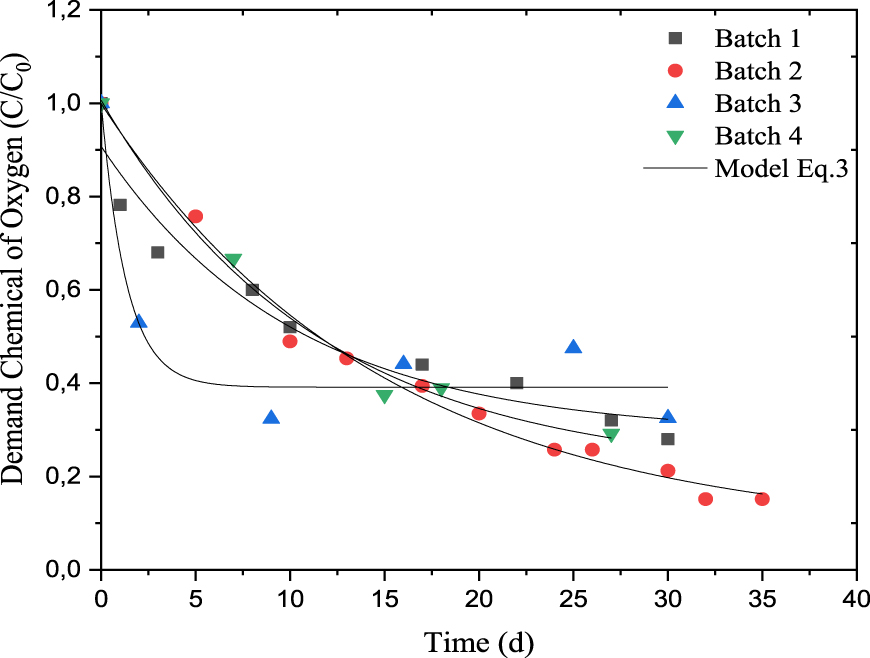
Comparison of modelled (according to (3)) and experimental chemical oxygen demand for batch reactors (T = 35 °C, pH = 7).
The co-digestion of DRM with Ulva sp. macroalgae overcomes this problem of valorization of the algae effluent present in large quantity on the Mediterranean coast, despite the low initial COD value of the mixture (96 gO 2⋅L−1) compared to the DRM where no inoculum was added (100 gO 2⋅L−1 at batch 1). Note that in the anaerobic digestibility process of DRM, the lactic and non-lactic acid bacteria play an important role in organic compounds degradation to methanogenic substrates [59]. Then, the most biodegradable organic fraction can easily be converted into biogas. This case is observed in batch 1 where no inoculum was added. The biogas is produced only from the endogenous flora, mainly lactic acid bacteria. The dimensionless number of COD (C∕C0) of batches 1, 2, 3 and 4, were 0.28, 0.15, 0.475 and 0.291, respectively after 30, 30, 30 and 26 days of AD (Figure 3) with more regular kinetic of degradation for batches 2 and 4 (containing nutrient medium I) than the batch 3 (with nutrient medium II). The addition of organic compounds in form of glucose constitutes more carbon source for anaerobic digestion while the addition of bicarbonate as a pH buffer medium, in one side, and the C/N ratio, close to the mid-value of the recommended interval (27.87), in the other side, enhance both methane production and COD removal.
In this last case, rapid degradation kinetics were observed for the first 10 days followed by a stagnation of the C∕C0 ratio, probably due to the acidification of the medium due to the production of volatile fatty acid. The comparison between the experimental and the predicted data using (3) showed the good fitting of data with correlation coefficients R2 higher than 0.902 and the RMSE value within the range of 0.026–0.079 (Table 5). The models tested were well suited to describe the methane production behavior and organic matter content degradation in batch fermentations.
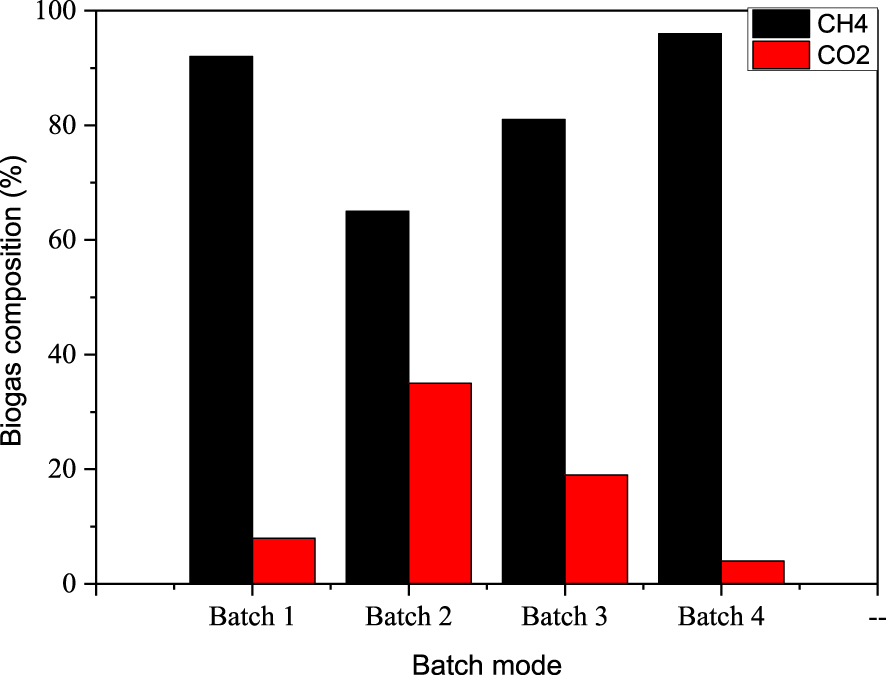
Effect of nutrient media on biogas composition.
Kinetic parameters of COD
| Batch 1 | Batch 2 | Batch 3 | Batch 4 | |
|---|---|---|---|---|
| a | 0.297 | 0.142 | 0.391 | 0.230 |
| b | 0.640 | 0.862 | 0.609 | 0.775 |
| kh | 0.004 | 0.003 | 0.031 | 0.004 |
| R2 | 0.921 | 0.989 | 0.902 | 0.988 |
| RMSE | 0.066 | 0.026 | 0.079 | 0.032 |
3.4. Biogas composition
The biogas composition, given in Figure 4 shows high methane contents for all batches. It was about 92, 65, 81 and 96% for batches 1, 2, 3 and 4, respectively. The batch 4 which contains Ulva sp. macroalgae provides better methane content (about 96%) compared to the other ones.
It is noted that, under investigated mediums, the hydrogen sulphide in the biogas produced was about 0.67, 1.92, 1.82 and 1.00% in the case of batch 1, batch 2, batch 3 and Batch 4, respectively. There is a direct relationship between the inoculums, the methane production and the presence of organic and inorganic compounds. The variation in the methane content can be explained by the presence of long chain fatty acid which was resulted from the dairy fat conversion. as a consequence, the decrease in physiological activity (ATP concentration), in parallel to the decrease of methanogenic bacteria activity [60]. The addition of mineral additive, under the form of bicarbonate, ensures better methanogenic bacteria activation and the stabilization of the AD process. Moreover, the anaerobic co-digestion of dairy raw materials (DRM) with macroalgae (Ulva sp.) using the bicarbonate as a buffering medium has been selected to avoid ammonium accumulation and to enhance methane content.
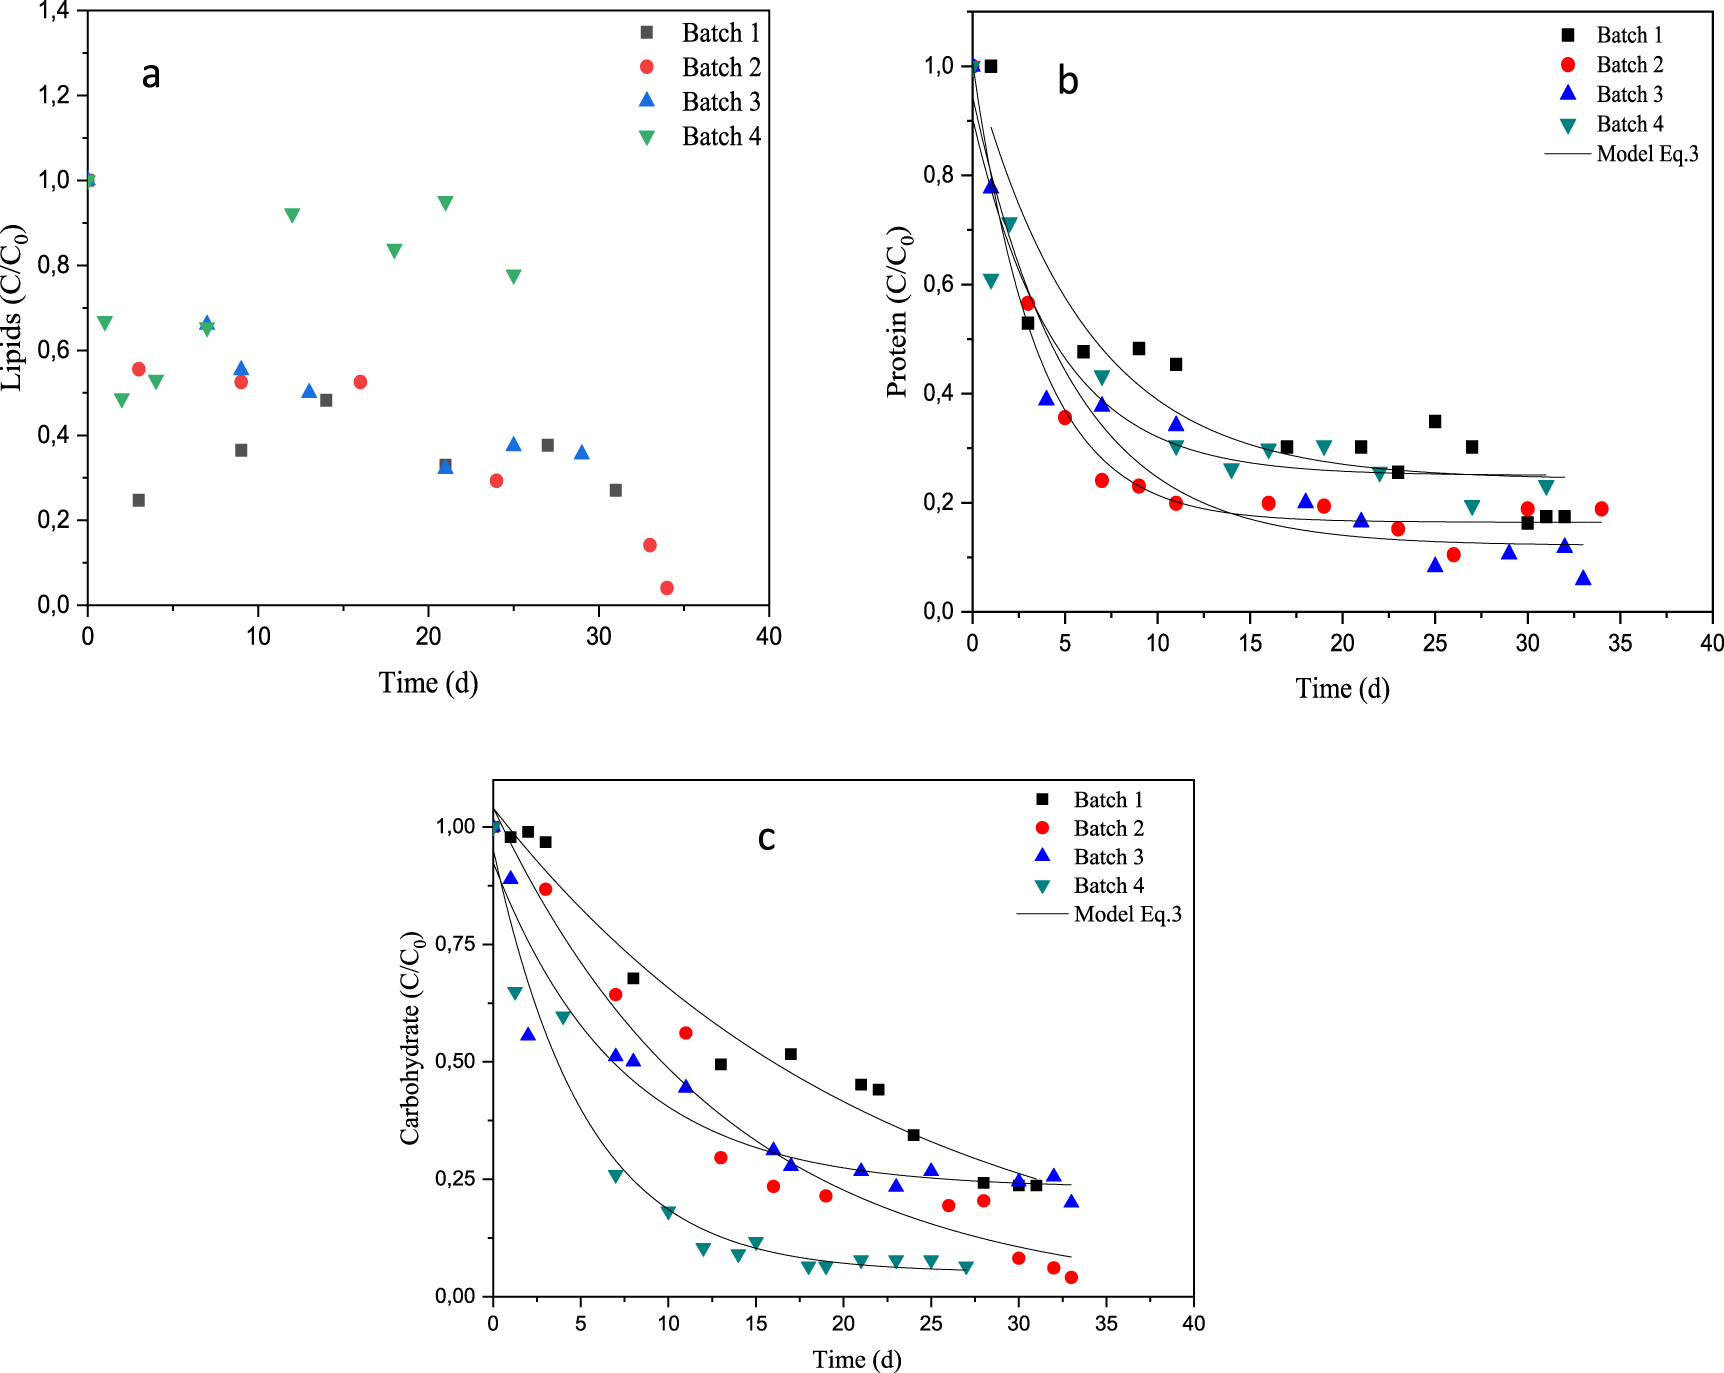
Evolution of organic material degradation during anaerobic digestion of dairy raw materials: (a) lipids, (b) protein and (c) carbohydrate.
3.5. Anaerobic digestion of lipid compounds
The DRM used in this study exhibits relatively high concentration of lipids (about 0.085 g⋅L−1). In Figure 5a, which depicts the dimensionless lipids concentration over time, it can be seen that the lipids content decreases from 1 until the value of 0.325 in batch 1. Addition of synthetic mediums to dairy raw materials improved the lipids uptake, which drops from 1 to 0.351 and 0.158 for batches 3 and 2, respectively. In such case, the conversion of lipids into fatty acids became easier and fast till the near total uptake. The lipid degradation of DRM was lower in the case of batch 2 compared to the batch 3, with an average degradation rate of about 65% and 84.2%, respectively. This result can be related to the effect of inorganic additive (based on bicarbonate) or organic additive (based on glucose) into the medium on the anaerobic digestibility of DRM, which in turn improved both lipids uptake and biogas production. It is noted that there was competition between bacterial degradation of lipids and proteins. It is also noted that the milk fat has an inhibiting effect on the activity of methanogenic bacteria [45]. For Batch 4, the analysis of lipids degradation distinguished two phases (Figure 5). The first phase is between 1 and 0.573 and the second one from 0.573 to 0.855 where the lipids increase after 26 d of anaerobic digestion.
This is due to the accumulation of intermediate compounds such as the long chain fatty acids (LCFAs) and the volatile fatty acids (VFAs) [61], that affect the lipid degradation process, this then represents a limiting mass transfer between substrate and microbial cells. This mass transfer depends to difficulty in transport and transform from liquid phase to solid and biological degradation of LCFAs [62]. Adsorption onto cell wall is restricted by bacteria coated LCFAs thus decrease the substrate degradation and yield of biogas [63].
3.6. Anaerobic digestion of protein compounds
The protein content is one of the most important criteria for the milk producers especially for casein and nitrogen sources in general. Figure 5b gives the protein concentration evolution for a series of batch reactors. It can be seen that at the beginning, the protein levels dropped quickly for the proposed series. This means that the lactic and non-lactic acid bacteria converted both the proteins and the lipids compounds, but the conversion rate was more important for proteins. The reaction rate constants reached values of 0.008, 0.012, 0.009 and 0.026 h−1, in the case of batches 1, 2, 3 and 4, respectively.
It can be seen also that there is a good fit between the experimental and modelled curves for the proteins uptake in the case of batches 2 and 3, where the R2 and RMSE values were respectively 0.985 and 0.032 for the first case and 0.943 and 0.079 for the second one (Table 6). However, for batches 1 and 4, the R2 values showed that the fitted data by the first order kinetic model for proteins uptake are deviated from the experimental ones (0.818 and 0.823, respectively).
Kinetic parameters of protein
| Batch 1 | Batch 2 | Batch 3 | Batch 4 | |
|---|---|---|---|---|
| a | 0.265 | 0.161 | 0.141 | 0.292 |
| b | 0.751 | 0.845 | 0.813 | 0.678 |
| k | 0.008 | 0.012 | 0.009 | 0.026 |
| R2 | 0.818 | 0.985 | 0.943 | 0.823 |
| RMSE | 0.096 | 0.032 | 0.073 | 0.111 |
Similar findings have been previously reported by [60]. In such case, the dimensionless protein concentrations decreased from 1 until the average values of 0.287, 0.183 and 0.122 after 30, 23 and 25 days of digestion in batches 1, 2 and 3 respectively.
This decrease means that the nitrogen was used as a nutrient by methanogens and lactic acid bacteria, and also converted into ammonia as previously pointed out by [64]. It has been found that a good rate of proteins assimilation by methanogens bacteria has been occurred in batches 2 and 3, particularly, when the sodium bicarbonate has been added to the medium, probably due to the effect of this compound on the pH of the fermentation medium. Indeed, according to Browne and Murphy [65], the methane production reduction can be induced by the increase of the total ammonia nitrogen rate in the digester at high VS organic loads. Thus, sodium bicarbonate addition could moderate this effect. Note that the medium II contains glucose that constitutes other carbon source, easily biodegradable, and can explain the utilization of proteins and lipids rather than carbohydrates in the AD. In the case of batch 4, the dimensionless protein concentration goes down to 0.264 after 22 days of fermentation with uptake of 74% and a maximum reaction rate constant of 0.026 h−1. This behavior is certainly due to the complex composition of DRM with Ulva sp. which contains some types of proteins, carbohydrates and lipids with different biodegradation behavior. Indeed, it is known that carbohydrates are more biodegradable in anaerobic medium than proteins and lipids, which take a longer time for hydrolysis [66]. Moreover, it has been found an increase of the ammonia concentration to the values of 127.46 mg⋅L−1 and 119.86 mg⋅L−1 in batch 4 and batch 2, respectively which remain below the value 200 mg⋅L−1 previously reported by Elbeshbishy and Nakhla [67].
3.7. Anaerobic digestion of carbohydrate compounds
Comparison of modelled and experimental carbohydrates digestion results for a series of batch reactors is given in Figure 5c. It shows that the carbohydrates uptake occurred gradually in the same way for a series of batch reactors but at different rates. The uptake of the proteins and the carbohydrates was performed exponentially and it seemed more pronounced and extremely fast in the case of proteins. The analysis of the reaction rate constant (k) confirms this remark (Table 7). Indeed, for all batches, the constants kinetic, k, of carbohydrates degradation showed lower values compared to those of proteins (0.008, 0.012, 0.009, 0.026 h−1 against to 0.002, 0.003, 0.006 and 0.011 h−1 in batches 1, 2, 3 and 4, respectively for proteins and carbohydrates). This result can be ascribed to the carbohydrates content in the batch reactors.
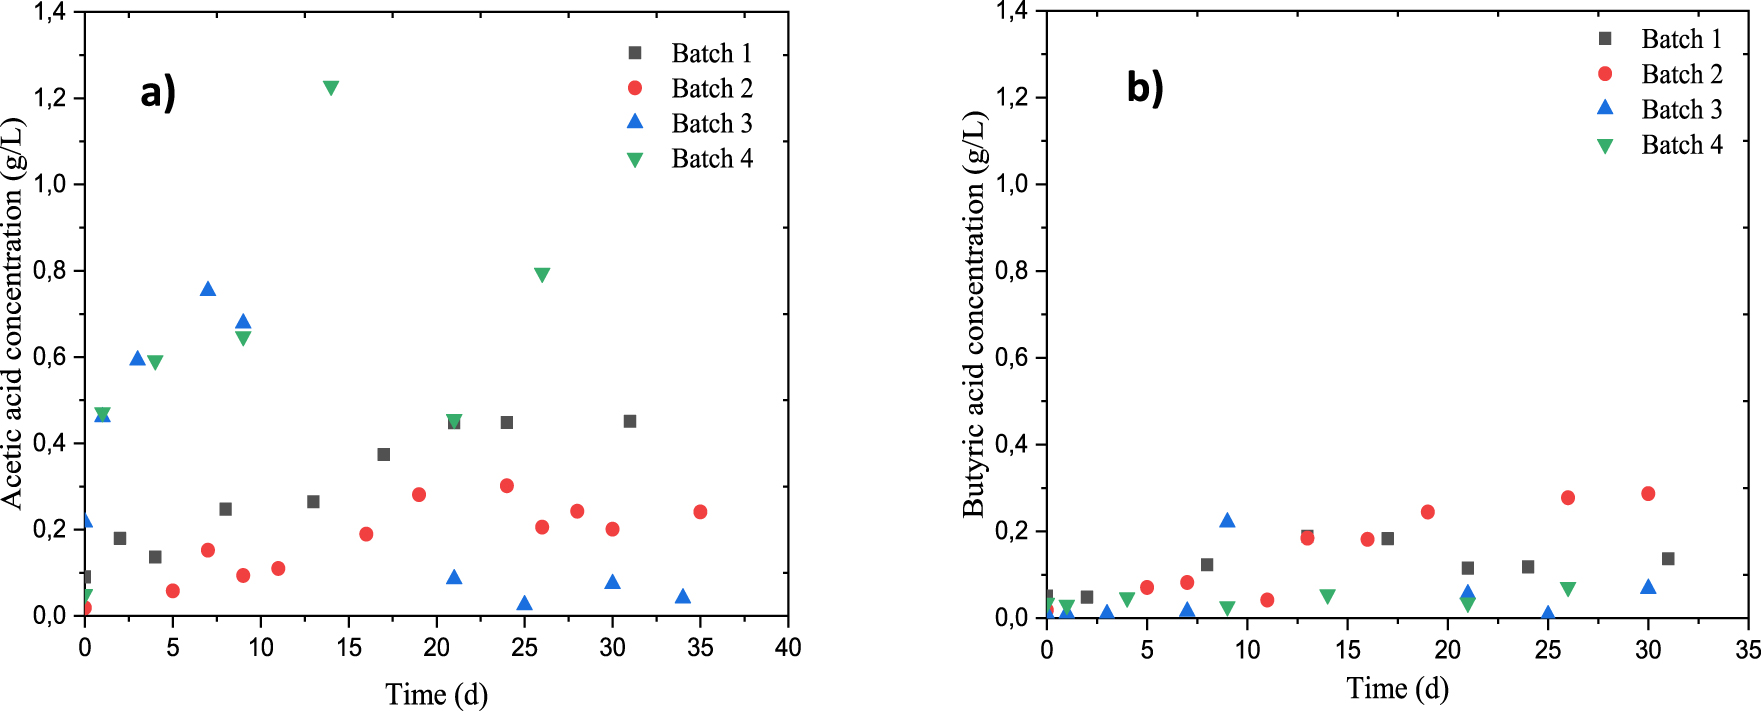
Evolution of acids production during anaerobic digestion of dairy raw materials. (a) Acetic concentration, (b) butyric concentration.
Kinetic parameters of carbohydrates
| Batch 1 | Batch 2 | Batch 3 | Batch4 | |
|---|---|---|---|---|
| a | 0.034 | 0 | 0.231 | 0.075 |
| b | 0.994 | 1.000 | 0.694 | 0.877 |
| k | 0.002 | 0.003 | 0.006 | 0.011 |
| R2 | 0.965 | 0.962 | 0.917 | 0.985 |
| RMSE | 0.057 | 0.063 | 0.072 | 0.036 |
In all cases, carbohydrates concentration decreases were recorded at the beginning of the digestion, i.e. during the first 6 days. Note that in batch 1, the carbohydrates uptake reached the efficiency of 76%. This value remained the lowest value reached in this study under the investigated conditions (without inoculum). While it was improved in batches 2 and 3 and 4 leading to uptake efficiencies of about 85, 74 and 91%, respectively. The results found indicates that the medium I was well suited to improve biogas production with respect to the carbohydrates, lipids and proteins biodegradation characteristics. Thus, the best biogas production has been reached when using the medium I which has improved the degree of organic load biodegradability, the microbial growth and their capacity of protein, carbohydrates and lipids uptake. Figure 5c also shows a close fit between the modelled and experimental profiles of carbohydrates degradation. Values of R2 and RMSE were 0.965, 0.962, 0.917, 0.985 and 0.057, 0.063, 0.072, 0.036 respectively for batches 1, 2, 3 and 4 (Table 7).
3.8. Volatile fatty acids production
Figures 6 (a, b) give the volatile fatty acids (VFAs) evolution during the digestion of dairy raw materials for a series of batch reactors. It can be seen that the main acids produced during anaerobic digestion of DRM were acetic and butyric acids. Further traces of propionic acids have been detected, although these are no direct products issued from the anaerobic digestibility of DRM. These figures show also that the concentrations of acetic acid are greater than those of butyric one over the 35 days of AD, probably due to the activity and/or the concentration of lactic acid bacteria which could not stimulate total methane production, but promote the rate of methane production at the beginning of the AD [68]. In the case of batch 4, an unexpected peak of acetic acids (1.228 g⋅L−1) was observed after 15 days of AD which results in a stabilization of the production of biogas from this same day (Figure 2). This peak may be assigned to the accumulation of hydrolysis products. The use of inorganic additive (based on bicarbonate) on the anaerobic digestibility of DRM plays an important role regarding the volatile fatty acids production and the digester stability. However, compared to the batch 2, this peak certainly has a detrimental effect on the microbial activity which would explain the yield of AD obtained for the batch 4. The same observation could be made for batch 3 with acetic acid concentration peak observed on the first day of AD. After that, concentrations of this acid varied from 0.754 to 0.041 g⋅L−1, while those of the butyric acid increased until the value of 0.221 g⋅L−1. As a consequence, the stabilization of the biogas production form 15 days of the AD. This may be due to a direct relationship between the inoculum, the methane production rate and the presence of fatty volatile acids [69].
For batch 2, the acetic acid concentration remains constant at about 2 g/L from 15 days which would explain the biogas yield obtained with this batch, even if the butyric acid concentration continues to increase (about 0.287 g⋅L−1). This can be due to the conversion of lactate from glucose by Butyri bacterium methylotrophicum as previously reported by (Shen et al. [70]). The increase in butyric acid can stimulate methanogens bacteria rather than their inhibition Stronach et al. [10]. Volatile fatty acids are the intermediate coproducts in the biogas production during the anaerobic digestion process, the levels reached are not toxic as long as batch 2 ensures buffering capacity, using additive medium I, to keep the process stability. While, the co-digestion of DRM and Ulva sp. (batch 4) resulted in the accumulation of hydrolysis products, which explains the increase in the concentration of the acetic acid.
Furthermore, for a series of batch reactors a continuous mechanization mode has been suggested to avoid accumulation of volatile acids and keep substrate concentrations constant. The continuous mode can be expected to provide better gas efficiency of the pilot-scale dairy plants.
4. Conclusion
This study has been carried out to evaluate anaerobic co-digestion performance of dairy raw materials (DRM) with macroalgae (Ulva sp.) In addition, the effect of organic additive (based on glucose) and mineral additive (based on bicarbonate) on the anaerobic digestibility of DRM was also evaluated. The dairy raw material containing the nutrient medium I (batch 2) is more suitable to improve biogas production, the highest specific methane yield reached, it was about 0.208 LCH4∕gVS after 35 days. This nutrient medium allows to improve the degree of anaerobic digestibility of DRM, the microbial growth and their capacity of protein, carbohydrates and lipids uptake, it may be a useful pattern to convert food industry streams.
The co-digestion of DRM with Ulva sp. resulted in higher biogas yield compared to DRM only-fed condition and enhances the biogas quality which contains only 0.5 to 2% of hydrogen sulphide. The methane production is more meaningful in batch 2 than the other batches, certainly due to the presence of inorganic additive (medium I) which ensures an appropriate nutrient balance between C and N, in addition to the digester stability. Lipids accumulation in batch 4 causes a slower hydrolysis rate, resulting in a lower methane yield compared to batch 2. Effect of organic and inorganic additives in a series of anaerobic laboratory tests to produce biogas from dairy residues and macroalgal biomass can give a contribution to sustainability and circular economy perspective.
The used models have well described the cumulative methane production and also the kinetic of the removal organic matters (proteins, lipid and carbohydrates). This analysis showed that these three compounds follow a different kinetics according to the composition of the medium and the addition of organic or inorganic media. Furthermore, the continuous mode and the co-digestion of DRM with Ulva sp. by optimizing the I/S ratio can be expected to provide better methane yield.
Nomenclature
| VBiogas | Biogas volume produced during batch experiments (m3). |
| COD | Chemical oxygen demand, gO 2⋅L−1. |
| BP | Cumulative biogas yield during the fermentation |
| P | Cumulate biogas production (N⋅mL) |
| kh | First order kinetic constant (h−1) |
| t | Time (h). |
| Lu | Total amount of biodegradable organics matter (gCOD∕L) |
| MS | Mineral solids |
| R2 | Correlation coefficient |
| T | Temperature (°C) |
| VFA | Volatile fatty acids |
| y(t) | Amount of organic matter at time t |
| a | Constant |
| b | An initial amount of biodegradable organic matter, and k is the reaction rate constant. |
Vous devez vous connecter pour continuer.
S'authentifier