

Version française abrégée
1 Introduction
C'est essentiellement aux naturalistes et aux physico-chimistes du XIXe siècle que nous devons les premières recherches scientifiques sur l'effet de serre [31] et les glaciations [33]. Ces deux aspects du climat peuvent être étudiés séparément mais, comme nous le verrons, ces savants se sont souvent intéressés conjointement à ces deux sujets ainsi qu'à leurs possibles relations.
Au cours du XIXe siècle, la démarche scientifique évolue depuis des savants au savoir encyclopédique comme Horace–Bénédict de Saussure, inventeur et explorateur, jusqu'à des chercheurs spécialisés comme Svante Arrhenius, dont la théorie sur la dissociation des électrolytes en solution aqueuse exercera un rôle déterminant sur le développement de la chimie-physique. Ces travaux lui vaudront le prix Nobel de chimie en 1903.
La curiosité insatiable de ces pionniers s'accompagne de compétences multiples dans des disciplines aussi variées que la physique, la géologie, la chimie, la biologie ou l'astronomie. Ainsi John Tyndall contribuera de façon significative non seulement aux avancées en thermodynamique mais également dans l'étude des glaciers. De même, Louis Agassiz s'illustrera dans les domaines de la paléontologie et de la glaciologie.
Ces savants ne disposent ni de techniques de mesures précises, ni d'informations à grande échelle en météorologie, océanographie et géologie. Mais comme le souligne Joseph Fourier dès 1822 [27], la théorie seule ne peut suffire dans ces domaines, car « l'analyse mathématique […] peut déduire des phénomènes généraux et simples l'expression des lois de la nature ; mais l'application de ces lois à des effets très composés exige une longue suite d'observations exactes. » Ainsi, la compréhension des glaciations de l'ère quaternaire est, à cette époque, à peu près équivalente à celle que nous avons aujourd'hui des fluctuations climatiques du Précambrien. Cependant, les pionniers du XIXe siècle auront souvent des intuitions prophétiques et prémonitoires, bien que les observations à leur disposition soient encore très fragmentaires.
Néanmoins, au cours de la première moitié du XXe siècle, la connaissance des climats anciens progressera peu. Les principaux concepts fondamentaux que nous utilisons aujourd'hui ont été développés au cours du XIXe siècle. Il faudra ainsi attendre les années 1950 pour assister à une véritable révolution des techniques d'investigation permettant enfin d'obtenir des données paléoclimatiques chiffrées et surtout des datations fiables. Ces nouveaux outils, le plus souvent fondés sur des techniques physico-chimiques, permettront de reconstituer l'ampleur et la chronologie des changements climatiques et de les comparer aux prévisions théoriques.
Un autre progrès crucial interviendra aussi dans la deuxième moitié du XXe siècle, avec l'étude de tous les compartiments du système climatique, en particulier le fond des océans et l'intérieur des calottes du Groenland et de l'Antarctique. Ces observations n'étaient pas accessibles aux pionniers héroı̈ques dont nous allons illustrer les contributions dans cet article.
2 Déluge, mammouths et roches moutonnées
Jusqu'à la fin du XVIIIe siècle, la plupart des scientifiques prennent encore comme référence le mythe du Déluge biblique pour expliquer la configuration actuelle de la surface du globe et la formation des roches sédimentaires. Léonard de Vinci (1452–1519) critiqua dès le XVe siècle cette interprétation simpliste, mais ses idées visionnaires ne parvinrent pas à convaincre les naturalistes de son époque. Par commodité et pour ne pas s'éloigner d'une interprétation littérale des textes bibliques, les fossiles d'organismes marins sont généralement reliés à cet événement unique, qui aurait eu lieu voici environ six millénaires. Un exemple illustrant singulièrement cette tendance est l'interprétation qui fut faite d'un fossile découvert à Oeningen, près du lac de Constance. En 1726, le naturaliste Johann Jakob Scheuchzer (1672–1733) veut y voir les restes d'un humain témoin du Déluge et noyé par ses eaux [41] (voir sur la Fig. 1 la gravure de l'Homo diluvii testis). Ce squelette devient même une référence souvent citée comme preuve indubitable de la véracité du récit de la Genèse. Il faudra toutes les compétences en anatomie de Georges Cuvier (1769–1832) pour « désabuser de l'idée que c'était un anthropolithe » et replacer ce fossile dans l'échelle biologique : il s'agit en fait d'une salamandre géante [19].
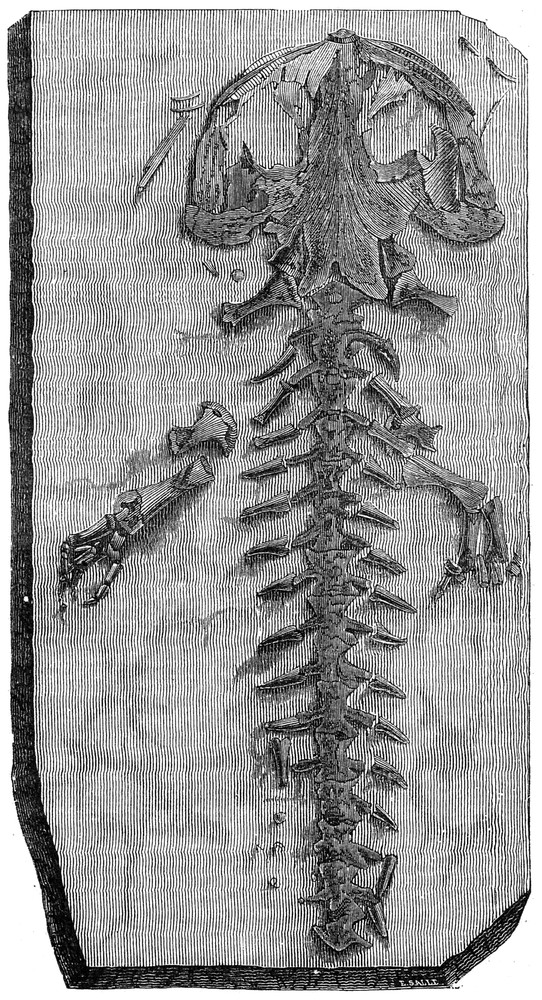
Plate representing the fossil discovered at Oeningen close to Lake Constance and interpreted, by Johann Jakob Scheuchzer [41] in 1726, as the remains of a human witness of the Flood who was drowned by its waters (Homo diluvii testis). About this fossil, the Swiss naturalist writes that “it is indisputable and contains a half, or almost, of the skeleton of a man; that the very substance of the bones, and, what is more, the flesh and some parts even softer than the flesh are imbedded there in the stone; in a word, it is one of the rarest relics we have of this accursed race that was buried under the waters” (based on translation of Cuvier [19]). Scheuchzer is also a theologian and comments on the scene with these verses: “Of an old damned soul deplorable frame, That with your aspect the sinner repents!” (translation into English based on a French version by Figuier [26]).
Gravure représentant le fossile découvert à Oeningen près du Lac de Constance et interprété, en 1726 par Johann Jakob Scheuchzer [41], comme les restes d'un humain témoin du Déluge et noyé par ses eaux (Homo diluvii testis). Au sujet de ce fossile, le naturaliste suisse écrit qu'« il est indubitable et qu'il contient une moitié, ou peu s'en faut, du squelette d'un homme ; que la substance même des os, et, qui plus est, des chairs et des parties encore plus molles que les chairs, y sont incorporées dans la pierre ; en un mot, que c'est une des reliques les plus rares que nous ayons de cette race maudite qui fut ensevelie sous les eaux » (traduction de Cuvier [19]). Scheuchzer est aussi théologien et commente la scène par ces vers lyriques : « D'un vieux damné déplorable charpente, Qu'à ton aspect le pécheur se repente ! » (traduction de Figuier [26]).
Georges Cuvier est surtout connu et célébré pour avoir fondé la paléontologie. Bien que s'opposant farouchement aux théories émergentes de l'évolution, Cuvier cherche néanmoins à expliquer l'extinction des espèces d'animaux disparus dont il découvre les fossiles. Selon lui, ces importants changements sont attribuables à de grandes catastrophes environnementales [19]. Le pluriel revêt ici toute son importance, car Cuvier envisage clairement la multiplicité de tels événements catastrophiques. Il n'attribue donc pas toutes les observations géologiques à un Déluge unique, comme l'affirme la religion. Dans son Discours sur les révolutions de la surface du Globe [19], Cuvier écrit alors que « des êtres vivants sans nombre ont été victimes de ces catastrophes : les uns, habitants de la terre sèche, se sont vus engloutis par des déluges ; les autres qui peuplaient le sein des eaux, ont été mis à sec avec le fond des mers subitement relevé. » À cette époque, les naturalistes s'interrogent sur la présence d'ossements gigantesques dans des horizons relativement récents du Nord de l'Europe et de la Sibérie. Loin des fables de certaines peuplades indigènes qui voyaient là les restes de taupes géantes, Cuvier attribue correctement ces fossiles à des éléphants et des rhinocéros laineux disparus aujourd'hui (voir sur la Fig. 2 la gravure représentant le mammouth exposé au musée de Saint-Pétersbourg au XIXe siècle). Cuvier affirme encore que la dernière grande catastrophe « a laissé encore, dans les pays du Nord, des cadavres de grands quadrupèdes que la glace a saisis, et qui se sont conservés jusqu'à nos jours avec leur peau, leur poil, et leur chair. S'ils n'eussent été gelés aussitôt que tués, la putréfaction les aurait décomposés …. C'est donc le même instant qui a fait périr les animaux, et qui a rendu glacial le pays qu'ils habitaient. Cet événement a été subit, instantané, sans aucune gradation, et ce qui est si clairement démontré pour cette dernière catastrophe ne l'est guère moins pour celles qui l'ont précédée. »
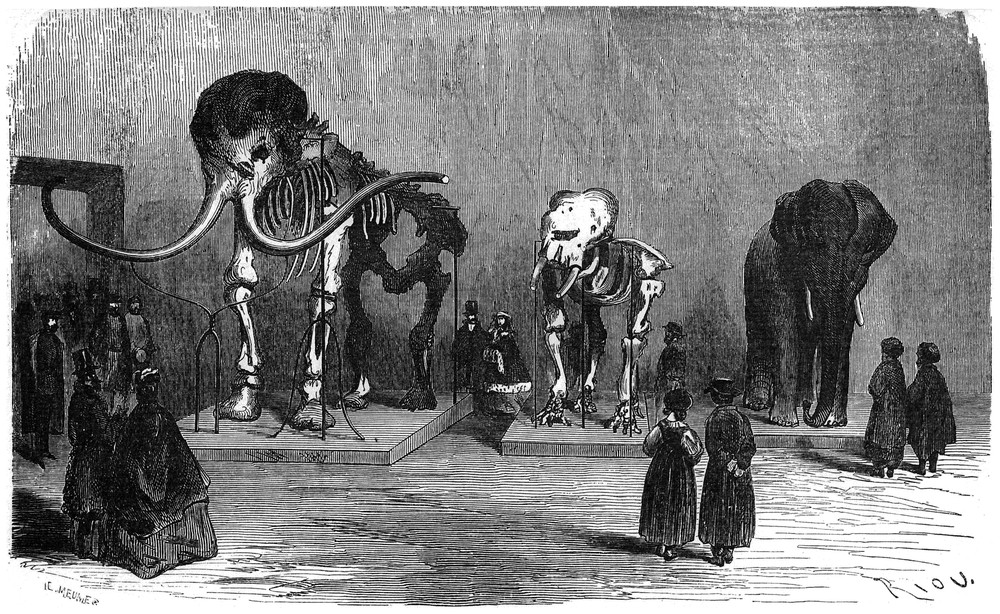
Plate representing the skeleton of the mammoth exhibited at the Museum of St-Petersburg in the 19th century [26].
Gravure représentant le squelette du mammouth exposé au musée de Saint-Pétersbourg au XIXe siècle [26].
La géologie allait également contribuer à susciter les premières réflexions sur les climats anciens. Au XVIIIe siècle, de nombreux naturalistes et voyageurs sont intrigués par la présence dans les larges vallées alpines de nombreux rochers de grande taille, dénommés blocs erratiques, ainsi que de nombreuses buttes constituées de débris rocheux, appelées moraines. Ces objets se tiennent isolés au milieu des plaines et sont souvent de nature très différente du substratum rocheux local (Fig. 3). En particulier, d'énormes blocs de granite se situent au beau milieu de vastes terrains calcaires. Parmi d'autres [8], le genevois Horace-Bénédict de Saussure (1740–1799) s'étonne et ironise, car « les granites ne se forment pas dans la terre comme des truffes, et ne croissent pas comme des sapins sur les roches calcaires ». De Saussure remarque aussi que les blocs erratiques sont situés dans l'axe des vallées alpines, ce qui le conduit à supposer qu'ils ont été charriés par un courant d'une violence et d'une ampleur inouı̈es. Observant que les blocs erratiques sont constitués des mêmes roches que les plus hauts sommets des Alpes, les naturalistes en concluent qu'ils ont été transportés sur des dizaines, voire des centaines de kilomètres. À l'époque, les théories au sujet de ce transport invoquent encore les effets du Déluge, soit directement par l'effet mécanique de l'eau, soit indirectement par le transport des blocs rocheux sur des « radeaux de glace ». Cette théorie formalisée par Charles Lyell (1797–1875) se fonde sur les observations des explorateurs au voisinage des pôles (Figs. 4 et 5). Le géologue écossais écrit alors que « dans les pays situés aux hautes latitudes, comme le Spitzberg, entre 70° et 80° N, les glaciers incorporent de la boue et des roches et descendent jusqu'à la mer, où d'énormes morceaux de glace se mettent à flotter et deviennent des icebergs …. Beaucoup sont ceux qui contiennent de grandes épaisseurs de terre et de roches, dont le poids estimé est de l'ordre de 50 000 à 100 000 tonnes […] Il est évident que dans les lieux où ils vont fondre, cette ‘moraine’ se déposera sur le fond de la mer » [35]. Nous verrons plus loin que d'autres scientifiques réalisent que ces blocs ont été transportés par la glace elle-même, comme on peut l'observer dans les glaciers actuels.
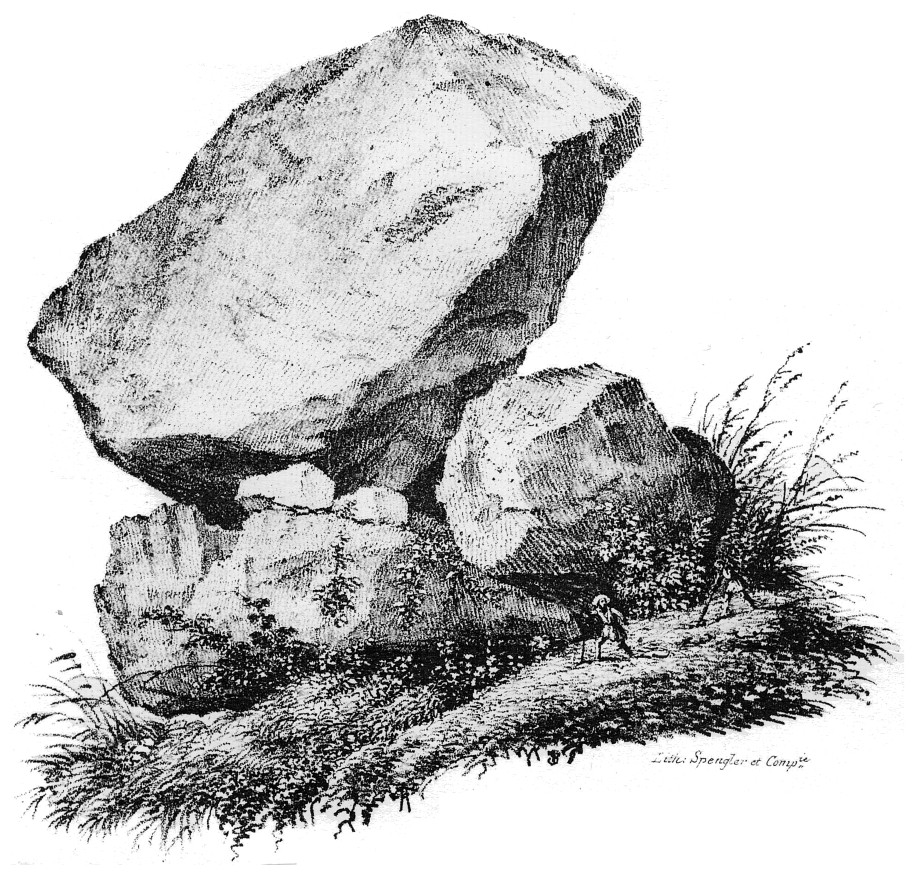
Plate representing an erratic block of a Swiss glacier [15]. In 1841, Jean de Charpentier describes it in these terms: “a very large block, called the ‘Pierre à Dzo’, irregular in shape and polyhedral, is perched on another; but it is only kept in place by a extremely small third block split vertically by the fall of the first; without this support, it would fall down onto the small town of Monthey. It is absolutely impossible that a horizontal shock would have produced similar chance occurrences”, and he further adds that “to claim to explain these facts of detail, these accidents, by hypotheses other than that of diluvian glaciers, is to go well beyond the bounds of probability”.
Gravure représentant un bloc erratique d'un glacier suisse [15]. En 1841 Jean de Charpentier le décrit en ces termes : « un très gros bloc, appelé la « pierre à Dzo », d'une forme irrégulière, polyédrique, est perché sur un autre ; mais il n'y est retenu que par un troisième bloc fort petit et fendu verticalement par la chute du premier ; sans cet appui il se précipiterait sur le bourg de Monthey. Il est absolument impossible qu'un choc horizontal ait produit de pareils accidents. », et il ajoute plus loin que « prétendre expliquer ces faits de détail, ces accidents par d'autres hypothèses que celle des glaciers diluviens, c'est entièrement dépasser les bornes de la probabilité ».
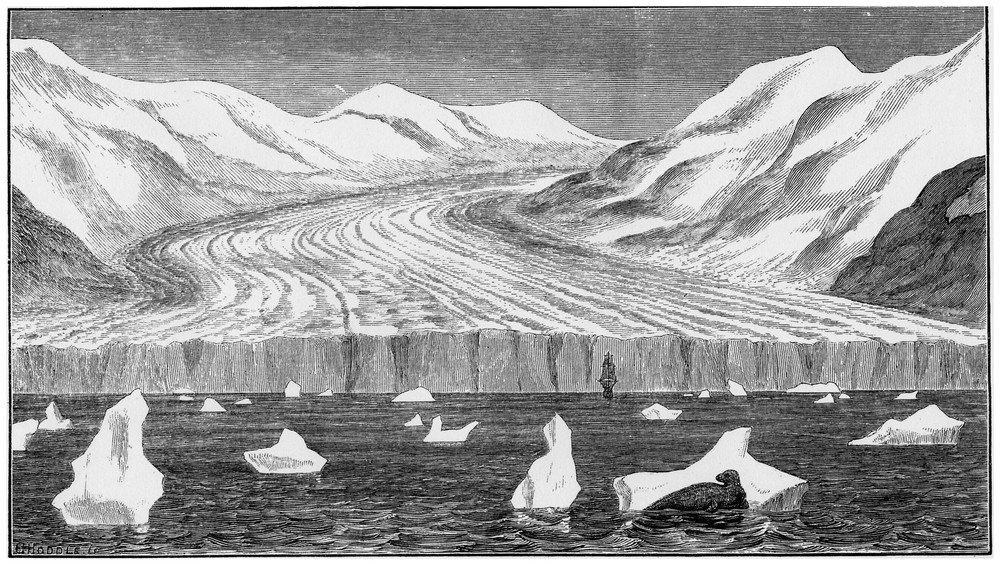
Plate representing a glacier of Greenland descending into the Atlantic and producing icebergs [30].
Gravure représentant un glacier du Groenland qui débouche dans l'Atlantique en produisant des icebergs [30].
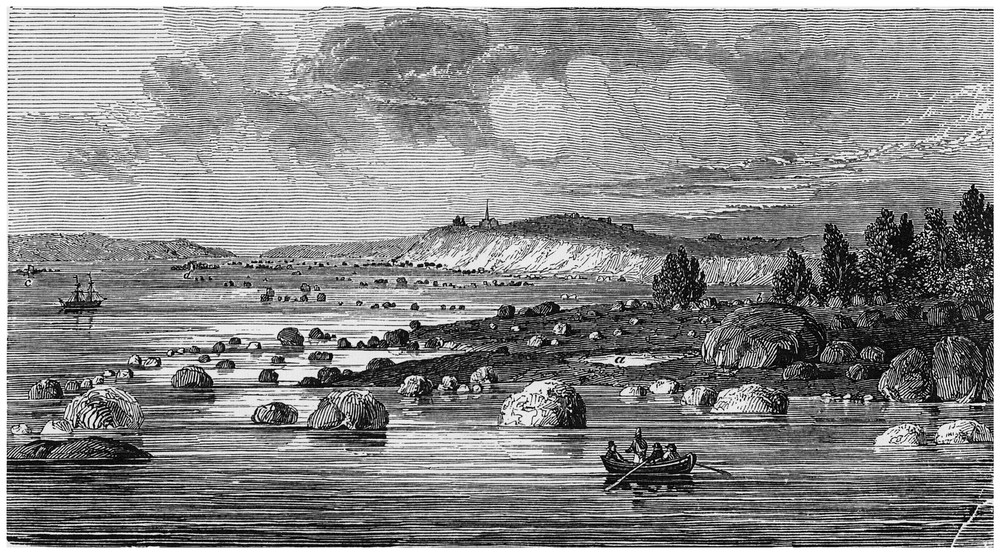
Plate of 1835 representing blocks of moraine transported by the ice on the banks of the St. Lawrence River [35].
Gravure de 1835 représentant des blocs de moraine transportés par la glace sur les bords du fleuve Saint-Laurent [35].
Comme bon nombre de naturalistes de l'époque, de Saussure est avant tout un passionné de ce que nous appelons aujourd'hui l'alpinisme. Ses nombreuses excursions sont relatées dans son célèbre ouvrage Voyages dans les Alpes [40]. Depuis son adolescence, de Saussure est fasciné par le mont Blanc et rêve d'être un jour le premier à gravir son sommet enneigé. En 1767, il en fait le tour par l'Allée blanche, mais ne le gravira qu'en 1787, un an seulement après la toute première ascension réalisée par deux alpinistes chamoniards.
L'intérêt de de Saussure pour la montagne est aussi lié à ses recherches scientifiques, en particulier dans les domaines de la climatologie et de la physique. Il est en effet l'inventeur de « l'hygromètre à cheveu », un appareil qui sera utilisé pendant deux siècles par les météorologues du monde entier. Son autre invention majeure est le capteur solaire. Le but poursuivi dans sa mise au point est l'étude du rayonnement solaire et de ses effets calorifiques à différentes altitudes. Son appareil, qu'il baptise « héliothermomètre », est constitué d'une série de caisses emboı̂tées les unes dans les autres, et dont un côté est vitré. Chaque caisse est isolée thermiquement de la suivante par une couche de liège, et son fond est peint en noir pour minimiser les pertes de chaleur par réflexion. Des thermomètres à mercure, placés sur les verres, permettent de relever visuellement les températures à l'intérieur des différentes caisses emboı̂tées (Fig. 6). En essayant plusieurs configurations quant au nombre et à la géométrie des boı̂tes (planes ou hémisphériques), de Saussure montre que son « héliothermomètre » peut avoir des applications pratiques, par exemple pour faire bouillir de l'eau ou même cuire des aliments. À ce titre, l'héliothermomètre est réellement l'ancêtre du panneau solaire.
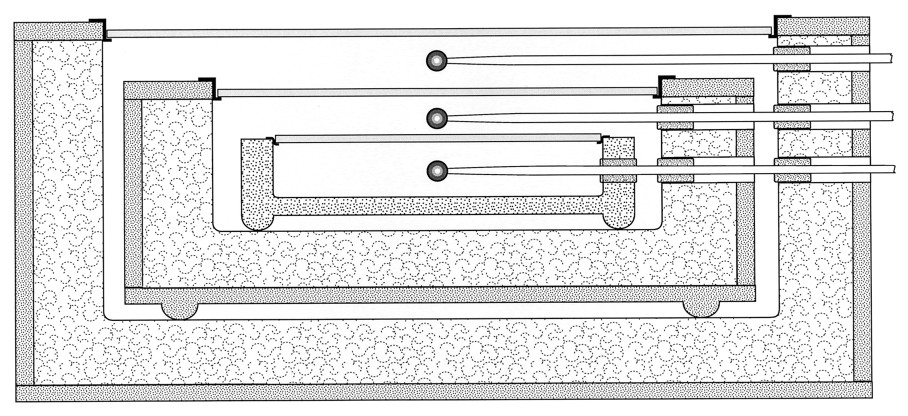
Plate representing the heliothermometer of Horace–Bénédict de Saussure. This apparatus consists of several boxes encased one inside another, and whose sides are glazed. Each case is isolated thermally from its neighbour by cork and its bottom is painted black to minimize heat losses by reflection. Mercury thermometers, placed on the glass windows, make it possible to read the temperatures inside the various encased boxes.
Gravure représentant l'héliothermomètre d'Horace–Bénédict de Saussure. Cet appareil est constitué de plusieurs caisses emboı̂tées les unes dans les autres et dont un côté est vitré. Chaque caisse est isolée thermiquement de la suivante par du liège et son fond est peint en noir pour minimiser les pertes de chaleur par réflexion. Des thermomètres à mercure, placés sur les verres, permettent de relever visuellement les températures à l'intérieur des différentes caisses emboı̂tées.
Grâce à cet ingénieux dispositif, de Saussure prouve aussi que, contrairement à ce que certains pensent à l'époque, la chaleur ne peut s'accumuler indéfiniment, mais qu'un équilibre se crée entre la captation du rayonnement solaire et les déperditions thermiques. En transportant son invention au sommet du mont Blanc, de Saussure cherche à montrer expérimentalement que l'intensité du rayonnement solaire ne dépend pas de l'altitude, et qu'en particulier, la température intérieure du capteur ne varie pas directement avec la température extérieure. Ce n'est qu'au siècle suivant que les observations du naturaliste genevois vont être formalisées par les lois physiques régissant la diffusion de la chaleur et les propriétés du corps noir.
3 Soleil, chaleur obscure et bleu du ciel
Le concept scientifique d'effet de serre a été introduit par le physicien français Joseph Fourier (1786–1830). En 1824, il publie ses Remarques générales sur les températures du globe terrestre et des espaces planétaires [28], où il expose l'idée selon laquelle l'enveloppe atmosphérique du Globe se comporterait comme le vitrage d'une serre. À propos de l'« héliothermomètre » décrit précédemment, Fourier écrit que « la température peut être augmentée par l'interposition de l'atmosphère, parce que la chaleur trouve moins d'obstacle pour pénétrer l'air, étant à l'état de lumière, qu'elle n'en trouve pour repasser dans l'air lorsqu'elle est convertie en chaleur obscure ».
Grâce à ses travaux théoriques sur la diffusion de la chaleur, Joseph Fourier comprend remarquablement bien le rôle des enveloppes fluides de notre planète dans les transferts de chaleur à grande échelle. Il affirme alors que la Terre plongée dans la « température froide du ciel planétaire […] est échauffée par les rayons solaires dont l'inégale distribution produit la diversité des climats », que « tous les effets terrestres de la chaleur du soleil sont modifiés par l'interposition de l'atmosphère et la présence de l'océan. Les grands mouvements de ces fluides rendent la distribution des températures plus uniforme », que « dans l'Océan et les lacs, les molécules les plus froides, ou plutôt celles dont la densité est la plus grande, se dirigent continuellement vers les régions inférieures, et les mouvements de la chaleur dus à cette cause sont beaucoup plus rapides que ceux qui s'accomplissent dans les masses solides en vertu de la faculté conductrice » [28].
Dans les années 1820–1830, le physicien français Claude Pouillet (1790–1868) effectue des recherches sur la propagation du rayonnement solaire [38,39]. À l'aide d'un « pyrhéliomètre » de sa conception, Pouillet réalise les premières mesures du flux de chaleur générée par les rayons du Soleil. Cet appareil est constitué d'un thermomètre qui mesure le changement de température d'un grand réservoir d'eau dont la face supérieure plane, orientée perpendiculairement aux rayons du Soleil, est peinte en noir (Fig. 7). Après un temps donné, la différence de température obtenue lors du réchauffement permet de calculer le flux de chaleur reçu, qu'il évalue en connaissant la capacité calorifique de l'eau [39]. Dans une approche empirique, Pouillet détermine que ce réchauffement serait le produit de deux paramètres : d'une part, de « la constante solaire, ou celle qui contient, comme élément essentiel, la puissance calorifique constante du Soleil » et, d'autre part, de la « constante atmosphérique, ou celle qui contient, comme élément essentiel, le pouvoir de transmission variable dont se trouve douée l'atmosphère pour laisser arriver jusqu'à la surface de la Terre des proportions plus ou moins grandes de la chaleur solaire incidente. » Cette deuxième constante est portée à la puissance d'un coefficient géométrique qui tient compte de l'épaisseur atmosphérique traversée pendant la durée de l'expérience réalisée à l'aide du pyrhéliomètre. Dans ses calculs, Pouillet sous-estime en fait la valeur de sa « constante atmosphérique », ainsi que l'ampleur des réflexions lors du trajet incident (c'est-à-dire l'albedo). En conséquence, la « constante solaire » obtenue par Pouillet n'est que la moitié de la valeur réelle, ce qui le conduit à obtenir une température relativement basse pour la surface du Soleil (environ 1800 °C). Un demi-siècle plus tard, cette valeur sera corrigée et plus que doublée par Josef Stefan (1835–1893). En 1879, c'est à ce professeur de physique de l'Université de Vienne que l'on doit la démonstration empirique, mais correcte, que l'énergie du rayonnement total d'un corps noir est proportionnel à la puissance quatrième de sa température au-dessus du zéro absolu.
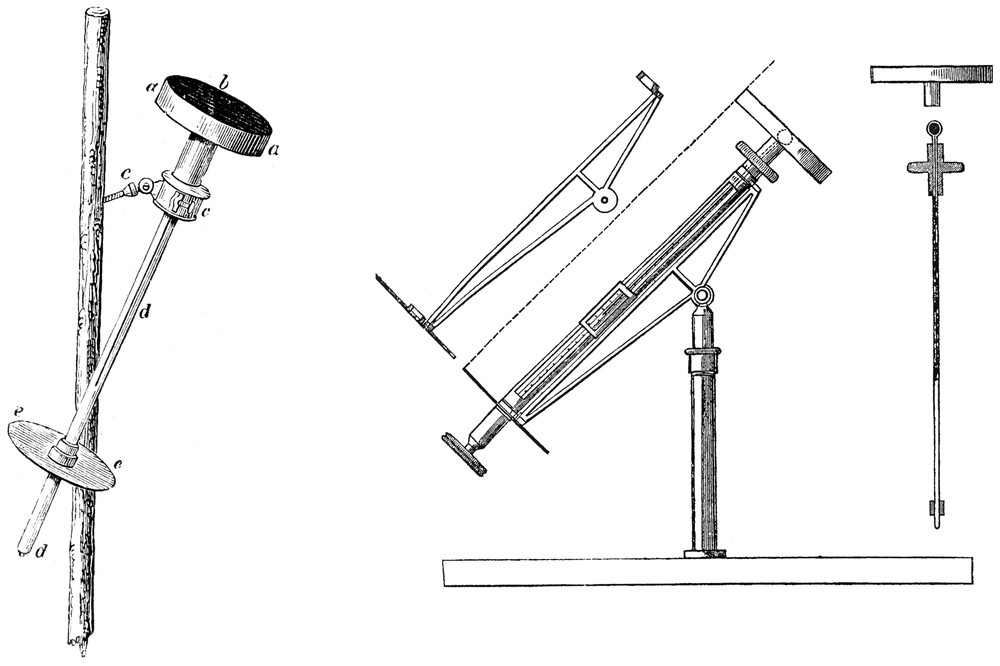
Plates representing Claude Pouillet's pyrheliometer [39]. This apparatus consists of a thermometer d measuring the change of temperature of a large water container a whose planar face b, which is painted black, is directed towards the Sun. The shadow of the container must be projected exactly onto the disc e, which makes it possible to ensure that the face b is perpendicular to the solar rays. The rise in temperature recorded with the thermometer can be converted into measurable heat input rate, knowing the heat capacity of water.
Gravures représentant le pyrhéliomètre de Claude Pouillet [39]. Cet appareil est constitué d'un thermomètre d mesurant le changement de température d'un grand réservoir d'eau a dont la face plane b orientée vers le Soleil est peinte en noir. L'ombre du réservoir doit se projeter exactement sur le disque e, ce qui permet de s'assurer que la face b est perpendiculaire aux rayons solaires. L'augmentation de température mesurée par le thermomètre est convertie en flux de chaleur mesurable en connaissant la capacité calorifique de l'eau.
Pouillet tente aussi de calculer numériquement l'influence, sur la température de l'atmosphère, de l'absorption du rayonnement solaire et de celui émis par la Terre. Dans son mémoire de 1838 [39], il fait état de calculs théoriques à valeur générale concernant un globe sphérique recouvert d'une enveloppe « diathermane », c'est-à-dire perméable à la chaleur, le tout étant inclus dans une enceinte portée à une température variable. En faisant le bilan des transmissions de chaleur entre le globe et l'enceinte, Pouillet démontre qu'il est possible de réchauffer le globe de plusieurs dizaines de degrés. La condition nécessaire est que l'enveloppe présente un effet de serre, c'est-à-dire qu'elle se caractérise par des coefficients d'absorption différents pour les flux venant respectivement du globe et de l'enceinte. Revenant à un cas proche du système terrestre, Pouillet écrit qu'« il suffit que le globe soit protégé par une enveloppe diathermane douée de la double propriété d'absorber seulement la moitié de la chaleur émise par la surface de l'enceinte, et d'absorber au contraire les neuf dixièmes environ de la chaleur émise par la surface. » Pouillet précise que même « quand l'atmosphère a toutes les apparences d'une sérénité parfaite, elle absorbe encore près de la moitié de la quantité de chaleur que le Soleil émet vers la Terre, et c'est l'autre moitié seulement de cette chaleur qui vient tomber sur la surface du sol, et qui s'y trouve diversement répartie, suivant qu'elle a traversé l'atmosphère avec des obliquités plus ou moins grandes. […] Quant à la chaleur solaire, il n'existe aucun doute : on sait qu'en traversant les substances diathermanes, elle est moins absorbée que la chaleur qui provient des différentes sources terrestres dont la température n'est pas très haute. Il est vrai qu'on n'a pu en faire l'expérience que sur des écrans diathermanes solides ou liquides ; mais l'on regarde comme certain que la couche atmosphérique agit à la manière des écrans de cette espèce, et qu'en conséquence elle exerce sur les rayons terrestres une plus grande absorption que sur les rayons solaires. »
C'est en fait au chimiste et ingénieur irlandais, John Tyndall (1820–1893) que l'on doit les premières données expérimentales sur l'absorption et l'émission des rayons infrarouges par les gaz [44,46,47]. Tyndall se distingue particulièrement par des expériences méticuleuses qu'il réalise à l'aide d'un spectrophotomètre de sa conception dont le tube peut être rempli de différents mélanges de gaz à des pressions variables (Fig. 8). Ses analyses portent sur le pouvoir d'absorption de nombreux composés tels que la vapeur d'eau, le dioxyde de carbone, le méthane, le protoxyde d'azote, diverses molécules organiques, des composés halogénés et enfin l'ozone (il est d'ailleurs le premier à écrire que l'ozone est constitué de groupes d'atomes d'oxygène). Tyndall mesure même les pouvoirs d'absorption des vapeurs de plusieurs parfums, comme l'essence de lavande et le patchouli ! Ses résultats, obtenus à différentes pressions, montrent que l'absorption augmente linéairement jusqu'à un seuil de pression, caractéristique du composé, au-delà duquel le phénomène atteint une saturation. À l'opposé, il démontre aussi que les gaz simples comme l'oxygène, l'azote et l'hydrogène sont, quant à eux, pratiquement transparents aux rayons infrarouges (ultra-red rays).
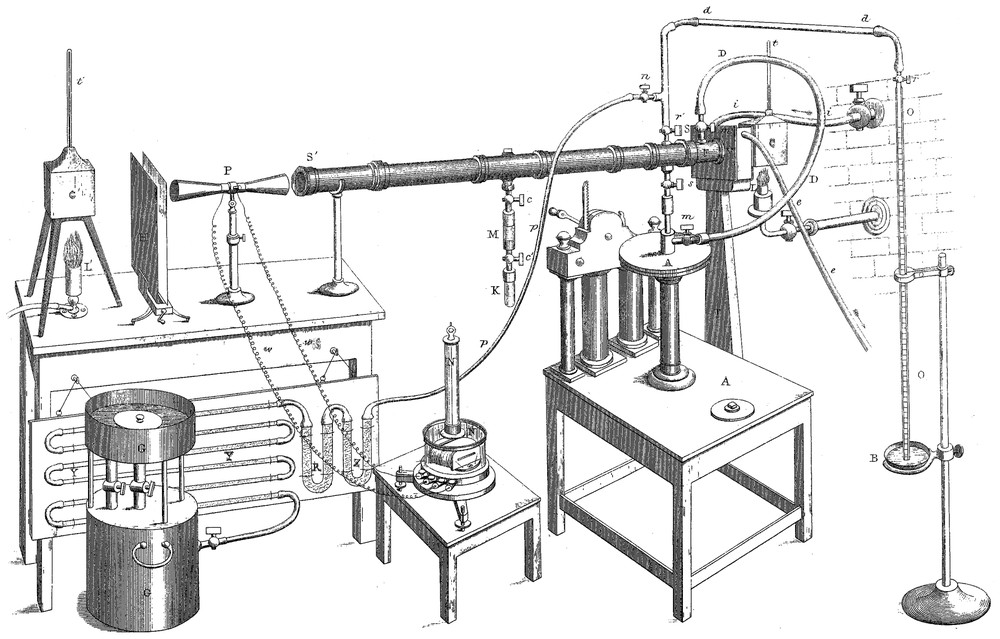
John Tyndall's spectrophotometer [47]. The apparatus consists of a long copper tube that can be filled with various gases. The two ends are capped by slabs of rock salt crystal, a material relatively transparent to infrared radiation. A cube of boiling water is used as a heat source, which is placed in front of the tube. The incident radiation interacts with the gas column and then enters one cone of a reflector leading to a pile containing Bi–Sb thermocouples in series. Radiation from a second heat source heats up a screen before entering a second cone leading to the second face of the thermopile. This latter is connected to a galvanometer for measuring the current, which is a function of the difference in temperature between the two faces of the thermopile. This apparatus makes it possible to compare quantitatively the intensity of the two radiations and calculate the absorptive effect of the gas contained in the tube. The device is particularly sensitive because it allows an exact compensation of the incident heat flux by relocating the tin screen placed in front of the second heat source. With this apparatus, Tyndall analysed the absorptive power of many compounds such as: water vapour, carbon dioxide, ethylene (‘olefiant gas’), methane (‘marsh gas’), ethyl oxide (‘sulphuric ether’), chloroform, methyl and ethyl alcohols, formic and acetic acids, hydrogen sulphide, ammonia, chlorine, bromine, nitrous oxide, sulphuric and bromic acids, as well as ozone.
Spectrophotomètre de John Tyndall [47]. L'appareil est constitué d'un long tube de cuivre pouvant être rempli de différents gaz. Les deux extrémités sont obturées par des tranches de sel gemme, matériau relativement transparent au rayonnement infrarouge. Un cube d'eau bouillante, servant de source de chaleur, est placé à l'avant du tube. Le rayonnement incident interagit avec la colonne de gaz, puis entre dans un réflecteur conique conduisant à une pile contenant des couples thermoélectriques Bi–Sb en série. L'émission d'une seconde source de chaleur réchauffe un écran avant d'entrer dans un second cône conduisant à la deuxième face de la thermopile. Celle-ci est connectée à un galvanomètre qui mesure le courant qui dépend de la différence de température des deux faces de la thermopile. Ce montage permet de comparer quantitativement l'intensité des deux rayonnements et de déduire l'effet d'absorption du gaz contenu dans le tube. Le dispositif est particulièrement sensible, car il permet de réaliser une compensation exacte des flux de chaleur incidente en translatant l'écran d'étain placé devant la seconde source de chaleur. Avec cet appareil, Tyndall analyse le pouvoir d'absorption de nombreux composés tels que la vapeur d'eau, le dioxyde de carbone, l'éthylène (olefiant gas), le méthane (marsh gas), l'oxyde d'éthyle (sulphuric ether), le chloroforme, les alcools méthylique et éthylique, les acides formique et acétique, le sulfure d'hydrogène, l'ammoniac, le chlore, le brome, le protoxyde d'azote, les acides sulfurique et bromique, ou encore l'ozone.
S'intéressant également à l'environnement terrestre, Tyndall est convaincu de l'importance de l'effet de serre en climatologie. Dans son ouvrage Heat, a mode of motion [47], il insiste sur l'importance de la rétention de la chaleur par la vapeur d'eau : « en ce qui concerne la Terre comme source de chaleur, j'estime qu'au moins 10 pour cent de son émission est interceptée dans les dix premiers pieds [trois premiers mètres] au-dessus de sa surface. Ce fait unique témoigne de l'énorme influence que cette nouvelle propriété de la vapeur d'eau doit avoir pour les phénomènes en météorologie. » Tyndall en apporte d'ailleurs la preuve en présentant des données météorologiques qui montrent que la variation nocturne de la température de l'air est corrélée négativement avec son humidité. Tyndall dépeint avec des accents dramatiques une Angleterre dont l'atmosphère serait dépourvue d'effet de serre : « Cette vapeur d'eau est une couverture encore plus indispensable pour la végétation de l'Angleterre que les vêtements ne le sont pour un homme. Ôtez, pendant une seule nuit d'été, cette vapeur d'eau de l'air qui baigne notre contrée, et vous détruiriez assurément toutes les plantes sensibles à la gelée. La chaleur de nos champs et jardins s'épandrait sans retour vers l'espace, et le Soleil se lèverait sur une ı̂le marquée d'une main de fer par le gel […] sa présence limiterait les pertes de la Terre ; son absence, sans altérer la transparence de l'air, ouvrirait grand une porte par laquelle la chaleur terrestre s'échapperait vers l'infini ».
Tyndall fait d'autres découvertes se rattachant plus ou moins à la climatologie. En marge de ses travaux sur la diffusion de la lumière par les macromolécules (l'effet Tyndall qui a des applications pratiques en chimie), il est le premier à suggérer que le bleu du ciel soit dû à la diffusion de la lumière du Soleil par les molécules de l'air : « Le bleu du ciel […] est produit par des particules sans couleur. Seule la petitesse de leur taille est nécessaire pour assurer la sélection et la réflexion de cette couleur. » Toujours à l'aide de son spectrophotomètre, Tyndall réalise aussi des expériences sur l'absorption du rayonnement infrarouge par les suies de carbone (lampblack). On lui attribue aussi les premières mesures de pollution atmosphérique, qu'il réalise en utilisant le principe de l'absorption et de la diffusion des rayons infrarouges par les aérosols carbonés et les poussières disséminées dans l'air de Londres.
La haute montagne est aussi un centre d'intérêt majeur pour Tyndall. Il visite chaque année les Alpes, et est même le premier à gravir le sommet suisse du Weisshorn. Il résume son expérience de montagnard dans des ouvrages populaires, Glaciers of the Alps [43] et Mountaineering in 1861 [45]. En collaboration avec Thomas Henry Huxley (1825–1895), il publie, en outre, une étude scientifique sur la structure, le fonctionnement et les variations des glaciers [48]. Grâce à des expériences réalisées avec de l'argile et de l'eau (Fig. 9), ces auteurs tentent de montrer que le mouvement des glaciers ne se résume pas à l'écoulement d'un fluide visqueux, mais que la glace imite le comportement d'un fleuve via un processus de fracturation suivi d'un regel.
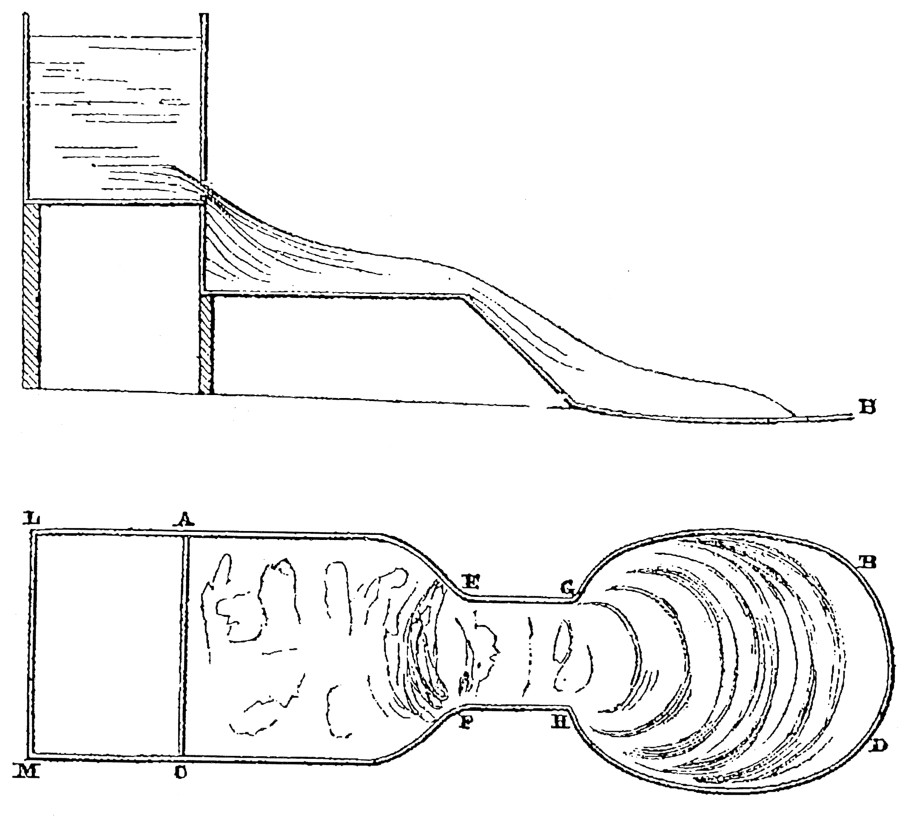
Plate showing the experimental apparatus used to simulate the movement of glaciers. Tyndall and Huxley [48] describe it in these terms: “ABCD, upper panel, is a wooden trough intended roughly to represent the glacier of the Rhone, the space ACEF being meant for the upper basin. Between EF and GH the trough narrows and represents the precipitous gorge down which the ice tumbles, while the wide space below represents the comparatively level valley below the fall, which is filled with the ice, and constitutes the portion of the glacier seen by travellers descending from the Grimsel or the Furka pass. ACLM is a box with a sluice front, which can be raised so that the fine mud within the box shall flow regularly into the trough, as in the cases already described. The disposition of the trough will be manifest from the section, lower panel. While the mud was in slow motion downwards, a quantity of dark-coloured sand was sifted over the space ACEF, so as to represent the debris irregularly scattered over the corresponding surface of the glacier; during the passage of the mud over the brow at EF, and down the subsequent slope, it was hacked irregularly, so as to represent the dislocation of the ice in the glacier. Along the slope this hacking produced an irregular and confused distribution of the sand; but lower down, the patches of dirt and the clean spaces between them gradually assumed grace and symmetry; they were squeezed together longitudinally and drawn out laterally, bending with the convexity downwards in consequence of the speedier flow of the central portions, until finally a system of bands was established which appeared to be an exact miniature of those exhibited by the glacier. On [the lower panel] is a sketch of the bands observed upon the surface of the mud, which however falls short of the beauty and symmetry of the original. These experiments have been varied in many ways, with the same general result”.
Gravure représentant le montage expérimental simulant l'écoulement des glaciers. Tyndall et Huxley [48] le décrivent en ces termes : « ABCD, (panneau du haut) est un chenal en bois représentant grossièrement le glacier du Rhône, l'espace ACEF matérialisant le bassin supérieur. Entre EF et GH, le chenal se rétrécit et représente une gorge escarpée dans laquelle la glace tombe en cascade, tandis que le vaste espace en dessous représente la vallée relativement plane sous la cascade de glace et qui est la partie du glacier visible par les voyageurs traversant les cols de Grimsel ou du Furka. ACLM est une boı̂te comportant à façade coulissante de façon à ce que la boue fine de la boı̂te puisse s'en écouler régulièrement vers le chenal, comme décrit précédemment. La forme du chenal est clairement représentée par la coupe (paneau du bas). Lorsque la boue s'écoulait doucement vers le bas, du sable de couleur foncée était dispersé sur l'espace ACEF afin de représenter les débris irrégulièrement dispersés sur la surface correspondante du glacier ; au cours du passage de la boue sur le front EF et sur la pente suivante, elle était fragmentée irrégulièrement, matérialisant la dislocation du glacier. Le long de la pente, cette fragmentation conduisait à une répartition irrégulière et désorganisée du sable ; mais, plus bas, les zones à débris et les zones propres montraient une progression vers un ordre et une symétrie ; ils étaient comprimés les uns contre les autres dans le sens de la longueur et étirés latéralement, s'incurvant avec une convexité orientée vers le bas en raison de l'écoulement central plus rapide, pour atteindre finalement un système de bandes qui reproduisait en miniature celui observé sur le glacier. Le paneau du bas représentant les bandes observées à la surface de la boue, est en fait une bien pâle reproduction de la beauté et la symétrie de la réalité. Ces expériences ont été reproduites dans différentes conditions pour donner les mêmes résultats généraux ».
Même si sa contribution sera par la suite oubliée, Jacques Joseph Ebelmen (1814–1852), professeur à l'École des mines de Paris et administrateur de la Manufacture royale des porcelaines de Sèvres, est le premier à suggérer que des changements du cycle du carbone ont pu faire varier dans le passé la teneur atmosphérique en « acide carbonique » et, par voie de conséquence, le climat de la Terre [6,23]. Ce pionnier de la géochimie écrit en 1845 [23] que « plusieurs circonstances tendent néanmoins à prouver qu'aux anciennes époques géologiques l'atmosphère était plus dense et plus riche en acide carbonique, et peut-être en oxygène, qu'à l'époque actuelle. À une plus grande pesanteur de l'enveloppe gazeuse devaient correspondre une plus forte condensation de la chaleur solaire, et des phénomènes atmosphériques d'une bien plus grande intensité. » Quelques années plus tard, Tyndall écrit aussi que « toutes les mutations du climat que les recherches des géologues révèlent » peuvent être liées à des variations des teneurs atmosphériques en gaz à effet de serre.
4 Burinage erratique, glacières boréale et australe
Les études sur la morphologie et la géologie des Alpes sont effectivement à l'origine de nombreuses avancées scientifiques, en particulier concernant l'extension des glaciers dans le passé. Comme nous l'avons vu, la réflexion est initiée par la présence de blocs erratiques qui sont des rochers caractérisés par une taille formidable, des formes irrégulières et des positions étranges s'expliquant difficilement par un transport par l'eau (Fig. 3). Un agent de transport liquide ne peut pas non plus expliquer des faits précis comme la répartition de blocs volumineux de natures géologiques différentes sur les rives d'une même vallée, ou bien encore la présence de certains blocs erratiques situés à des altitudes supérieures à celles des affleurements desquels ils ont été arrachés. Par ailleurs, la présence, dans les vallées alpines, de nombreuses moraines, de dépôts de débris rocheux sans stratification ni tri, et encore de roches lisses « moutonnées » marquées de stries profondes, reste énigmatique (Fig. 10).
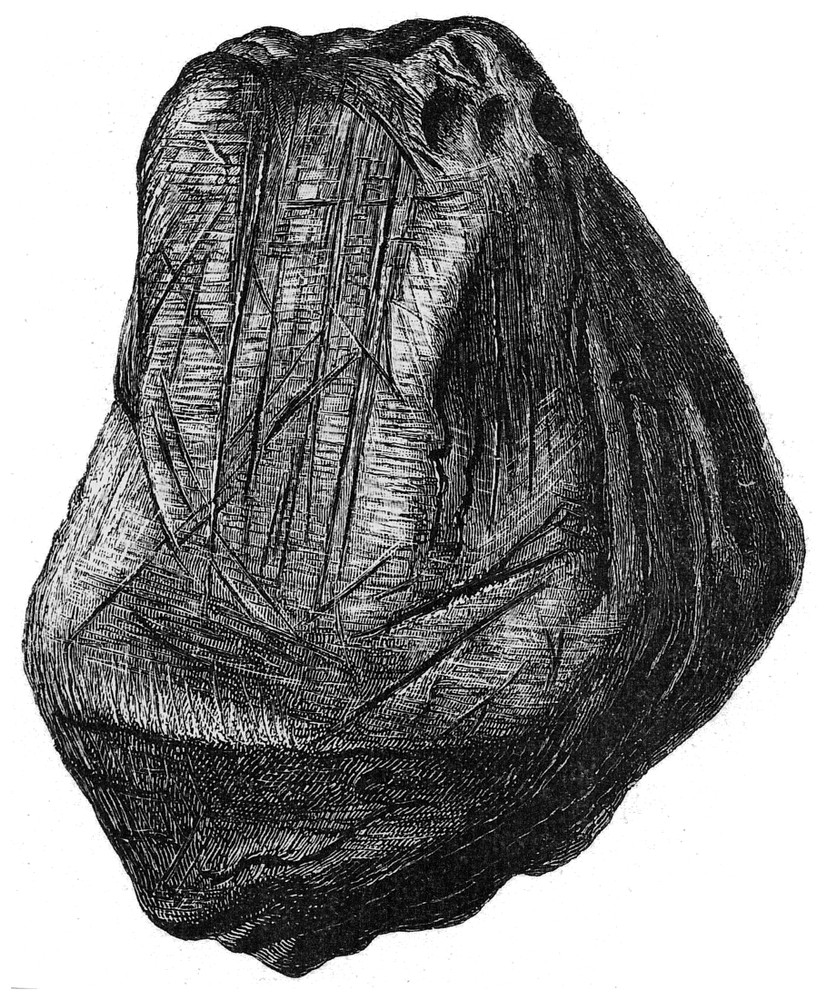
Plate showing a rolled and striated block discovered in a moraine in Scotland [30].
Gravure d'un bloc roulé et strié découvert dans la moraine d'Écosse [30].
En se fondant sur l'observation des glaciers actuels, quelques montagnards et scientifiques suisses comprennent cependant qu'un transport par la glace pourrait expliquer ces énigmes de façon simple. En particulier, les moraines frontales poussées par les glaciers ont des équivalents moins élevés dans les vallées, ce qui suggère que l'extension des glaciers était autrefois plus importante. Des documents historiques viennent d'ailleurs corroborer ces études géologiques : certains cols, praticables au Moyen Age, ne sont en effet plus accessibles en raison d'un englacement récent. Des constructions ont même été détruites par la progression de glaciers.
Quelques scientifiques voient dans ces fluctuations l'empreinte d'un véritable changement climatique. Ignace Venetz (1788–1859), ingénieur en chef du canton du Valais, signale des changements dans l'étagement de certaines plantes, sauvages ou cultivées, qui suivent les variations des glaciers alpins [49]. Son ouvrage rédigé en 1821 regroupe de nombreuses anecdotes, comme celles qui concernent la persistance d'impôts prélevés sur des cultures de vignes, de noyers ou de raves, alors même que les terrains situés en altitude sont devenus stériles. La variation du front des glaciers alpins constitue pour Venetz la meilleure preuve des changements climatiques récents. Il détaille particulièrement le cas du Glacier de Rossboden, situé au sud-ouest du village de Simplon (Fig. 11). Les moraines terminales cartographiées par Venetz se trouvent environ 200 m plus bas en altitude que le front qu'il observe au début du XIXe siècle. Comme beaucoup de glaciers alpins, le Rossbodegletscher est encore remonté d'environ 200 m depuis cette époque. Venetz fait ensuite un bref inventaire des causes que l'on pourrait invoquer pour expliquer ces observations cohérentes de fluctuations climatiques au cours des derniers siècles. Il élimine d'emblée les lentes variations de l'orbite terrestre, « puisque les calculs astronomiques ont prouvé que les variations de la pression de l'écliptique ne sauraient les produire ».
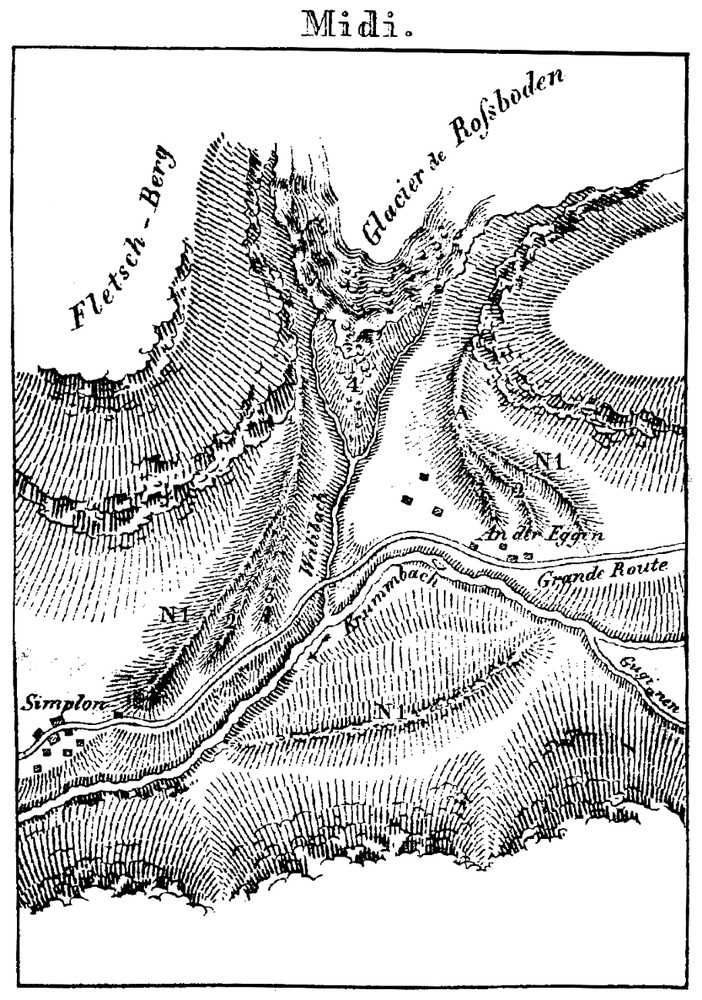
Map drawn up by Ignace Venetz of the various moraines of the Rossboden glacier (Rossbodegletscher) in the south of Switzerland [49]. The author writes that “the moraines of the Rossboden glacier, on the Simplon, prove in a quite striking manner the gigantic former size of this glacier, having arrived very close to the place where the village of Simplon is today. […] One could object that this glacier formed these moraines by causing sudden falls that are mentioned in history. It is incredible that a fall could form such regular moraines”.
Cartographie par Ignace Venetz des différentes moraines du glacier de Rossboden (Rossbodegletscher) au sud de la Suisse [49]. L'auteur écrit que « les moraines du glacier de Rossboden, sur le Simplon, prouvent d'une manière bien frappante la grosseur gigantesque que ce glacier avait autrefois, étant arrivé tout près de l'endroit où se trouve aujourd'hui le village de Simplon. […] On pourra nous objecter que ce glacier aura formé ces moraines par des chutes subites dont l'histoire fait mention. Il est incroyable qu'une chute puisse former des moraines si régulières ».
Jean de Charpentier (1786–1855), directeur des mines du canton de Vaud et professeur honoraire de géologie à l'Académie de Lausanne, reprend à son compte les observations de Venetz, en les généralisant [13–15]. De Charpentier écrit même de façon prémonitoire qu'« il semble que, depuis 1818, un retour de chaleur ait eu lieu dans nos contrées, car on remarque généralement que la plupart des glaciers et presque tous les hauts-névés ont diminué depuis 1818. Si cette augmentation de température se maintenait pendant un ou deux siècles, il n'y a pas de doute que les passages des Alpes les plus obstrués par les neiges devinssent de rechef praticables » [15].
L'idée d'un transport par les glaces de rochers volumineux apparaı̂t aussi comme une évidence pour le Norvégien Jens Esmark (1763–1839), professeur de géologie à l'université de Christiana (aujourd'hui Oslo). En observant le modelé glaciaire qui l'entoure, Esmark émet l'hypothèse que son pays a été jadis recouvert d'une immense calotte de glace qui s'étendait jusqu'aux fjords [3,25]. Selon lui, même la mer devait être gelée à cette époque. Ses observations et conclusions, publiées en 1824 et 1827 sont exactes dans leur principe, mais Esmark se trompe sur la chronologie de la glaciation, qu'il fait remonter aux origines de la Terre. En effet, il est influencé par une théorie en vogue à l'époque au sujet de la formation de la Terre, qui fait de notre planète une ancienne comète dont l'orbite excentrique aurait diminué régulièrement et qui se serait rapprochée du Soleil. Selon cette théorie, les périodes glaciaires correspondraient aux périodes d'aphélie, lorsque la « comète terrestre » était éloignée du Soleil.
La communauté scientifique est en fait majoritairement réticente à toutes ces nouvelles idées. Loin du terrain, les naturalistes des sociétés savantes restent persuadés que seule l'eau liquide a pu transporter les blocs erratiques sur de longues distances. Néanmoins, quelques auteurs perspicaces et persévérants réussissent à donner corps et écho à la théorie du transport par les glaces. Les observations locales faites par des montagnards comme Jean-Pierre Perraudin, sont généralisées par des scientifiques comme Venetz, de Charpentier et, plus tardivement, Louis Agassiz (1807–1873). Ce jeune professeur de géologie de l'université de Neuchâtel a déjà acquis une notoriété internationale grâce à ses travaux sur les poissons fossiles. En 1836, de Charpentier invite Agassiz et Venetz à séjourner durant l'été dans sa maison de Bex. De Charpentier donne un véritable cours de travaux pratiques à Agassiz qui assimile les résultats patiemment accumulés depuis plus de dix ans [15,42]. Au départ, chacune des trois personnalités doute réellement de la possibilité d'une extension passée des glaciers plus importante qu'à l'heure actuelle. Mais progressivement les faits de terrain les amènent à envisager des tailles de plus en plus grandes pour ces glaciers fossiles. Venetz imagine un glacier qui se serait jadis étendu des Alpes jusqu'au Jura, alors qu'Agassiz affirme que, pendant l'« âge glaciaire », une calotte gigantesque avait en partie recouvert l'hémisphère nord jusqu'à des latitudes aussi basses que celles de la Méditerranée.
De Charpentier s'illustre particulièrement dans la comparaison des glaciers actuels avec les traces constituées par le « terrain erratique » [15] (voir sur la Fig. 12 son schéma de fonctionnement de la confluence de deux glaciers contemporains et les relations avec leurs dépôts morainiques). Pour ce chercheur, « l'hypothèse des glaciers diluviens est la seule qui explique d'une manière satisfaisante, jusque dans leurs moindres détails, tous les phénomènes du terrain erratique ». Selon lui, refuser l'idée d'un possible transport d'énormes blocs par les glaciers est une attitude illégitime, car « il n'est point de bloc assez volumineux pour résister à la force expansive de la glace, tout comme il n'en est point de trop lourd pour qu'un glacier ne puisse le porter à des distances considérables. Le Blaustein dans la vallée de Saas est un bloc de serpentine de 244 000 pieds cubes, transporté il y a environ 100 ans, par le glacier actuel de Matmark ou de Schwarzberg. Le bloc erratique le plus gros que je connaisse, est le bloc-monstre des Devens, qui cependant, n'ayant que 161 000 pieds cubes, n'atteint que les deux tiers du volume du Blaustein. Ce n'est donc pas sortir des limites de la vraisemblance que d'attribuer aux glaciers diluviens le transport de blocs inférieurs en volume au Blaustein. »
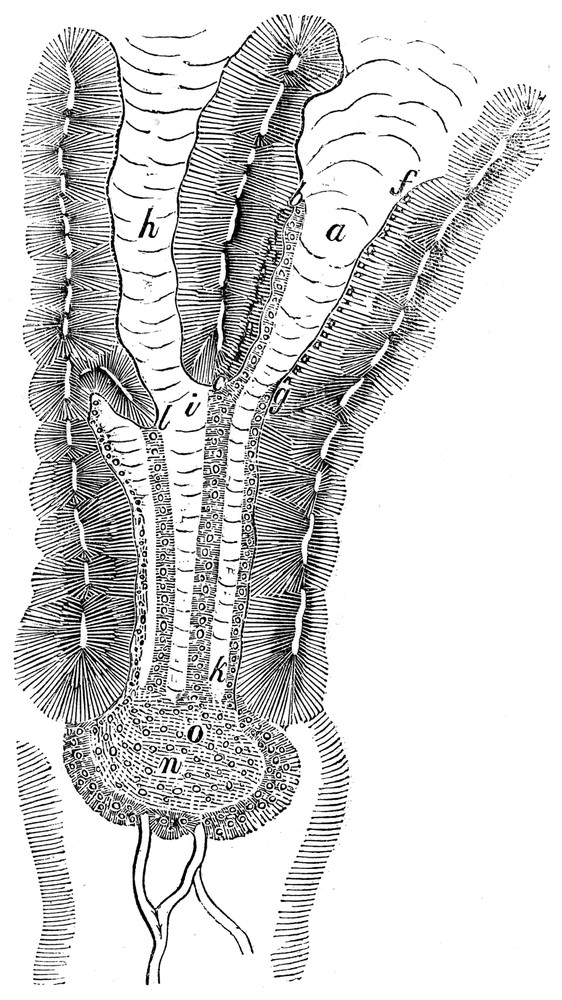
Plate representing the junction of two modern glaciers and the relations with their morainal deposits [15]. Jean de Charpentier describes it in these terms: “Here now is the explanation of the way in which the surface bands or moraines are formed and maintained. Let us consider the map drawing of a glacier a, which, from b to c, is bordered by a slope that is too steep to allow debris to pile up by being carried and pushed towards its margin, as taking place on the opposite side, where the moraines f, g are deposited. Consequently, the debris along the escarpment b c, having remained on the ice, will be transported towards c by the movement of the glacier to meet branch h, with which it joins up to form glacier i, k, o, n. The debris brought to c is unable to reach the margins, because of the gradual movement of the two glaciers a and h; it must follow the direction c, o, without deviating either to the right or to the left, as long as the mountains on both sides prevent the glacier from enlarging or dilating laterally. Along the entire path c, o, the debris, remaining piled up in the shape of a dam on the ice, will give rise to a surface band or moraine. But as soon as the small valley widens out, or when the glacier leaves the surrounding mountains, it will no longer be hindered, and will then dilate laterally: the materials brought from c, and accumulated in the shape of a dam, will not remain joined together any more; the moraine will be broken up, and the debris will end up being scattered and spread out in a fan on the top surface of the glacier. It is easily conceived that the moraine c, o, would be larger if the glacier h also brought debris to c, and that its volume would increase even further if the meeting point, c, of the two glaciers a and h were dominated by enormous rocks liable to fall”.
Gravure représentant la confluence de deux glaciers actuels et les relations avec leurs dépôts morainiques [15]. Jean de Charpentier la décrit en ces termes : « Voici maintenant l'explication de la manière dont les bandes ou moraines superficielles se forment et se maintiennent. Soit a, le plan d'un glacier qui de b à c se trouve bordé par une pente trop rapide pour que les débris qu'il charrie et rejette sur ses bords, puissent s'y entasser, comme cela a eu lieu sur le bord opposé, où il a déposé la moraine f, g. Par conséquent les débris, le long de l'escarpement b c, étant restés sur la glace, seront transportés en c par le mouvement du glacier, qui y rencontrera la branche h, avec laquelle il se réunira pour former le glacier i, k, o, n. Les débris amenés en c, ne peuvent se rendre sur les bords, à cause du mouvement progressif des deux glaciers a et h ; ils doivent donc suivre la direction c–o, sans dévier ni à droite, ni à gauche, aussi longtemps que les montagnes des deux côtés empêcheront le glacier de s'élargir ou de se dilater latéralement. Dans tout ce trajet c, o, les débris, restant entassés en forme de digue sur la glace, donneront lieu à une bande ou moraine superficielle. Mais dès que le vallon s'évasera, ou que le glacier quittera les montagnes qui l'encaissent, et n'éprouvera ainsi plus de gêne, alors il se dilatera latéralement : les matériaux amenés depuis c, et accumulés en forme de digue, ne resteront plus réunis ; la moraine se disloquera, et ces débris finiront par s'éparpiller et par se répandre en éventail n sur le dos du glacier. On conçoit aisément que la moraine c, o, serait plus grande si le glacier h amenait aussi des débris en c, et que son volume augmenterait encore, si le point de jonction c des deux glaciers a et h était dominé par de vastes rochers sujets à s'ébouler ».
Un reproche qui est alors souvent fait aux tenants de la théorie glaciaire est la difficulté de trouver des causes à ces changements climatiques de grande ampleur. De Charpentier souligne que cette critique facile constitue un bien mauvais procès : « il ne serait donc pas logique de rejeter l'hypothèse des glaciers par la raison seule qu'on n'aurait pas réussi jusqu'à présent à démontrer la cause du développement extraordinaire des glaciers diluviens ». En fait, le même problème d'absence de cause concerne aussi les autres théories proposées à l'époque : en effet, peu d'auteurs se soucient de l'origine et du devenir de l'eau du Déluge. Cherchant à déterminer la raison ultime des anciennes glaciations, de Charpentier invoque [15], mais sans trop y croire, des causes astronomiques « comme par exemple un changement de l'écliptique, la précession des équinoxes, la progression du système planétaire dans l'espace, les astéroı̈des d'Août et de Novembre, etc ».
La diffusion de la théorie glaciaire a été rythmée par quelques présentations prophétiques, mais malheureusement très mal accueillies par la plupart des scientifiques de l'époque. Venetz expose ses vues en 1816 à Berne, lors de la réunion annuelle de la Société helvétique des sciences naturelles ; de Charpentier tente de convaincre ses pairs lors de la réunion de Lucerne en 1834 ; enfin, Agassiz choque son auditoire à Neuchâtel, en 1837, lors de son discours d'ouverture en tant que président de cette société savante. Dans l'esprit d'Agassiz, la période glaciaire s'est mise en place très rapidement, et constitue donc une catastrophe au sens de Cuvier. Le savant français avait d'ailleurs accueilli son collègue suisse quelques années plus tôt dans son laboratoire de paléontologie. Pour Agassiz, l'eau du Déluge biblique doit être remplacée par un gigantesque glacier qu'il surnomme même la « grande charrue de Dieu ».
Ces études, complétées d'un faisceau d'observations minutieuses des glaciers alpins, font ensuite l'objet de publications de synthèse. Agassiz et de Charpentier publient, respectivement, Études sur les glaciers [2] et Essai sur les glaciers et sur le terrain erratique du bassin du Rhône [15], deux ouvrages qui sortent des presses à cinq mois d'intervalle. Pendant les décennies suivantes, la théorie glaciaire va finir par s'imposer, à la faveur de nouvelles observations indubitables, tant en Europe qu'en Amérique du Nord. Agassiz réussit à convaincre des scientifiques anglais réputés comme William Buckland (1784–1856) et Charles Lyell. Ces deux professeurs des universités d'Oxford et de Londres deviennent bientôt les meilleurs avocats de la théorie glaciaire. En revanche, Agassiz a moins de succès du côté français, où il se heurte notamment au scepticisme de Léonce Élie de Beaumont (1798–1874), successeur de Cuvier au Collège de France. Élie de Beaumont a pourtant étudié les blocs erratiques et les roches moutonnées du Nord du Grimsel dans les Alpes et de beaucoup de régions des Vosges, mais il écarte la notion de glaciations « pour des difficultés insurmontables ». Son scepticisme est aussi lié au fait que certains enthousiastes de la théorie glaciaire veulent en voir des traces partout. Des roches moutonnées avec des stries glaciaires sont, par exemple, décrites dans les grès de la forêt de Fontainebleau, alors qu'il ne s'agit que de polissoirs utilisés par les hommes du Néolithique pour confectionner leurs haches. Comme beaucoup de scientifiques à l'époque, Élie de Beaumont adhère encore pleinement à la théorie des radeaux de glace et il affirme que « les blocs erratiques du Nord ne seraient donc pas des pierres roulées, idée exclue d'ailleurs par l'exacte conservation de leurs arêtes, mais des pierres flottées. Ces pierres auraient été flottées à l'aide de la légèreté spécifique de la glace, comme les scories et les pierres ponces… » [24].
Parallèlement à l'étude des glaciers, celle des calottes polaires alimente également les débats sur la climatologie naissante. Au milieu du XIXe siècle, plusieurs expéditions sont menées au Groenland et dans l'océan Austral, contribuant à convaincre les naturalistes de l'existence d'énormes calottes de glace dans les régions polaires (Fig. 4). Des capitaines de vaisseaux, le Français Jules Dumont d'Urville, en 1838–1840, et l'Anglais James Ross, en 1841–1843, fournissent ainsi les premières descriptions de la calotte antarctique. La taille et la topographie de celle-ci restent cependant totalement inconnues, même si des scientifiques se lancent dans des estimations hasardeuses. À titre d'exemple historique, le Français Joseph Adhémar (1797–1862) évalue en 1842 [1] l'épaisseur moyenne de la calotte Antarctique à 100–200 km ! Cet auteur, dont nous décrirons par ailleurs d'autres recherches plus fécondes, se base sur des estimations, malheureusement non représentatives, des profondeurs de l'océan Austral, qui apparaissent beaucoup plus importantes que celles des océans de l'hémisphère boréal. Il en déduit que l'eau de l'océan est attirée par la gravité d'un corps très massif situé au pôle Sud, et qui ne peut être que la calotte Antarctique dont les explorateurs n'ont cartographié que le pourtour. La gravure de la Fig. 13 présente sa vision en coupe de la Terre avec ses trois sphères terrestres solide, liquide et gazeuse dont les centres respectifs sont décalés à cause de la dissymétrie des deux calottes polaires (les deux « glacières » boréale et australe). En effet, dans son ouvrage Révolutions de la mer, déluges périodiques [1], Adhémar écrit que « dans le voisinage du pôle boréal, la mer n'a pas plus de 300 brasses [environ 0,5 km] de profondeur moyenne, tandis que dans l'hémisphère austral, on a obtenu plus de 2000 brasses [environ 3 km] et, plus souvent encore, on n'a point trouvé de fond […] Il doit donc exister une force qui attire le centre de la sphère fluide vers le pôle austral et cette force n'est autre que la masse énorme de glaces accumulées sur cette partie de la terre […] Il résulte des calculs qui précèdent, qu'une calotte glacée de 20 lieues [environ 90 km] d'épaisseur moyenne, sera suffisante pour maintenir la presque totalité des mers à près d'une lieue de hauteur au-dessus des continents de l'hémisphère austral. »
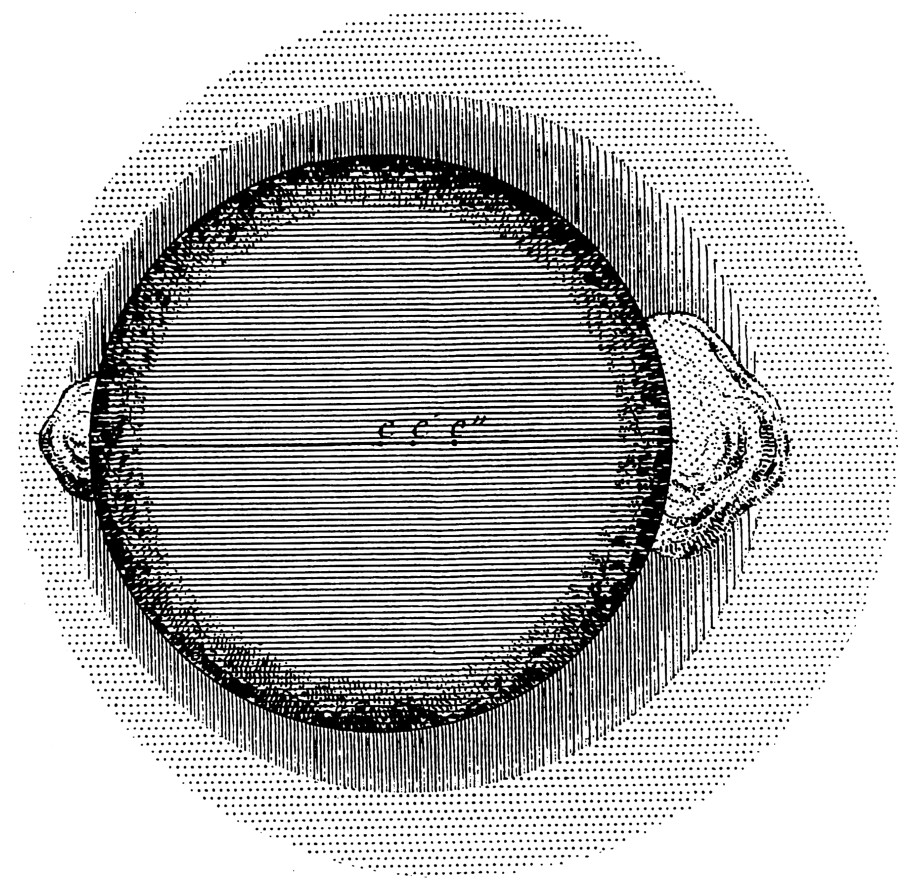
Cross-section by Joseph Adhémar [1] of the three terrestrial spheres (solid, liquid and gaseous). The respective centres are shifted because of the dissymmetry of the two boreal and austral ice-masses.
Coupe par Joseph Adhémar [1] des trois sphères terrestres solide, liquide et gazeuse. Les centres respectifs sont décalés à cause de la dissymétrie des deux « glacières » boréale et australe.
Adhémar réalise probablement que l'idée d'une telle calotte est difficile à faire passer, mais il ajoute pour convaincre son lecteur que « beaucoup de personnes n'admettent que les choses qui ressemblent à celles qu'elles connaissent. Si quelqu'un a vu un glaçon de 20 mètres d'épaisseur, on peut lui dire qu'il en existe qui ont 21 m ; mais lorsque vous passez sans intermédiaire de 20 mètres à 20 lieues, il faut quelque temps pour habituer l'esprit à considérer la chose comme possible ! » Cette estimation extravagante est évidemment mal reçue par ses contemporains. Adhémar propose néanmoins un test de son calcul « en examinant l'ombre de la terre dans les éclipses de lune, [afin] d'y reconnaı̂tre le faible renflement que doit produire la glacière australe » et il évoque même des observations, déjà très anciennes et probablement peu précises, faites par l'astronome danois Ticho Brahe (1546–1601) lors de l'éclipse de 1588.
5 Equinoxes, transport de la chaleur, retour des eaux
Joseph Adhémar ne se contente pas d'étudier les calottes polaires actuelles, il cherche aussi à déterminer la cause des périodes glaciaires et de leur récurrence dans le temps. Bien qu'il ne dispose d'aucune donnée géochronologique pour dater les glaciations successives, Adhémar a cependant l'intuition géniale qu'elles doivent être périodiques, et donc pilotées par la mécanique céleste (le lecteur intéressé se réfèrera à [5] ainsi qu'à l'article sur la théorie astronomique par André Berger, dans ce numéro). Il est clairement influencé par l'explication du mécanisme des saisons et des marées dont les calculs de prévision font de grands progrès à son époque.
L'estimation exagérée d'Adhémar de l'épaisseur de la calotte antarctique le conforte dans l'idée que l'hémisphère sud est actuellement dans une période glaciaire. Il tente de l'expliquer en invoquant la différence de durée des saisons et donc d'insolation entre les deux hémisphères (voir sur la Fig. 14 sa représentation de l'orbite terrestre et de l'évolution de la position de la terre pendant sa révolution autour du Soleil). En tenant compte des calculs astronomiques sur la périodicité de la précession des équinoxes composée avec celle de la rotation de l'orbite terrestre autour du soleil, Adhémar en déduit correctement qu'« il doit s'écouler 21 000 ans entre l'époque actuelle et le moment où les saisons correspondront aux mêmes points de l'orbite […] On doit nécessairement conclure de ce qui précède qu'après un intervalle d'environ 10 500 années l'ordre des saisons sera renversé par rapport aux principaux points de l'orbite terrestre […] la durée totale de l'automne et de l'hiver réunis de notre hémisphère surpassera d'environ 8 jours la durée totale de l'automne et de l'hiver réunis de l'hémisphère austral. » Cette différence devrait donc entraı̂ner une alternance régulière des périodes glaciaires entre les deux hémisphères car, selon Adhémar, « il est évident que pendant un hiver du pôle antarctique, il se formera plus de glaces vers ce pôle qu'il ne s'en formera au pôle arctique pendant l'hiver correspondant, et cette différence répétée pendant plusieurs milliers d'années, finira par devenir considérable. »
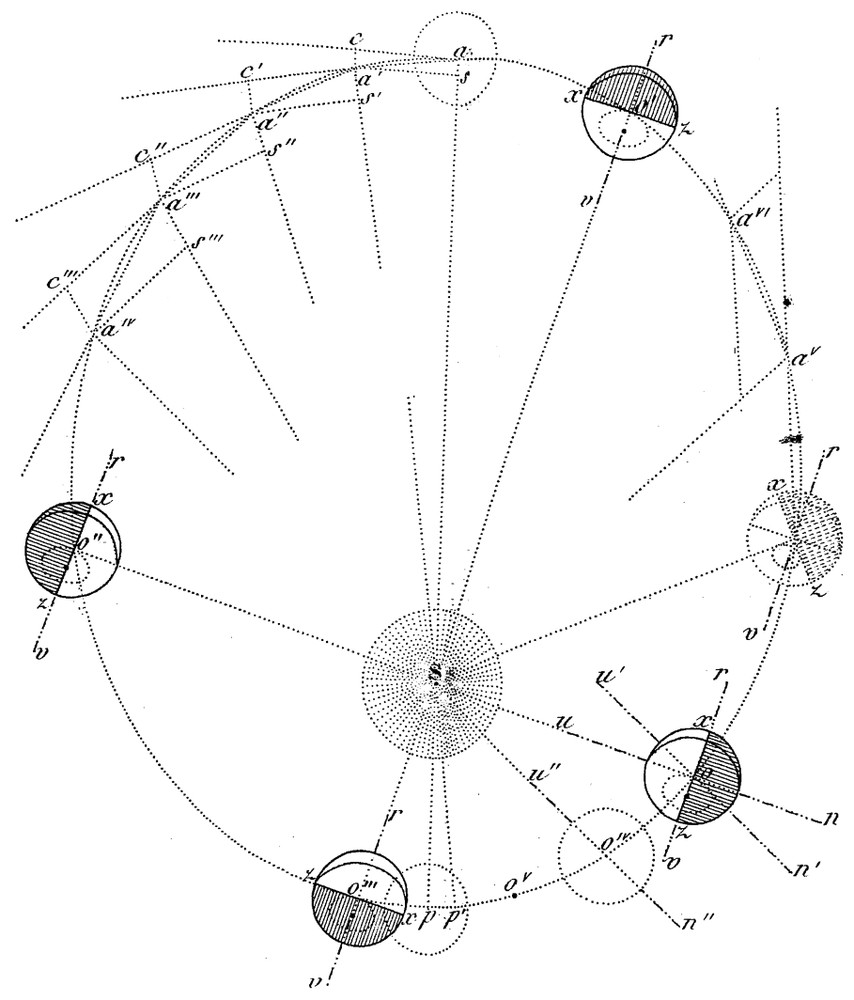
Plate by Joseph Adhémar [1] representing the terrestrial orbit and the evolution of the position of the Earth during its revolution around the Sun.
Gravure par Joseph Adhémar [1] représentant l'orbite terrestre et l'évolution de la position de la Terre pendant sa révolution autour du Soleil.
On peut souligner qu'Adhémar a conscience de la complexité du système climatique. Son scénario de déglaciation d'un hémisphère s'accompagne par exemple d'un mécanisme de débâcle généralisée, qu'il met en parallèle avec les catastrophes décrites par Cuvier [19]. Après avoir lu les ouvrages océanographiques du lieutenant américain Matthew Fontaine Maury (1806–1873) [36], Adhémar complète son étude et fait intervenir les courants océaniques à grande échelle pour expliquer la connexion rapide des phénomènes climatiques entre les deux hémisphères. La gravure de la Fig. 15 donne sa représentation imagée de ce que nous appellerions aujourd'hui la circulation thermohaline. À ce propos, Adhémar écrit que « les eaux chaudes, attirées vers le pôle par le vide provenant de la condensation des vapeurs, seront refroidies par leur contact avec les glaces dont elles feront fondre le contour ; et, rendues plus pesantes par ce refroidissement, elles formeront au-dessous du courant d'eaux chaudes un contre-courant d'eaux froides, qui, en partant du pôle, viendra remplir le vide formé dans les mers équatoriales par l'ascension des molécules échauffées par le soleil ».
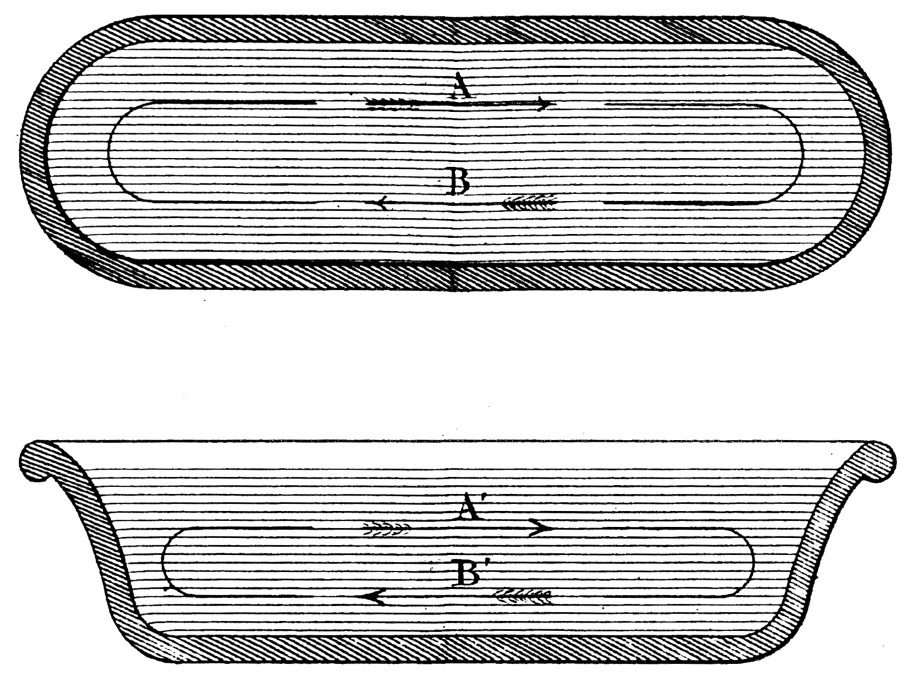
Plate by Joseph Adhémar [1], showing a bath tub to illustrate schematically the meridian circulation of the ocean at the surface and at depth.
Gravure par Joseph Adhémar [1] schématisant dans une baignoire la circulation méridienne de l'océan en surface et en profondeur.
De nombreuses critiques s'élèvent contre les idées d'Adhémar. Plusieurs auteurs ne veulent pas croire que l'hémisphère sud est en moyenne beaucoup plus froid que l'hémisphère nord. Bien qu'il ne se soit pas rendu lui-même dans les régions polaires, Adhémar sermonne ces « savants, assis au coin de leur feu, [qui] croient pouvoir assurer qu'un hémisphère n'est pas plus froid que l'autre ». Devant le manque cruel de données climatiques sur ce problème, Adhémar affirme aussi « que l'on doit regarder les pôles comme les baromètres de la terre, et que les observations faites dans le voisinage de ces régions si intéressantes et cependant si peu connues nous apprendront plus de choses en physique et en météorologie que toutes les indications incertaines de nos baromètres parisiens ».
D'autres scientifiques prétendent, à tort, que sa théorie des transitions glaciaires est incompatible avec certaines observations faites sur le niveau marin. En particulier, des données historiques montrent que le niveau de la mer Baltique descend régulièrement depuis des siècles. Nous savons aujourd'hui que cette tendance régionale est due au phénomène de réajustement isostatique qui a suivi la fonte relativement rapide de la calotte scandinave. Ce phénomène géophysique n'est évidemment pas à l'ordre du jour au milieu du XIXe siècle, mais Adhémar entrevoit déjà la complexité spatiale et temporelle du phénomène de déglaciation, en affirmant que « la surface de niveau des mers pourra être modifiée d'un très grand nombre de manières, et la recherche des différentes formes que doit affecter cette surface dans chaque cas, sera certainement un intéressant problème de haute mécanique » (le lecteur intéressé se réfèrera à l'article sur la variation du niveau des mers, par Kurt Lambeck, dans ce numéro).
La principale opposition à la théorie d'Adhémar sur l'inégalité de la température des pôles découle en fait des calculs astronomiques eux-mêmes, en particulier ceux réalisés plusieurs décennies auparavant par le Français Jean Le Rond d'Alembert (1717–1783) et l'Anglais William Herschell (1738–1822). En réalité, la différence saisonnière de durée d'insolation des hémisphères est exactement compensée par le fait que la distance Terre–Soleil varie en fonction de la position de la Terre sur son orbite. Comme le soulignent de façon définitive deux naturalistes célèbres de l'époque, l'Anglais Charles Lyell [35] et l'Allemand Alexander von Humboldt (1769–1859), ce qui importe pour un hémisphère, c'est la quantité de chaleur reçue au cours de l'année, et non la durée d'insolation.
Quelques années plus tard, le géologue écossais James Croll (1821–1890) reprend la théorie astronomique des glaciations en tenant compte des variations de la précession des équinoxes [16] et de l'excentricité de l'orbite [17], terme dont la variation n'était pas connue par Adhémar. En se plongeant dans les travaux de mécanique céleste publiés par les Français Pierre Simon de Laplace (1749–1827) et Urbain Le Verrier (1811–1877), Croll comprend vite l'erreur d'Adhémar et élabore une théorie plus complexe, fondée sur l'effet du contraste saisonnier de l'insolation. Il souligne particulièrement le facteur limitant qu'est l'insolation d'hiver sur l'accumulation de la neige et la formation de la glace. Croll a pleinement conscience du fait que l'amplitude des variations de l'insolation est assez limitée. Il invoque donc des phénomènes amplificateurs comme l'effet de réflexion de la neige, ou l'influence de la dynamique de l'atmosphère et de l'océan. À ce sujet [18], Croll écrit que « l'énorme effet qu'ont les courants marins pour égaliser la température de notre globe, en diminuant la différence entre les températures de l'équateur et des pôles, n'a jamais été estimé proprement. Ceci sera fait, tout simplement, si nous considérons un moment l'effet produit par un seul courant, c'est-à-dire le Gulf Stream » et, après de nombreux calculs, il en conclut qu'« il y a par conséquent à peu près autant de chaleur transférée des régions tropicales par le Gulf Stream qu'en reçoit du soleil l'ensemble des régions arctiques ». Croll explique ensuite que le contraste de température entre les latitudes a dû changer dans le passé, faisant varier l'intensité des vents et par voie de conséquence la force et la direction de grands courants marins comme le Gulf Stream. Il est ainsi un des premiers à introduire la notion de rétroaction positive pour expliquer l'amplification d'un faible forçage externe sur le système climatique.
À l'appui de son argumentation théorique, Croll utilise aussi des indices géologiques comme ceux qui montrent que le niveau marin a fluctué assez récemment tout autour des ı̂les Britanniques. Il cite en particulier la présence de sédiments marins surélevés d'une dizaine de mètres par rapport au niveau actuel, ainsi que d'anciennes forêts et des tourbières submergées retrouvées en Écosse et dans d'autres pays d'Europe.
En tenant compte des effets combinés des paramètres astronomiques que sont la précession et l'excentricité, Croll calcule que la dernière glaciation a débuté il y a environ 240 000 ans et que la dernière période chaude dure depuis 80 000 ans [17]. Dans une ultime étape, il complète sa théorie en intégrant les changements de l'obliquité de l'axe de rotation de la Terre [18]. Croll comprend que ce nouvel effet est particulièrement sensible aux latitudes élevées ; cependant, il ne dispose pas de données exactes sur les variations temporelles de l'obliquité qui lui permettraient de quantifier les effets cumulés des trois paramètres de l'orbite terrestre. Il faudra attendre un demi-siècle avec les travaux du mathématicien serbe Milutin Milankovitch (1879–1958) pour une formulation complète de la théorie astronomique et les premiers calculs précis de l'insolation aux différentes latitudes.
6 Périodes interglaciaires, homme antédiluvien et rotation du carbone
Parallèlement aux recherches de Croll, de nombreux géologues continuent d'étudier et cartographier les traces laissées par les anciens glaciers (par exemple, [34]). Les nouvelles prospections révèlent une complexité bien supérieure à la vision d'Agassiz d'une seule grande glaciation caractérisée par une immense, mais unique, calotte polaire. En effet, le géologue écossais Archibald Geikie (1835–1924) et son frère James Geikie (1839–1914) montrent de manière convaincante que plusieurs phases glaciaires se sont succédé. Cette conclusion découle de la découverte de petits niveaux stratigraphiques intercalés [29], contenant des fossiles de végétaux comme le noisetier, le chêne, le saule, et l'aulne et des ossements d'aurochs, de daims et de chevaux. Ces plantes et animaux n'auraient évidemment pas pu survivre en condition glaciaire. Les phases froides ont donc été entrecoupées de périodes interglaciaires caractérisées par un climat tempéré similaire à l'actuel, voire plus chaud.
Ces travaux géologiques et paléontologiques culmineront avec la parution en 1874 du livre de James Geikie intitulé The Great Ice Age and its relation to the antiquity of Man [30], ouvrage qui synthétise toutes les connaissances du moment sur le sujet. L'auteur y décrit particulièrement bien les alternances entre moraines et sédiments tourbeux observées en Écosse dans des affleurements naturels ou artificiels, ainsi que dans les premiers sondages géologiques. La difficulté majeure tient au fait que la stratigraphie des phases les plus anciennes est souvent perturbée par la dernière glaciation et qu'« il est clair qu'une grande partie des moraines formées pendant la première et les périodes froides suivantes est charruée complètement par les calottes de glace successives, tandis que la partie la plus importante est tellement modifiée et réarrangée qu'elle en devient une nouvelle moraine. » Geikie souligne l'importance extrême qu'il faut accorder à ces sédiments interglaciaires malgré leur maigre aspect, et qu'« il y en a assez pour s'assurer de l'ampleur passée des niveaux intercalés. La valeur géologique d'un dépôt n'étant habituellement pas mesurée par sa puissance […] Le miracle n'est pas tant qu'ils soient aussi discontinus, mais plutôt qu'il en subsiste une portion. »
Comme le suggère la seconde partie du titre de son livre, Geikie affirme aussi que l'homme préhistorique habitait l'Angleterre pendant la dernière période interglaciaire et la dernière glaciation, ce que prouve la présence d'outils en silex taillé. Cela lui inspire même la réflexion qu'« il est fascinant de penser par l'imagination à ces grandes révolutions géologiques dont il a été le témoin ». Un débat au sujet de l'homme antédiluvien débute en fait dès 1846, avec la démonstration de son existence par le Français Jacques Boucher de Perthes (1788–1868), qui fouille les terrasses alluviales glaciaires de la Somme [7]. Ce premier préhistorien s'attire les foudres de la communauté scientifique française. En particulier, Cuvier et Élie de Beaumont n'acceptent, ni le principe de l'évolution des espèces, ni la possible existence d'hominidés fossiles. Quelques années plus tard, la valeur des travaux de Boucher de Perthes est pourtant reconnue après la visite en France de plusieurs scientifiques britanniques comme Charles Lyell. Cette reconnaissance outre-manche conduit à d'autres découvertes de nombreuses traces laissées par l'homme préhistorique.
Parallèlement aux travaux réalisés en Europe, des géologues américains, en particulier Thomas Chrowder Chamberlin (1843–1928), cartographient systématiquement les moraines des États-Unis (voir sur la Fig. 16 sa carte du Wisconsin, datée de 1882 [9]). Peu de temps après, Chamberlin développe une classification des glaciations incluant cinq stades américains, qui reste encore utilisée de nos jours, le Wisconsinien étant la dernière glaciation et l'Illinoien l'avant-dernière (plus tard, Chamberlin s'intéressera à la formation de la Terre, et introduira la notion d'accrétion par ajout de planétésimaux). Des classifications similaires sont élaborées pour les régions européennes situées au sud de la mer Baltique et au nord des Alpes. Les noms donnés aux deux dernières glaciations sont le Weichselien et le Saalien, dans l'une des classifications, et le Würmien et le Rissien, dans l'autre. En fait, la classification alpine, publiée en 1909 par les géographes allemands Albrecht Penck (1858–1945) et Eduard Brückner (1862–1927) [37], n'est pas fondée sur l'étude des moraines, mais sur un autre type de preuve, que sont les séries de terrasses alluviales observées aux abords des affluents du Danube (Fig. 17).
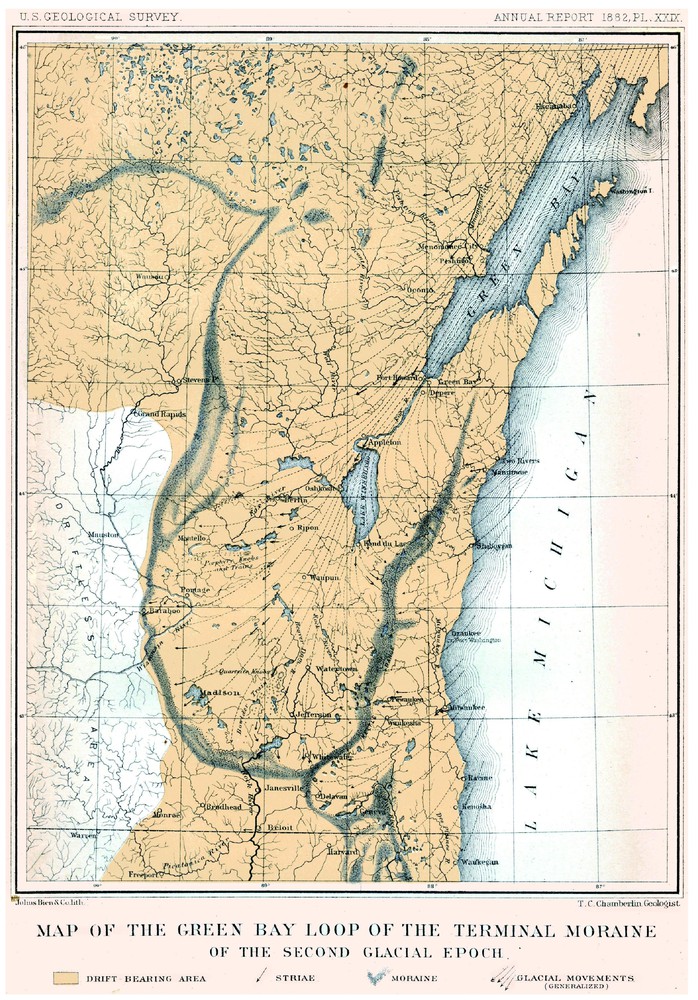
Map of the moraines of Wisconsin produced by Thomas Chrowder Chamberlin, which clearly shows a glacial lobe of the Laurentide ice cap [9].
Carte des moraines du Wisconsin réalisée par Thomas Chrowder Chamberlin qui montre clairement un lobe glaciaire de la calotte Laurentide [9].
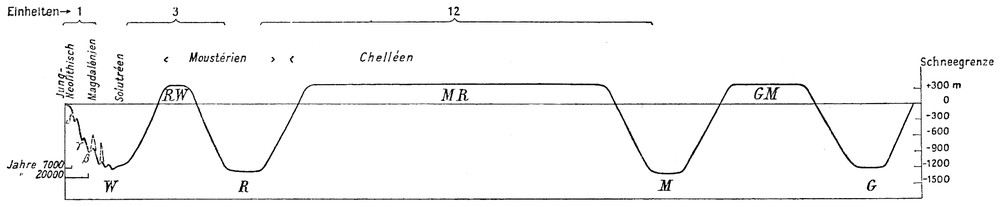
Palaeoclimatic curve summarizing the work of Albrecht Penck and Eduard Brückner on the glaciations of the Alps [37]. The initials W, R, M, G correspond to the Würm, Riss, Mindel and Günz glaciations, respectively. The durations of the two most recent periods are reported on the left side of the diagram. The y-axis represents the permanent snow line (height in metres compared to the present-day value). Some prehistoric cultures known at the time are indicated at the top of the curve.
Courbe paléoclimatique résumant les travaux d'Albrecht Penck et d'Eduard Brückner sur les glaciations des Alpes [37]. Les initiales W, R, M, G correspondent aux glaciations du Würm, du Riss, du Mindel et du Günz. Les durées de deux périodes récentes sont reportées à gauche du diagramme. L'axe des ordonnées représente la limite des neiges permanentes (en mètres par rapport à la valeur actuelle). Au-dessus de la courbe sont mentionnées quelques cultures préhistoriques connues à l'époque.
Cette multiplicité des phases glaciaires va tout à fait dans le sens de la théorie astronomique qui prévoit la rythmicité du phénomène. Pourtant, la théorie proposée par Croll est vivement critiquée par les géologues. En effet, les calculs fondés sur les variations combinées de l'excentricité et de la précession prévoient une alternance des phases glaciaires dans les deux hémisphères. Bien qu'ils ne disposent d'aucun argument stratigraphique pour corréler les observations du Nord et du Sud, beaucoup de géologues pensent que les glaciations ont été synchrones dans les deux hémisphères. Un autre test de la théorie de Croll est donné par son calcul de la durée de la période chaude actuelle qui a succédé à la dernière grande glaciation. Au XIXe siècle, la géochronologie absolue n'existe pas encore, mais quelques auteurs tentent des estimations à partir de l'érosion régulière de certains dépôts ou du comblement progressif par des sédiments postglaciaires. En supposant des taux d'érosion ou de sédimentation constants, les durées estimées varient entre 7000 et 33 000 ans. Bien qu'approximatives, elles sont donc très inférieures aux 80 000 années requises dans le cadre de la théorie défendue par Croll [17]. Suite à ses recherches débutées à la fin du XIXe siècle, le Suédois Gerard de Geer (1858–1943) publiera quelques décennies plus tard une estimation beaucoup plus fiable de la durée des temps postglaciaires, environ 8700 ans. Il détermine cette valeur en comptant les lamines annuelles (les varves) de sédiments déposés par l'eau de fonte de la calotte scandinave, lors de sa retraite vers le nord et de sa disparition totale [20–22].
Délaissant la théorie astronomique pour expliquer les glaciations, certains géologues comme Chamberlin se tournent vers une explication interne, liée à la Terre. En faisant intervenir les variations de l'effet de serre dû au gaz carbonique atmosphérique, il reprend les idées proposées par Tyndall quelques décennies plus tôt. L'évolution des connaissances en chimie et en géologie permet alors de faire un essai de quantification des variations climatiques.
Le chimiste suédois Svante Arrhenius (1859–1927) pense également que les périodes glaciaires ont été causées par des baisses de la teneur atmosphérique en gaz carbonique. Dans sa démonstration, publiée en 1896 [4], il utilise les observations des géologues sur l'extension des dépôts glaciaires : « en mesurant le déplacement de la limite des neiges, nous arrivons au résultat, concordant en différents lieux, que la température de cette époque a été de 4–5 °C plus basse qu'à présent ». Selon les calculs d'Arrhenius, ce refroidissement généralisé peut s'expliquer par une chute de l'ordre de 40 % de la teneur en gaz carbonique. Il envisage aussi des effets amplificateurs du système climatique, liés notamment à l'augmentation de la couverture neigeuse et aux courants océaniques.
Pour Arrhenius, ces travaux sur l'effet de serre sont assez marginaux, mais ils s'inscrivent dans le cadre de la Société de Physique de Stockholm qui réunit régulièrement des scientifiques intéressés par les problèmes de géologie, de météorologie et d'astronomie. Faisant référence aux travaux d'un de ses collègues géologues, Arrhenius explique aussi que la complexité du cycle naturel du carbone permet tout à fait d'envisager que de petites variations des flux puissent se traduire par des changements importants de la teneur en gaz carbonique de l'atmosphère, qui constitue le plus petit réservoir de ce cycle global. Arrhenius rappelle ainsi qu'à long terme, la teneur atmosphérique en CO2 est essentiellement maintenue par un équilibre dynamique, donc potentiellement instable, entre les « exhalaisons » volcaniques et l'altération chimique des silicates qui constitue un puits majeur de gaz carbonique.
Dans le même temps, Chamberlin [10–12] complète les notions sur le cycle du carbone utilisées par Arrhenius. Le géologue américain perçoit qu'il existe des effets rétroactifs qui contribuent à diminuer la teneur en gaz carbonique atmosphérique pendant les phases glaciaires. Il mentionne en particulier l'effet du refroidissement sur la solubilité du gaz. De plus, la mer expose à l'érosion chimique par l'acide carbonique, les roches qu'elle découvre en se retirant. Chamberlin décrit même l'effet de rétroaction du niveau marin sur le cycle du carbone. Cette notion sera reprise à la fin du XXe siècle et baptisée « l'hypothèse du récif corallien ». Chamberlin écrit alors que « durant les périodes d'expansion marine et de réduction continentale […], l'habitat des organismes calcaires augmente en conséquence, accélérant les mécanismes qui relâchent le dioxyde de carbone, ce qui est encore amplifié par le réchauffement résultant, lequel réduit la capacité d'absorption de l'océan et augmente la dissociation » [12]. Pour Chamberlin, ces multiples effets moduleraient la teneur en gaz carbonique en se surimposant à long et court termes, et seraient donc à l'origine d'une « action rythmique qui pourrait en partie expliquer les oscillations glaciaires » [10].
7 Leçons pour un futur déjà presque moderne
Comme l'illustrent bien les différents articles de ce volume, nous savons aujourd'hui que les deux grands types de facteurs climatiques, forçages externes et réarrangements internes, ont effectivement joué sur les échelles de temps allant du millénaire au million d'années. De nombreuses séries temporelles bien datées indiquent que la répartition de l'insolation exerce un contrôle majeur sur les différents compartiments du système climatique, comme l'atmosphère, l'océan, la cryosphère et le cycle du carbone. Les recherches actuelles soulignent l'importance d'interactions complexes entre les facteurs externes et les réarrangements internes du système climatique faisant intervenir les circulations de l'océan et de l'atmosphère, les transferts d'eau douce entre les différents compartiments du cycle hydrologique, l'extension et la dynamique interne des calottes de glace, ainsi que la teneur atmosphérique en gaz carbonique.
De plus, l'effet de serre est maintenant l'objet de vives inquiétudes, car la perturbation notable du bilan radiatif par les activités humaines provoquera, en toute logique, un réchauffement mondial de grande ampleur. Depuis la fin des années 1980, un groupe international d'experts a été mis en place par l'Organisation météorologique mondiale et l'Organisation des Nations unies (ONU). Ce comité, appelé le GIEC, pour Groupe d'experts Intergouvernemental sur l'évolution du climat (en anglais : IPCC pour Intergovernmental Panel on Climate Change), établit régulièrement un rapport de synthèse des résultats scientifiques acquis sur les changements climatiques et fournit des prévisions sur l'émission des principaux gaz à effet de serre et des aérosols [32].
Au XIXe siècle, en pleine révolution industrielle fondée sur l'utilisation intensive du charbon, peu de scientifiques se soucient des conséquences des activités humaines sur le long terme et à l'échelle mondiale. Le fait même que le progrès technologique puisse générer un quelconque désagrément ne semble affecter ni la communauté technique ni le personnel politique de l'époque.
On peut tout de même signaler que Fourier mentionne [28], parmi de nombreuses autres causes possibles de changements climatiques, que « l'établissement et le progrès des sociétés humaines […] sont propres à faire varier, dans le cours de plusieurs siècles, le degré de la chaleur moyenne. » Tyndall, quant à lui [47], envisage brièvement l'impact des variations possibles de la « couverture » de l'effet de serre, mais il rassure son lecteur en citant le physicien et physiologiste allemand, Hermann von Helmholtz (1821–1894), qui affirme que « l'histoire de l'Homme n'est qu'une petite ride à la surface de l'immense océan des temps. La persistance d'un état de la nature inorganique favorable à la continuation du séjour de l'homme sur la Terre semble assurée pour une période de temps bien plus longue que celle durant laquelle ce monde a déjà été habité ; de sorte que nous n'avons rien à craindre pour nous-mêmes, ni pour de longues générations après nous ».
Arrhenius, en revanche, est un peu plus préoccupé par l'impact des activités humaines. Il est le premier à prévoir une augmentation de la température moyenne de la Terre comme conséquence de l'utilisation industrielle des combustibles fossiles. Son article de 1896 [4] traitant de l'influence du gaz carbonique sur la température est particulièrement prophétique, compte tenu des données limitées dont il dispose. Arrhenius calcule qu'un doublement de la teneur en gaz carbonique consécutif au développement industriel, se traduirait par un réchauffement mondial de la planète de l'ordre de 5 à 6 °C. Il est assez stupéfiant de constater que cette prévision plus que centenaire est encore compatible avec celles publiées en 2001 [32] par les experts du GIEC ! Les calculs d'Arrhenius montrent encore que l'impact d'une augmentation de la teneur en gaz carbonique est amplifié aux latitudes les plus hautes. Il envisage aussi la rétroaction positive liée aux changements locaux de l'albedo dus à la régression de la couverture neigeuse. Arrhenius mentionne même une atténuation des cycles diurne et saisonnier, ainsi qu'une amplification du contraste de température entre océan et continent. Pourtant, le bouleversement climatique qu'il prédit ne l'inquiète pas réellement, il y voit même le moyen d'atténuer la rudesse du climat scandinave : « nos descendants, après plusieurs générations toutefois, pourraient donc vivre sous de meilleurs cieux et dans un environnement moins désolé que nous ne le connaissons à présent ».
1 Introduction
We are primarily indebted to the naturalists, physicists and chemists of 19th century who carried out the first scientific research on the greenhouse effect [31] and glaciations [33]. These two aspects of our climate can be studied separately but, as pointed out in this article, scientists at that time were interested in both subjects together, as well as the possible relationships between them.
During the 19th century, the scientific approach evolved from scientists with an encyclopaedic knowledge, such as Horace-Bénédict de Saussure, inventor and explorer, to specialized researchers such as Svante Arrhenius, whose theory on the dissociation of electrolytes in aqueous solution exerted a determining role on the development of physical chemistry. This work led to him being awarded the Nobel Prize for chemistry in 1903.
The insatiable curiosity of these pioneers was accompanied by many different skills in disciplines as varied as physics, geology, chemistry, biology and astronomy. Thus, John Tyndall contributed significantly not only to advances in thermodynamics but also to the study of glaciers. In the same way, Louis Agassiz became distinguished in the fields of palaeontology and glaciology. These scientists lacked precise measurement techniques and had no large-scale information in meteorology, oceanography or geology. But, as Joseph Fourier pointed out as early as 1822 [27], theory alone cannot be enough in these fields, because “mathematical analysis […] can derive the expression of natural laws from general and simple phenomena; however, the application of these laws to highly composite effects requires a long series of exact observations.” Thus, we can say the understanding of Quaternary glaciations was, at that time, about equivalent to our present-day knowledge of Precambrian climatic fluctuations. Nevertheless, the 19th-century pioneers often had prophetic and premonitory intuitions, although the observations at their disposal were as yet very fragmentary.
However, during the first half of the 20th century, our knowledge of ancient climates progressed very little. The principal fundamental concepts that we use today were developed during the 19th century. We need to wait until the 1950s to see a true revolution of the techniques of investigation, which eventually made it possible to obtain quantified palaeoenvironmental data and, above all, reliable dating results. These new tools, generally based on physicochemical techniques, then led to a reconstruction of the extent and timing of climatic changes and a comparison with theoretical predictions.
Another crucial advance also took place in the second half of the 20th century, with the study of all the compartments of the climatic system, in particular the ocean floor and the interior of the Greenland and the Antarctic ice caps. These observations were not accessible to the heroic pioneers whose contributions are illustrated in this article.
2 Flood, anthropolith, and mammoths
Until the end of 18th century, the majority of scientists still took as their reference the myth of the biblical Flood to explain the current configuration of the surface of the globe and the formation of sedimentary rocks. Towards the end of the 15th century, Leonardo da Vinci (1452–1519) criticized this simplistic interpretation, but his visionary ideas did not manage to convince the naturalists of his time. For sake of convenience, and not to move too far away from a literal interpretation of the biblical texts, the fossils of marine organisms were generally linked to this single event, which would have taken place approximately six thousand years ago. An example illustrating this tendency particularly well is the interpretation made of a fossil discovered at Oeningen close to Lake Constance. In 1726, the naturalist Johann Jakob Scheuchzer (1672–1733) wanted to see this fossil as the remains of a human drowned by the waters of the Flood ([41], see the Plate of Homo diluvii testis in Fig. 1). This skeleton even became a reference often quoted as undeniable proof of the veracity of the Genesis account. It would require the considerable anatomical skills of Georges Cuvier (1769–1832) in order to “refute the idea that it was an anthropolith” and to place this fossil in the biological classification: in fact, it corresponds to a giant salamander [19].
George Cuvier is especially known and celebrated for founding the science of paleontology. Although ferociously opposed to the emergent theories of evolution, Cuvier nevertheless seeks to explain the extinction of species and the discovery of fossils of animals that have disappeared. According to him, these important changes could be attributed to major environmental catastrophes [19]. Use of the plural here is of crucial importance, for Cuvier clearly considers the multiplicity of such catastrophic events. Thus, he does not assign all geological observations to a single Flood as claimed by religion. In his book Discourse on the revolutions of the surface of the Earth [19], Cuvier writes: “living beings without number were victims of these catastrophes: some, inhabitants of the dry land, were seen swallowed up by floods; [while] others, which populated the midst of the waters, were stranded along with the suddenly raised sea-bed.” At that time, naturalists wondered about the presence of gigantic bones in relatively recent deposits of the north of Europe and Siberia. Far from the fables of certain indigenous tribes, who saw these objects as the remains of giant moles, Cuvier correctly attributes these fossils to woolly elephants and rhinoceroses nowadays extinct (see Fig. 2, plate representing the mammoth exhibited at the museum of St-Petersburg in the 19th century). Cuvier further maintains that “in the countries of the North, [the last great catastrophe] had even left corpses of large quadrupeds trapped by the ice, which are preserved up to our days with their skin, their fur, and their flesh. If they had not been frozen immediately after being killed, putrefaction would have broken them down […] thus, the same event that made the animals perish also rendered their country glacial. This event took place instantaneously, without any gradation, and what is so clearly shown for this last catastrophe is hardly less [valid] for those preceding it.”
Geology also went on to contribute to the first thinking on ancient climates. In the 19th century, many naturalists and travellers were intrigued by the presence, in broad Alpine valleys, of many large boulders of rock, called erratic blocks, as well as numerous hillocks composed of rock debris, called moraines. These objects occur isolated in the midst of plains and are often of very different nature from the local bedrock (Fig. 3). In particular, enormous blocks of granite are located right in the middle of vast limestone terrains. Among others [8], the Genevan Horace–Bénédict de Saussure (1740–1799) was astonished by these blocks, and remarked ironically that “the granites are not formed in the ground like truffles, and do not grow like fir trees on the limestone rocks”. De Saussure also noticed that erratic blocks were located along the axes of Alpine valleys, which led him to assume that they had been carried by currents of incredible violence and magnitude. Observing that erratic blocks are made up of the same rocks as the highest peaks of the Alps, the naturalists concluded that these blocks had been transported over tens or even hundreds of kilometres. At the time, the theories about this transport still invoked the effects of the Flood, either directly by the mechanical effect of water, or indirectly by the transport of the rock blocks on ‘ice rafts’. This theory was formalized by the Scottish geologist Charles Lyell (1797–1875), and is based on the observations of explorers in polar regions (Figs. 4 and 5). Lyell writes: “in countries situated in high northern latitudes, like Spitzbergen, between 70° and 80° N, glaciers, loaded with mud and rock, descend to the sea, and there huge fragments of them float off and become icebergs … . Many of them were loaded with beds of earth and rock of such thickness, that the weight was conjectured to be from 50 000 to 100 000 tons […] Wherever they are dissolved, it is evident that the ‘moraine’ will fall to the bottom of the sea.” [35]. We will see further on that other scientists realized these blocks were transported by the ice itself, as can be observed in present-day glaciers.
Like a good number of naturalists of the time, de Saussure was above all impassioned by what we nowadays call alpinism. His many excursions are reported in his famous work Voyages in the Alps [40]. Since adolescence, de Saussure had been fascinated by the Mont-Blanc and dreamt one day to become the first to climb its snow-covered summit. In 1767, he made a journey around the mountain via the ‘Allée Blanche’, but only managed to climb it in 1787, just one year after the very first ascension by two Chamonix mountaineers.
De Saussure's interest in the mountain is also related to his scientific research, particularly in the fields of climatology and physics. He is indeed the inventor of the ‘hair hygrometer’, an instrument that became to be used over the following two centuries by meteorologists throughout the world. His other major invention is a solar energy collector, which was developed with the objective of studying solar radiation and its calorific effects at various altitudes. This device, which he called a ‘heliothermometer’, consisted of a series of boxes nested one inside the other, with one side being made of glass. Each box is thermally insulated from the next box by a layer of cork, and its bottom is painted black to minimize the heat losses by reflection. Mercury thermometers, placed on the glass windows, make it possible to read the temperatures inside the various nested boxes (Fig. 6). By testing several configurations changing the number and geometry of the boxes (planar or hemispherical), de Saussure showed that his ‘heliothermometer’ could have some practical applications, for example, for boiling water or even cooking food. For this reason, the heliothermometer is really the ancestor of the solar panel.
Owing to this clever device, de Saussure also proved that, contrary to what some thought at the time, heat could not accumulate indefinitely, but that a balance is created between the collecting of solar radiation and the thermal losses. While transporting his invention to the top of Mont-Blanc, de Saussure sought to show experimentally that the intensity of the solar radiation does not depend on altitude, and that, in particular, the temperature inside the sensor does not vary directly with the outside temperature. It was only during the following century that the observations of the Genevan naturalist became formalized by the physical laws governing the diffusion of heat and the properties of the black body.
3 Solar constant, ultra-red rays and the blue of the sky
The scientific concept of the greenhouse effect was introduced by the French physicist Joseph Fourier (1786–1830). In 1824, Fourier published his General Remarks on the temperatures of the globe and planetary spaces [28], where he presents the idea according to which the atmospheric envelope of the Earth would behave like the glazing of a greenhouse. In connection with the ‘heliothermometer’ described above, Fourier writes: “the temperature can be increased by interposition of the atmosphere, because heat in the form of light finds less of an obstacle in penetrating through the air than if heat passes again through the air after being converted into radiant heat” [nowadays called infrared radiation].
Owing to his theoretical work on the diffusion of heat, Joseph Fourier came to understand remarkably well the role of the fluid envelopes of our planet in the transfer of heat on a large scale. He affirms that, after the Earth is plunged into the “cold temperature of the inter-planetary sky, [it] is warmed up by the solar rays whose unequal distribution produces the diversity of the climates” and that “all the terrestrial effects of the heat of the sun are modified by the interposition of the atmosphere and the presence of the ocean. The major movements of these fluids make the distribution of temperatures more uniform” and “in the Ocean and lakes, the coldest molecules, or rather those with the greatest density, move continuously towards the lower regions, and the movements of heat due to this cause are much faster than those taking place in solid masses by virtue of their conductive properties”.
In the years 1820–1830, the French physicist Claude Pouillet (1790–1868) carried out research on the propagation of solar radiation [38,39]. Using a ‘pyrheliometer’ of his own design, Pouillet performed early measurements of the heat flux generated by the Sun's rays. This apparatus consists of a thermometer that measures the change in temperature of a large water tank whose upper planar face, oriented perpendicular to the rays of the Sun, is painted black (Fig. 7). After a given time, the difference in temperature obtained during the warming makes it possible to calculate the heat flux received (or energy input rate), which can be evaluated knowing the heat capacity of water [39]. In an empirical approach, Pouillet determined that this warming would be the product of two parameters: on the one hand, “the solar constant, or that which contains, as an essential element, the constant calorific power of the Sun” and, on the other hand, the “atmospheric constant, or that which contains, as an essential element, the variable capacity of transmission possessed by the atmosphere allowing the arrival of more or less large proportions of incident solar heat at the Earth's surface”. This second constant is carried to the power of a geometrical coefficient that takes account of the thickness of atmosphere traversed during the experiment performed using the pyrheliometer. In his calculations, Pouillet in fact underestimated the value of the ‘atmospheric constant’, as well as the extent of the reflections along the incident path (i.e., the albedo). Consequently, the ‘solar constant’ obtained by Pouillet was only half of the true value, which led him to obtain a relatively low temperature for the surface of the Sun (approximately 1800 °C). Half a century later, this value was corrected and more than doubled by Josef Stefan (1835–1893). In 1879, this physics professor at the University of Vienna provided us with the empirical but nevertheless correct demonstration that the energy of the total radiation of a black body is proportional to the fourth power of its temperature above absolute zero.
Pouillet also tried to calculate the influence of the absorption of the solar radiation, as well as that emitted by the Earth, on the temperature of the atmosphere. In his paper of 1838 [39], he gives an account of theoretical calculations of general application concerning a sphere covered with a ‘diathermic’ envelope, i.e., permeable to heat, the whole being included in an enclosure raised to a variable temperature. By taking account of the heat transfers between the sphere and the enclosure, Pouillet showed that it was possible to heat up the sphere by several tens of degrees. The necessary condition is that the envelope should exhibit a greenhouse effect, i.e., characterized by different absorption coefficients for fluxes coming from the sphere and the enclosure, respectively. Returning to a case closer to the terrestrial system, Pouillet writes that “it is enough that the sphere is protected by a diathermic envelope endowed with the double property of absorbing only half of the heat emitted by the surface of the enclosure, and absorbing, on the contrary, approximately nine tenths of the heat emitted by the sphere surface”. Pouillet specifies that, even “when the atmosphere has all the appearances of perfect serenity, it still absorbs about half of the quantity of heat which the Sun emits towards the Earth, and it is only the other half of this heat which comes to fall on the surface of the ground, and which is variously distributed there, according to whether it crossed the atmosphere with a more or less large angle of obliquity […] As for solar heat, there is no doubt: we know that in crossing diathermic substances, it is less absorbed than the heat coming from the various terrestrial sources whose temperature is not very high. It is true that we have only been able to perform experiments on solid diathermic screens or liquids; but it appears certain that the atmospheric layer acts in the manner of the screens of this type, and that, consequently, it exerts a greater absorption on the terrestrial rays than on the solar rays.”
In fact, it is the Irish chemist and engineer John Tyndall (1820–1893) who presented the first experimental data on the absorption and emission of infrared rays by gases [44,46,47]. Tyndall is particularly noted for the meticulous experiments that he carried out using a spectrophotometer of his own design, whose tube could be filled with different mixtures of gases at variable pressures (Fig. 8). His analyses relate to the absorptive power of many compounds such as water vapour, carbon dioxide, methane, nitrous oxide, various organic molecules, halogenous compounds and finally ozone (besides, he was the first to write that ozone consists of groups of oxygen atoms). Tyndall even measured the absorptive powers of the vapours of several perfumes, such as oil of lavender and patchouli! His results, obtained at various pressures, show that absorption increases linearly until a threshold of pressure, characteristic of the compound, above which the phenomenon reaches saturation. On the other hand, he also showed that simple gases such as oxygen, nitrogen and hydrogen are themselves practically transparent to infrared rays (which he called ‘ultra-red rays’).
Also being interested in the terrestrial environment, Tyndall was convinced of the importance of the greenhouse effect in climatology. In his work Heat, a mode of motion [47], he insists on the importance of the retention of heat by water vapour: “regarding the earth as a source of heat, I estimate that at least 10 per cent of its heat is intercepted within ten feet [first three metres] of the surface. This single fact suggests the enormous influence which this newly developed property of aqueous vapour must have in the phenomena of meteorology.” Tyndall moreover provides the evidence of this by presenting weather data showing that the night variation of the air temperature is correlated negatively with its moisture. Tyndall depicts with dramatic effect a vision of England with its atmosphere deprived of the greenhouse effect, “this aqueous vapour is a blanket more necessary to the vegetable life of England than clothing is to man. Remove for a single summer night the aqueous vapour from the air that overspreads this country, and you would assuredly destroy every plant capable of being destroyed by a freezing temperature. The warmth of our fields and gardens would pour itself unrequited into space, and the sun would rise upon an island held fast in the iron grip of frost […] its presence would check the earth's loss; its absence, without sensibly altering the transparency of the air, would open wide a door for the escape of the earth's heat into infinitude.”
Tyndall made other discoveries that were more or less attached to climatology. As a margin to his work on the diffusion of light by macromolecules (the Tyndall effect, which has practical applications in chemistry), he was the first to suggest that the blue of the sky is due to the diffusion of sunlight by molecules in the air: “the blue of the sky is scattered light; [it] is produced by perfectly colourless particles. Smallness of the size alone is requisite to ensure the selection and reflection of this colour.” Still using his spectrophotometer, Tyndall also carried out experiments on the absorption of infrared radiation by lampblack. We also attribute to Tyndall the first measurements of air pollution, which he performed using the principle of the absorption and diffusion of infrared radiation by carbonaceous aerosols and dust disseminated in the air of London.
High mountains were also a focus of major interest for Tyndall. He visited the Alps every year, and even became the first to climb the Swiss peak of Weisshorn. He summarized his experience of mountaineering in the popular works Glaciers of the Alps [43] and Mountaineering in 1861 [45]. Otherwise, in collaboration with Thomas Henry Huxley (1825–1895), he published a scientific study on the structure, functioning and variations of glaciers [47]. Using experiments with clay and water (Fig. 9), these authors try to show that the movement of glaciers is not that of a simple viscous fluid but that the ice mimics the behaviour of a river through a process of fragmentation followed by ‘regelation’.
Even if his contribution has been forgotten later on, Jacques Joseph Ebelmen (1814–1852), professor at the ‘École des mines’ in Paris and Director of the Royal Works of porcelains in Sèvres, was the first to suggest that past changes in the carbon cycle could have changed the atmospheric concentration of ‘carbonic acid’ and, as a direct consequence, the climate of the Earth [6,23]. This pioneer geochemist wrote in 1845 [23] that “many circumstances nonetheless tend to prove that in ancient geologic epochs the atmosphere was denser and richer in carbonic acid and perhaps oxygen, than at present. To a greater weight of the gaseous envelope should correspond a stronger condensation of solar heat and some atmospheric phenomena of a greater intensity.” Some years later, Tyndall also stated that “all the changes of the climate revealed by the research of geologists” could be due to variations in the contents of the atmospheric greenhouse gases.
4 Glacial striations, boreal and austral ice-masses
Studies on the morphology and geology of the Alps are indeed at the origin of many scientific advances, in particular concerning the extension of glaciers in the past. As mentioned above, scientific thinking on this subject was sparked off the presence of erratic blocks, which are rocks characterized by their formidable size, irregular shape and strange positions that are difficult to explain in terms of transport by water (Fig. 3). A liquid transport agent cannot explain certain facts, such as the distribution of bulky blocks of different geological nature on the banks of the same valley, or even the presence of some erratic blocks located at high elevations than the outcrops from which they were torn off. In addition, many features in alpine valleys remained enigmatic, including moraines and deposits of rock debris lacking any stratification or sorting, as well as the presence of smooth sheepback rocks (roches moutonnées) marked by deep scratches (Fig. 10).
Based on their observation of present-day glaciers, some Swiss mountain dwellers and scientists however understood that transport by the ice could explain these enigmas in a simple way. In particular, the terminal moraines piled up by the glaciers have equivalents lower down in the valleys, which suggests that the glaciers were formerly more extensive. Furthermore, some historical documents corroborate these geological studies: certain cols, practicable in the Middle Ages, are no longer accessible because of the recent accumulation of ice. Built structures have even been destroyed by the advance of glaciers.
Some scientists saw in these fluctuations the imprint of a true climatic change. Ignace Venetz (1788–1859), chief-engineer for the ‘Canton du Valais’ (Switzerland), noted changes in the distribution of certain plants, both wild and cultivated, which followed the variations of the Alpine glaciers [49]. His book written in 1821 gathers together many anecdotes, such as stories about the persistence of taxes raised for growing vines, walnut trees or turnips, while at the same time the land, located high up, became sterile. For Venetz, the variation in the location of the fronts of alpine glaciers constitutes the best evidence of recent climatic change. In particular, he gives details in the case of the Rossboden Glacier located southwest of the village of Simplon (Fig. 11). The terminal moraines mapped by Venetz are approximately 200 m lower in altitude than the front he observed at the beginning of 19th century. In common with many alpine glaciers, the Rossbodegletscher has retreated further by approximately 200 m in altitude since that time. Venetz then makes a short list of the causes that might be invoked to explain these consistent observations of climatic fluctuations during the last few centuries. From the outset, he eliminates slow variations of the terrestrial orbit “since astronomical calculations have proved that the variations of the pressure of the ecliptic could not produce them”.
Jean de Charpentier (1786–1855), director of mines of the ‘Canton de Vaud’ and emeritus professor of geology at the Academy of Lausanne, takes up again the observations of Venetz, applying them more generally for his own purposes [13–15]. De Charpentier even writes, in a premonitory way, that “it seems that, since 1818, a return of heat took place in our regions, for it is generally noticed that the majority of the glaciers and almost all the high-firns have decreased since 1818. If this increase in temperature were maintained for one or two centuries, there is no doubt that the passes of the Alps most blocked by snows would become once more practicable” [15].
The idea of transport of large rocks by the ice also seems evident for the Norwegian Jens Esmark (1763–1839), professor of geology at the University of Christiana (today Oslo). By observing the glacial landforms all around him, Esmark puts forward the hypothesis that Scandinavia was formerly covered with an immense cap of ice that extended to the fjords [3,25]. According to him, even the sea was frozen at that time. Although Esmark's observations and conclusions, published in 1824 and 1827 are exact in their principle, he is mistaken on the chronology of the glaciation, which he extends right back to the origins of the Earth. Indeed, he was influenced by a theory in vogue at the time about the formation of the Earth. This theory considered that our planet developed from an old comet following an orbit whose eccentricity decreased regularly with time, and thus would have approached the Sun. According to this theory, the ice ages would correspond to the periods of aphelion when the ‘terrestrial comet’ was far away from the Sun.
The scientific community was for the most part reticent towards all these new ideas. Far from the field, the naturalists of the learned societies remained persuaded that only liquid water could transport the erratic blocks over long distances. Nevertheless, some discerning and determined authors succeeded in giving substance to the glacial transportation theory. The local observations made by mountain dwellers such as Jean-Pierre Perraudin, were generalized by scientists like Venetz, de Charpentier and, later on, by Louis Agassiz (1807–1873). This young professor of geology at the University of Neuchâtel had already acquired an international notoriety, thanks to his work on fossil fish. In 1836, de Charpentier invited Agassiz and Venetz to stay during the summer in his house at Bex. De Charpentier gave Agassiz a real course of practical work, which took in the results patiently accumulated over more than ten years [15,42]. At the start, each of these three personalities had real doubts about the possibility that glaciers had formerly expanded over larger areas than at the present day. But, gradually, the field facts lead them to consider an increasingly larger extent for these fossil glaciers. Venetz imagined a glacier that would have extended in former times from the Alps as far as the Jura, whereas Agassiz affirmed that, during the ‘ice age’, a gigantic ice sheet covered large parts of the Northern hemisphere as far south as the Mediterranean.
De Charpentier distinguished himself particularly by comparing present-day glaciers with traces making up the ‘erratic terrain’ ([15] see Fig. 12, showing his sketch of the effects at the junction between two contemporary glaciers and the relationships with their morainal deposits). For this researcher, “the hypothesis of diluvian glaciers is the only one that explains satisfactorily, down the smallest detail, all the phenomena of the erratic terrain.” According to him, refusing the idea of an eventual transport of enormous blocks by glaciers is a completely unfounded attitude, because “there exists no block large enough to resist the expansive force of the ice, just as no block is ever too heavy to prevent a glacier from carrying it for considerable distances. The Blaustein rock in the Saas valley is a block of serpentine with a volume of 244 000 cubic feet that was transported approximately 100 years ago by the present-day glacier of Matmark or Schwarzberg. The largest erratic block that I know of is the monster-block of Devens, which, with a size of 161 000 cubic feet, however attains only two thirds of the volume of Blaustein. It is thus not beyond the limits of probability that the transport of blocks of lesser volume than Blaustein may be attributed to diluvian glaciers”.
A reproach often made towards advocates of the glacial theory was the difficulty of finding causes for these climatic changes of great magnitude. De Charpentier stresses that this easy criticism makes rather a bad case: “It would thus be illogical to reject the glacial hypothesis for the sole reason that we have not succeeded up until now to demonstrate the cause of the extraordinary development of the diluvian glaciers”. In fact, the same problem of absence of cause also concerns the other theories suggested at the time: indeed, few authors worry about the origin and fate of the waters of the Flood. Seeking to determine the ultimate reason for ancient glaciations, de Charpentier [15] calls upon astronomical causes, but without too much conviction, “such as, for example, a change of the ecliptic, the precession of the equinoxes, the progression of the planetary system in space, the asteroids of August and November, etc.”
The spread of the glacial theory was marked by some prophetic presentations, but these were unfortunately very poorly received by the majority of scientists of the time. In 1816, Venetz presented his views in Bern during the annual meeting of the Swiss Society of Natural Sciences; de Charpentier tried to convince his peers during the Lucerne meeting of 1834; finally, Agassiz shocked his audience in Neuchâtel in 1837 during his opening speech as President of this learned society. In the mind of Agassiz, the concept of the ice age corresponds to a catastrophe in the sense of Cuvier. Indeed, a few years earlier, this French scientist had received his Swiss colleague visiting his laboratory of palaeontology. For Agassiz, the water of the biblical Flood had to be replaced by a gigantic glacier which he even called the ‘God's great plough’.
These studies were supplemented by a raft of meticulous observations on the alpine glaciers, and then became the object of synthetic publications. Agassiz and de Charpentier published, respectively, Studies on the glaciers [2] and Essay on the glaciers and the erratic terrain of the Rhone Basin [15], two works that came off the press in an interval of five months. During the following decades, the glacial theory managed to gain favour, benefiting from new incontrovertible observations both in Europe as well as in North America. Agassiz succeeded in convincing famous British scientists such as William Buckland (1784–1856) and Charles Lyell. These two professors, of the universities of Oxford and London, soon became the best advocates of the glacial theory. On the other hand, Agassiz had less success on the French side, in particular running up against the scepticism of Léonce Élie de Beaumont (1798–1874), successor of Cuvier at the Collège de France. Although Élie de Beaumont studied the erratic blocks and ‘roches moutonnées’ of North Grimsel in the Alps and in many areas of the Vosges, he sets aside the concept of glaciations due to “insurmountable difficulties”. His scepticism is also related to the fact that certain enthusiasts of the glacial theory wanted to see traces of ice action everywhere. For example, ‘roches moutonnées’ with glacial striations are described in the sandstones of the forest of Fontainebleau, whereas these blocks are merely polishing tools used by humans of the Neolithic era to make axes. As with many scientists of the time, Élie de Beaumont still fully held to the ice rafting theory, maintaining that “the erratic blocks of the north would thus not represent rolled stones, an idea otherwise excluded by the exact preservation of their edges, but are rather floated stones. These stones would have been floated due the specific lightness of the ice, like scoriae and pumice, etc.” [24].
Along with the study of glaciers, investigations of the polar ice caps also contributed to the debates on incipient science of climatology. In the middle of the 19th century, several expeditions were carried out to Greenland and in the Antarctic Ocean, helping to convince naturalists of the existence of vast ice caps in the polar regions (Fig. 4). Sea captains, such as the Frenchman Jules Dumont d'Urville in 1838–1840 and the Englishman James Ross in 1841–1843, thus provided the first descriptions of the Antarctic ice cap. However, the size and the topography of this cap remained completely unknown, even if some scientists put forward hazardous estimates. As a historical example, in 1842 [1], the Frenchman Joseph Adhémar (1797–1862) evaluated the average thickness of the Antarctic cap at 100–200 km! This author, who undertook other more fertile research as described further on in this article, based himself on estimates – unfortunately non-representative – of the depths of the Southern Ocean, which appeared much greater than the oceans of the boreal hemisphere. From this, he inferred that the water of the ocean is attracted by the gravity of a very massive body located at the South Pole, which could only be the Antarctic cap, and around which explorers had only mapped the circumference. The Plate of Fig. 13 presents his view of the matter, showing a cross-section of the Earth, with its three terrestrial spheres, solid, liquid and gaseous; the respective centres of these spheres are shifted because of the dissymmetry of the two polar caps (boreal and austral ice-masses). Indeed, in his work Revolutions of the sea, periodic floods [1] Adhémar writes that “in the vicinity of the boreal pole, the sea has an average depth of no more than 300 fathoms [ca. 0.5 km], while in the southern hemisphere, we obtain more than 2000 fathoms [ca. 3 km] and more often still we do not find the bottom […] Thus, a force must exist that attracts the centre of the fluid sphere towards the South pole, and this force is none other than the enormous mass of ice accumulated on this part of the Earth […] It results from the previous calculations that a frozen cap of 20-league [ca. 90 km] average thickness will be sufficient to maintain almost the totality of the seas at [an elevation of] nearly one league above the continents of the southern hemisphere.”
Adhémar probably realized that the idea of such a cap is difficult to accept, but, to convince his reader, he adds that “many people only accept things that resemble those that they know. If somebody saw a 20-m thick ice floe, we could tell him that there are some 21 m thick; but when you pass without a gradation from 20 m to 20 leagues, it takes some time to accustom the spirit to regard the thing as possible!”. This extravagant estimate was obviously poorly received by his contemporaries. Adhémar nevertheless proposed a test of his calculation “by examining the shadow of the Earth during lunar eclipses, [in order] to recognize the slight bulge that should be produced by the southern ice-mass” and even appeals to some observations, already very old and probably not very precise, made by the Danish astronomer Tycho Brahe (1546–1601) at the time of the 1588 eclipse.
5 Equinoxes, heat transport and the Gulf Stream
Joseph Adhémar was not content to study just the present-day polar caps, but also sought to determine the cause of the ice ages and their recurrence in time. Although he did not have any geochronological data on the successive glaciations, Adhémar nevertheless had the brilliant intuition that glaciations must be periodic, and thus controlled by celestial mechanics – the interested reader should refer to [5] as well as the article by André Berger about the astronomical theory (this issue). He was clearly influenced by the explanation of the mechanism of the seasons and the tides, in view of the great progress made in predictive calculations at that time. Adhémar's exaggerated estimate of the thickness of the Antarctic ice cap reinforced his idea that the southern hemisphere is currently undergoing an ice age. He tried to explain this by invoking the difference in duration of the seasons, and thus also in insolation, between the two hemispheres (see Fig. 14 for his representation of the terrestrial orbit and the evolution of the Earth's position during its revolution around the Sun). By taking into account astronomical calculations on the periodicity of the precession of the equinoxes combined with the periodicity of the rotation of the terrestrial orbit around the Sun, Adhémar correctly deduced that “a period of 21 000 years must pass between the present time and the moment when the seasons will correspond to the same points of the orbit […] One must necessarily conclude from the above that, after an interval of approximately 10 500 years, the order of the seasons will be reversed compared to the principal points of the terrestrial orbit […] the total duration of the autumn and winter taken together for our hemisphere will exceed by approximately eight days the total duration of the autumn and winter taken together for the southern hemisphere.” This difference should thus involve a regular alternation of ice ages between the two hemispheres because, according to Adhémar, “it is obvious that, during one winter at the Antarctic pole, more ice will be formed around this pole than […] at the Arctic pole during the corresponding winter, and when repeated over several thousands years, this difference will eventually become considerable.”
We should stress that Adhémar was aware of the complexity of the climatic system. His scenario for the deglaciation of a hemisphere is accompanied, for example, by a mechanism of abrupt and generalized retreat, which he puts in parallel with the catastrophes described by Cuvier [19]. After having read the oceanographic works of the American lieutenant Matthew Fontaine Maury (1806–1873) [36], Adhémar supplemented his own study and utilized the large-scale ocean currents to explain the rapid connection of climatic phenomena between the two hemispheres. Fig. 15 gives his picturesque representation of what we would nowadays call thermohaline circulation. In this connection, Adhémar describes that “warm water, attracted towards the pole by the empty space produced by the condensation of vapours, will be cooled by their contact with the ice, whose outlines will be melted; and, made heavier by this cooling, they will form a cold water counter-current below the warm water current, and …moving away from the pole, this cold water will come to fill the space formed in the equatorial seas by the rise of molecules heated up by the sun.”
Many criticisms were raised against the ideas of Adhémar. Several authors did not want to believe that the southern hemisphere is on average much colder than the northern hemisphere. Even though he himself had not been to the polar regions, Adhémar remonstrates those scientists, “seated by their fireside, [who] believe they are able to affirm that one hemisphere is no colder than the other one”. Faced by the cruel lack of climatic data on this problem, Adhémar maintains “as one must look upon the poles as the barometers of the Earth, and that observations made near these so interesting but nevertheless very poorly known regions will teach us more about physics and meteorology that all the dubious indications of our Parisian barometers”. Other scientists claimed, wrongly, that his theory of glacial transitions was incompatible with certain observations made about the sea level. In particular, historical data show that the Baltic sea level has been falling steadily over the centuries. We know today that this regional tendency is due to the isostatic phenomenon of readjustment following the relatively fast melting of the Scandinavian ice cap. This geophysical phenomenon was clearly not on the agenda in the middle of the 19th century, but Adhémar already imagined the spatial and temporal complexity of the deglaciation phenomenon, by affirming that “the surface level of the sea could be modified in a very large number of ways, and research into the various forms that this surface must assume in each case will certainly represent an interesting problem in advanced mechanics” – the interested reader should refer to the article on the variation of sea-level, by Kurt Lambeck (this issue).
The principal objection to the theory of Adhémar on the inequality of temperatures of the poles in fact arises from astronomical calculations themselves, in particular those carried out several decades before by the Frenchman Jean Le Rond d'Alembert (1717–1783) and the Englishman William Herschell (1738–1822). Actually, the seasonal difference in insolation duration between the hemispheres is compensated exactly by the fact that the Earth–Sun distance varies according to the position of the Earth on its orbit. As underlined by two famous naturalists of the time, the Englishman Charles Lyell [35] and the German Alexander von Humboldt (1769–1859), the important factor is the quantity of heat received during the year and not the duration of insolation for a particular hemisphere.
A few years later, the Scottish geologist James Croll (1821–1890) returned to the astronomical theory of glaciations by taking account of variations in the precession of the equinoxes [16] and the eccentricity of the orbit [17]. The variation of this latter term was unknown to Adhémar. Immersing himself in the studies of celestial mechanics published by the Frenchmen Pierre Simon de Laplace (1749–1827) and Urbain Le Verrier (1811–1877), Croll quickly understood the error of Adhémar and worked out a more complex theory based on the effect of the seasonal contrast of insolation. In particular, he emphasizes that the limiting factor is the effect of insolation in winter on the accumulation of snow and the formation of ice. Croll is fully aware of the fact that the amplitude of the variations in insolation is relatively limited. He therefore invokes amplifying phenomena such as the effect of reflection of snow, or the influences of atmospheric and ocean dynamics. On this subject [18], Croll writes that “the enormous effect that ocean currents have in equalizing the temperature of our globe, by diminishing the difference between the temperature of the equator and the poles, has never been duly estimated. This will be seen if we merely consider for a moment the effect produced by one current alone, viz. the Gulf-stream” and, after numerous calculations, he concludes that “there is actually, therefore, nearly as much heat transferred from the tropical regions by the Gulf-stream as is received from the Sun by the entire Arctic regions”. Croll then explains why the temperature contrast between the latitudes must have changed in the past, varying the intensity of the winds and consequently the force and the direction of large ocean currents such as the Gulf Stream. He is thus one of the first to introduce the concept of positive feedback to explain the amplification of a weak external forcing on the climatic system.
In support of his theoretical arguments, Croll also uses geological evidence showing that sea level has fluctuated quite recently all around the British Isles. In particular, he cites the occurrence of marine sediments elevated ten metres above the present-day sea level, as well as the former forests and submerged peat bogs found in Scotland and in other countries of Europe.
By taking account of the combined effects of the astronomical parameters precession and the eccentricity, Croll calculates that the last glaciation began approximately 240 000 years ago and that the last warm period lasted for 80 000 years [17]. In a final step, he supplements his theory by integrating the changes in the obliqueness of the axis of rotation of the Earth [18]. Croll understood that this new effect would be particularly sensitive at high latitudes; however, he did not have accurate data on the temporal variations of obliquity that would have allowed him to quantify the cumulated effects of the three parameters of the terrestrial orbit. We need to wait another half-century for the work of the Serbian mathematician Milutin Milankovitch (1879–1958), who provided us with a complete formulation of the astronomical theory and the first precise calculations of insolation at the various latitudes.
6 Interglacial periods, antediluvian Man and the turn over of carbon
In parallel to the research of Croll, many geologists continued to study and map the traces left behind by the ancient glaciers (e.g., [34]). These new surveys revealed a far greater complexity than that envisaged by Agassiz, who had favoured a single great glaciation characterized by an immense, but unique, polar ice-cap. Indeed, the Scottish geologist Archibald Geikie (1835–1924) and his brother James Geikie (1839–1914) show convincingly that several glacial phases followed one after another. This conclusion arises from the discovery of thin intercalated stratigraphic layers [29], containing fossils of plants such as hazel, oak, willow, and alder as well as the bones of deers, horses and great oxen. Evidently, these plants and animals could not have survived under glacial condition. The cold phases were thus interspersed with interglacial periods characterized by a moderate climate similar to the present day, or even warmer.
This geological and palaeontological work culminated with the publication in 1874 of James Geikie's book entitled The Great Ice Age and its relation to the antiquity of Man [30], a work that synthesized all knowledge on the subject at the time. The author described particularly well the alternations between moraines and peaty sediments observed in Scotland in natural or artificial outcrops, as well as in the first geological boreholes. The major difficulty is due to the fact that the stratigraphy of the oldest phases is often disturbed by the last glaciation and that “it is clear that a great proportion of the till that was formed during the first and earliest cold periods would be ploughed out by subsequent ice-sheets, while much of it would be so modified and rearranged as to become practically a newer till”. Geikie stresses the extreme importance that should be attached to these interglacial sediments in spite of their thin aspect, and that “enough is left to assure us of the former importance of the intercalated beds. The geological value of a deposit has not usually been measured by its bulk […] The wonder is not that they should be so interrupted, but that any portion whatever has been spared.”
As the second part of the title of his book suggests, Geikie also affirms that prehistoric Man lived in England during the last interglacial period and the last glaciation, as proven by the presence of knapped flint tools. This even inspired him to make the remark that “it is startling to recall in imagination those grand geological revolutions of which he must have been a witness”. A debate about ‘antediluvian Man’ in fact began around 1846, with the demonstration of the existence of human fossils by the Frenchman Jacques Boucher de Perthes (1788–1868), who excavated the glacial alluvial terraces of the Somme [7]. This pioneer prehistorian attracted violent attacks from the French scientific community. In particular, Cuvier and Élie de Beaumont did not accept the principle of the evolution of species or the possible existence of fossil hominids. A few years later, however, the value of the work of Boucher de Perthes was recognized after the visit to France of several British scientists such as Charles Lyell. This recognition led the further discoveries of many traces left by prehistoric Man on the other side of the English Channel.
Parallel to the work being carried out in Europe, some American geologists, in particular Thomas Chrowder Chamberlin (1843–1928), were systematically mapping the moraines of the United States (see Fig. 16, showing his map of Wisconsin dating back to 1882 [9]). Shortly afterwards, Chamberlin developed a classification – still in use today – of the glaciations including five American stages, the Wisconsinian corresponding to the last glaciation and the Illinoian to the penultimate glaciation (later, Chamberlin became interested in the formation of the Earth, and introduced the concept of accretion by addition of planetesimals). Similar classifications were worked out for European areas located south of the Baltic and north of the Alps. The names given to the two last glaciations are Weichselian and Saalian in one of the classifications, and Würmian and Rissian in the other. In fact, the alpine classification, published in 1909 by the German geographers Albrecht Penck (1858–1945) and Eduard Brückner (1862–1927) [37], is not founded on the study of moraines but on another type of evidence provided by the series of alluvial terraces observed around the tributaries of the Danube (Fig. 17).
This multiplicity of glacial phases is entirely consistent with the astronomical theory, which implies the periodicity of the phenomenon. However, the theory suggested by Croll was strongly criticized by geologists. Indeed, the calculations based on the combined variations of eccentricity and precession yield an alternation of glacial phases in both hemispheres. Although they did not have any stratigraphic argument to correlate the observations in the north and the south, many geologists thought that the glaciations were synchronous in the two hemispheres. Another test of the theory of Croll is given by his calculation of the duration of the present warm period that succeeded the last great glaciation. Although absolute geochronology did not exist in 19th century, some authors tried to make estimates from the regular erosion of certain deposits or progressive filling by postglacial sediments. By assuming constant rates of erosion or from sedimentation, the estimated durations vary between 7000 and 33 000 years. Even though approximate, these estimates are thus much lower than the 80 000 years necessary within the framework of the theory defended by Croll [17]. A few decades later, following his research beginning at the end of the 19th century, the Swede Gerald de Geer (1858–1943) published a much more reliable estimate of the duration of postglacial times, giving a figure of approximately 8700 years. He determined this value by counting the annual layers (varves) in sediments deposited by meltwaters of the Scandinavian ice cap, during its retreat towards the north and subsequent total disappearance [20–22].
Abandoning the astronomical theory to explain the glaciations, certain geologists like Chamberlin turned to an internal explanation, related to the Earth. Making use of the variations of the greenhouse effect due to atmospheric carbon dioxide, Chamberlin took up the ideas suggested by Tyndall a few decades earlier. The progress in knowledge of chemistry and geology meanwhile made it possible to attempt a quantitative approach to climatic variations.
The Swedish chemist Svante Arrhenius (1859–1927) also considered that the ice ages were caused by falls in the atmospheric content of carbon dioxide. In his demonstration, published in 1896 [4], he uses the observations of the geologists on the extent of glacial deposits “by measurements of the displacement of the snow-line we arrive at the result – and this is very concordant for different places – that the temperature at that time must have been 4–5 °C lower than at present”. According to the calculations of Arrhenius, this generalized cooling can be explained by a fall of about 40% in the content of carbon dioxide. He also foresaw the amplifying effects of the climatic system, related in particular to the increase in snow-covered areas and the oceanic currents.
While this work on the greenhouse effect was rather marginal for Arrhenius, it fell within the scope of the Stockholm Physical Society, which regularly brought together scientists interested by the problems of geology, meteorology and astronomy. Referring to the work of one of his geologist colleagues, Arrhenius also explained that the complexity of the natural cycle of carbon made it entirely possible to envisage small variations of flux leading to major changes of the carbon dioxide content of the atmosphere, which constitutes the smallest reservoir of the global cycle. Arrhenius pointed out that, in the long term, the level of atmospheric CO2 is primarily maintained by a dynamic equilibrium, therefore potentially unstable, between volcanic ‘exhalations’ and the chemical weathering of silicates, these latter forming a major carbon dioxide sink.
At the same time, Chamberlin supplemented the notions on the carbon cycle developed by Arrhenius [10–12]. The American geologist perceived there were feedback effects that could contribute to decreasing the atmospheric carbon dioxide content during glacial phases. In particular, he mentions the effect of cooling on the solubility of gases. Moreover, the retreating sea exposes rocks to chemical erosion by carbonic acid. Chamberlin even describes the feedback effect of sea level on the carbon cycle. This concept was taken up again at the end of the 20th century, when it becomes known as the ‘coral reef hypothesis’. Chamberlin writes that “in periods of sea extension and of land reduction […] the habitat of shallow water lime-secreting life is concurrently extended, giving to the agencies that set carbon dioxide free accelerated activity, which is further aided by the consequent rising temperature which reduces the absorptive power of the ocean and increases dissociation” [12]. For Chamberlin, these multiple effects would modulate the carbon dioxide content by being superimposed on the long and short terms, and would be thus at the origin of a “rhythmic action that could partly explain the glacial oscillations” [10].
7 Lessons for a future already becoming almost modern
As clearly illustrated by the various articles in this issue, we know today that the two main types of climatic factor, external forcing and internal rearrangements, have indeed acted over scales of time ranging from the millennium to a million years. Many well-dated time-series indicate that the distribution of the insolation exerts a major control on the various compartments of the climatic system, including the atmosphere, the ocean, the cryosphere and the carbon cycle. Current research stresses the importance of complex interactions between the external factors and the internal rearrangements of the climatic system involving circulation of the ocean and the atmosphere, the transfers of fresh water between the various compartments of the hydrological cycle, the expansion and internal dynamics of the ice caps as well as the atmospheric content of carbon dioxide.
Moreover, the greenhouse effect is now the object of acute concern, since the noticeable disturbance in the radiative budget caused by human activities will cause, by all reasonable accounts, a global warming of great amplitude. Since the end of the 1980s, an international group of experts has been set up by the World Meteorological Organization and the United Nations (UNO). This committee, which is called the IPCC (Intergovernmental Panel on Climate Changes), regularly draws up a review of the scientific results acquired on climatic changes and provides forecasts on emissions of the main greenhouse gases and aerosols [32].
In the 19th century, during the full development of the industrial revolution founded on intensive use of coal, few scientists worried about the consequences of human activities over the long term and on a worldwide scale. The very fact that technological progress could generate some unspecified nuisance seems to have no effect on either the technical community or the political class of the time.
All the same, we may note that Fourier mentions [28], among many other possible causes of climate change, that “the establishment and progress of human societies […] are wont to lead, over the course of several centuries, to variations in the degree of average heat.” Tyndall, for his part [47], briefly considers the impact of the greenhouse effect due to possible variations in the ‘blanket’, but reassures his reader by quoting the German physicist and physiologist, Hermann von Helmholtz (1821–1894), who affirms that “the history of Man, therefore, is but a minute ripple in the infinite ocean of time. For a much longer period than that during which he has already occupied this world, the existence of a state of inorganic nature, favourable to Man's continuance here, seems to be secured, so that for ourselves, and for long generations after us, we have nothing to fear.”
Arrhenius, on the other hand, is a little more concerned by the impact of human activities. He is the first to envisage an increase in the average temperature of the Earth as a consequence of the industrial use of fossil fuels. His article of 1896 [4] treating the influence of carbon dioxide on temperature is particularly prophetic, taking into account the limited data at his disposal. Arrhenius calculates that doubling the content of carbon dioxide consecutive to industrial development would result in a global warming of the planet by the order of 5 to 6 °C. It is rather amazing to note that this forecast made more than a century ago is still compatible with those published in 2001 [32] by the experts of the IPCC! Furthermore, the calculations of Arrhenius show that the impact of an increase in the carbon dioxide content is amplified at higher latitudes. He also considers positive feedback related to local changes of the albedo due to a reduction of the snow-covered areas. Arrhenius even mentions an attenuation of the diurnal and seasonal cycles, as well as an amplification of the temperature contrast between ocean and continent. However, he is not really worried about the climatic upheaval that he predicts, even seeing it as a means of softening the rigours of the Scandinavian climate: “our descendants, albeit after many generations, might live under a milder sky and in less barren natural surroundings than is our lot at present”.
Acknowledgements
I am grateful to Brigitte Crubezy, who was able to unearth several untraceable references, Jean-Jacques Motte for his ‘faithful-to-the-epoch’ restorations of Plates 6 and 13, Guillemette Ménot-Combes and Wulfran Barthelemy for attentive reviews of the manuscript, Mindy James for the datafile of T.C. Chamberlin's map (Fig. 16), Christian Vincent, Andreas Bauder, and Frank Paul for useful information on the alpine glaciers, and Rossbodegletscher and, finally, Michael Carpenter for his precious help with the English language.