

1 Introduction
Mountain glaciers are widely recognized as excellent indicators of climate change over the recent centuries (e.g., [8,13,20,22]). In particular, glacier mass variations can be used to assess climate warming over the 20th century and possible anthropogenic influences. Indeed, mass-balance fluctuations are very sensitive to variations in the surface energy budget and therefore to the slightest modifications of the climate. Most of the glaciers in the world show a decreasing trend over the 20th century [9], but this recession (in length, surface, and total volume) is not linear and shows strong fluctuations in time. Furthermore, the relationships between the glacier fluctuations and the regional climate parameters can be very different from one mountainous area in the world to another. This paper aims at giving an overview of the glacier fluctuations in two mountainous regions of the world (the Alps and the Andes). It first describes length fluctuations of the Alpine and the Andean glaciers (Section 2). Secondly, Section 3 proposes a comparison of the overall mass-balance fluctuations for four selected glaciers in the Alps and three selected glaciers in the Andes. Then, the origin of these mass-balance fluctuations is interpreted with the help of an analysis of regional meteorological parameters (Section 4). Finally, we analyse the difference in energy fluxes at the surface of Alpine and tropical glaciers, and examine how these fluxes affect the melting rate.
2 Length variations
In the Alps, the oldest snout position measurements have been performed roughly since 1870. However, for some Alpine glaciers, snout positions before 1870 have been deduced from paintings and historical written reports on damage caused by glacier advances [7,10,16,26,34]. These data show that between the end of the 16th century and the middle of the 19th century (Little Ice Age), Alpine glaciers were generally 0.8 to 1.6 km longer than today and that the major retreat took place during the 20th century. In fact, it is not clear when the Little Ice Age began and how the climate conditions were at the time [7]. However, it is likely that the Little Ice Age was a worldwide event, since the corresponding glacier advances are recorded everywhere in various mountainous areas [6].
In the Andes, historical documents on the Ecuadorian volcanoes and the Cordillera Blanca (Peru) allow for snout positions and Equilibrium Line Altitude (ELA) to be directly reconstructed since the 18th century on a few glaciers, but this information is very discontinuous [1,4,11,15]. Systematic information first began to be available by aerophotogrammetry with the first aerial pictures in 1948, and then with ground topographic surveys by the glaciological programs started in Peru in the late 1960s [1]. Thanks to IRD (‘Institut de recherche pour le développement’, France) and South-American partners, about a dozen glacier tongues have been regularly observed in Bolivia, Peru, and Ecuador since the early 1990s. Furthermore, a program aiming at dating moraines of the Little Ice Age by lichenometry is still under way in the central Andes by IRD [24].
As an illustration, snout fluctuations from direct measurements since the end of the 19th century are shown in Fig. 1 for four glaciers in the Alps and five glaciers in the Andes. The Alpine glaciers are located in the Grandes Rousses area (Saint-Sorlin), in the Mont Blanc range (Argentière and Bossons) and in the Bernese Alps (Aletsch). Topographical characteristics of these glaciers are very different. The surface areas range from 127 km2 (Aletsch) to 3 km2 (Saint-Sorlin) and the length of these glaciers from 25 to 2.5 km. The Andean glaciers are located in Peru (Yanamarey, Uruashraju, Broggi), Bolivia (Zongo), and Ecuador (Antizana). Table 1 gives a short description of all these glaciers.
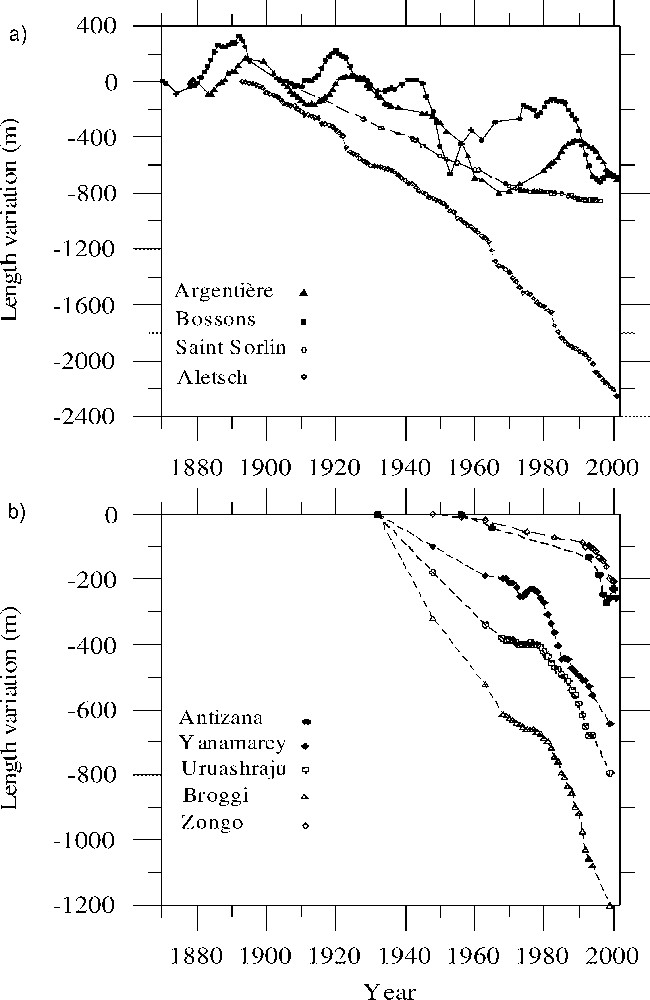
Length variations (m) for (a) four Alpine glaciers, (b) five Andean glaciers.
Variations de longueur (m) pour (a) quatre glaciers alpins, (b) cinq glaciers andins.
List of the glaciers used in this study with their topographical characteristics
Caractéristiques topographiques des glaciers étudiés dans ce travail
| Location (latitude and longitude) | Surface area (km2) | Max. elevation (m) | Min. elevation (m) | Length (km) | Exposure | Mean slope | |
| Claridenfirn | 46°40′N | 5.6 | 3240 | 2540 | 2.8 | east | 14° |
| 8°50′E | |||||||
| Hintereisferner | 46°48′N | 8.3 | 3710 | 2430 | 7 | east to northeast | 9° |
| 10°46′E | |||||||
| Argentière | 45°55′N | 19 | 3600 | 1600 | 10 | north to south | 12° |
| 6°57′E | |||||||
| Bossons | 45°52′N | 10 | 4810 | 1300 | 7 | north | 26° |
| 6°52′E | |||||||
| Saint-Sorlin | 45°10′N | 3 | 3400 | 2400 | 2.5 | north to east | 13° |
| 6°10′E | |||||||
| Sarennes | 45°07′N | 0.5 | 3150 | 2850 | 1 | south | 17° |
| 6°07′E | |||||||
| Antizana | 0°28′S | 0.33 | 5760 | 4840 | 1.96 | northwest | 25° |
| 78°09′W | |||||||
| Broggi | 8°60′S | 0.3 | 5100 | 4860 | 0.6 | northwest | 22° |
| 77°35′W | |||||||
| Uruashraju | 9°35′S | 1.8 | 5700 | 4570 | 2.2 | southwest | 27° |
| 77°19′W | |||||||
| Yanamarey | 9°39′S | 0.8 | 5200 | 4608 | 1.3 | southwest | 25° |
| 77°16′W | |||||||
| Zongo | 16°15′S | 2.4 | 6000 | 4900 | 3 | south to east | 20° |
| 68°10′W | |||||||
| Chacaltaya | 16°21′S | 0.06 | 5350 | 5150 | 0.52 | south | 21° |
| 68°07′W |
Fig. 1a shows a large retreat of the Alpine glaciers over the 20th century, but the front fluctuations can be very different over shorter periods from one glacier to another. From this figure, it is obvious that the high-frequency fluctuations observed on the Argentière and the Bossons glaciers are not synchronous and are visible neither on the Saint-Sorlin nor on the Aletsch glaciers. The Saint-Sorlin and Aletsch glaciers show a regular decrease over the 20th century, although the Argentière and Bossons glaciers show strong oscillations over the same period. These differences cannot be explained by the glacier sizes, since Saint-Sorlin and Aletsch represent the two extremes of the set (2.5 and 25 km long, respectively). Furthermore, one cannot explain these differences from regional climate differences, because surface mass-balance fluctuations reveal a common signal over the entire region of the Alps, as can be seen in the next section. In fact snout positions are the result of complex ice-flow dynamics that depend on climatic forcing over several previous decades, on the size of the glacier, its geometry and other dynamic parameters, resulting in different behaviours from one glacier to another [14,19,23]. Consequently, these length variations cannot be directly interpreted in terms of climate change.
In the Andes (Fig. 1b), length measurements indicate recession as the main evolution of glaciers since at least the 1930s. However, the decrease has not been monotonous, because the last 70 years split into a first phase with moderate recession for more than two decades, followed by acceleration in the decreasing rates, observed from the early 1980s. During the last decade, snout retreats have been general and rates have steadily increased, except for years 1999–2000, when this trend slowed down and some limited advances occurred, as for instance in Ecuador (Fig. 1b).
3 Mass-balance fluctuations
The annual mass balances are obtained from stakes inserted in the ice in the ablation area and from drilled cores or pits in the accumulation zone. In the Alps, the oldest mass-balance series performed over the entire glacier surface are for the Sarennes (1949), Hintereisferner (1953), Kesselwandferner (1953), Saint-Sorlin (1957), and Sonnblickees (1959) glaciers. The direct measurements on the Argentière glacier start in 1976. Cumulative mass balance of the Argentière, Hintereisferner, Saint-Sorlin, and Sarennes glaciers are plotted in Fig. 2a, from direct measurements (small dots and triangles) [9,28,30]. In addition, some values of total cumulative mass balance (large triangles in Fig. 2a) have been constrained with photogrammetric measurements for the Argentière and the Saint-Sorlin glaciers. Cumulative mass balance averaged over the last 50 years for the Alpine glaciers are very different and range from (water equivalent per year) for the Argentière glacier (1949–2002) to for the Sarennes glacier (1949–2002). The difference between the Saint-Sorlin and the Sarennes glaciers is very large too (−0.30 and ), although these glaciers lie 3 km apart in the same mountain range and with similar climatic conditions [29]. This can be explained by the difference in their respective geometric and geographic characteristics, i.e. the size of the glaciers, altitude of the accumulation zones and exposure. The Sarennes glacier faces south and its maximum altitude is 3150 m asl (Table 1). From a previous analysis [31], one can conclude that this glacier has been strongly receding in response to the climate of the 20th century. It is clear that the Sarennes glacier would remain stable only with climate conditions like during the Little Ice Age.
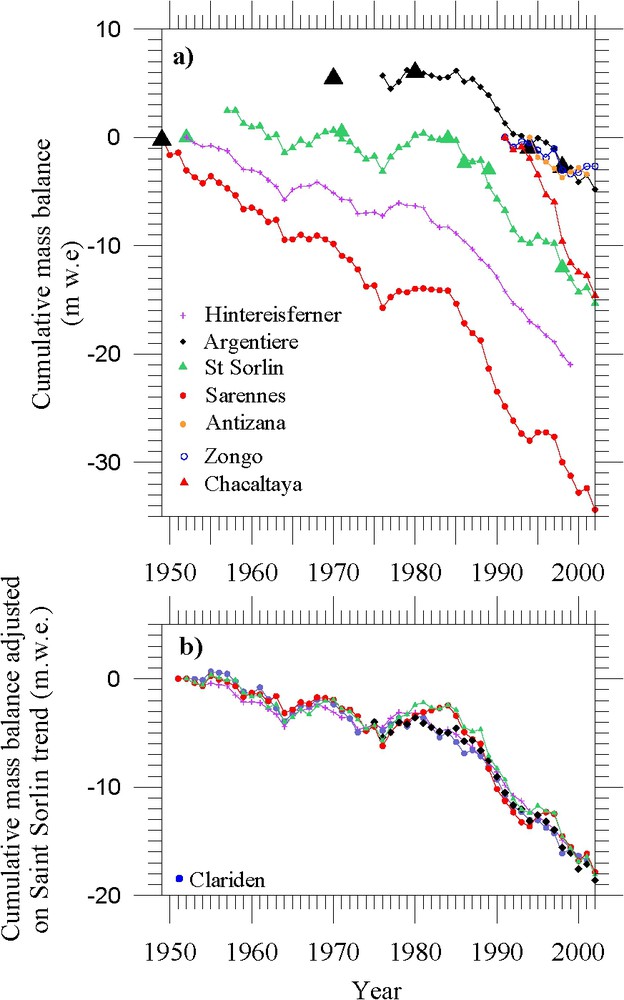
(a) Cumulative mass balance of four Alpine glaciers and three Andean glaciers; (b) Alpine glaciers cumulative mass balance adjusted on the Saint-Sorlin trend (see text). The Clariden series has been added.
(a) Bilan de masse cumulé de quatre glaciers alpins et trois glaciers andins ; (b) bilan de masse cumulé des glaciers alpins ajusté sur la tendance du glacier de Saint-Sorlin (voir le texte). La série de Clariden a été ajoutée.
In the Andes, direct mass-balance observations started in the early 1990s. In addition, some volume variations data are available from a few photogrammetric measurements performed with aerial photographs taken since the 1940s. As shown in previous studies, it seems that the Andean glaciers respond to the same climatic signal relating to the ENSO variability at the regional scale [3,4]. Over the last decade of the 20th century, glaciers have lost a minimum of 0.3– in the Central Andes [4], whereas the small-sized ones as Chacaltaya (Bolivia) have been much more vulnerable with reported losses about 5 to 10 times as large. Therefore Chacaltaya lost more than from 1991 to 2001, whereas the Zongo glacier shrank by only in the same period. The increasing elevation of the average Equilibrium Line Altitudes (ELA) in the Andes to 5200–5400 m asl tends to drastically reduce the accumulation areas of small and low-lying glaciers, as Chacaltaya. Hence, many of them are expected to completely disappear within the next 10 years [25].
Although long-term trends are different from one Alpine glacier to another, it can be seen from Fig. 2a that fluctuations are similar. In order to reduce the effects of these trends, each series has been adjusted according to the trend of the Saint-Sorlin glacier (for which the fluctuations are reliable because they have been checked by numerous photogrammetric data). Therefore, each glacier dataset has first been centred over the 1953–1999 period by subtracting its average rate of decrease over this same period to the glacier annual mass balance values ( for Sarennes, for Hintereisferner, −0.10 for Argentière). Then, the average mass balance (over the same 50 years) of the Saint-Sorlin glacier () has been added onto each glacier-centred dataset. This method allows us to keep the same trend over the last 50 years and to compare the mass-balance fluctuations only.
The results reported in Fig. 2b therefore show deviations in the cumulative mass balance from the 1953–1999 average value of the Saint-Sorlin glacier. In addition to the previously mentioned glaciers, Fig. 2b also includes data from Claridenfirn. The Claridenfirn series is the oldest series of direct winter and summer mass balance measurements in the world [17,18]. Although these measurements do not cover the entire surface of the glacier, stake readings and density measurements have been carried out since 1914 on two sites, at 2700 m asl, and at 2900 m asl. In this study, only measurements relative to the highest stake (2900 m asl) have been used, because the series of the lowest stake are not complete. Although the overall mass balance of the Claridenfirn remains unknown, mass-balance fluctuations can be determined from yearly measurements performed at this single stake (at 2900 m asl). Fig. 2b shows a strikingly common feature between the respective behaviours of the Claridenfirn, Hintereisferner, Argentière, Saint-Sorlin and Sarennes glaciers. A common signal between the Saint-Sorlin and Sarennes glaciers might be expected [29], as these glaciers are located only 3 km apart, but the similarity between the Hintereisferner and Sarennes glacier located 410 km apart is, on the other hand, more surprising. Fig. 2b shows two very different periods over the last 50 years: the 1954–1981 period over which the mass balance is close to zero (0.0 m w.e. yr−1 for Saint-Sorlin and for Argentière) and the last 20-year period with strong negative mass balances. The origin of this large change is analysed in the next section.
4 Climatological interpretation
This section aims at showing the kind of climatic information we can infer from mass balance observations. Annual glacier mass balance data are directly related to (i) snow accumulation, which depends on solid precipitation but also on downhill transportation and strong wind actions [28], (ii) ablation which directly represents the surface energy balance (SEB). The SEB actually represents the physical link between the local meteorological variables and the melting at the glacier surface. Hence, studying the SEB is a compulsory step to bring a climatic interpretation of mass-balance fluctuations.
The energy flux at the glacier surface, ΔQ, is calculated as:
| (1) |
4.1 Alpine glaciers
On Alpine glaciers, the ablation season (June to September) is distinct from the accumulation period (October to May). Although melting can occur in winter, the winter mass balance is very close to the winter accumulation, except for altitudes under 2400 m. Similarly, the summer mass balance is very close to the summer ablation, except above 3000 m, for which solid precipitation can occur in summer [28]. To determine the origin of the common signal revealed in Fig. 2b, winter and summer mass balance terms for these glaciers have been studied separately. This was only possible for Claridenfirn and Sarennes, where both observations are available over the last 50 years. First, this analysis shows that the summer mass-balance variance is by far the largest component of the annual mass balance variance for both glaciers. The analysis of winter mass balance observed at Claridenfirn and Sarennes shows large differences [31]. Moreover, the winter mass balance of the Sarennes glacier shows a strong positive trend since 1977, in total opposition with the annual mass balance trend. Consequently, the winter precipitation evolution cannot explain the striking common signal observed in Fig. 2b relative to the Alpine annual mass balance data. Conversely, the summer ablation has strongly increased since 1982 on both glaciers [31]. Sarennes and Claridenfirn summer ablation observed at 2900 m asl have been plotted in Fig. 3 for the two periods mentioned in the previous section, 1954–1981 and 1982–2002. The white bar charts show the snow ablation and the hatched ones show the ice ablation. As can be seen from this figure, the ablation at Claridenfirn results from snow ablation only, since the measurements have been carried out in the accumulation zone. The Sarennes melting rate increase is higher than that of the Claridenfirn, but the difference can easily be explained by the difference in the measurements dates. In order to improve the comparison, the Sarennes summer mass balances observations have been adjusted to the dates of Claridenfirn data (dashed lines in Fig. 3). By comparing 1954–1981 with 1982–2002 from observations performed at the same dates, one can conclude that the ablation between June to September has increased similarly at Claridenfirn (from 0.77 to 1.36 m w.e. yr−1) and at Sarennes (from 1.88 to 2.48 m w.e. yr−1) [31].
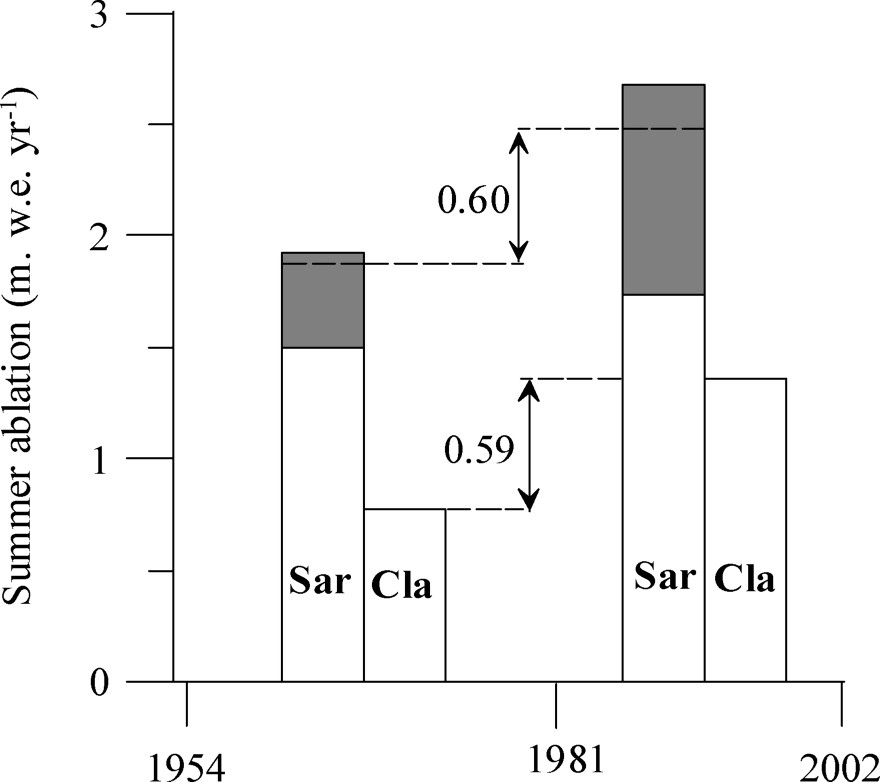
Summer snow ablation (white) and ice ablation (hatched) in m w.e. yr−1 for Sarennes (Sar) and Claridenfirn (Cla) glaciers. Dashed lines correspond to Sarennes ablation for Claridenfirn measurements date. The ablation differences between 1954 and 1981, on the one hand, and between 1982 and 2002, on the other hand, are 0.59 and 0.60 m w.e. yr−1 for Claridenfirn and Sarennes, respectively (at Claridenfirn observations date).
Ablation de neige (blanc) et ablation de glace (gris) estivales en m eau an−1 pour les glaciers de Sarennes (Sar) et Claridenfirn (Cla). Les lignes pointillées correspondent à l'ablation à Sarennes pour les dates de mesures de Claridenfirn. Les différences d'ablation entre 1954 et 1981, d'une part, et 1982–2002, d'autre part, sont 0,59 et 0,60 m eau an−1 pour respectivement Sarennes et Claridenfirn (aux dates d'observation à Claridenfirn).
This comparison reinforces the representativeness of mass-balance fluctuations over the European Alps and indicates very similar melting rate rises over the last two decades for two glaciers 290 km apart. It is therefore likely that the summer climate changes that affect glaciers are similar over the European Alps. Considering that ablation is only due to melting, which is a reasonable statement for the Alps, summer ablation is a direct measurement of the total surface energy balance. In order to obtain energy balance from ablation observations, one has to take into account the observation durations and to consider the ablation rates (cm w.e. d−1). The rise in the ablation rate on the Sarennes glacier is 0.5 cm w.e. d−1 (snow ablation, June to August) and 0.3 cm w.e. d−1 (ice ablation, September). The snow ablation rate increase on the Claridenfirn (0.57 cm w.e. d−1) is very similar to that observed on the Sarennes glacier. Using a latent heat of fusion of 334 000 J kg−1, the snow and ice-ablation rates (mm day−1) have been converted into energy (W m−2) assuming that the ablation is only due to melting. Between 1954–1981 and 1982–2002, the energy fluxes variations are 20 and 11 W m−2 for the snow and ice ablation periods, respectively [31].
4.2 Andean glaciers
Fig. 4 depicts the annual cycles of the SEB at 4890 m asl on Antizana Glacier (Ecuador, inner tropics, 0°28′S, mean ELA = 5050 m asl) [2] and at 5050 m asl on Zongo Glacier (Bolivia, outer tropics, 16°15′S, mean ELA = 5240 m asl) [27,32]. On both glaciers, the net short-wave radiation is the main source of energy at the glacier surface and is responsible for the permanent melting conditions prevailing on the surface of the ablation area throughout the year. Since net short-wave radiation is mainly controlled by albedo, albedo is the key factor controlling the SEB of tropical glaciers in the ablation area. The difference in S (net short-wave radiation) observed between Antizana and Zongo is only explained by a difference in albedo, the latter being higher on Zongo because the automatic weather station (AWS) on Zongo is farther from the terminus and higher in altitude than on Antizana. Net short-wave radiation is partly counterbalanced by net long-wave radiation L, which is negative throughout the year. The annual seasonality of L is highly pronounced in Bolivia (outer tropics) with low values during the dry season (April–September, low cloudiness) and high values during the wet period (October–March, high cloudiness), whereas in Ecuador, L remains almost invariable as a consequence of the quasi-absence of annual cycle of precipitation. As for the turbulent fluxes, although the sensible heat flux H remains positive, the sum (LE: latent heat flux) always represents a heat sink. Indeed, a permanently negative latent heat flux (corresponding to a mass loss through sublimation) is a specific feature of tropical glaciers. These turbulent fluxes are highly variable throughout the year: they are important during the windy months (June–September) in Ecuador [2] and during the dry season in Bolivia [32].
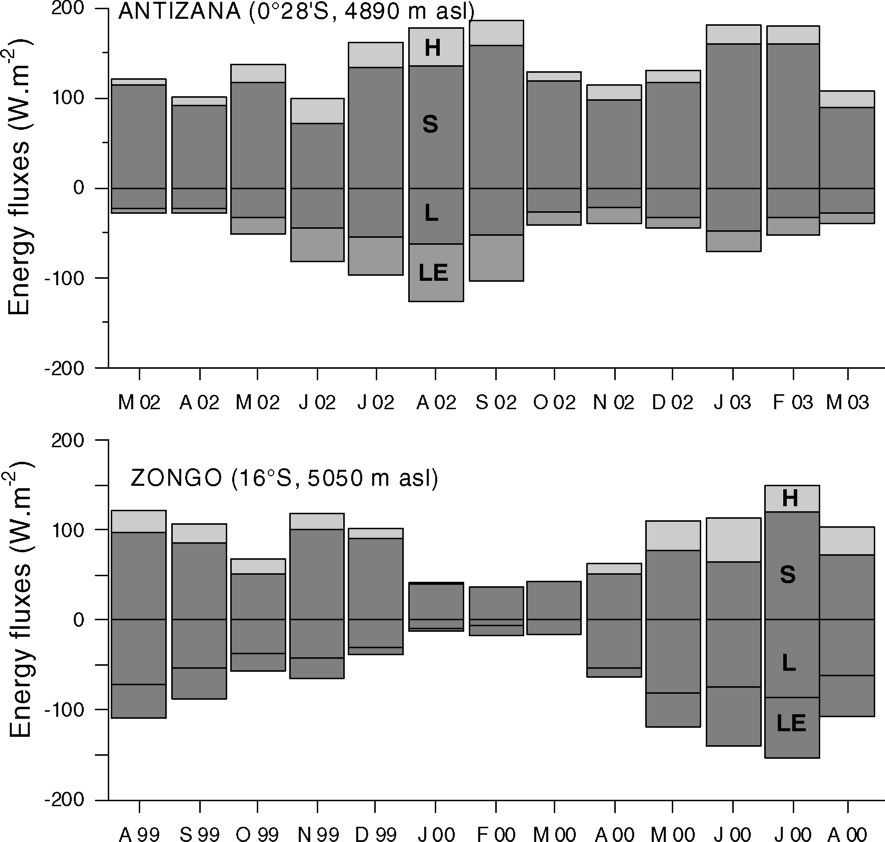
Monthly means of net short-wave radiation S, net long-wave radiation L, turbulent sensible and latent heat fluxes H and LE respectively for Antizana (March 2002–March 2003) and for Zongo (August 1999–August 2000). Note a data gap for H and LE in March 2000 on Zongo.
Moyennes mensuelles du bilan radiatif de courtes longueurs d'onde S et de grandes longueurs d'onde L, des flux turbulents de chaleur sensible et latente H et LE, respectivement pour les glaciers Antizana (mars 2002–mars 2003) et Zongo (août 1999–août 2000). Il faut noter l'absence de données pour H et LE en mars 2000 au Zongo.
In order to investigate the ablation fluctuations of these glaciers, we need to consider the inter-annual variability of the SEB. As seen above, albedo is the key factor of the SEB of tropical glaciers and is therefore to a large extent responsible for inter-annual variations of the melting at the glacier surface. But albedo is mainly controlled by solid precipitation deposited on the ablation area. In turn, the inter-annual variability of the amount and the repartition of solid precipitation govern the inter-annual variability in the melting of tropical glaciers. In Bolivia, where it never rains on the glacier, negative mass balances recorded over the last decade (see Section 3) are mostly related to precipitation deficits usually observed during El Niño events [3,33]. In Ecuador, albedo is rather controlled by the altitude of the rain–snow limit, which is governed by air temperature [2]. Thus, the warming observed in the inner tropics and related to El Niño events or/and to the global change influences the albedo, leading to negative mass balances [5].
4.3 Comparison Andes–Alps
Many energy-balance studies have been carried out on Alpine glaciers but they are usually of short duration (for a review, see Hock [12]), except the 3-year experiment conducted by Oerlemans [21] at 2104 m asl on the tongue of Morteratschgletscher (Switzerland, 47°N). Since this study covers several years, we will base our comparison on its results. Table 2 gives the values of the components of the SEB averaged over periods with melting for Morteratschgletscher (1 October 1995–30 September 1998; 35% of the time with melting considering half hourly values), Antizana (14 March 2002–14 March 2003; 100% of the time with melting) and Zongo (1 September 1999–31 August 2000; 100% of the time with melting). It is quite clear that the net short-wave radiation dominates the SEB of both Alpine and tropical glaciers, making the albedo the key factor of the SEB of all these glaciers. The amount of snowfalls on glaciers is therefore a very important meteorological variable governing the annual mass balance of Alpine and tropical glaciers. Although the annual mean incident solar radiation is lower on Morteratschgletscher (145 W m−2) than on Antizana (239 W m−2) or Zongo (209 W m−2), the net short-wave radiation contributing to melting is higher on this Alpine glacier than on tropical ones (Table 2). This is due to the fact that on Alpine glaciers melting occurs only in summer when the solar radiation is high and that the AWS (Automatic Weather Station) is located in the lower part of the glacier, where bare ice of low albedo is often exposed at the surface. S, the net short-wave radiation, is partly counterbalanced by L, the net long-wave radiation. The absolute value of L in Table 2 is smaller on Morteratschgletscher mainly because air temperature during periods of melting (summer) is much higher in the Alps than in the Andes where melting occurs all year round. The main difference between Alpine and tropical glaciers comes from the turbulent fluxes. If, on the one hand, the positive sensible heat flux H is totally counterbalanced by a negative latent heat flux LE (sublimation) in the tropics, in the Alps on the other hand, LE remains small and even slightly positive (condensation), H is positive and strong such that the sum represents an important energy source term for the melting in the ablation area.
Values of the components of the SEB averaged over periods with melting for Morteratschgletscher (1 October 1995–30 September 1998; 35% of the time with melting, considering half hourly values), Antizana (14 March 2002–14 March 2003; 100% of the time with melting), and Zongo (1 September 1999–31 August 2000; 100% of the time with melting). Values of Morteratschgletscher come from figure 8 of [21]
Valeurs des composantes du bilan d'énergie de surface, moyennées sur la période de fonte, pour Morteratschgletscher (1er octobre 1995–30 septembre 1998, 35% du temps avec de la fonte, si l'on considère les valeurs semi-horaires), Antizana (14 mars 2002–14 mars 2003, 100% du temps avec de la fonte) et Zongo (1er septembre 1999–31 août 2000, 100% du temps avec de la fonte). Les valeurs de Morteratschgletscher sont issues de la figure 8 de la référence [21]
| Fluxes in W m−2 | Morterastchgletscher, Switzerland (47°N) 2104 m asl | Antizana, Ecuador (0°28′S) 4890 m asl | Zongo, Bolivia (16°S) 5050 m asl |
| Net short-wave radiation S | 179 | 123 | 72 |
| Net long-wave radiation L | −26 | −39 | −45 |
| Sensible heat flux H | 31 | 21 | 21 |
| Latent heat flux LE | 9 | −27 | −31 |
This difference in the turbulent fluxes mostly comes from the air temperature much higher in the ablation area of Alpine glaciers during the melting season (summer) than on tropical glaciers, which experience melting throughout the year in their lower part. Then, Alpine glaciers are not only sensitive to inter-annual variations in solid precipitation, but also, and to a higher degree, to air temperature changes.
5 Conclusion
Length measurements indicate a large retreat of the glaciers over the last century in the Alps and in the Andes, with large fluctuations from one glacier to another in relation, not only to climate change, but also to specific morphological features of each glacier. Available time series of mass balances make it possible to analyse the response of Alpine and Andean glaciers to climate variability over the 20th century. Energy-balance studies performed on the Zongo (Bolivia) and the Antizana (Ecuador) glaciers, compared to a similar study in the Alps [21], enabled us to characterize the processes responsible for the ablation. Although long-term trends are different from one series of mass balance to another in the Alps, fluctuations are similar. Two periods can be distinguished, 1954–1981, over which the mass balance is close to zero, and the last 20-year with strong negative mass balance. Alpine glaciers are very sensitive to air temperature changes, whereas negative mass balances in the tropical Andes are related to solid precipitation deficits that influence the albedo. The turbulent fluxes explain this difference with strong positive sensible heat flux in the Alps and strong negative latent heat flux in the Andes.
Consequences of the present glacier retreat would be an increase of runoff in the proglacial streams, up to a certain glacier shrinkage, and a decrease of runoff if the glacierised areas of the basins reduce significantly.
Acknowledgments
The authors would like to thank all those who took part in collecting the extensive field measurements on these glaciers. We are grateful for the assistance received from INAMHI and EMAAP-Q in Ecuador, from SENAMHI and INRENA in Peru, from SENAMHI and IHH-UMSA in Bolivia. We are also grateful to Ghislain de Marsily and an anonymous referee for helpful corrections. This study has been funded by ‘Observatoire des sciences de l'Univers’ de Grenoble (OSUG), by the GLACIOCLIM ORE program (Observatoire de recherche en environnement) and by the French National Eclipse Program over the last two years.