

1 Introduction
Absolute paleointensity data provide an important source of information on the physics of the Earth's deep interior. Despite more than forty years of research, paleointensity data are scarce [9,17,19,22] and they cannot be yet used to document a long-term variation in the intensity of the Earth's magnetic field through geological time. The major reason for this small number of determinations is that paleointensity is the most difficult component of the magnetic field to determine and that the failure rate is often large, in general of the order of 80% [2,12].
The Thellier method [23] is currently considered as the most reliable technique to retrieve the absolute intensity of geomagnetic field [8,15] from volcanic rocks and archaeological material. Although numerous methodological studies (e.g., [2,4,5,10–13,20,21]) were devoted to investigate the causes of failure and its prevention, the problem is still not fully understood.
Recent critical analyses of paleointensity variation trough time [1,9] indicate that all reported data might differ by a factor of 2 or 3 from present-day strength. During geomagnetic reversals or excursions, however, the paleointensity may decrease by a factor of 5 to 8 [3,8,18]. The laboratory field used during Thellier experiments may frequently differ from true geomagnetic paleointensity. In this note, we report new high-quality experimental data to evaluate the effect of applied field on the quality of paleointensity determination.
2 Samples and laboratory procedures
Samples used in this study belong to three independent, Late Quaternary lava flows from Chichinautzin volcanic field in Central Mexico [14]. The main magnetic carriers are low-Ti titanomagnetites as evidenced by reasonably reversible susceptibility versus temperature curves. On the other hand, the ratios of hysteresis parameters point out that all samples fall in the pseudo-single domain grain size region, probably indicating a mixture of multidomain and a significant amount of single-domain grains (more detailed description of samples are reported in Morales et al. [14,15]). The natural remanence of these samples is characterized by stable univectorial magnetization, observed upon both alternating field and thermal treatments. The median destructive fields (MDF) range mostly from 50 to 70 mT, suggesting ‘small’ pseudo-single domain grains as remanent magnetization carriers [7].
The full TRM's (thermoremanent magnetizations) were imparted to previously AF (alternating field)-treated samples from 600 °C to room temperature in a 40-μT magnetic field. Thellier experiments in their modified form [6] were carried out on each set of samples using 10-, 20-, 40-, 60- and 80-μT laboratory fields, respectively. Finally, the extreme case was also investigated: a full TRM was imparted on 16 samples in a 10-μT magnetic field while the laboratory field was set to 80 μT. Ten to 16 double-heating steps were distributed between room temperature and 600 °C, according to the sample's blocking temperature spectra [14]. Several control heating steps (commonly referred as partial TRM checks (pTRM checks)) were performed throughout the experiment. Remanence measurements were made using both AGICO Ltd. JR5 and JR6 spinner magnetometers.
3 Results
Paleointensity data are reported on Arai-Nagata [16] plots in Fig. 1 and in Tables 1 and 2. The accepted determinations fulfill the following conditions: (1) at least 8 NRM–TRM points, corresponding to a NRM fraction larger than 0.4 (Tables 1 and 2); (2) a quality factor q [6] of about 8 (a minimum value obtained in this study, excepting two cases) or more. The q factor is related to f(remanence fraction used to determine paleointensity) and g(the gap factor) by following expression: , where m is slope of the best fit line adjusted to the ‘NRM’–TRM points and δm is the standard deviation of the slope; and (3) positive ‘pTRM’ checks (i.e. pTRM checks must agree with the original pTRM data within 15%).
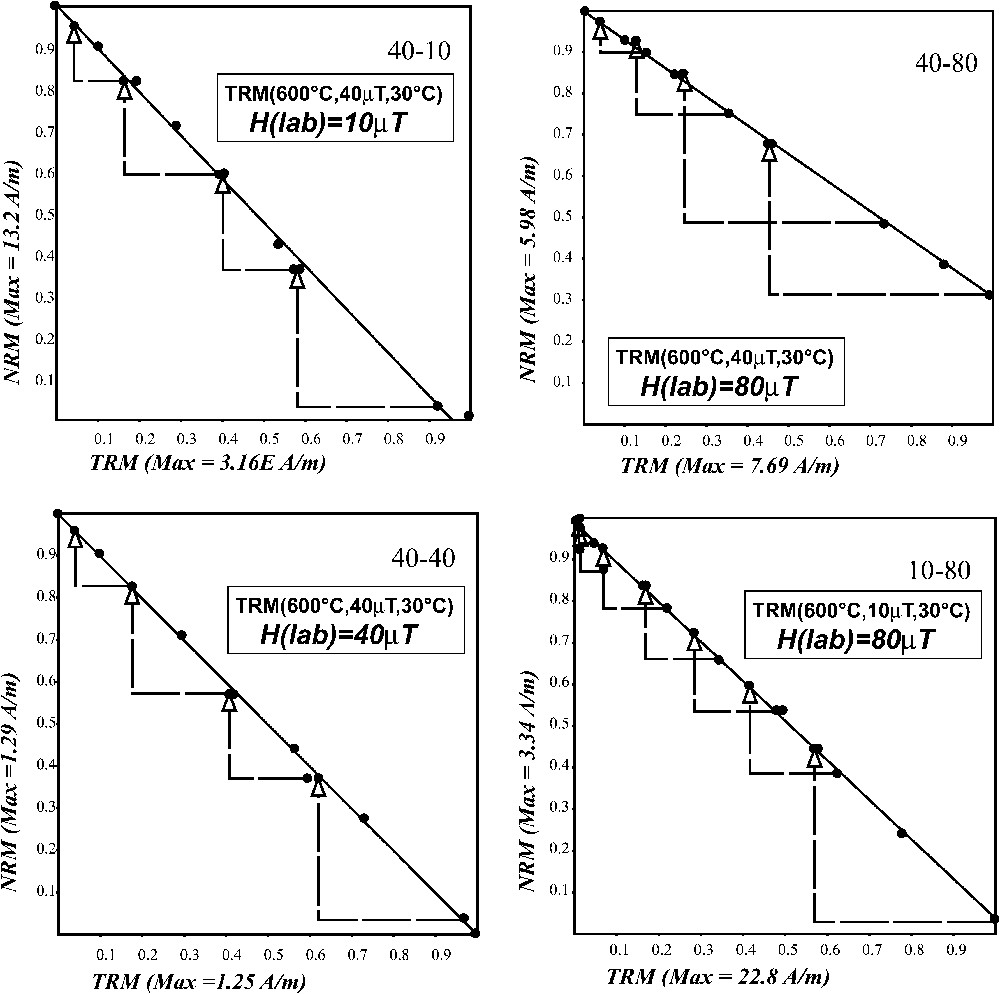
Representative NRM–TRM plots for different set of samples (see also text).
Diagrammes représentatifs NRM–TRM pour les différentes séries d'échantillons (voir aussi le texte).
Experimental results. n, Number of ‘NRM’–TRM points used for determination; m, slope of the best fit line adjusted to the ‘NRM’–TRM points; δm, standard deviation of the slope; , estimated strength of the laboratory field intensity used to create the full TRM; , associated error of ; f, g and q fraction of extrapolated NRM used for intensity determination, gap and quality factor [6], respectively; and , laboratory field intensity employed in each experiment (10, 20, 40, 60, and 80 μT)
Résultats expérimentaux. n, Nombre de points « NRM » –TRM utilisés pour la détermination ; m, pente de la droite la mieux ajustée aux points « NRM »–TRM ; δm, déviation standard de la pente ; , intensité au champ estimée, utilisée pour créer TRM total ; , erreur associée à ; f, g et q ; fraction de NRM extrapolé utilisée pour la détermination de l'intensité, de groupement et de qualité facteurs [6], respectivement et , intensité de champ en laboratoire, utilisée dans chaque expérience (10, 20, 40, 60 et 80 μT)
| TRM (600 °C, 40 μT, T0) | ||||||||
| Sample | n | m | δm | [μT] | [μT] | f | g | q |
| JJ2Y | 10 | −3.8130 | 0.2220 | 38.130 | 2.220 | 0.8550 | 0.8200 | 12.030 |
| JJ8 | 10 | −3.8944 | 0.7475 | 38.944 | 7.475 | 0.9307 | 0.4916 | 2.384 |
| JJ10 | 10 | −4.1000 | 0.9020 | 41.000 | 9.020 | 0.9320 | 0.5990 | 2.537 |
| JJ11V | 11 | −4.1325 | 0.4000 | 41.325 | 4.000 | 1.0052 | 0.8049 | 8.360 |
| JJ11X | 11 | −4.1295 | 0.0630 | 41.295 | 0.630 | 0.9841 | 0.8544 | 55.105 |
| JJ11Y | 11 | −4.1648 | 0.1586 | 41.648 | 1.586 | 0.9779 | 0.8519 | 21.873 |
| JJ11Z | 11 | −4.1669 | 0.1367 | 41.669 | 1.367 | 1.0010 | 0.8515 | 25.976 |
| JJ12 | 12 | −4.4834 | 0.1495 | 44.834 | 1.495 | 1.0013 | 0.8702 | 26.446 |
| Mean | −4.111 | 0.347 | 41.11 | 0.961 | 0.768 | 19.34 | ||
| S.E. = | 0.71 | 0.018 | 0.050 | 6.16 | ||||
| JH10Y | 8 | −1.8400 | 0.1000 | 36.800 | 2.000 | 0.8084 | 0.7890 | 11.736 |
| JH10Z | 9 | −1.9500 | 0.1000 | 39.000 | 2.000 | 0.9487 | 0.8014 | 14.825 |
| JH11U | 8 | −2.1400 | 0.0840 | 42.800 | 1.680 | 0.8822 | 0.7218 | 16.223 |
| JH11Y | 9 | −1.9200 | 0.0700 | 38.400 | 1.400 | 0.9140 | 0.8477 | 21.252 |
| JH12Y | 9 | −1.9100 | 0.1400 | 38.200 | 2.800 | 0.9095 | 0.8657 | 10.742 |
| JH14Y | 9 | −1.9900 | 0.0980 | 39.800 | 1.960 | 0.9010 | 0.8434 | 15.431 |
| JH15 | 9 | −2.1500 | 0.1500 | 43.000 | 3.000 | 0.5972 | 0.8451 | 7.233 |
| JH17Z | 8 | −2.0300 | 0.1200 | 40.600 | 2.400 | 0.8738 | 0.8424 | 12.452 |
| Mean | −1.991 | 0.108 | 39.83 | 0.854 | 0.820 | 13.74 | ||
| S.E. = | 0.78 | 0.039 | 0.017 | 1.49 | ||||
| JJ2Y | 11 | −1.0169 | 0.0188 | 40.676 | 0.752 | 1.0010 | 0.8770 | 47.500 |
| JJ8 | 11 | −1.0229 | 0.0271 | 40.916 | 1.082 | 0.9970 | 0.8250 | 31.000 |
| JJ10 | 10 | −1.0600 | 0.0120 | 42.408 | 0.480 | 0.7210 | 0.8700 | 54.040 |
| JJ11V | 11 | −0.9689 | 0.0097 | 38.756 | 0.388 | 0.9690 | 0.8750 | 84.590 |
| JJ11X | 11 | −1.0850 | 0.0126 | 43.400 | 0.502 | 0.9710 | 0.8520 | 71.500 |
| JJ11Y | 11 | −1.0121 | 0.0143 | 40.486 | 0.573 | 0.9900 | 0.8760 | 61.250 |
| JJ11Z | 11 | −1.0204 | 0.0109 | 40.814 | 0.436 | 0.9910 | 0.8680 | 80.580 |
| JJ12 | 11 | −1.0386 | 0.0115 | 41.543 | 0.460 | 0.9990 | 0.8640 | 78.040 |
| Mean | −1.028 | 0.015 | 41.12 | 0.955 | 0.863 | 63.56 | ||
| S.E. = | 0.49 | 0.034 | 0.006 | 6.57 | ||||
| JM5A | 9 | −0.6606 | 0.0216 | 39.636 | 1.296 | 0.9244 | 0.7909 | 22.401 |
| JM6A | 9 | −0.6779 | 0.0250 | 40.674 | 1.500 | 0.7742 | 0.7843 | 16.453 |
| JM7A | 9 | −0.7043 | 0.0196 | 42.258 | 1.176 | 0.7653 | 0.7826 | 21.533 |
| JM9A | 10 | −0.6889 | 0.0136 | 41.334 | 0.816 | 0.9764 | 0.7537 | 37.197 |
| JM10A | 9 | −0.7073 | 0.0165 | 42.438 | 0.990 | 0.8383 | 0.7858 | 28.174 |
| JM11A | 9 | −0.6957 | 0.0168 | 41.742 | 1.008 | 0.8629 | 0.7720 | 27.634 |
| JM12A | 9 | −0.6571 | 0.0251 | 39.426 | 1.506 | 0.9198 | 0.7657 | 18.454 |
| JM12B | 9 | −0.6434 | 0.0197 | 38.604 | 1.182 | 0.9750 | 0.7095 | 22.549 |
| Mean | −0.679 | 0.020 | 40.76 | 0.880 | 0.768 | 24.30 | ||
| S.E. = | 0.50 | 0.029 | 0.009 | 2.32 | ||||
| JH10Y | 8 | −0.5043 | 0.0106 | 40.344 | 0.848 | 0.5554 | 0.7995 | 21.130 |
| JH10Z | 8 | −0.4856 | 0.0170 | 38.852 | 1.359 | 0.4179 | 0.7332 | 8.760 |
| JH11U | 11 | −0.4826 | 0.0045 | 38.608 | 0.363 | 0.9843 | 0.7264 | 76.010 |
| JH11Y | 9 | −0.4930 | 0.0072 | 39.441 | 0.576 | 0.9897 | 0.8113 | 55.120 |
| JH12Y | 11 | −0.4966 | 0.0096 | 39.732 | 0.764 | 0.9938 | 0.8551 | 44.200 |
| JH14Y | 11 | −0.5070 | 0.0066 | 40.558 | 0.532 | 0.9979 | 0.8253 | 62.810 |
| JH15 | 11 | −0.5364 | 0.0040 | 42.912 | 0.319 | 0.6893 | 0.8426 | 78.030 |
| JH17Z | 11 | −0.4965 | 0.0106 | 39.722 | 0.845 | 1.0015 | 0.8312 | 39.290 |
| Mean | −0.500 | 0.009 | 40.02 | 0.829 | 0.803 | 48.17 | ||
| S.E. = | 0.47 | 0.084 | 0.017 | 8.77 |
Same notations as in Table 1. The full TRM is produced under a 10-μT magnetic field from 600 °C to room temperature and the laboratory field is set to 80 μT
Mêmes notations que dans le Tableau 1. TRM total est produit sous un champ magnétique de 10 μT depuis 600 °C jusqu'à la température ambiante, et le champ imposé en laboratoire est de 80 μT
| Sample | n | m | δm | [μT] | [μT] | f | g | q |
| 92H010A | 15 | −0.1257 | 0.0038 | 10.058 | 0.300 | 0.9844 | 0.8153 | 26.886 |
| 92H010B | 15 | −0.1189 | 0.0052 | 9.509 | 0.418 | 1.0090 | 0.7990 | 18.324 |
| 92H011A | 15 | −0.1264 | 0.0036 | 10.109 | 0.292 | 0.9714 | 0.7562 | 25.451 |
| 92H011B | 13 | −0.1440 | 0.0070 | 11.519 | 0.560 | 0.7185 | 0.8116 | 12.002 |
| 92H012A | 15 | −0.1391 | 0.0054 | 11.128 | 0.433 | 0.9993 | 0.8511 | 21.874 |
| 92H014A | 15 | −0.1328 | 0.0043 | 10.626 | 0.342 | 1.0015 | 0.8286 | 25.905 |
| 92H015A | 15 | −0.1373 | 0.0036 | 10.982 | 0.292 | 0.7399 | 0.8596 | 23.960 |
| 92H017A | 15 | −0.1360 | 0.0057 | 10.880 | 0.453 | 1.0017 | 0.8251 | 20.172 |
| 92J02A | 16 | −0.1177 | 0.0060 | 9.418 | 0.480 | 0.9729 | 0.8693 | 16.590 |
| 92J08A | 16 | −0.1309 | 0.0024 | 10.474 | 0.189 | 0.9815 | 0.7716 | 41.921 |
| 92J10A | 16 | −0.1377 | 0.0039 | 11.018 | 0.310 | 0.9858 | 0.8897 | 31.140 |
| 92J11A | 16 | −0.1293 | 0.0062 | 10.343 | 0.493 | 0.9933 | 0.8746 | 18.224 |
| 92J11B | 16 | −0.1393 | 0.0027 | 11.148 | 0.213 | 0.9613 | 0.8738 | 44.007 |
| 92J11C | 16 | −0.1320 | 0.0057 | 10.558 | 0.453 | 0.9816 | 0.8702 | 19.907 |
| 92J11D | 16 | −0.1362 | 0.0052 | 10.894 | 0.420 | 0.9735 | 0.8443 | 21.298 |
| 92J12A | 16 | −0.1389 | 0.0022 | 11.110 | 0.180 | 0.9690 | 0.8835 | 52.750 |
| Mean | ||||||||
| S.E. = 0.15 |
The magnetic field of 40 μT used to impart most of TRM's was very accurately reproduced by paleointensity determination in each case. Standard error of the mean (S.E.) does not exceed 2% of the expected value in any of the cases. For these samples, the ‘NRM’ fraction f used for determination ranges between 0.774 to ∼1.0, except for two cases; and the quality factor q varies from 8.4 to 84.6, except for two cases (Table 1). It should be noted that when the strength of applied laboratory field matches to ‘ancient’ field intensity, the mean q value is at least 30% higher. The same is true for f and g factors, respectively. Moreover, the combination of these latter factors yields the same pattern as the q factor alone (Fig. 2).
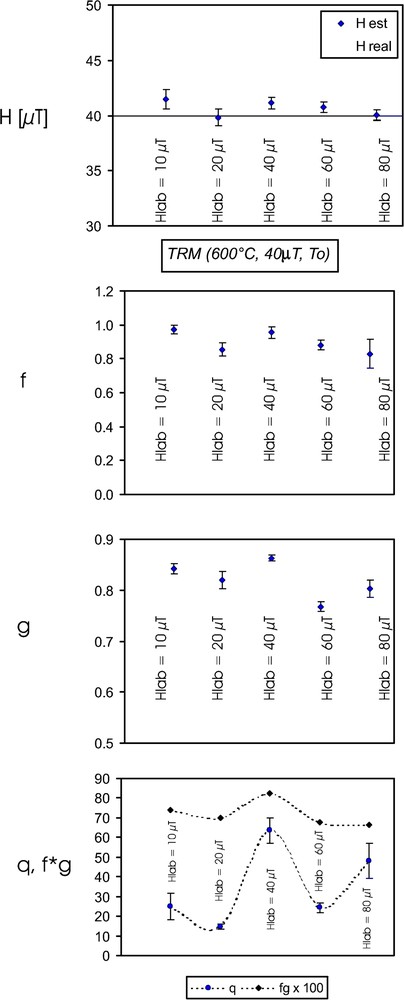
Paleointensity and Coe's [6] quality factors versus applied laboratory field. The full TRM is produced under a 40-μT magnetic field from 600 °C to room temperature (see text for details).
Paléointensité et facteurs de qualité de Coe et al. [6] en fonction du champ appliqué en laboratoire. TRM total est produit sous un champ magnétique de 40 μT, depuis 600 °C jusqu'à la température ambiante (voir le texte pour les détails).
In the specific case in which TRM's were imparted in 10 μT and the laboratory field was set to 80 μT, the intensity was also precisely reproduced (S.E. < 0.2%, Table 2, Fig. 3). It is quite evident that the intensity of the magnetic field may be reproduced even if the magnitudes of ‘ancient’ and laboratory fields differ too much.

Paleointensity and Coe's [6] quality factors for each one of the 16 samples. The full TRM is produced under a 10-μT magnetic field from 600 °C to room temperature and the laboratory field is set to 80 μT (see text for details).
Paléointensité et facteurs de qualité de Coe et al. [6] pour chacun des 16 échantillons. TRM total est produit sous un champ magnétique de 10 μT, depuis 600 °C jusqu'à la température ambiante (voir le texte pour les détails).
4 Conclusion
Results obtained in this study reinforce the general conclusion reached by Tanaka and Kono [21]. On the other hand, the quality of determination, expressed here as Coe's quality factors (Figs. 2 and 3), are significantly higher when the strength of the applied laboratory field matches the ‘ancient’ field intensity.
Acknowledgements
This study was supported by UNAM–DGAPA IN 100403 and CONACYT grant n° 42661. We thank A. Gonzalez-Rangel for assistance with the paleointensity measurements.