

Version française abrégée
Introduction
Succédant à un éon chaud particulièrement long [16], le Néoprotérozoïque montre, au sein de ses affleurements, des successions de faciès singuliers. Connus dès le milieu du XXe siècle pour leur faune atypique d’Ediacara (Australie), les dépôts néoprotérozoïques contiennent également des vestiges d’épisodes glaciaires s’étendant jusqu’aux basses latitudes. Pour expliquer l’existence de glaciers aux tropiques, le géologue B. Harland proposa le premier, dès les années 1950, la possibilité d’une période d’englacement total appelée The Great Infra-Cambrian Glaciation. Mais les climatologues de l’époque jugèrent cette hypothèse irréaliste, car une Terre devenue entièrement blanche posséderait un albédo si fort, que plus de 60% de l’énergie incidente serait réfléchie par la surface de la Terre. Dans ces conditions, la déglaciation ne s’opérerait qu’avec une augmentation de 30% de la constante solaire actuelle. L’absence d’un scénario de déglaciation rendait donc peu crédible l’existence d’une telle glaciation globale. Ce n’est que 40 ans plus tard que le géobiologiste Kirschvink (1992) supposa que, sur une Terre recouverte de glaces, l’absence d’altération des silicates favoriserait l’accumulation dans l’atmosphère du CO2 d’origine volcanique. Cet accroissement du CO2 générerait un méga-effet de serre suffisamment fort pour permettre la fonte des glaces ; ainsi la possibilité d’un scénario de sortie réactualisa la possible existence d’une glaciation globale [6,7].
Dès lors, de nombreuses études se sont intéressées aux conditions requises pour initier une glaciation globale. Le seuil d’entrée en glaciation en terme de pCO2 nécessaire a été estimé entre 1000 et 100 ppmv [2,3,20,21]. Ce grand intervalle s’explique par la hiérarchie des modèles climatiques utilisés. Ainsi, pour simuler l’initiation d’une snowball Earth autour de 750 Ma, le modèle AGCM LMDz requiert une pCO2 inférieure à 990 ppm, alors que le modèle EMIC (Earth Model of Intermediate Complexity) CLIMBER-2 [17], requiert une pCO2 inférieure à 150 ppm. Cette différence est due au rétrocontrôle de la dynamique océanique, qui dans CLIMBER, lutte contre l’englacement de la partie équatoriale par le transport de chaleur océanique, alors que, dans LMDz, cette dynamique océanique n’est pas prise en compte [1,3]. De nouvelles simulations, réalisées avec le GCM FOAM paramétré avec une banquise plus réaliste, ont permis d’obtenir une hard snowball, montrant que la dynamique océanique freine, mais n’empêche pas, la survenue d’une glaciation totale [13].
Une fois le seuil de CO2 d’entrée en hard snowball Earth estimé, une première estimation du seuil critique de sortie fut donnée grâce à des modèles climatiques simples dits EBM. Ces modèles ont établi ce seuil à 0,15 bar de CO2, soit plus de 400 fois la concentration actuelle, pour une insolation actuelle et à près de 0,29 bar pour une insolation néoprotérozoïque [10,18]. Au taux actuel de dégazage volcanique aérien (9 mbar Ma−1) [6], le temps nécessaire pour atteindre ces concentrations est estimé respectivement à 15 à 30 Ma.
Le principal problème de ces modèles EBM est qu’ils ne considèrent ni le cycle de l’eau, ni de véritable dynamique atmosphérique, la plupart de ces processus étant paramétrés sur l’Actuel. Pour mieux rendre compte du climat extrême d’une hard snowball Earth, R.T Pierrehumbert [18] a simulé, grâce à un modèle complexe de climat (FOAM), le comportement d’une Terre gelée soumise à très fortes teneurs en CO2 [18]. Les résultats obtenus confirmèrent que le seuil de CO2 devait être très élevé, car, même avec une pCO2 de 0,2 bar, la température à la surface équatoriale simulée reste très loin du seuil de fonte (273 K).
Pour étudier ce problème, nous avons testé, avec un autre AGCM (LMDz), l’évolution de l’effet de serre lié au CO2, mais aussi à la paramétrisation des nuages et du processus de convection, pour mettre en évidence leurs influences dans le budget radiatif d’une Terre gelée. Nos résultats démontrent que la paramétrisation des nuages influence la valeur du CO2 au seuil de sortie, qui pourrait être plus faible que les résultats précédents ne l’avaient laissé pensé.
Modèle et expériences
Le modèle du LMD est un modèle 3D atmosphérique utilisé pour simuler les climats futurs et passés, Quaternaire [12], comme Pré-Quaternaire [4,22]. La version utilisée (LMDz4) possède une résolution spatiale de 4° de latitude, 5° de longitude et 19 niveaux verticaux, avec un schéma convectif du type Kerry Emmanuel. Pour représenter une Terre totalement gelée, nous avons imposé une banquise sur la totalité de l’océan et recouvert les terres à 90% de glace, les 10% restant ayant les caractéristiques d’un sol nu. Dans nos simulations du Néoprotérozoïque (750 Ma), nous avons considéré une constante solaire de 6% inférieure à celle d’aujourd’hui (1283 W m−2), une paléogéographie (Fig. 1) du supercontinent Rodinia en position équatoriale [25] et utilisé les paramètres orbitaux actuels, qui positionnent la périhélie pendant l’été austral. Pour simuler l’englacement de la Terre, nous avons imposé une pCO2 de 100 ppmv et attendu 20 ans de simulation pour atteindre l’équilibre. À partir de cet état d’équilibre glaciaire, nous avons conduit cinq expériences de 10 ans avec différents taux de CO2, similaires à ceux utilisés par R. Pierrehumbert (330, 1600, 12800 ppmv, 0,1 et 0,3 bar), afin d’estimer le seuil critique de sortie simulé par le modèle LMDz.

Rodinia palaeogeography used in LMDz simulations. The mountains correspond to the Greenville orogenes.
Fig. 1. Reconstruction paléogéographique du Rodinia utilisée dans les simulations de LMDz. Les reliefs correspondent aux orogènes greenvilliens.
Résultats
Les simulations à 100 ppmv de CO2 mettent en évidence la grande similitude des résultats entre ces deux modèles (Fig. 2). Dans les deux modèles, on observe des valeurs nulles, voire négatives, de l’effet de serre dans l’hémisphère hivernal dès 30°N de latitude, dues à l’existence de couches d’air froid au sol, surmontées de couches d’air plus chaud, créant une situation stable où il ne se produit plus de convection. Ce phénomène installe une inversion thermique de surface, semblable à celles observées en Antarctique de nos jours, mais qui, dans le cas d’une hard snowball Earth, sont généralisées jusqu’aux moyennes latitudes. Ce phénomène d’inversion thermique empêche l’amplification de la température au sol par l’effet de serre. Ainsi, dans toute la zone où il se produit de manière prolongée des inversions thermiques, l’effet de serre est mis « en veille » [18]. L’extension géographique (équivalente, entre LMDz et FOAM) des inversions thermiques explique la dissymétrie du profil latitudinal de l’effet de serre.
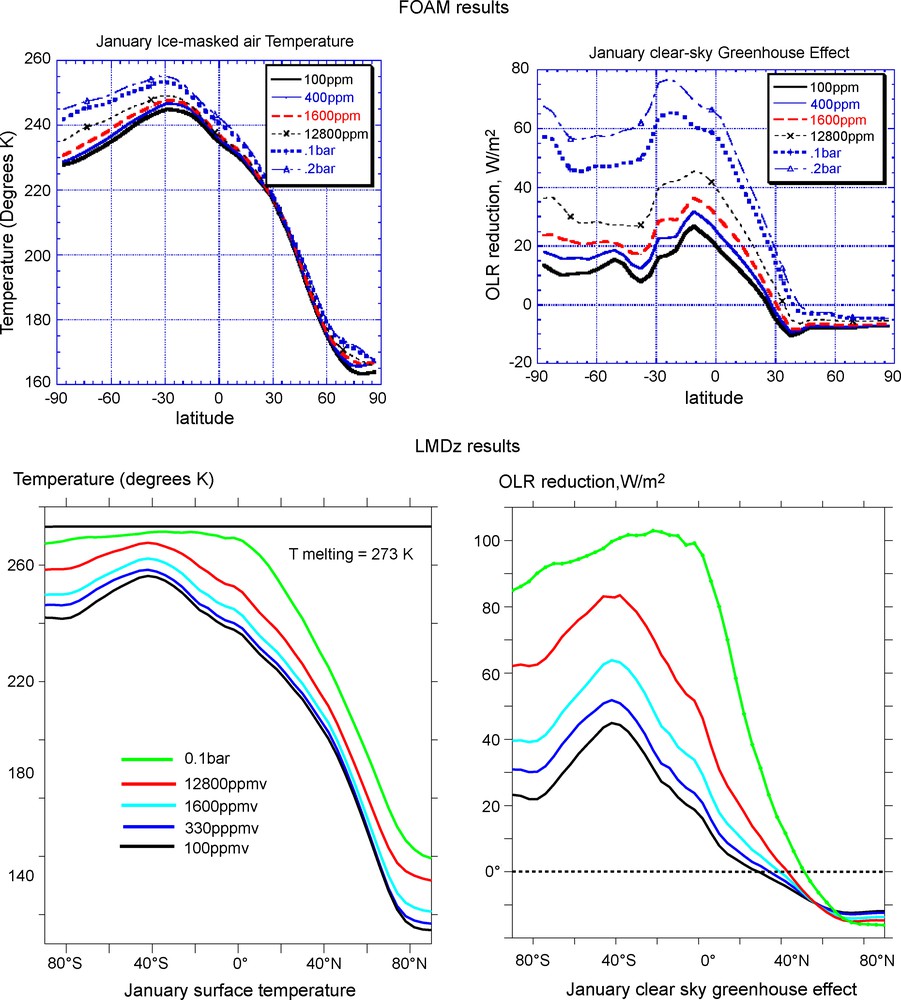
The surface temperature plots (left side) show clearly a distinct behaviour between both GCMs when the CO2 rate increases. At 0.1 bar, LMDz simulates a surface temperature greatly warmer than FOAM for the same CO2 level, and very close to the melting temperature. The warmer climate observed in LMDz is caused by the very large cloudiness impact, because in LMDz, even in clear sky, the surface temperature is computed with the cloud cover that affects the greenhouse effect (right side). We can see that LMDz greenhouse effect explains the behaviour difference between both GCMs; indeed, at 330 ppmv, the LMDz greenhouse effect value approaches the value of FOAM for 12 800 ppmv.
Fig. 2. La comparaison des températures de surface (partie gauche) montre clairement un comportement distinct entre les deux GCMs lorsqu’on augmente le taux de CO2 atmosphérique. À teneur de CO2 équivalente, l’effet de serre produit par LMDz est largement supérieur à celui simulé par FOAM (partie droite). Cette différence provient du large impact des nuages dans LMDz.
La différence de comportement des deux modèles s’accentue avec l’augmentation des concentrations en CO2. Le modèle LMDz est beaucoup plus sensible aux fortes teneurs en CO2 (Fig. 2). Cette différence entre les deux modèles laisse supposer que le comportement climatique diverge dans ces conditions extrêmes et que, par conséquent, la valeur de seuil est dépendante du modèle. En effet, avec le modèle LMDz, il nous a été possible d’atteindre ce seuil dès 0,3 bar, dans les tropiques sud pendant le mois de janvier, mais pas en moyenne annuelle (Fig. 3). À la vue des divergences de résultats, il apparaît évident que certains processus climatiques sont paramétrés différemment entre les deux modèles.
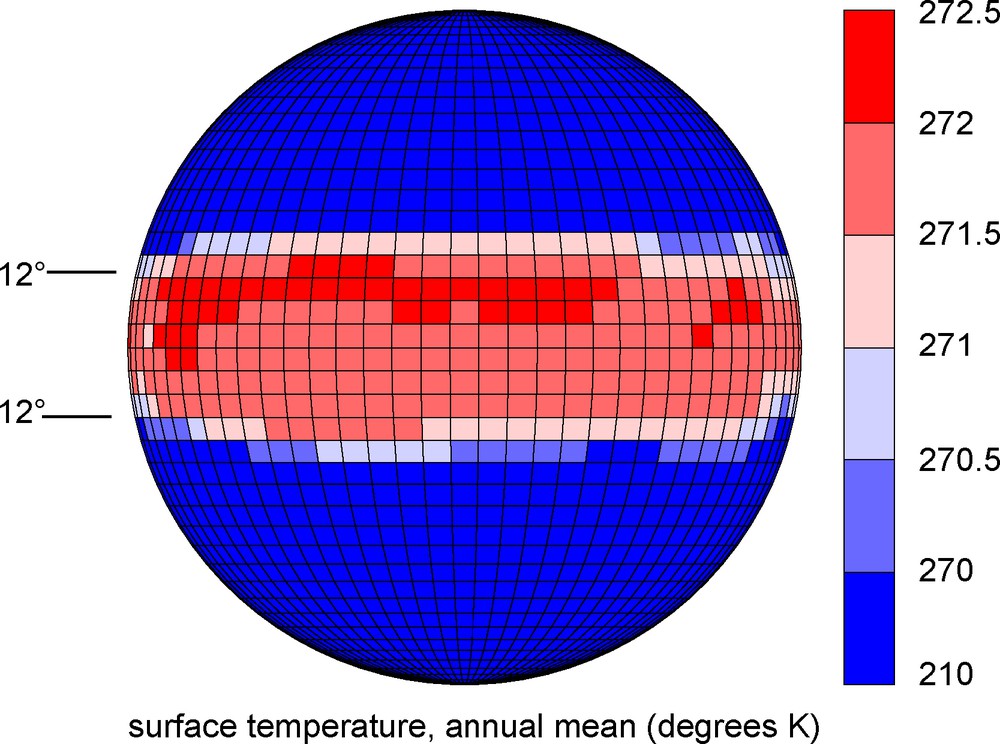
Annual surface temperature at 0.3 bar of CO2. Between 12°N and 12°S, the surface temperature reaches 272 K, a 1-degree value below the melting threshold. However, during the austral summer, this threshold can be overcome locally and can create open water areas in the south tropic, which may help to warm the snowball Earth.
Fig. 3. Température annuelle de la banquise à 0,3 bar de CO2. La température de surface atteint 272 K, ce qui est insuffisant pour initier la fonte. Cependant, durant l’été austral, ce seuil de fonte est atteint dans le tropique de l’hémisphère sud, ce qui pourrait entraîner la formation de zones d’eau libre et faciliterait le processus de déglaciation.
Cette différence de paramétrisation concerne essentiellement les nuages ; en effet, notre étude montre que la très forte nébulosité dans LMDz pourrait expliquer les importants écarts de valeurs entre les températures de surface obtenues. Cependant, les périodes glaciaires sont connues pour la faiblesse de leur cycle hydrologique ; alors, comment expliquer ce très fort forçage radiatif des nuages dans LMDz ? Premièrement, l’effet d’albédo des nuages est largement compensé par leur effet chauffant (Fig. 4). Deuxièmement, l’étude zonale du forçage radiatif exercé par les nuages (Fig. 5a), comparé au bilan P–E (Fig. 5b), montre que de l’eau reste disponible pendant l’été, surtout aux moyennes latitudes. Cette nébulosité est donc entretenue grâce à un cycle hydrologique résiduel persistant là où l’insolation est la plus forte, l’eau provenant alors d’un recyclage local.

The reduced albedo impact of clouds in snowball Earth compared with the present-day situation demonstrates a limited cold effect. Indeed, the albedo effect is largely overcome by the warming effect produced by the reflection of infra-red radiation back to the surface. All data are extracted from LMDz simulations. The present-day run has been performed with modern boundary conditions with a pCO2 fixed at 330 ppm, for which the cloud-cover diagnosis is close to the IPCC data. Values used in snowball Earth situation come from the SbCTRL simulation (pCO2 = 330 ppm).
Fig. 4. Durant la glaciation globale, le faible effet refroidissant dû à l’albédo des nuages est largement compensé par l’effet chauffant des nuages.
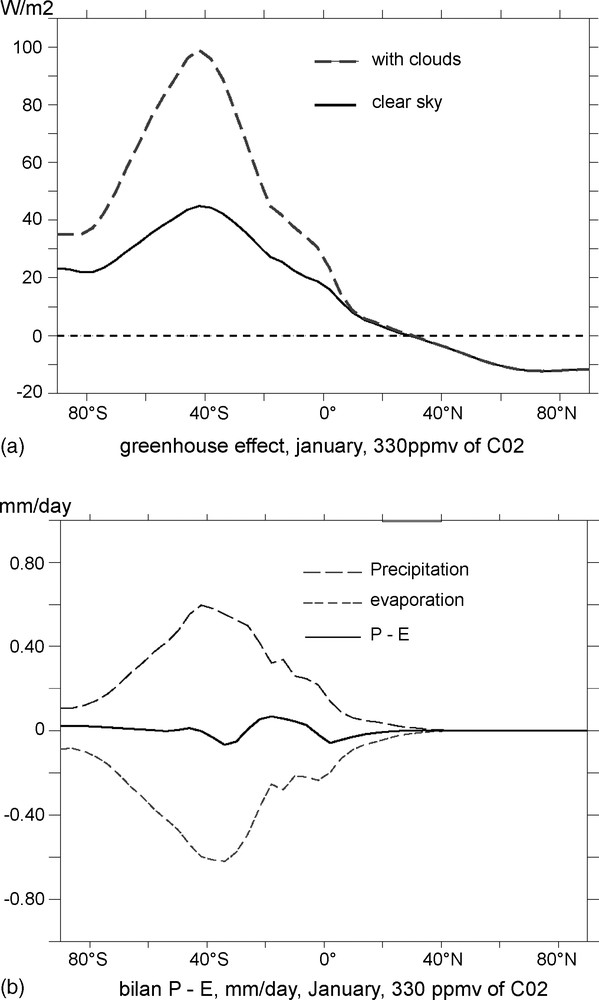
(a) The difference between cloudy and clear sky diagnostics represents the long-wave radiative forcing of the cloud-cover. (b) The low precipitation and evaporation values imply that a residual water cycle remains active in the mid-latitudes of the summer hemisphere. This result shows that the water source, which generates the cloud-cover, comes from a local recycling due to a sublimation process over the sea ice.
Fig. 5. (a) La différence entre le diagnostic ciel clair et ciel nuageux représente le forçage des nuages dans l’infrarouge. (b) Les faibles valeurs de précipitation et d’évaporation montrent qu’un cycle résiduel de l’eau persiste dans l’hémisphère d’été. Le maximum de précipitation aux moyennes latitudes correspond à la quantité maximum de nuages convectifs, également centrée sur les moyennes latitudes. Ceci suggère que la source d’eau qui forme les nuages vient d’un recyclage local dans l’hémisphère d’été.
Vu l’importance de la paramétrisation de la nébulosité, nous avons testé une dynamique atmosphérique mieux paramétrée aux conditions froides, pour mieux évaluer la quantité de nuages formée. Cette nouvelle dynamique associe une convection humide classique à une convection sèche, qui correspond à des mouvements d’ascendances thermiques adiabatiques, se déroulant dans les premiers kilomètres de la troposphère. L’apport de cette nouvelle paramétrisation serait de mieux simuler la dynamique d’une atmosphère glaciaire où l’eau disponible est rare. Cette simulation (SbDconv) montre que l’apport de chaleur et d’humidité par la convection sèche dans les couches inférieures (Fig. 6), accroît essentiellement la nébulosité de basse altitude. Ces nuages de basse altitude, qui n’ont que très peu d’effet de réchauffement, contrairement aux nuages de haute altitude (Fig. 6), réchauffent donc assez peu la surface (Tableau 2).

(a) Global nebulosity, annual mean. In such a kind of climate, the reduced cloudiness is mainly composed by large-scale ice clouds; convective clouds only persist in the ascendant branch of the Hadley cell. (b–c) Annual mean, effect of the dry convection. The humidity flux transported by dry ascendant mass flows in the lower troposphere (800 mb) increases the low-altitude cloud cover with a small impact on high-altitude clouds. At 330 ppmv of CO2, shallow convection leads the atmospheric dynamics, because the air temperature is too cold to involve an active deep convection.
Fig. 6. (a) Nébulosité, moyenne annuelle. Dans des climats froids comme lors de la snowball, la nébulosité est constituée par des nuages de glace de grande échelle à morphologie plutôt stratiforme. Seule une faible quantité de nuages convectifs persiste au niveau de la cellule de Hadley. (b–c) Effet des thermiques, moyenne annuelle. Le flux d’humidité transporté par les thermiques dans la basse troposphère augmente essentiellement la nébulosité de basse altitude (800 mb).
The following experiments have been performed with a pCO2 of 330 ppmv to keep a cold climate. The dry convection associated with a reduced size of ice nucleus shows a large increase in the greenhouse effect. This result demonstrates that, according to nebulosity adjustments, the radiative budget of clouds could largely change the greenhouse effect
Tableau 2 Selon la paramétrisation des nuages, l’effet de serre produit est largement modifié, montrant ainsi que la paramétrisation des nuages est le paramètre fondamental dans la variabilité des résultats obtenus entre les deux GCMs comparés
Pour mieux connaître l’impact de la nébulosité, nous avons réalisé deux nouvelles expériences, en modifiant les paramètres influençant les propriétés radiatives des nuages (Tableau 2). Tout d’abord, dans un climat froid et sec, la proportion de nuages convectifs est considérablement réduite ; nous avons alors fait le choix d’imposer une nébulosité stratiforme à l’atmosphère plus représentative de ce climat extrême (SbCld1). Dans la seconde simulation (SbCld2), nous avons diminué la taille des cristaux de glace au sein des nuages. En effet, en conditions de snowball Earth, les nuages classiques formés de gouttelettes d’eau sont remplacés par des nuages de glace constitués de microcristaux d’eau gelée. La taille de ces microcristaux est contrôlée par la température environnante ; plus il fait froid, plus leur taille est petite et leur croissance limitée. De plus, nous avons supposé que l’absence de pluies a permis d’allonger le temps de résidence dans l’atmosphère des poussières volcaniques et glaciaires. Ces poussières ont pu alors servir de noyaux de cristallisation pour la synthèse de nombreux microcristaux de glace, ce qui a participé à réduire leur taille. Ainsi, nous avons considéré que l’action du froid conjugué à la présence de nombreux grains de poussières a pu réduire la taille des microcristaux de glace constituant les nuages, ce qui nous a amenés à réduire par 2 leur diamètre (entre 10 et 30 μm).
L’observation des résultats montre que la nébulosité stratiforme accroît peu la température (+ 1 K), mais que la diminution de la taille des cristaux de glace accroît grandement le forçage radiatif de la nébulosité (+ 5 K) (Tableau 2). Ces simulations démontrent la grande dépendance du forçage radiatif des nuages à leur paramétrisation. Cette paramétrisation est suffisamment incertaine pour permettre une large gamme de solutions possibles: ainsi, FOAM prévoit une pCO2 élevée, alors que LMDz pronostique une déglaciation possible dès 0,3 bar, selon l’ajustement choisi pour les nuages, ce qui en fait un facteur-clé dans l’estimation du seuil de CO2 nécessaire pour déglacer.
Discussion
Si on suppose que cette convection sèche simule de meilleure manière les climats froids, alors une Terre entièrement glacée pourrait paradoxalement posséder une nébulosité relativement importante (Tableau 2). Ces nuages, possédant une paramétrisation favorable à leur effet chauffant dans LMDz, participeraient donc activement au déclenchement de la déglaciation. Ce dernier paramètre explique certainement le fort écart des valeurs d’effet de serre constaté entre les deux GCMs. Ainsi, ces nouveaux résultats montrent que l’impact des nuages rendrait possible l’initiation d’une déglaciation à un taux de CO2 avoisinant les 0,3 bar, ce qui suggère que le seuil de CO2 nécessaire pour déglacer est très dépendant du modèle utilisé, tout comme l’est celui d’entrée en glaciation.
Si, en revanche, les nuages interviennent très peu, il est alors nécessaire de considérer qu’un phénomène supplémentaire participe à l’initiation de la déglaciation, comme R. Pierrehumbert le suggère dans ses articles précédents [18,19]. Cet autre facteur ne peut pas être le méthane, car bien que l’atmosphère sèche et froide de la snowball Earth augmente considérablement son de temps de vie, l’absence d’activité biologique méthanogène dans le cas d’un océan recouvert par les glaces ne permet pas de compenser son oxydation, comme le démontrent les résultats de simulations obtenues avec le modèle INCA-ZD (Tableau 1).
Results of INCA-ZD simulations. The reduction of the air temperature and water vapour to simulate the snowball Earth's atmosphere demonstrates a drop in the OH level, which suggests a drastic reduction of the CH4 oxidation by OH during the glaciation. In INCA-ZD, the following parameters pCO2 and pO2 are fixed to modern values. To realize the following simulations, we have used a photolysis rate calculated for an albedo of 0.6 and the equilibrium is reached after two years
Tableau 1 Résultats de simulations par INCA-ZD. La très forte réduction de la teneur en OH dans l’atmosphère, due à la baisse de température associée à la faible vapeur d’eau, suggère un taux d’oxydation du CH4 très faible pendant la glaciation. Pour réaliser ces simulations, la pCO2 et la pO2 sont restées identiques aux valeurs de l’Actuel, le taux de photolyse étant calculé pour un albédo de 0,6. Le temps d’intégration est de deux ans pour obtenir l’équilibre
| Simulations | Air temperature (degrees K) | Water vapour in ppmv | Initial pCH4 in ppmv | Final concentration of OH in ppbv |
| CTRL | 288.15 | 10 000 | 1.7 | 0.09 |
| EXP01 | 223.15 | 10 000 | 1.7 | 0.21 |
| EXP02 | 223.15 | 100 | 1.7 | 0.035 |
| EXP03 | 223.15 | 100 | 170 | 0.007 |
Que l’augmentation de la teneur en CO2 dans l’atmosphère liée au dégazage volcanique soit le principal facteur à l’origine de la sortie de glaciation globale demeure probable ; toutefois, ainsi que le montre cette étude, le réchauffement lié aux nuages constitue un second facteur crucial pour expliquer la sortie de glaciation globale du Néoprotérozoïque.
1 Introduction
Succeeding a particularly long warm and ice-free eon [16], Neoproterozoic geological records preserve successions of singular facies. Known since the middle of the 20th century for their atypical fauna of Ediacara (Australia), Neoproterozoic deposits also contain glacial vestiges of episodes reaching the low latitudes. In the 1950s, the geologist B. Harland suggested for the first time that the presence of low-latitude glacial deposits could be an evidence for a globally ice-covered Earth, also called ‘Great Infra Cambrian glaciation’. But climatologists considered this assumption unrealistic ; because a soil entirely covered by ice would have an albedo of at least 0.6 (more than 60% of incoming solar radiation would be reflected), such a feature involving multiplication of the present-day solar constant by 30% is necessary to trigger the deglaciation. The lack of a plausible mechanism made snowball-Earth scenario very doubtful. Forty years later, in 1992, the geobiologist Kirschvink (see [7]) proposed that the absence of hydrologic cycle and silicates weathering on ice-covered Earth allows the accumulation of volcanic CO2 in the atmosphere providing the super greenhouse warming required to initiate deglaciation. The existence of an escape scenario made the snowball-Earth scenario more attractive and more popular [6,7].
As a consistent theory has been proposed to explain the end of snowball events, the onset of global glaciation has been studied with a hierarchy of models to resolve its initiation. [8]. Under reduced solar constant by 6% (1283 W m−2 instead of 1365 W m−2), intermediate complexity and general circulation models predicted a CO2 threshold required to initiate glaciation between 100 and 1000 ppmv [2,3,20,21]. This large range is due to the hierarchy of climatic models used. The LMDz AGCM requires a pCO2 lower than 990 ppm whereas Climber-2 EMIC model (Earth system Model Intermediate Complexity), requires a pCO2 lower than 150 ppm [1,3]. This difference is due to ocean dynamic feedback, which in CLIMBER [17] prevents the freezing of the equatorial ocean, but not in LMDz, because this process is not taken into account. New simulations performed with FOAM with a better sea-ice parameterization and a dynamical ocean showed that sea ice should go toward equator and rapidly generate a snowball Earth without ice-free ocean [13,20,21].
In the same time, first estimates of the CO2 threshold necessary to trigger the deglaciation from a ‘hard’ snowball Earth were carried out by simple climatic models (typically Energy Balance Models, EBM). These models established the critical level of CO2 around 0.15 bar for modern insolation, and 0.29 bar for Neoproterozoic insolation [10,18]. Based on the present-day volcanic CO2 flux (9 mbar Myr−1) [6], those values would be reached respectively after 15 Myr and 30 Myr. As EBMs do not consider the water cycle and atmospheric dynamics (all those processes being parameterised), and to better constrain such a kind of extreme climate, a series of simulations has been performed with a fully dynamic model, FOAM [18]. FOAM results showed that, even with an atmospheric content of 0.2 bar, the equatorial temperature remained 30 K below the level required for deglaciation, confirming that very high levels of atmospheric carbon dioxide are necessary to escape from a Neoproterozoic global glaciation.
To determine the greenhouse effect necessary to trigger the deglaciation we have used another AGCM, LMDz. These simulations also aim to test the impact of the cloud-cover and convective scheme parameterization on the radiative budget. Our results suggest that the CO2 threshold is dependent on the model used, and this variability seems to be due to the large range of possibilities in the cloudiness parameterization, suggesting that with the LMDz model, the critical threshold could be lower than the previous estimations.
2 Model and experimental design
LMDz is an AGCM designed to simulate future and past climates as the Quaternary [12], or the Pre-Quaternary periods [4,22]. The version we have used (LMDz4) has a spatial resolution of 4° in latitude, 5° in longitude and 19 vertical levels. The LMDz model includes a classic deep convection (Kerry Emmanuel moist convective scheme), which improves the cloud condensation and accounts for each type of clouds and their structure. To simulate a hard snowball Earth, we have prescribed an ocean covered in sea ice and a continental surface that is 90% covered in ice, with the remaining 10% having the characteristics of a bare soil. The sea-ice and soil albedo are similar to modern values (respectively 0.6 and 0.3), and the land-ice albedo represents a mixture between snow and ice (0.77). However, the albedo remains affected by the snow, even on the sea-ice. In our Neoproterozoic simulations (750 Myr), we have used a solar constant 6% lower than today (1283 W m−2) and a palaeogeography of the supercontinent Rodinia localized at the equator (Fig. 1) [25]. The orbital parameters are similar to the present-day ones and prescribe the perihelia during the Austral summer (January). To obtain a hard snowball Earth climatology, we imposed 100 ppmv of pCO2 during the first 20 simulated years, then we prescribed several levels of CO2 (330, 1600, 12 800 ppmv, 0.1 and 0.3 bar) to estimate the critical melting threshold in the LMDz model. The simulations reach equilibrium with the prescribed boundary conditions after five years. The analyses are done using the average of the five last years. In our simulations, the ocean is simulated by a prescribed SST, but as it is ice-covered, the surface temperature of ice is not influenced by SST. The virtual melting point occurs if the ice temperature reaches 273 K.
Working with high pCO2 requires that we check the validity of our radiative code, in order to correctly simulate the threshold. An important parameter in estimating the effect of CO2 is the change in the net radiative flux at the tropopause for a given temperature structure. To compare our radiative module, we have calculated the evolution of OLR (Outgoing Longwave Radiation), using several CO2 partial pressures, using the LMDz radiative module, and the polynomial fit developed by Khiel and Dickinson (K-D model) in their radiative-convective model [11] (see appendix 1). An OLR comparison at high concentrations of atmospheric CO2 may be interpreted as indicating that the LMDz radiative module is still appropriate for estimating the radiative effects of large amounts of CO2.
3 Results and discussion
3.1 pCO2 sensitivity
The simulations at 100 ppmv of CO2 show similar results with very close temperature profiles (Fig. 2). For both simulations, we can see a weak greenhouse effect in the winter hemisphere due to existence of surface temperature inversions, similar to those observed above the Antarctic nowadays, but which go toward mid-latitudes, in the case of a ‘hard’ snowball Earth. Thermal inversions occur when the ground temperature cools the surrounding air, and generates a subsidence. The existence of a cold air layer on the ground overlain by warmer air creates a very stable state without any convection, which inhibits the greenhouse effect, thus reduces its warming effect [18].
In this series of simulations with high CO2 levels, LMDz shows that the greenhouse effect increases faster than FOAM in response to an increase in CO2. Indeed, at 0.1 bar (Fig. 2), the summer surface temperature reaches 270 K, whereas for FOAM the temperature reaches only 255 K. This large greenhouse effect obtained with LMDz suggests that the deglaciation threshold seems to be model dependent, as already put forward [19]. According to our model with 0.3 bar of CO2, in January at 20°S, the latitude of maximum insolation, the snowball Earth receives enough energy to begin to melt locally on surfaces (land ice or sea-ice) without snow-cover. Thus the CO2 content required to trigger the deglaciation could be estimated around 0.3 bar, which corresponds to duration of 33 Myr, if we assume the degassing rate to be the same as the present-day one. However, in annual mean, the equatorial temperature remains 1 K below the melting point (Fig. 3). To reach 273 K in annual mean, our model needs 0.45 bar, showing that a large non-linear relation exists between CO2 level and greenhouse forcing in a CO2-enriched atmosphere.
As this new estimate involves a much longer duration of snowball-Earth episodes than the estimated duration deduced from geological data [6,7], around 10 Myr, we have performed a new set of simulations to test the potential ability of CH4 to enhance the greenhouse effect and reduce the snowball-Earth event's duration.
3.2 Sources and sinks of methane during the snowball event: why the CH4 cannot play an important role
To study the methane behaviour during a global glaciation, we have performed several simulations with a simple chemical model, INCA-ZD [5]. This box model resolves the tropospheric chemistry of more than 40 chemical species. Chemical element concentrations are prescribed, but can be changed. Under Neoproterozoic conditions, we assume that the air temperature was 50 K lower than today (EXP01) and that the water vapour content is reduced by 100 due to air temperature (EXP02), other parameters being fixed on the present-day conditions. In the last simulation (EXP03), we have supposed that during the Proterozoic, the pCH4 was of 170 ppmv, due to intense methane production by bacteria in the ocean [16], instead of the present-day value (Table 1). To know if the CH4 could be accumulated in the atmosphere, we have calculated the CH4 lifetime (see appendix 2) using the OH concentration, because the OH is the only CH4 sink in the atmosphere, and in our model.
A summary of the main results (Table 1) illustrates the OH evolution as a function of air temperature, water vapour content and initial pCH4 level. Experiment EXP03 represents the atmosphere composition at the onset of the glaciation [14,16]. The OH concentration is quickly stabilised at a value 13 times lower than today's one, due to a large decrease of the air temperature combined with a very low rate of available water vapour. Thus, we can suppose that in such a cold climate, the CH4 lifetime may be lengthened very significantly, from 10 years today to 85 years in the EXP03 [24]. Thus, during the total glaciation, the oxidation capacity of the atmosphere can be 93% lower than today's one, as suggested by experiment EXP03.
However, according to the classic snowball theory, the ocean and atmosphere are kept isolated by a large and thick layer of sea ice. Under these conditions, the biological source of methane (150 Mt yr−1 for today (IPCC), and 10 times more during the Proterozoic) has been stopped, the only remaining source being the continental geothermic areas and the volcanoes (outgassing rate = 6Mt yr−1, corresponding to 4% of the present-day natural sources [15]). After having added the sink and the source, we infer that the extremely cold and dry atmosphere preserves the methane because its capacity of oxidation is largely depleted, but not sufficiently to balance the stoppage of the biological methane productivity. Thus, according to our boundary conditions, the model seems to demonstrate that the methane concentration tends to decrease very slowly all along the glaciation, and suggests that methane does not play any role in the warming effect.
A scenario of continuous methane release similar to that of carbon dioxide seems to be doubtful. However, a potential event, like an abrupt seismic, which could destabilise clathrates, could be an additional source of methane causing a significant warming effect helping to initiate the deglaciation.
3.3 Impact of cloudiness on the radiative budget
As LMDz and FOAM behaviours appear different in response to an increase in the CO2 level and as LMDz reaches the deglaciation threshold with a lower pC02 than FOAM, it appears important to analyse the cloudiness forcing in LMDz in such a kind of a climate. Indeed at 330 ppmv of CO2, the long-wave forcing of the cloud-cover in LMDz reaches 50 W m−2 (Fig. 5a) in mid-latitudes of the summer hemisphere, but only 6 W m−2 in FOAM for a close value of CO2. The LMDz value is surprising, because it involves a radiative forcing equivalent to the present-day value, whereas in a glacial environment, the nebulosity is normally less important. Indeed, during the Last Glacial Maximum, the LMDz model simulates a reduced cloud-cover [23] as compared to the modern one for a temperature only 5 K lower than that of today.
Which process could generate this large warming effect? Firstly, in snowball Earth the cold albedo impact is overcame by its warm effect (Fig. 4). Secondly, the accurate analysis shows that the nebulosity radiative forcing is exclusively centred in mid-latitudes of the summer hemisphere (Fig. 5a) and that the P–E profile (Fig. 5b) has the same behaviour. Thus we can conclude that a residual hydrological cycle remains active during the summer, and that the local recycle is due to convective clouds localized in the Hadley cell. Elsewhere, the atmosphere is too dry to produce precipitations, confirming the weakness of the moist convection as already suggested.
However, one question persists: why has the cloud cover in LMDz a warming effect larger than that of FOAM? A new series of simulations focused on the nebulosity parameterization has been performed to resolve this problem. To better constrain the cloud-cover behaviour in a snowball Earth climate and to minimise the effect of the divergence in the radiative code, we have kept a low pCO2 to perform this new set of runs. We have successively tested three parameters implied in the cloud radiative budget (Table 2): the convection scheme, the morphology of clouds and their radiative property due to the size of the nucleus. In SbDconv simulation, LMDz runs with a new convection scheme associating a classic deep-convection scheme (Kerry-Emmanuel scheme) with a dry-convection one. This dry convection corresponds to dry ascendant mass-flows that occur in the first kilometres of the atmosphere. In arid atmosphere, this process, which may also occur in the present atmosphere, may become much more important than moist convection, due to drastic reduction of water cycle. The second simulation (SbCld1) addresses the potential change in cloud morphology, because in such a cold climate the nebulosity may evolve towards a large scale stratiform morphology. To take this feature into account ; we have changed the cloud distribution law in the model to obtain a stratiform nebulosity. In a last experiment (SbCld2), we have changed the ice-nucleus size. Indeed, in a snowball environment, the clouds are formed by microscopic ice-crystals instead of tiny water drops as in the present-day state. The size of ice nucleus is linearly linked to the temperature [9] and drives the radiative property of the ice clouds. Moreover, the near absence of precipitation due to the shutdown of the hydrologic cycle may allow accumulation of fine dust, produced by glacial scouring of the continental surface as well as volcanic aerosols, enhancing their atmospheric lifetime. Since the snowball environment may prevent the grown at ice crystals due to nucleus abundance [26] and low water availability, we have reduced by 2 the ice-nucleus size compared to the used parameterization in the present-day conditions.
A summary of results is given in Table 2. In the SbDconv simulation (Fig. 6), the humidity flux produced by the dry convection carries a supplementary input of humidity in the low troposphere (Fig. 6b). The main consequence is the reinforcement of the low cloud cover (Fig. 6c), but as this type of clouds has a small warming effect, the increase of the surface temperature remains small. For the second factor (SbCld1), the large scale stratiform nebulosity provides a weak additional increase of surface temperature around 1 K. In the run with an ice-nucleus modified size (SbCld2), we can see that the long-wave forcing reaches 24 W m−2 in annual mean, overcoming largely the short-wave effect ; thus, according to our parameterization, a small ice-nucleus size enhances the ice-cloud warming effect.
Thus even if the dry convection does not resolve the problem of the large warming effect of the cloud cover in LMDz, here we have shown that the radiative impact of clouds mainly depends on ice-cloud properties (thickness, altitude, morphology and especially ice-nucleus size), which underline the importance of further research on the behaviour of clouds in cold convective regime. Thus we suppose that the ice-cloud adjustment choice appears a key factor to explain the difference observed between both GCMs, because it leads the snowball Earth's nebulosity radiative budget.
4 Conclusion
The objective of this study was to determine the factors that help to achieve the deglaciation of a global ice-covered Earth. A series of experiments was undertaken to evaluate the impact of greenhouse gases and nebulosity. In the light of our results, clouds appear clearly to play an important role in the initiation of the deglaciation. Unfortunately, for technical contingencies, we have not performed a run without cloud cover to better compare FOAM and LMDz. However as the radiative behaviour is close, the divergence is due to the ice-clouds micro-physics as suggested here. Those results demonstrate that using AGCM to simulate extreme conditions, such as snowball Earth's glaciation, involves a well-constrained parameterization, because small changes can have large effects. Even if ideal GCM does not exist for the Neoproterozoic, uncertainties in clouds parameterization result in a wide range of solutions. In this study, we have shown that the LMDz cloudiness feedback associated with 0.3 bar of CO2 reaches the critical threshold in 32 Myr. The different cloud parameterization from FOAM, which increases largely the cloud-cover forcing, can yield a warmer snowball climate, which is considerably easier to deglaciate. We believe that higher and accurate intercomparisons between theses models, or other GCMs, have to be carried out to help constraining the CO2 threshold.
Acknowledgements
This work was achieved thanks to the financial support of the CEA and the CNRS though the Eclipse program Comprendre et modéliser la planète Terre and in collaboration with the US Climate Systems Center, which receives funding from the US National Science Foundation under grant ATM-0121028
Appendix 1
Correction of the radiative module of the LMDz model
To check the validity of our radiative code, we have extracted the radiative module from the GCM model. Using the radiative module, we have fixed the temperature profile (based on US standard profiles), tropopause height and clouds levels to be coherent with the Khiel and Dickinson equation adapted to be used in CO2-enriched atmosphere [11]. We have performed a series of simulation with several pCO2 and compared the evolution of OLR (Outgoing Longwave Radiation) The OLR difference between LMDz value and the Khiel and Dickinson equation represents the LMDz divergence. Since the divergence remains low (3 W m−2 at 0.1 bar), LMDz remains appropriated for estimating the radiative effect of large amounts of CO2. However, as the validity range of the KD equation does not exceed 0.17 bar, above this value, CO2 levels used in LMDz are just an approximation.
Appendix 2
To calculate the CH 4 lifetime, we use the Smith and Shindell equation [24]
= Tm/(a Stropo(M) + 1 − a)
Tm = pre-industrial time residence of CH4 (8.4 years)
= new time residence of CH4
Stropo(M) = CH4 sinks
a = % tropospheric sink/total sinks
ex pre-industrial sink: tropospheric sink = 88%
stratospheric sink = 7%
soil sink = 5%
During the Proterozoic snowball, the soil sink is cut, thus:
- snowball sinks of CH4 → Tropospheric sink = 92%
→ Stratospheric sink = 8%
ex: Neoproterozoic snowball-Earth CH4 time residence:
EXP02 pOH is 40% lower than the present-day value, thus the snowball tropospheric sink is equivalent to 8% of the preindustrial tropospheric sink (Stropo). In this case, the new time residence = 56 years.