

1 Introduction
Understanding water-retention properties of soil remains a major issue in soil science. Because of the growing demand for soil hydraulic properties, a common solution has been to use pedotransfer functions (ptfs) that relate basic soil properties that are considered as easily accessible to the less often measured soil properties, such as hydraulic properties [1]. A huge number of ptfs was developed over the last three decades and we are facing today the continuous development of ptfs of increasing complexity, with very little or no information about the potential increase in the prediction quality. There is some information available about the performance of continuous ptfs [10,17], very little about the performance of class ptfs [14,17], and even less about the compared performance of these two types of ptfs [15]. The aim of this study is to show that the variation of water-retention properties can be predicted by using stratification based on information about particle-size distribution and structure. We show also that the quality of the prediction is similar to or better than that achieved with much more sophisticated ptfs, despite what is usually admitted.
2 Materials and methods
2.1 The ptfs developed in the literature
Most ptfs published in the literature are continuous pedotransfer functions (continuous ptfs), i.e. mathematical continuous functions between the water content at discrete values of potential or the parameters of a unique model of water-retention curve and the basic soil properties (mostly particle-size distribution, organic carbon content and bulk density) [12,17]. Besides these continuous ptfs that enable continuously the prediction of water content at particular water potentials [13] or estimation of the parameters of models of the water-retention curve [5,10,17], there are class pedotransfer functions (class ptfs) that received little attention, because their accuracy is considered as limited [15]. The existing class ptfs often provide average water contents at particular water potentials, or one average water-retention curve for every texture class [3,11]. Due to the range in particle-size distribution, clay mineralogy, organic matter content, and structural development within each texture class, water-retention properties for individual soils were considered as varying considerably [16]. Despite their possible inaccuracies, class ptfs enable the prediction based on successive stratification using soil characteristics. Moreover, class ptfs are easy to use because they require little soil information and are well adapted to the prediction of water-retention properties over large areas [9,15,16].
2.2 The soils studied
Class and continuous ptfs were developed using a set of 320 horizons, comprising 90 topsoils (from 0 to 30 cm depth) and 230 subsoil horizons (> 30 cm depth) collected in Cambisols, Luvisols, Planosols, Albeluvisols, Podzols, and Fluvisols [8] located mainly in the Paris basin and secondarily in the western coastal marshlands and Pyrenean piedmont plain. A set of 107 horizons comprising 39 topsoil and 68 subsoil horizons was constituted in order to test the ptfs established. These horizons were collected in Cambisols, Luvisols and Fluvisols [8] located in the South of the Paris basin. Basic characteristics and water-retention properties of the horizons were determined as described earlier by Bruand and Tessier [2] (Fig. 1, Table 1). Their bulk density (Db) was measured by using cylinders 1000 cm3 in volume when the soil was near to field capacity.

Triangle of texture used (a), texture of the horizons used to develop the class and continuous ptfs (b) and texture of those used to test their validity (c).
Fig. 1. Triangle de texture utilisé (a), texture des horizons utilisés pour développer les classes de fpt et les fpt continues (b) et texture des horizons utilisés pour discuter leur validité (c).
Characteristics of the horizons of the data set used to develop the ptfs and of the test data set
Tableau 1 Caractéristiques des horizons de l’ensemble de données utilisées pour développer les fpt et de celles utilisées pour en discuter la validité
| Particle size distribution (%) | OC (g kg−1) | CaCO3 (g kg−1) | CEC (cmolc kg−1) | Db (g cm−3) | Volumetric water content (cm3 cm−3) | |||||||||
| <2 μm | 2–50 μm | 50–2000 μm | θ 1.0 | θ 1.5 | θ 2.0 | θ 2.5 | θ 3.0 | θ 3.5 | θ 4.2 | |||||
| Horizons used to establish class and continuous ptfs (n = 320) | ||||||||||||||
| mean | 28.9 | 46.2 | 24.9 | 5.7 | 65 | 14.3 | 1.53 | 0.350 | 0.335 | 0.316 | 0.289 | 0.257 | 0.220 | 0.179 |
| s.d. | 15.1 | 20.8 | 23.9 | 4.9 | 189 | 8.0 | 0.15 | 0.067 | 0.065 | 0.070 | 0.070 | 0.075 | 0.074 | 0.070 |
| min. | 1.9 | 2.8 | 0.1 | 0.0 | 0.0 | 0.8 | 1.00 | 0.123 | 0.100 | 0.080 | 0.056 | 0.048 | 0.033 | 0.013 |
| max. | 92.9 | 82.1 | 90.1 | 28.8 | 982 | 52.8 | 1.84 | 0.606 | 0.596 | 0.586 | 0.558 | 0.510 | 0.462 | 0.370 |
| Horizons used to test the ptfs (n = 107) | ||||||||||||||
| mean | 30.2 | 40.6 | 29.2 | 6.6 | 38 | 15.8 | 1.51 | 0.356 | 0.332 | 0.312 | 0.287 | 0.261 | 0.224 | 0.202 |
| s.d. | 15.4 | 24.3 | 28.6 | 5.3 | 134 | 10.8 | 0.13 | 0.075 | 0.079 | 0.082 | 0.084 | 0.086 | 0.083 | 0.080 |
| min. | 1.9 | 4.1 | 1.6 | 0.0 | 0.0 | 0.6 | 1.10 | 0.161 | 0.121 | 0.099 | 0.072 | 0.045 | 0.041 | 0.033 |
| max. | 78.7 | 80.3 | 91.8 | 28.2 | 656 | 50.2 | 1.77 | 0.534 | 0.498 | 0.482 | 0.457 | 0.440 | 0.396 | 0.369 |
2.3 Analysis of the ptfs performance
In order to discuss the global validity of the ptfs, most studies used the root-mean-square error (RMSE), which is also called root-mean-square deviation or root-mean-square residual [17]. Because the RMSE varies according to both the prediction bias and precision, we computed the mean error of prediction (MEP) that enables discussion of the prediction bias alone, on the one hand, and the standard deviation of prediction (SDP) that enables discussion of the prediction precision alone, on the other hand. We computed MEP and SDP for the whole water potentials as follows:
In order to discuss the validity of the ptfs at the different water potentials, we computed also the mean error of prediction (MEP′) and the standard deviation (SDP′) of prediction at every water potential as follows:
3 Results and discussion
3.1 The class and continuous ptfs developed
The class ptfs developed in this note were established according to the texture (textural class ptfs) in the CEC triangle [4] and then according to both that texture and Db (texturo-structural class ptfs). The resulting class ptfs corresponded to the average water content at seven water potentials, which was computed within every class of texture (textural class ptfs) (Table 2) and every class combining both texture and Db (texturo-structural class ptfs) (Table 3). More complex class ptfs were established by fitting the van Genuchten's model [6] on the arithmetic mean value of θ at the different values of water potential using the RETC code [7] for every class of texture (VG texture class ptfs) according to the CEC triangle [4] and to the type of horizon (topsoil and subsoil) (Table 4).
Textural class ptfs developed
Tableau 2 Classes de fpt texturales développées
| Volumetric water content (cm3 cm−3) | |||||||
| θ 1.0 | θ 1.5 | θ 2.0 | θ 2.5 | θ 3.0 | θ 3.5 | θ 4.2 | |
| Very fine (n = 15) | 0.455 | 0.437 | 0.424 | 0.402 | 0.385 | 0.357 | 0.322 |
| Fine (n = 60) | 0.399 | 0.388 | 0.373 | 0.351 | 0.331 | 0.301 | 0.254 |
| Medium fine (n = 96) | 0.356 | 0.342 | 0.327 | 0.298 | 0.254 | 0.210 | 0.173 |
| Medium (n = 117) | 0.334 | 0.320 | 0.302 | 0.273 | 0.242 | 0.203 | 0.156 |
| Coarse (n = 32) | 0.249 | 0.224 | 0.181 | 0.149 | 0.120 | 0.100 | 0.076 |
Texturo-structural class ptfs developed
Tableau 3 Classes de fpt texturo-structurales développées
| Volumetric water content (cm3 cm−3) | ||||||||
| θ 1.0 | θ 1.5 | θ 2.0 | θ 2.5 | θ 3.0 | θ 3.5 | θ 4.2 | ||
| Very Fine (n = 15) | 1.10 ≤ Db < 1.30 | 0.498 | 0.473 | 0.451 | 0.423 | 0.405 | 0.371 | 0.330 |
| 1.30 ≤ Db < 1.50 | 0.459 | 0.439 | 0.428 | 0.405 | 0.385 | 0.352 | 0.328 | |
| 1.50 ≤ Db < 1.70 | 0.359 | 0.359 | 0.361 | 0.353 | 0.347 | 0.340 | 0.294 | |
| Fine (n = 60) | 1.00 ≤ Db < 1.20 | 0.519 | 0.499 | 0.494 | 0.461 | 0.431 | 0.373 | 0.281 |
| 1.20 ≤ Db < 1.40 | 0.452 | 0.443 | 0.421 | 0.385 | 0.373 | 0.340 | 0.271 | |
| 1.40 ≤ Db < 1.60 | 0.391 | 0.378 | 0.361 | 0.344 | 0.321 | 0.289 | 0.250 | |
| 1.60 ≤ Db < 1.80 | 0.338 | 0.334 | 0.325 | 0.307 | 0.291 | 0.275 | 0.244 | |
| Medium Fine (n = 96) | 1.20 ≤ Db < 1.40 | 0.348 | 0.338 | 0.323 | 0.291 | 0.232 | 0.188 | 0.153 |
| 1.40 ≤ Db < 1.60 | 0.359 | 0.343 | 0.328 | 0.298 | 0.258 | 0.211 | 0.175 | |
| 1.60 ≤ Db < 1.80 | 0.353 | 0.345 | 0.329 | 0.303 | 0.263 | 0.230 | 0.190 | |
| Medium (n = 117) | 1.20 ≤ Db < 1.40 | 0.354 | 0.337 | 0.314 | 0.278 | 0.245 | 0.193 | 0.140 |
| 1.40 ≤ Db < 1.60 | 0.346 | 0.329 | 0.310 | 0.275 | 0.235 | 0.193 | 0.146 | |
| 1.60 ≤ Db < 1.80 | 0.320 | 0.307 | 0.293 | 0.270 | 0.248 | 0.214 | 0.167 | |
| 1.80 ≤ Db < 2.00 | 0.296 | 0.289 | 0.274 | 0.266 | 0.258 | 0.231 | 0.186 | |
| Coarse (n = 32) | 1.40 ≤ Db < 1.60 | 0.241 | 0.210 | 0.164 | 0.135 | 0.106 | 0.093 | 0.075 |
| 1.60 ≤ Db < 1.80 | 0.253 | 0.231 | 0.188 | 0.156 | 0.126 | 0.103 | 0.077 |
Parameters of the van Genuchten's model corresponding to the VG textural class ptfs developed according to the type of horizon (topsoil and subsoil)
Tableau 4 Paramètres du modèle de van Genuchten correspondant aux classes de ptf VG texturales développées en fonction du type d’horizon (horizon de surface et horizon de subsurface)
| θ r | θ s | α | n | m | |
| Topsoils | |||||
| Coarse | 0.025 | 0.397 | 1.0592 | 1.1530 | 0.1327 |
| Medium | 0.010 | 0.428 | 0.4467 | 1.1000 | 0.0909 |
| Medium fine | 0.010 | 0.465 | 0.6860 | 1.1027 | 0.0931 |
| Fine | 0.010 | 0.477 | 0.6153 | 1.0652 | 0.0612 |
| Very Fine | 0.010 | 0.587 | 5.9433 | 1.0658 | 0.0617 |
| Subsoils | |||||
| Coarse | 0.025 | 0.367 | 1.0535 | 1.1878 | 0.1581 |
| Medium | 0.010 | 0.388 | 0.1851 | 1.0992 | 0.0903 |
| Medium fine | 0.010 | 0.416 | 0.1611 | 1.0978 | 0.0891 |
| Fine | 0.010 | 0.437 | 0.1334 | 1.0632 | 0.0594 |
| Very Fine | 0.010 | 0.472 | 0.0745 | 1.0499 | 0.0475 |
Continuous ptfs were also developed. They correspond to multiple regression equations as follows:
Regression coefficients and coefficient of determination R2 recorded for the continuous ptfs developed
Tableau 5 Coefficients de régression et coefficients de détermination R2 enregistrés pour les ptf continues développées
| Water potential (hPa) | |||||||
| –10 | –33 | –100 | –330 | –1000 | –3300 | –15000 | |
| a | 0.4701*** | 0.3556*** | 0.2620*** | 0.1301*** | 0.0184 | –0.0504 | –0.0786** |
| b | 0.0026*** | 0.0029*** | 0.0034*** | 0.0038*** | 0.0045*** | 0.0047*** | 0.0045*** |
| c | 0.0006*** | 0.0008*** | 0.0012*** | 0.0012*** | 0.0008*** | 0.0005*** | 0.0003*** |
| d | –0.0006 | –0.0002 | 0.0002 | 0.0010 | 0.0017*** | 0.0012** | 0.0004 |
| e | –0.1447*** | –0.0939*** | –0.0647*** | –0.0084 | 0.0398* | 0.0697*** | 0.0710*** |
| R 2 | 0.59 | 0.64 | 0.69 | 0.74 | 0.77 | 0.82 | 0.86 |
VG continuous ptfs developed for the parameters of the van Genuchten's model
Tableau 6 Relations correspondant aux fpt VG continues développées pour les paramètres du modèle de van Genuchten
| θs = 1.1658 − 0.0032 × C − 0.4737 × D + 2 × 10⁻⁷ × S2 − 0.0001 × OC2 + 0.0373 × C−1 + 0.0131 × S−1 − 0.0072 × ln(S) + 0.00003 × OC × C + 0.0022 × D × C − 0.0002 × D × OC − 0.0001 × S (R2 = 0.95) |
| α* = 25.61 + 0.0439 × C + 0.1129 × S + 1.1914 × OC + 32.21 × D − 10.48 × D2 − 0.0009 × C2 − 0.0146 × OC2 − 0.3781 × OC−1 − 0.0178 × ln(S) − 0.1032 × ln(OC) − 0.1 × D × S − 0.6001 × D × OC (R2 = 0.26) |
| n* = – 15.29 − 0.0659 × C + 0.0115 × S − 0.2115 × OC + 12.33 × D − 1.3578 × D2 + 0.0006 × C2 + 0.0031 × OC2 + 4.0005 × D−1 + 2.2003 × S−1 + 0.1643 × OC−1 − 0.1205 × ln(S) + 0.2693 × ln(OC) − 9.9367 × ln(D) + 0.003 × D × C + 0.0694 × D × OC (R2 = 0.35) |
3.2 Validity of the class ptfs
The textural class ptfs underestimated very slightly the water retained (MEP = −0.003 cm3 cm−3) when they were applied to the test dataset without any other stratification than according to the texture. There was no decrease in the prediction bias with the texturo-structural class ptfs (MEP = −0.004 cm3 cm−3), but the bias was already very small with the textural class ptfs studied. However, the precision was slightly better with the texturo-structural class ptfs (SDP = 0.043 cm3 cm−3) than with the textural class ptfs (SDP = 0.045 cm3 cm−3) (Fig. 2a and b). Compared to the textural class ptfs, the VG textural class ptfs showed similar performance. The bias was very small (MEP = 0.002 cm3 cm−3) and the precision poor (SDP = 0.045 cm3 cm−3), as recorded for the textural class ptfs (Fig. 2c). The comparison of the class ptfs performance at every value of water potential showed small bias (−0.008 ≤ MEP′ ≤ 0.007 cm3 cm−3) except for θ4.2 for the textural and texturo-structural class ptfs (MEP′ = –0.020 and –0.019 cm3 cm−3) and for θ1.0 for the VG class ptfs (MEP′ = 0.014 cm3 cm−3), for which it was greater (Table 7). This comparison showed also poor precision for the three class ptfs studied, whatever the water potential (0.040 ≤ SDP′ ≤ 0.047 cm3 cm−3).
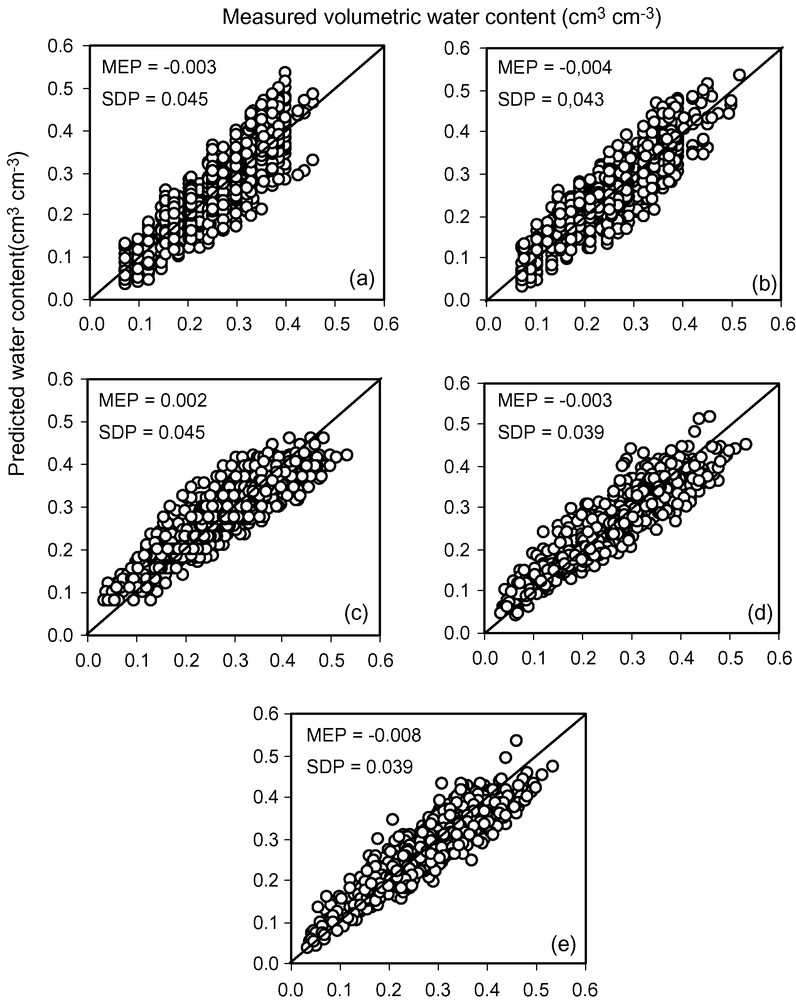
Validity of the textural class ptfs (a), texturo-structural class ptfs (b), VG textural class ptfs (c), continuous ptfs (d), and VG continuous ptfs (e) developed.
Fig. 2. Validité des classes de fpt texturales (a), texturo-structurales (b), et VG texturales (c), ainsi que des fpt continues (d) et VG continues (e).
Validity of the continuous and class ptfs according to the water potential
Tableau 7 Validité des classes de fpt et des fpt continues aux différentes valeurs de potentiel de l’eau
| Volumetric water content (cm3 cm−3) | ||||||||||||||
| Mean error of prediction (MEP’) | Standard deviation of prediction (SDP’) | |||||||||||||
| θ 1.0 | θ 1.5 | θ 2.0 | θ 2.5 | θ 3.0 | θ 3.5 | θ 4.2 | θ 1.0 | θ 1.5 | θ 2.0 | θ 2.5 | θ 3.0 | θ 3.5 | θ 4.2 | |
| Textural class ptfs | −0.006 | 0.004 | 0.003 | 0.001 | −0.004 | −0.001 | −0.020 | 0.046 | 0.046 | 0.044 | 0.045 | 0.047 | 0.044 | 0.042 |
| Texturo-structural class ptfs | −0.006 | 0.002 | 0.002 | 0.001 | −0.005 | −0.002 | −0.019 | 0.042 | 0.042 | 0.041 | 0.043 | 0.045 | 0.044 | 0.041 |
| VG class ptfs | 0.014 | 0.007 | −0.003 | −0.008 | −0.007 | 0.007 | 0.002 | 0.045 | 0.045 | 0.045 | 0.046 | 0.046 | 0.043 | 0.040 |
| Continuous ptfs | −0.006 | 0.001 | 0.005 | 0.001 | −0.003 | 0.002 | −0.022 | 0.044 | 0.044 | 0.040 | 0.039 | 0.036 | 0.032 | 0.030 |
| VG continuous ptfs | 0.012 | 0.004 | −0.008 | −0.017 | −0.020 | −0.008 | −0.016 | 0.044 | 0.041 | 0.038 | 0.039 | 0.035 | 0.033 | 0.032 |
3.3 Validity of the continuous ptfs
When applied to the test data set, the continuous ptfs lead to very small bias (MEP = –0.003 cm3 cm−3) and showed poor precision (SDP = 0.039 cm3 cm−3). Results showed a greater bias with the VG continuous ptfs (MEP = –0.008 cm3 cm−3) and similar poor precision (SDP = 0.039 cm3 cm−3) than with the continuous ptfs (Fig. 2d and e). The comparison of the continuous ptfs performance at every value of water potential showed small bias for the continuous ptfs (−0.006 ≤ MEP′ ≤ 0.005 cm3 cm−3), except for θ4.2 (MEP′ = –0.022 cm3 cm−3). For the VG continuous ptfs, the bias was greater for six water potentials with absolute value of MEP′ ≤ 0.020 cm3 cm−3, except for θ1.5 (MEP′ = 0.004 cm3 cm−3) (Table 7). The precision was poor for the simple and VG continuous ptfs (0.030 ≤ SDP′ ≤ 0.044 cm3 cm−3), but results showed that SDP decreased with the water potential.
3.4 Comparison of the class- and continuous ptfs
Results showed very little difference between the ptfs studied. The bias recorded was small (–0.008 ≤ MEP ≤ 0.002 cm3 cm−3) and the greatest absolute value of bias was recorded with the VG continuous ptfs (MEP = –0.008 cm3 cm−3). On the other hand, the precision was poor (0.039 ≤ SDP ≤ 0.045 cm3 cm−3), the greatest precision being recorded with the two types of continuous ptfs studied. If the VG continuous ptfs led to the greatest precision (SDP = 0.039 cm3 cm−3), they led also the greatest bias value (MEP = –0.008 cm3 cm−3).
4 Conclusion
Our results showed that textural class ptfs led to prediction performance that are similar to those recorded with more sophisticated class ptfs and with continuous ptfs. Thus without knowing the particle-size distribution, organic carbon content and bulk density as required by most ptfs, we can predict the water-retention properties with similar prediction quality by using the texture alone. Our results showed also that use of both texture and bulk density slightly increases the precision when compared to the precision recorded with the textural class ptfs. Finally, we showed also that class ptfs, including very simple ptfs, should be still considered as useful tools for predicting the water-retention properties of soils, particularly at scales for which semi-quantitative or qualitative basic soil characteristic such as the texture are the only characteristics available. More generally, our results pointed out that discussion of ptfs performance should refer to those recorded with simple ptfs, thus enabling to quantify how much prediction bias and precision can be gained when increasing the complexity of ptfs and consequently the number and quality of predictors required.