

1 Introduction
Among the expected consequences of climate change is the increase in the frequency of extreme meteorological events [14]. Extremes like floods, droughts, and heat waves generate an array of economic, social, and health impacts that must be studied in order to anticipate them. The summer of 2003, with the unprecedented heat wave that occurred during the first two weeks of August 2003 is, in many respects, a premonitory episode of climate change and its impacts through summer extremes.
On average over months of June, July and August (JJA), the temperature anomaly over Europe was of about 3 °C [44] and rose up to 5–6 degrees in central Europe [4]. This exceptional anomaly has been shown to be most probably the highest since the Middle Ages, as concluded from analysis of past grape harvest dates [10]. Whether the extreme 2003 temperatures are symptoms of a man-induced already warmer climate is impossible to prove rigorously. The summer mean temperature anomaly was larger than five times the standard deviation over Switzerland, making it highly improbable in a stationary climate with Gaussian temperature distributions. When compared to climate predictions, 2003 European summer temperatures were in the same range as those obtained for the end of the 21st century are. For instance, the cumulative frequency distribution of daily maximal temperatures along the JJA season in Basel is almost identical to that simulated with climate regional under the pessimistic SRES A2 scenario, assuming 800 ppm of CO2 in 2100 [3]. Other summer mean lower troposphere temperature anomalies of similar relative amplitude and spatial extent than that of 2003 occurred earlier in other areas of the northern mid-latitudes, contradicting the unprecedented character of the 2003 anomaly in a global context [9]. However, such anomalies were found in the late part of the record, in the 1990s.
The summer of 2003 claimed many environmental, economic and health impacts, and it should be considered as a training experiment of the impacts of climate change. Hydric stress to vegetation during the whole summer resulted in a net 0.5 Pg carbon source, representing about 5% of the total global fossil fuel carbon actual yearly release [11]. The drought conditions that prevailed also induced ecosystems damages by numerous wild fires that burnt an area four times wider than average in Mediterranean countries [49]. The increased wild fire activity in southern Europe also contributed to the impairment of local air quality and visibility by enhancing the emissions of primary pollutants [27].
Health-related impacts of summer 2003 temperatures were the most dramatic. An overall excess of mortality of about 35,000 deaths across Europe during the 1–20-August heat wave was estimated [59]. The largest death toll was in France, with about 15,000 excess deaths [24], an excess of 54% relative to normal. Other countries were also hit hard, like Switzerland, with a mortality excess of 7% (about 1000 deaths [22]), Spain (15% [34]), England and Wales (∼2000 excess deaths [47]), Italy (3100 [12]), or the Netherlands (1000–1400 [19]). These excess deaths were particularly frequent in cities with largest temperature anomalies [50]. In Paris, mortality peaked on 12 August, at the end of the highest temperature episode, as shown in Fig. 1, taken from [50]. There, a total of 142% excess deaths occurred during the whole summer of 2003.

Comparison of daily mortality rate and temperature in Paris, France, for year 2003 and the four-year average 1999 to 2002. After Vandentorren et al. [50].
Fig. 1. Comparaison entre le taux de mortalité et la température à Paris, France, pour l’année 2003 et la moyenne des quatre années de 1999 à 2002. D’après Vandentorren et al. [50].
Most of these deaths were among vulnerable elderly people. Among the environmental factors that lead to an excess of mortality, the dominant one seems to be the heat itself, and especially the temperature in the environment of the vulnerable people, in and near the building [51]. Bad air quality and exposure to photo-oxidants as ozone and related pollutants in heat waves have also been quoted as an important risk factor [40], although estimates of this risk vary much from one study to another. In the Netherlands, Fischer et al. [19] estimated that about extra 400–600 deaths (more than 1/3) were due to exposure to high ozone concentrations in the Netherlands during the heat wave. Stedman [47] predicted a number of extra deaths within 400–800 in England and Wales (20–40%). In France, a detailed multivariate analysis carried out over nine cities showed numbers varying from one city to another [17]. In Paris, their estimated fraction of excess risk due to ozone is only about 7%, while it exceeds 50% in Marseille.
The objective of this article is to review previous results and to show new ones about the exceptional combined effects of the heat wave on meteorology and air quality. We studied the regional and urban spatial scales, with a focus on Paris, as it was the large city most hit by heat wave consequences. In § 2, we review the regional characteristics of the heat-wave meteorology and its urban component, by means of observations and model simulations. In § 3, the consequences of heat wave on ozone concentrations are discussed, again using observations and models. In § 4, the consequences of heat wave on particulate matter concentrations are presented. In § 5, we discuss the extent to which the 2003-heat-wave air quality can be used to predict air quality within a future climate, whereas § 6 contains concluding remarks.
2 Heat wave meteorology
2.1 Regional-scale meteorology
The summer of 2003 was the warmest ever recorded in Europe. The summer was dominated by anticyclonic weather regimes favourable to the development of heat and drought [8,18]. These weather regimes were connected with amplifying factors and positive feedbacks so that extreme temperatures were reached. First of all, the summer was preceded by a large negative precipitation anomaly across Europe [6], a precondition to summer heat, especially when located over southern Europe [55]. The land–atmosphere coupling was essential in 2003, through several feedbacks [20]: drier soils increase sensible heat fluxes, reduce cloudiness and precipitation, increase upper-air anticyclone [20], enhancing temperature and radiation thereby increasing drought. In August 2003, after several drought weeks, hydric stress inhibited latent heat fluxes and converted solar energy to sensible heat fluxes [6], leading to extreme temperatures. Land–atmosphere coupling was also complemented by an increase of sea-surface temperature around Europe, especially in the Mediterranean Sea, which also helped maintaining anticyclonic weather and heat [15], a coupling that could explain a significant part of the temperature anomaly. In simulations of the future warmer climate, these various feedbacks between soil moisture and atmosphere thermal structure and circulation have also been found to be key drivers of the European summer-climate variability and the decline of rainfall and the increase of heat [42,46].
In 2003, average June temperatures were the most anomalous, especially in Switzerland [44], with anomalies reaching 6–7 degrees. Even though the circulation was much less stagnant in July and brought maritime fresher air, the corresponding average temperature was among the top ten since 1864. The drought due to June weather persisted through July and helped in creating the August heat wave. Most of the time the wind circulation was anticyclonic and the air was recirculated throughout Europe and over the Mediterranean Sea, as also revealed by the analysis of ozone simulations [52]. These stagnation and recirculation led to accumulation of pollutants, together with the accumulation of heat.
Coming with anticyclonic conditions are also other dynamical processes of importance for air quality: subsidence can inhibit the development of the diurnal boundary layer, thereby increasing pollutants concentration. This effect is contradicted by the extreme temperature and drought, inducing larger sensible heat fluxes than normal, leading to powerful updrafts.
2.2 Urban-scale meteorology
At the scale of large cities, summer heat was amplified by several factors due to the so-called urban-heat island (UHI): the lack of vegetation and dry soil cover, increasing the ratio of sensible to latent heat fluxes, and the multiple reflections in the urban canopy leading to radiation trapping and storage of heat [21,38]. It is important to show that state-of-the-art mesoscale models are able to simulate the weather encountered during such an extreme episode, and to analyse the important variables, which is the objective of this article.
In order to simulate conditions of the urban climate during the heat wave (UHI, urban breeze…), numerical simulations were carried out. The non-hydrostatic mesoscale atmospheric research model Meso-NH, developed by Météo France and the ‘Laboratoire d’aérologie’ [29], was used to simulate atmospheric circulation, ranging from the large meso-alpha scale down to the microscale. Meso-NH uses the Town Energy Balance (TEB) urban scheme [35] in order to parameterize town–atmosphere dynamic and thermodynamic interactions. Using the ‘urban canyon’ geometric model, the TEB scheme computes the surface-energy budget for every urban surface type. TEB also simulates both the canyon and building temperatures (wall, roof, and road), which are analysed in this paper during 2003 heat waves. Lemonsu and Masson [30] and Sarrat et al. [43] already used such numerical tools to simulate anticyclonic situations over Paris. Thermal and dynamic aspects of the boundary layer have been investigated and one of the most pronounced effects of Paris on climate, which is the formation of an UHI, has been observed, and simulated with Meso-NH and TEB.
The simulation was performed with Meso-NH over a large region around Paris. Two nested model domains are used: the first domain (Grid1) covers a 1200 km × 600 km area with a 6-km resolution and the second (Grid2), covers a 180 km × 180 km area with a 2-km resolution. Boundary and initial conditions of the larger domain are defined by the European Centre for Medium-range Weather Forecasts (ECMWF) analyses, updated every six hours. The two model domains use two-way grid-nesting interactions. Both model domains adequately resolve the boundary layer processes, with a vertical grid including 52 levels. The first level is situated at the roofs level (∼30 m). Simulation runs were performed over a 144-h time period, from 8 August, 00 UTC, until 14 August 2003, 00 UTC, with hourly outputs.
A comparison between surface observations and model outputs has been performed in order to evaluate the simulation. The surface network in the area of interest (Paris and its suburbs) contains 58 operational meteorological stations from the French weather service Météo France: 17 with daily outputs, 41 with hourly outputs. Three categories of stations are distinguished: 22 urban stations, located in areas with a fraction of urbanization over 50%, 16 suburban stations with a fraction of urbanization between 10 and 50% and 20 rural stations with an extent of urbanization under 10%. Data from the radiosounding from Trappes and measures of temperatures and humidity over 30 m from an instrumental mast, located in Paris-Charles-de-Gaulle airport, were also available for this study.
2.3 First results of the numerical simulation of the heat wave over Paris
Typical behaviours for the different urban classes, especially concerning the cooling and warming up rates and magnitudes, have been observed and simulated with Meso-NH and TEB: urbanization strongly modifies the surface-energy budget [58]. The net radiation (Q*) is used by the surfaces to heat the atmosphere through the sensible flux (Qh), or for heat storage (Qs), and for evaporation flux (Qe): Q* = Qs + Qh + Qe. Here, simulated budgets in both rural and urban areas are compared (see Fig. 2), noting that no flux observations were available for the Paris region.

Simulated surface energy budgets, 10 August 2003, for the Paris-Montsouris urban station and for the Viabon rural station, in the ‘département’ of Eure-et-Loir (France). The components are the net radiation (Q*), the sensible flux (Qh), the heat storage flux (Qs) and the latent flux (Qe).
Fig. 2. Bilans énergétiques en surface simulés, pour le 10 août 2003, pour Paris-Montsouris et la station rurale de Viabon, dans le département de l’Eure-et-Loir. Les composantes sont le rayonnement net (Q*), le flux sensible (Qh), le flux de stockage (Qs) et le flux latent (Qe).
In the urban area, at the Paris-Montsouris station, the most significant output flux is the storage heat flux (Qs), which reaches 275 W m−2 at 10 UTC. The sensible flux (Qh) is also important in the city (325 W m−2 at 13 UTC), since the latent flux (Qe) is close to zero, because vegetation cover is only 12% in this part of Paris, which limits the evapotranspiration process. By contrast, Qe predominates at the rural site of Viabon and reaches 350 W m−2 at 12 UTC, where vegetation dominates. At night, all the fluxes are negligible in the countryside, corresponding to very low energy exchanges between the surface and atmosphere. By contrast, the urban budget exhibits negative values of Qs (directed towards the atmosphere), explaining the large nighttime maximum of the urban heat island (UHI), sometimes producing a heat plume in moderate or strong synoptic wind. The 9 August 2003, at 23 UTC, is a good illustration of a heat plume oriented in the southwesterly direction over Paris, which is consistent with the northeasterly synoptic wind (see Fig. 3).

Simulation of a heat urban plume, 9 August 2003 at 23 UTC. Superimposition of the fields of temperature at 2 m and horizontal wind at 30 m. The urban area essentially covers the four central districts displayed on the map.
Fig. 3. Simulation du panache de chaleur, le 9 août 2003 à 23 h UTC. Superposition des champs de température à 2 m et du vent horizontal à 30 m. La zone urbaine couvre essentiellement les quatre départements centraux représentés sur la carte.
Rousseau [41] explained that the diurnal variation of temperature was an essential parameter that could explain the comparatively high mortality in the Paris region during the heat wave of 2003. In fact, the maximum of temperature occurred at 17–18 UTC and, between 13 and 20 UTC, the temperature was higher than 35 °C. Both days of 11 and 12 August were characterized by extremely unfavourable conditions: a long period of diurnal heat, followed by a warm night period. Over Paris, maximal and minimal temperatures of respectively 39 °C and 26 °C have been observed. Furthermore, minimal temperatures measured at 30-m level of the mast located in Paris-CDG airport was higher than 25 °C during these two consecutive nights.
The model faithfully reproduces the temporal evolution of 2-m temperatures at the Paris-Montsouris station (see Fig. 4a). However, the model overestimates temperatures at the end of the night, especially on 12 August, due to too coarse model resolution in comparison with the specific location of the station. The simulation of building temperatures (Troof, Troad, Twall) helps representing the influence, on persived temperature in townsfolk, of building characteristics, such as albedo, thermal conductivity… Fig. 4b shows the time evolution of artificial materials temperatures; one can see that important values of maximal and minimal building temperatures have been simulated. Actually, temperatures of roof, road, and wall simulated by TEB reach respectively 59, 48, and 42 °C, and so, are clearly more important than temperatures at 2-m level simulated and observed.

(a), evolution of observed (Tobs) and TEB-simulated (Tsimul) temperatures at 2 m at the Paris-Montsouris station. (b), evolution of artificial materials temperatures simulated by TEB: temperatures of roofs (Troof), of roads (Troad) and of walls (Twall).
Fig. 4. (a), évolution de la température observée (Tobs) et simulée (Tsimul) à 2 m pour la station de Paris-Montsouris. (b), évolution des températures de différents matériaux artificiels simulées par le modèle TEB : toits (Troof) ; routes (Troad) ; murs (Twall).
This simulation and its comparison with observations show that models are now able to simulate sharp characteristics of urban meteorology in extreme weather, such as the heat wave. A more detailed study will be carried out later, with the objective to improve knowledge on the relationships between urban climate and urban planning. The other objective will be to simulate the 2003 heat wave over Paris with a very high resolution (∼500 m) and to measure the impact of urban materials properties on urban meteorology. The results of this study should help understanding the heterogeneous pattern of mortality that occurred in Paris.
3 Ozone concentrations during the summer of 2003
3.1 Continental scale
The anticyclonic conditions that prevailed during summer 2003 induced favourable conditions to the development of several ozone episodes. Fig. 5 shows the JJA seasonal median and 90th centile of daily maxima averaged over 34 stations in Europe, taken from the EMEP network (http://www.emep.int), and calculated as in [54]. The centiles are computed only on those stations that were already in use in 1990. A larger set of stations (61) was available from 1995 to 2004, and results are superimposed. As the EMEP stations network contain only rural stations, daily maximal ozone concentrations are representative of the continental scale, and usually do not contain city plumes.

Median and 90th centile of the ozone daily maxima (ppb) for each summer (JJA season), calculated over a set of 34 stations with homogeneous (no large missing periods or breaks) data from 1990 to 2004 (solid circles) and from another set (61 stations) with homogeneous data from 1995 to 2004 (open circles).
Fig. 5. Médiane et 90e centile des maxima journaliers de l’ozone (ppb) pour chaque été, calculés sur un ensemble de 34 stations avec données homogènes (pas de grande période manquante) depuis 1990 jusqu’à 2004 (cercles pleins), et pour un autre ensemble (61 stations) avec données homogènes de 1995 à 2004 (cercles ouverts).
Summer 2003 median daily maximal concentration is much higher than that of other summers, with an anomaly about twice as large as the largest anomaly recorded between 1990 and 2004. In the 90th centile, this anomaly is superimposed with a general decreasing decadal trend. This trend is consistent with the precursor nitrogen oxides and non-methane volatile organic compounds emission reductions in Europe [28]. Unlike for the median, the 2003 90th centile is not the highest, and does not exceed that of 1990. As a result from emission reductions since then, the range of ozone daily maxima has decreased, as suggested by the evolution of the difference between the 90th centile and the median for hot summers like 1990, 1994, and 2003. The exceptional 2003 meteorology produced more medium-to-high concentrations (say 60–70 ppb) than the 1994 meteorology, but extremes were not higher.
Mean daily maxima, now calculated over the available EMEP stations in 2003, remain higher than that of summers 2000, 2001, 2002, and 2004 for most days along the summer, as shown in Fig. 6. Concentrations were unusual in three periods: the first half of June, a two-week period in mid-July and most of August. During the August heat wave, mean European daily maximum concentrations reached values above 70 ppb, which were the only encountered during the 2000–2004 period, showing the generalized character of the episode.
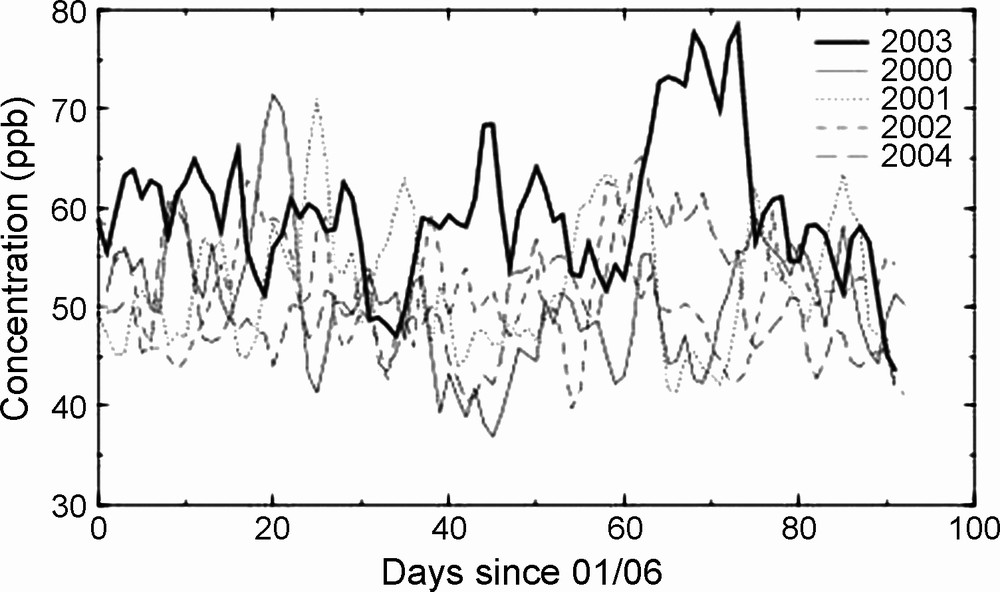
Time series of the mean ozone daily maxima during summers of 2001 to 2004. Averages are calculated over the EMEP stations with available data from 2000 to 2004. Concentrations are in ppb.
Fig. 6. Séries temporelles de la moyenne des maxima journaliers d’ozone des étés de 2001 à 2004. Les moyennes sont calculées sur les stations EMEP disponibles de 2000 à 2004. Les concentrations sont en ppb.
The spatial extent reached by the ozone episode during the heat wave covers a large fraction of western Europe. Fig. 7, taken from [52], shows the ozone concentrations simulated by the CHIMERE chemistry-transport model on 8 August 2003 at 14:00 UT. During the previous days, all city plumes accumulated and stagnated over continental Europe, leading to wide cloud of ozone over northwestern Europe. Another ozone cloud developed independently over the Mediterranean region, arising mostly from the large urban areas of Milan, Genoa, Marseilles, and Barcelona. A third one concerned the Portuguese coast.

Surface ozone concentration field (in μg m−3, roughly divide by 2 to obtain ppbv) simulated by the model with the modified deposition on 8 August 2003 at 14 h UT, together with the station locations marked as empty circles when concentration at that time does not exceed 180 μg m−3 and shaded circles when it does. After [52].
Fig. 7. Concentrations d’ozone en surface (en μg m−3, diviser par 2 pour obtenir des ppb), simulées par le modèle avec un dépôt modifié pour le 8 août 2003 à 14 h UTC, avec les stations marquées par des cercles vides si la concentration ne dépasse pas 180 μg m−3, et en cercles pleins si elle dépasse 180 μg m−3. D’après [52].
The structure of the summer 2003 ozone mean daily maxima anomalies (relative to the JJA average of 2000–2001–2002–2004) summers exhibits maximal values over the East of France, reaching about 15 ppb (Fig. 8). Strong positive anomalies were also found in Switzerland and Austria, and in other scattered stations. Therefore, the ozone anomaly structure roughly followed the temperature anomaly structure, with increased values over central Europe.

Mean ozone daily maxima anomalies for the 2003 summer (JJA) relative to the mean of 2000–2001–2002–2004, using available EMEP stations during that period.
Fig. 8. Moyenne des anomalies des maxima journaliers d’ozone pour l’été 2003 par rapport à la moyenne des étés 2000–2001–2002–2004, en utilisant les stations EMEP disponibles durant cette période.
The main driving factor for ozone build-up is stagnation of air masses rich in primary compounds in clear weather. However, other factors, such as larger than normal biogenic emissions, were also important in 2003 (Curci et al., manuscript in preparation). During anticyclonic conditions, subsident air can also lead to a downward ozone flux originating from the upper troposphere or even the lower stratosphere, enriching further the polluted boundary layer. Such a situation was reported during the ESCOMPTE field campaign (see [13] and references therein). However, downward fluxes can be, at least partly, compensated by divergence and deposition. A comprehensive study of all these effects is presented in [36].
3.2 Urban scale
As in Section 2, we focus on the Paris area as a case study of the impact of the heat of summer 2003 on ozone. As for most of western Europe, the Paris area underwent persistently high ozone concentrations during summer 2003. Monitoring of ozone in and around Paris has been carried out since the early eighties by the Airparif association (see website: http://www.airparif.asso.fr). After year 2000, eight ozone-monitoring sites regularly spaced around Paris at distances of about 30–50 km from the centre were set up. Most of the city ozone plumes can therefore be captured by the monitoring network. Within the city, about 12 ‘urban stations’ also monitor ozone. Fig. 9 shows the 10th, 50th and 90th centiles of ozone daily maxima for summers (JJA) 2001 to 2006, for which data were available.

Centiles (10, 50, and 90) of ozone daily maximal concentrations in urban areas (thick solid lines) and rural areas (thin solid lines) over the greater Paris region, as measured by the Airparif monitoring stations. See http://www.airparif.asso.fr for more details of station locations.
Fig. 9. Centiles (10, 50 et 90) des maxima journaliers d’ozone dans la zone urbaine francilienne (courbe épaisse), et les zones rurales (courbe fine). Voir http://www.airparif.asso.fr pour plus de détails sur la localisation des stations.
Again summer 2003 has the highest ozone centiles for both rural and urban stations. Ozone concentrations are usually higher at rural sites than at urban sites, due to the titration of ozone by freshly emitted nitrogen monoxide by traffic or industry. This is particularly true for low centiles and median values. However, for 90th centiles, typical of stagnant episodes, urban values are close to rural values. In 2003, the urban 90th centile is slightly larger than its rural counterpart is. Summer 2006 also exhibits this behaviour, and it was characterized by a long heat wave of lower amplitude than in 2003 during the month of July. During these two summers, the amplitude of the anomaly in urban areas is larger for urban areas than for rural areas for high centiles. In such cases, air is generally stagnant and photochemical smog builds up over or near the urban area, where the highest concentrations are found. By contrast, lower ozone centiles occur in windier or cloudier conditions when NO titration is more effective. Thus, the sensitivity of ozone concentration to heat waves appears higher in urban areas than in rural areas. Thus, health impacts of future climate on ozone could be larger in cities than elsewhere; the impacts on crops may however be significant in rural areas.
4 Particulate matter and wildfire smokes
Ozone was not the only pollutant that accumulated during the stagnant 2003 heat wave period and, more generally during the entire summer. Aerosol particulate matter, which is also among species threatening human health, was found within elevated levels during this period. Heat-wave weather conditions were favorable to both the accumulation of regular anthropogenic aerosol emissions, and the chemical formation of secondary aerosol components. In addition to these sources, sporadic emissions grandly contributed to the increase of aerosol concentrations: dust particles blown from the dry soil by near-ground wind and turbulence or transported Saharan dust [53], and smoke emitted from forest fires [27,57].
4.1 Wildfires activity over Europe during the heat wave and air quality
During summer 2003, southern Europe experienced one of the most severe fire seasons of the past two decades. The combination of abnormally hot temperatures and drought resulted in a number of exceptionally large wildfires, especially in the Iberian Peninsula and the western part of the Mediterranean basin, releasing into the atmosphere significant amounts of smoke particles. Fig. 10 shows the distribution of smoke emissions as retrieved from the MODIS satellite rapid-fire counts (http://rapidfire.sci.gsfc.nasa.gov) for the time period from 1 July to 31 September 2003 [27]. The Fig. indicates that the major emission sources were located in central and southern Portugal, southern France, Italy and the eastern Adriatic coast. The most intense wildfire activity occurred in central Portugal during the first half of August (3–5 August). According to the statistical analysis reported by Barbosa et al. [2], summer 2003 was the most intense fire season that Portugal faced in the last 23 years, with a total area burned estimated to 380,000 ha (∼5% of its forest area), which is about five times the average burnt area since 1980. Estimates of the wildfire activity show that they generated more than 100 kt of primary smoke particles PM2.5 (particles smaller than 2.5 microns in diameter) during the heat-wave period (1–15 August), which is comparable to the total amount of PM2.5 anthropogenic emissions in western Europe for the same period [27].

Wildfire locations and estimated fine aerosol (PM2.5) emissions (tons = 106 g) derived from MODIS data over Europe for the period from 1 July until 30 September 2003. After [27].
Fig. 10. Lieux des zones de feux et estimations des émissions de particules fines (PM2.5) à partir des données de MODIS sur l’Europe pour la période du 1er juillet au 30 septembre 2003. D’après [26].
These fires were found to contribute significantly to aerosol optical thickness and radiation over the Iberian Peninsula. This contribution actually extended much further over Europe [27]. This modeling study was based on the mesoscale chemistry-transport model CHIMERE/MM5 [5,21,26,45] that has been improved (i) to include the MODIS daily smoke emission inventory [60], (ii) to simulate the transport patterns (injection altitude and dispersion) of smoke plumes and (iii) to calculate their radiative forcing using the radiative transfer model TUV (Tropospheric Ultraviolet Visible [33]).
Although the fire events occurred locally over a limited time period (typically for 1–3 days), their influence on aerosol chemical and radiative properties was significant, not only close to the fire source regions, but also over a large part of Europe, as a result of the long-range transport of smoke. A large increase in PM10 mean concentrations (from 20 to 200%) during the heat-wave period was predicted [27] over several regions in Europe: the largest increase was found within a 200-km area around the fire source locations (up to 40 μg/m3), while a more moderate increase (3–5 μg m−3) was observed over the southern Mediterranean basin and Benelux countries. In addition to the smoke aerosols, the accumulation of anthropogenic particles during the stagnant heat-wave conditions induced high levels of particulate matter in the vicinity of major European urban and industrial areas: e.g., in Paris, the observed PM10 daily mean concentrations reached 50 μg m−3 [25] and exceeded the European air quality advisory standards for particulate matter.
A strong optical signature associated with wildfire emissions has been found in the routine ground-based measurements of aerosol optical thickness (AOT) provided by the AERONET network (see, e.g., [32]). AOT values are the good indicator of aerosol concentrations both near the ground (mainly anthropogenic emissions) and in the free troposphere (lofted smoke and dust aerosol layers), as they are proportional to the aerosol column-integrated atmospheric load. Smoke particles characterized by high AOT (>0.4) and high Ångstrom exponents (α > 1.5 = fine-mode particles) were observed in the fire source regions of southern and central Portugal (2–15 August), and over a large part of the Mediterranean basin (southern France from 5–15 August; Rome and Lampedusa from 5–20 August [39]). High values of AOT and α were also observed over northern Europe [26] during the first half of August (3–15 August) as a result of both the accumulation of urban pollutants during stagnant heat-wave conditions, and the high-altitude advection of the smoke plumes from the major Portuguese wildfire that occurred on 3–4 August.
The transport of smoke particles from the Portugal fire region across northern Europe was particularly well captured by the MODIS satellite. Fig. 11 shows the spatial distribution of the aerosol optical thickness at 550 nm as observed by MODIS and simulated by the CHIMERE model (with (c) and without (b) fire emissions) over Europe from 3 to 5 August.

Geographic distribution of the aerosol optical thickness at 550 nm over Europe from 3 to 5 August 2003 as (a, left column) retrieved from the MODIS sensor, and simulated by the CHIMERE model (b, middle column) without and (c, right column) with fire emissions. After [27].
Fig. 11. Distribution géographique des épaisseurs optiques d’aérosols à 550 nm sur l’Europe du 3 au 5 août 2003 : (a, colonne de gauche) établie à partir de MODIS et simulée par le modèle CHIMERE (b, colonne du milieu) sans et (c, colonne de droite) avec les émissions dues aux feux. D’après [26].
The satellite observations (Fig. 11a) clearly show the progressive accumulation of the aerosol load as the smoke plume is transported in an anticyclonic flow from the source region in Portugal (3–4 August) to Great Britain and the Netherlands on 5 August, and finally towards eastern and southern Germany on 6 August and Italy on 7 August (not shown here). The aerosol optical thickness over northern Europe (including Great Britain, France, Germany and the Benelux countries) is significantly increased from low ‘background’ values (<0.2) to extremely high AOT peaks (>0.8) associated with smoke aerosols.
Because the aerosol optical properties during this episode are largely dominated by smoke aerosols, the model run without fire emissions (Fig. 11b) fails to reproduce the observed peaks, though it is able to capture the prominent AOT spatial features caused by anthropogenic sources. Accounting for fire emissions allows the model to capture the transport path of the smoke plume across the continent (Fig. 11c). The model reproduces the high AOT values fairly well over the fire source region in Portugal and along the west coast of France, and the low AOT in the Mediterranean areas. By comparing the model reference run with the one incorporating fire emissions, it can be seen that the smoke emissions make a major contribution to aerosol optical properties. Indeed, our case implies that AOT values associated with smoke aerosols are a factor of 2–3 larger than those associated with only anthropogenic sources over polluted regions in Europe.
4.2 Impacts of wildfires on photolysis and radiation
The presence of highly absorbing aerosols in the lower troposphere from wildfires has been shown to inhibit near-ground ozone formation and to reduce ground-level ozone concentrations in polluted environments. A recent study [31] estimated that the 10–30% reduction of the J(NO2) and J(O1D) photolysis rates by black carbon aerosol in the planetary boundary layer resulted in a decrease of surface ozone concentrations by 5–20% under highly polluted conditions in the Houston area.
During the major wildfire event (2–7 August), the highly absorbing fire smoke particles over northern Europe significantly perturbed radiation and photolysis [27]. The perturbation to J(NO2) and J(O1D) was responsible for a 10–25% decrease in photolysis rates throughout a large part of southern and northern Europe during the whole month of August 2003 (see Fig. 12). The observed photolysis frequencies in northern Germany (Jülich 6.41E, 50.91N) during the major wildfire episode of 2–7 August indicated a 15–30% reduction in photolysis frequencies at the surface in both datasets [7]. The largest reduction was observed on 5 August, which coincides with the arrival over northern Europe of smoke particles from Portugal forest fires. The large temporal and spatial extent of this photolysis rate reduction is striking and suggests that wildfire emissions could strongly impact regional photochemistry and modify ozone production. Besides the radiative effect of smoke aerosols on photolysis, wildfire emissions can also directly modify the amount of ozone by changing its precursor gases, such as nitrogen oxides (NOx) and volatile organic compounds (VOC). This effect is however limited to the fire source region and have not been evaluated in this study.

(a, left column) Model estimated changes (%) in the surface photolysis frequency of NO2 (%) due to the effect of wildfire aerosol emissions on photolytic radiation during months of July–August–September 2003. (b, right column) Smoke daily mean radiative forcing (W m−2) over Europe during the summer months July–August–September 2003. After [27].
Fig. 12. (a, colonne de gauche) Changement estimés par le modèle des fréquences de photolyse de NO2 (%) dû aux aérosols des feux pendant les mois de juillet–août–septembre 2003. (b ; colonne de droite). Moyenne du forçage radiatif diurne des feux (W m−2) sur l’Europe durant les mois de juillet–août–septembre 2003. D’après [26]).
By absorbing the solar radiation, the carbonaceous particles emitted by forest fires modified the regional radiative budget. It has been shown in several recent studies (e.g., [16]) that the presence of smoke layers can produce a significant heating in the atmosphere at the top of the troposphere and cooling at the surface. Fig. 12b shows the daily mean radiative forcing of smoke particles for the wavelength interval of 290–735 nm estimated by Hodzic et al. [27] over the Mediterranean basin (Rome) and northern Europe (Paris region). The Fig. shows that the smoke aerosol radiative forcing during August 2003 varies between 5 and 25 W m−2 over Europe. During the strongest fire influence (3–7 August) this forcing reaches 20–25 W m−2 over northern Europe (Lille station) in the presence of the smoke plume. These results are in agreement with the results reported by Pace et al. [39] that estimated the fire aerosol radiative forcing to be 21.6 and 25.7 W m−2 over the Mediterranean basin (Lampedusa) during summer 2003. This heating can reinforce the atmospheric stability and contribute to the maintenance of the heat-wave conditions during summer 2003.
5 Summer 2003 and future air quality
The link between air quality encountered in 2003 and air quality that will occur in the future warmer climate is not straightforward. Even though 2003 summer weather is probably mimicking the simulated regional European climate of the end of the 21st century, other important changes have to be taken into account, that affect air quality in Europe: regional (European) and global emissions. Emissions of ozone and PM precursors are predicted to increase at global scale and decrease at regional European scale.
The decrease of regional emissions should be very efficient to reduce ozone in heat waves. Model simulations with hypothetical emissions have shown that, for the 2003 heat wave case, ozone maxima are very sensitive to emission reductions [52]. The number of hours exceeding the air quality information threshold of 180 μg m−3 (∼90 ppb) was taken as one of the criteria for ‘large ozone values’. Fig. 13, taken from [52], shows that a 20% Europe-wide reduction of NOx, VOC and CO emissions (the major precursors of photochemical ozone formation) would have allowed to reduce the number of hours exceeding the 180 μg m−3 threshold significantly in all concerned regions (France, Germany, and northern Italy), on average by 46%. An even stronger reduction of the number of exceedance hours (by 74%) can be achieved by replacing the emissions used for this simulation by emissions predicted for 2010 assuming current legislation (Current Legislation Emissions – CLE). This emission scenario corresponds to a reduction of NOx, CO and VOC emissions of about 30–35% relative to 2001 [56]. Thus future regional emission reductions are expected to counteract the adverse effect of climate change.

Average summer surface ozone daily maxima (in ppb) for 2001 emissions (a, left) and for 2020 emissions predicted by EMEP (b, right).
Fig. 13. Moyenne des maxima journaliers d’ozone en surface (en ppb) pour les émissions de 2001 (a, gauche) et pour les émissions d’EMEP prédites pour 2020 (b, droite).
The regional emissions expected for the end of the 21st century cannot be predicted without a large uncertainty. However, expert estimations of European NOx, CO and VOC emissions are available from EMEP (http://www.emep.int) up to the year 2020. Compared to 2001, NOx emissions are predicted for 2020 to decrease for western Europe countries by 40 to 50%, VOC emissions by 25 to 45% and CO emissions also by 25 to 45%. In another study, model simulations, carried out using Summer 2001 weather, showed that using these 2020 emissions instead of 2001 ones in the CHIMERE model, an increase of summer average daily maximum surface emissions is simulated all over Europe (Fig. 13a and b) (Beekmann et al., manuscript in preparation). The spatial pattern of this decrease corresponds to that of average photochemical ozone build-up; the decrease is larger over northern Italy (5–10 ppb), and lower over France, Germany, Benelux, and Great Britain (<5 ppb). These changes are about of the same magnitude as the differences between average daily maxima of summers 2003 and 2001. We conclude that, considering for the moment only regional emission and climate changes, the emission reductions impacts, larger in principle at the end of the century than in 2020, should dominate the impacts of the warmer climate in Europe.
By contrast with European ozone precursor emissions, global emissions are predicted to increase drastically. Szopa et al. [48] simulated the effect of emission reduction scenarios for the year 2030 prepared by IASA [1], distinguishing regional European reductions and reductions in other regions of the world. The effect of the global emission changes on long-range transport of ozone towards Europe was calculated using the LMDz-INCA general circulation model [23] with included online chemistry (relaxed to 2001 meteorology). These global-scale simulations were used as boundary conditions for the European scale CHIMERE simulations, keeping European-scale emissions at the 2001 day level. They found that long-range transport of increased baseline ozone levels for 2030 is of about 1 to 3 ppb on average daily surface ozone concentrations. The increase is even smaller in central Europe. However, the impact on extreme ozone levels (number of days exceeding 90 ppb threshold), the effect of increasing boundary conditions are small, because ozone episodes are mainly caused by regional-scale photochemical build-up. We conclude that, at least for 2030, global emission changes and the long-range transport of ozone alone should not influence much ozone concentrations in Europe.
It is noteworthy that climate warming not only influences ozone concentrations, but their sensitivity to precursor emissions. In a separate study, Beekmann et al. (manuscript in preparation), show that in 2003 – and therefore in an expected warmer climate – the sensitivity to NOx emission reductions is higher than in other more classical season (Summer 2001 in that study). The overall effect of climate change on high ozone concentrations should thus strongly rely on our ability to reduce NOx emissions, mostly due to combustion processes in the future: larger cuts in NOx emissions will better balance the effect of a climate more favourable to the development of episodes.
6 Conclusion
The summer of 2003 provides a powerful case study for anticipating the impacts of summertime climate change in Europe. Several studies show that this summer shares climate characteristics with summers simulated by global and regional models for the end of the 21st century. In this article, we first reviewed studies of meteorological characteristics of this summer, and exhibited the effect of heat wave on urban climate, using mesoscale simulations and observations for the Paris area.
We have shown that the average and upper centiles of ozone concentrations in 2003 have been very high. However, the highest ozone concentrations are not as high as in the late 1980s or early 1990s, because precursor emissions have drastically decreased since then. A warmer and drier climate enhances the probability of wildfires such as those that occurred in southern Europe in 2003. These fires were shown to worsen considerably the particulate matter burden.
It is not an easy task to predict the future of air quality using observations and simulations of air quality in 2003. In order to complete a prediction of air quality for the end of the century, the knowledge of many other factors than climate is required and missing. Changes in tree-species distribution and land use should change natural emissions. Anthropogenic emissions are expected to change dramatically in Europe, but also elsewhere. In this article, we have carried out sensitivity simulations and used previous results in order to draw conclusions that remain qualitative.
Drier and warmer climate is a sign of more anticyclonic weather, thus more favourable to high ozone episodes. However, this expected worsening of air quality should be largely balanced by the effects of emission reductions. We also show that these emission reductions will be more efficient if the largest effort is put on NOx emission reduction rather than on VOC emissions in a warmer climate.
Complete answers to the secular regional air quality prediction require integrated modelling. To this aim, a model chain has to be set-up, combining (i) a general circulation model including on-line chemistry, predicting global scale climate and chemical composition change, (ii) a nested regional climate model for downscaling global climate effects into regional ones, and (iii) a regional scale air-quality model. Such a model chain could be built in near future combining the LMDZ-INCA model, a mesoscale meteorology model optimised for long-term simulations, and the CHIMERE air quality model.
A transient climate change (1950–2052) simulation in a general circulation model (GCM) of the Goddard Institute of Space Studies (GISS), including two tracers of anthropogenic pollution, CO, and black carbon, was performed [37]. Results show that the severity and duration of summertime regional pollution episodes in the mid-western and northeastern United States increase significantly relative to present. Pollutant concentrations during these episodes increase by 5–10%, and the mean episode duration increases from 2 to 3–4 days. These increases appear to be driven by a decline in the frequency of mid-latitude cyclones tracking across southern Canada. These results are interesting because they suggest that the increase in blocking anticyclonic conditions as during summer 2003 will probably not be restricted to Europe, but will also affect other mid-latitude continental areas.