

1 Introduction
Chondrules are major constituents of most chondrite groups and understanding their formation is a key objective in the field of meteorites. It is generally accepted that chondrules were formed in a rapid heating event in which solid precursor materials underwent partial melting, followed by relatively fast cooling [6]. Conventionally, the setting for chondrule formation is envisaged to be the gas phase of the ‘protosololar nebula’, although the exact mechanism responsible for the heating source is still in debate (shockwaves, lightening, planetesimal collisions, and X-wind dynamics) [3]. In order to understand the chondrule formation mechanism, it is essential to know their thermal history, i.e. their cooling rates. Several methods have been used to constraint thermal histories of chondrules, like experimental petrology [6], diffusion profiles in olivine [1,8], and study of textural characteristics like exsolutions in pyroxenes [5]. The approach proposed in the present work is fully quantitative and yields additional constraints on the cooling rates of chondrules.
One interesting fact of those igneous systems is that they often exhibit olivine-bearing primary melt inclusions. Melt inclusions (MI) are small samples of melt captured during crystal growth; hence, they are potentially the only objects giving direct information on the parent melt composition [9]. Recently, experimental work on the formation conditions of melt inclusions compositions in such olivine [4] concluded that the melt composition of those inclusions is not necessarily representative of the original melt, depending on the dominant process of the olivine growth (diffusion or surface reaction). Two situations must be distinguished. (1) If thermal conditions allow surface olivine growth by surface reaction, the melt of the inclusion is representative of the original melt. (2) If olivine grows by diffusion, the melt is a left over of the original melt. In this second case, the thermal history of the chondrules can be potentially reconstructed from diffusion profiles.
Melt inclusions have been extensively used for terrestrial, Martian, Lunar, and chondritic igneous materials to gain insights on their precursor's compositions, or on their thermal history [10–13]. Chondrites may be of various types, depending on their genesis and cooling history. In CR chondrites that are supposed to be the more primitive ones, the composition of the MI is used as the central parameter to reconstruct the primary composition of the chondrules’ precursor, i.e. before their melting and crystallisation [6]. Within the scope on MI analysis, analytical profiles of elements at the interface of MI and olivine or pyroxene host appear as a key point. Profiles established by current analytical methods even like LA-ICPMS, SIMS were restricted to areas of several micrometers, whereas Stockstill et al. [10] have calculated that in MI from Nakla, the zone containing usable data dealing with diffusive processes for Ca, Fe, and Mg should be restricted to one to three micrometres. Such a spatial resolution cannot be reached for most commonly used analytical techniques like microprobe analysis. Therefore, we intend to measure profiles at the nanometre scale at the interface between olivine and primary MI in type-II chondrules.
2 Analytical methods
2.1 Petrological study: combined SEM (Scanning Electron Microprobe) and microprobe analysis
A SEM map has been established with a Jeol JSM 840 A (Paris-6 University) in order to select melt inclusions in several type-II chondrules in the Semarkona chondrite (LL3). Fig. 1 shows an example of a SEM image from a selected chondrule. Major elements of bulk chondrules and of all phases have been analysed with an electron microprobe CAMECA SX100, Paris-6 University (15 keV, 4 nA). A San Carlos olivine and synthetic glasses (BHVO-2) were analysed for the major elements with the electron microprobe. These analyses were used to calibrate the NanoSIMS elemental yields.
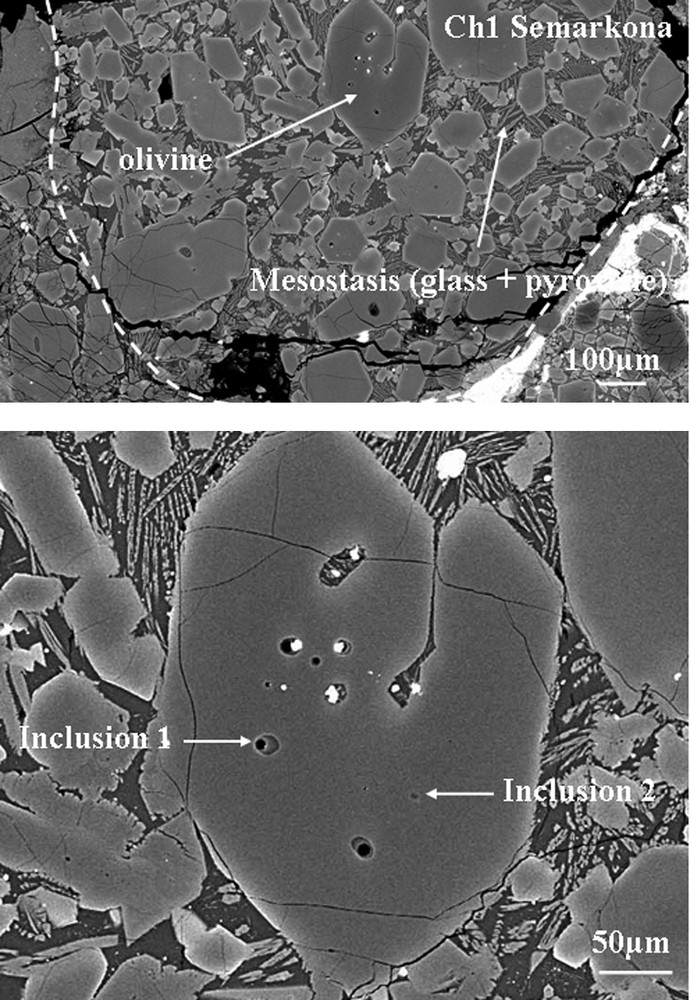
SEM image of chondrule 1 with olivine bearing primary melt inclusions. Olivine crystals are polyhedrons, embedded in a mesostasis consisting of pyroxene crystallites and glass.
Fig. 1. Image au MEB du chondre 1 dans un cristal d’olivine contenant des inclusions vitreuses primaires. Les cristaux d’olivine sont polyédriques et enchâssés dans une mésostase constituée de pyroxènes et de verre finement recristallisé.
2.2 Isotopic study: NanoSIMS analysis
Melt inclusions are very small (diameter less than 15 μm), so that for an analysis of concentration gradients a nanometric spatial resolution is needed at the mineral/MI interface. The primary beam has a 150-nm diameter with O− and sputters a depth around 20 nm. Analyses were made with a 1-pA intensity beam, with a mass resolution around 6000. At such a mass resolution, isobaric interferences are negligible. The major isotope species of Mg, Si, Ca, Cr, and Fe were analysed. Examples of NanoSIMS profiles obtained are shown in Fig. 2. The elemental counting rate (expressed in counts/pixels through the electron multipliers) can be affected by the matrix effect, because different elements have different capabilities to be ionised, depending on their sputtered host phase. Such so-called ‘matrix effects’ were calibrated by using electron microprobe analysis on the San Carlos olivine and BHVO-2 glass.
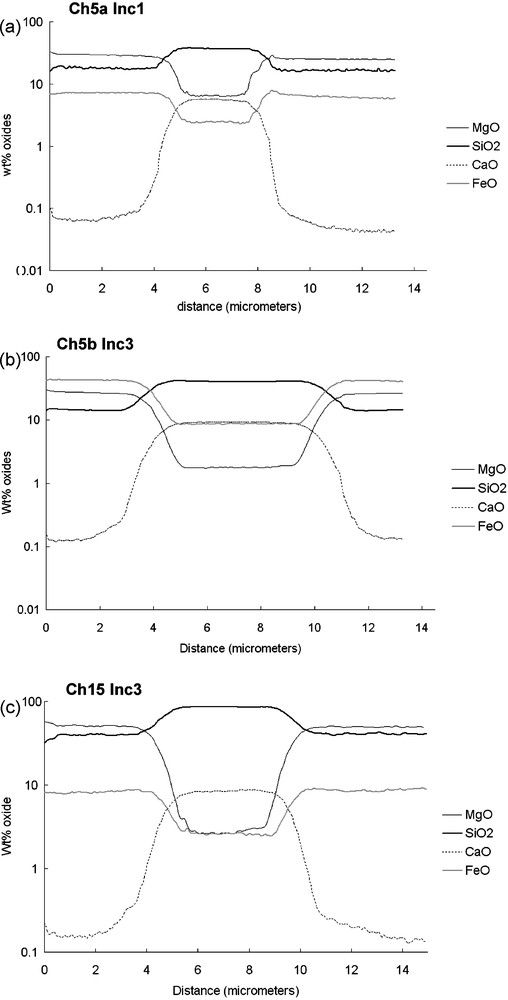
NanoSIMS profiles examples obtained by means of NanoSIMS. The scale is in wt.% oxide versus distance in microns. There are between 15 and 25 analysis points in the transition zone, depending on the profile.
Fig. 2. Exemple de profils A obtenus en NanoSIMS. Échelle en pourcentage massique d’oxydes en fonction de la distance en microns. Les profils de la zone de transition sont constitués de 15 à 25 points d’analyse, selon les profils.
3 Results
3.1 Sample description
The analyzed chondrules are type-II chondrules, which are the most common chondrule type in ordinary chondrites (around 80% of the falls). Type-II chondrules are selected because they are supposed to form in a closed system, whereas type-I chondrules show evidences for the formation of an open system. We also selected the type-II chondrules of the Semarkona chondrite (LL3), which have olivine porphyric textures. These chondrules have apparent diameters between 600 and 1600 μm. The olivine crystals’ sizes range from 30–50 to 300–500 μm. Melt inclusions have spherical to ovoid shapes varying between 1 to 15 μm in diameter. All MI analysed are glassy phases free from either mechanically entrapped or daughter minerals and apparently not devitrified (confirmed by Raman microspectroscopy). Depending on the cut path, on the polished section, they may show a bubble (near 10–15% total MI volume) that can be considered as a shrinkage one formed by volume change of the glass during cooling. These petrographic observations are generally considered as indications of their primary origins and fast cooling [9]. An example of a type-II chondrule from the Semarkona meteorite is given in Fig. 1.
3.2 Sample chemistry
Tables 1–3 display the results of microprobe analyses of bulk chondrules, of olivines (that were analysed close to MIs), and of melt inclusions, respectively. The composition of those melt inclusions could not crystallize olivine, and hence they are not direct samples of the original melt. Instead, they can be a sample of a residual glass, affected by the crystallization of olivine. To test this idea, we made a simple calculation of the original melt: we graphically estimated the olivine volume percentage (60% for chondrule 15), and calculated a composition made of 60% of olivine and 40% of melt inclusion. The result is shown in Table 4 and is very similar to the bulk chondrule composition. This pleads in favour of a residual melt captured during olivine growth.
Total bulk composition for several type-II chondrules in Semarkona (LL3), obtained by electron microprobe (15 keV, 4 nA) Cameca SX100, Paris-6 University
Tableau 1 Analyse à la microsonde électronique des compositions globales de plusieurs chondres de type II dans Semarkona (LL3). Cameca SX100, université Paris-6 (15 keV, 4 nA)
| Ch1 | Ch3 | Ch4 | Ch5a | Ch15 | Mean | |
| SiO2 | 48.93 | 39.40 | 48.34 | 47.39 | 51.01 | 47.01 |
| TiO2 | 0.10 | 0.02 | 0.08 | 0.04 | 0.11 | 0.07 |
| Al2O3 | 3.92 | 1.23 | 3.84 | 2.51 | 3.88 | 3.08 |
| Cr2O3 | 0.59 | 0.35 | 0.55 | 0.60 | 0.68 | 0.55 |
| FeO | 14.61 | 14.94 | 10.72 | 9.29 | 9.21 | 11.75 |
| MgO | 26.72 | 36.26 | 28.86 | 35.76 | 29.32 | 31.38 |
| CaO | 2.47 | 1.00 | 2.58 | 1.72 | 2.76 | 2.11 |
| Na2O | 2.21 | 0.71 | 2.34 | 1.32 | 1.80 | 1.68 |
| Total | 99.56 | 93.93 | 97.33 | 98.65 | 98.78 |
Olivine composition next to selected melt inclusions for several type-II chondrules in Semarkona (LL3), obtained by electron microprobe (15 keV, 4 nA) Cameca SX100, Paris-6 University
Tableau 2 Composition de l’olivine au contact des inclusions vitreuses pour plusieurs types de chondres dans Semarkona (LL3), obtenue à la microsonde électronique. Cameca SX100, université Paris-6 (15 keV, 4 nA)
| Ch1 | Ch3 | Ch4 | Ch5a | Ch15 | Mean | |
| SiO2 | 39.48 | 39.33 | 40.65 | 40.38 | 40.02 | 40.04 |
| TiO2 | 0.00 | 0.09 | 0.01 | 0.01 | 0.07 | 0.04 |
| Al2O3 | 0.05 | 0.04 | 0.03 | 0.00 | 0.05 | 0.05 |
| Cr2O3 | 0.51 | 0.36 | 0.35 | 0.50 | 0.45 | 0.48 |
| FeO | 14.51 | 13.02 | 7.98 | 9.12 | 8.86 | 10.52 |
| MgO | 43.80 | 45.86 | 49.15 | 48.96 | 48.53 | 47.21 |
| CaO | 0.11 | 0.11 | 0.02 | 0.08 | 0.10 | 0.10 |
| Na2O | 0.01 | 0.02 | 0.03 | 0.00 | 0.00 | 0.02 |
| Total | 98.48 | 98.82 | 98.20 | 99.04 | 98.07 |
Some of the selected melt inclusions, obtained by electron microprobe (15 kV, 4 nA) Cameca SX100, Paris-6 University
Tableau 3 Compositions de quelques inclusions vitreuses, obtenues à la microsonde électronique
| Ch1Inc1 | Ch3Inc1 | Ch3Inc2 | Ch4Inc1 | Ch4Inc2 | Ch4Inc3 | Ch5aInc1 | Ch5aInc2 | Ch15Inc1 | Ch15Inc2 | Mean | |
| ∅ μm | 15 | 8/15 | 10/13 | 6/9 | 6/10 | 5 | 7/4 | 6/8 | 1/2 | ||
| SiO2 | 74.53 | 61.99 | 62.45 | 70.78 | 70.72 | 70.96 | 66.81 | 72.60 | 69.81 | 71.58 | 69.25 |
| TiO2 | 0.14 | 0.33 | 0.40 | 0.52 | 0.48 | 0.41 | 0.32 | 0.48 | 0.27 | 0.33 | 0.37 |
| Al2O3 | 10.09 | 11.10 | 12.25 | 10.88 | 10.75 | 10.28 | 7.72 | 10.52 | 9.20 | 9.80 | 10.26 |
| Cr2O3 | 0.21 | 0.35 | 0.04 | 0.28 | 0.18 | 0.17 | 0.24 | 0.20 | 0.23 | 0.29 | 0.22 |
| FeO | 2.77 | 4.54 | 8.45 | 3.56 | 4.47 | 4.48 | 2.71 | 2.42 | 1.84 | 2.22 | 3.75 |
| MgO | 3.14 | 4.33 | 1.95 | 3.63 | 2.84 | 2.65 | 9.13 | 3.39 | 3.93 | 2.19 | 3.72 |
| CaO | 6.82 | 9.40 | 5.91 | 2.88 | 1.22 | 0.60 | 6.66 | 2.66 | 7.34 | 7.01 | 5.05 |
| Na2O | 0.44 | 3.87 | 3.97 | 4.38 | 4.67 | 4.30 | 1.42 | 2.30 | 3.72 | 3.08 | 3.21 |
| Total | 98.13 | 95.92 | 95.41 | 96.91 | 95.32 | 93.83 | 95.02 | 94.58 | 96.34 | 96.77 | |
| Quartz | 52.25 | 16.63 | 20.04 | 32.08 | 33.36 | 37.31 | 32.55 | 46.80 | 31.31 | 38.51 | |
| Orthose | 0.00 | 0.00 | 0.00 | 0.00 | 0.00 | 0.00 | 0.00 | 0.00 | 0.00 | 0.00 | |
| Leucite | 0.00 | 0.00 | 0.00 | 0.00 | 0.00 | 0.00 | 0.00 | 0.00 | 0.00 | 0.00 | |
| Albite | 3.27 | 32.71 | 33.55 | 37.02 | 39.47 | 36.34 | 12.00 | 19.44 | 31.44 | 26.03 | |
| Anorthite | 25.53 | 12.90 | 15.59 | 10.01 | 6.06 | 2.98 | 14.67 | 13.21 | 8.39 | 12.90 | |
| Nepheline | 0.00 | 0.00 | 0.00 | 0.00 | 0.00 | 0.00 | 0.00 | 0.00 | 0.00 | 0.00 | |
| Diopside | 6.78 | 27.60 | 11.79 | 3.49 | 0.00 | 0.00 | 14.55 | 0.00 | 22.38 | 17.84 | |
| Hypersthene | 9.40 | 5.09 | 13.66 | 13.05 | 14.50 | 14.17 | 20.38 | 12.12 | 2.08 | 0.30 | |
| Olivine | 0.00 | 0.00 | 0.00 | 0.00 | 0.00 | 0.00 | 0.00 | 0.00 | 0.00 | 0.00 | |
| Magnetite | 0.00 | 0.00 | 0.00 | 0.00 | 0.00 | 0.00 | 0.00 | 0.00 | 0.00 | 0.00 | |
| Ilmenite | 0.27 | 0.63 | 0.76 | 0.99 | 0.91 | 0.78 | 0.61 | 0.91 | 0.51 | 0.63 | |
| Apatite | 0.00 | 0.00 | 0.00 | 0.00 | 0.00 | 0.00 | 0.00 | 0.00 | 0.00 | 0.00 |
Calculation of the original melt from which olivine grew in chondrule 15: assuming that type-II chondrules were formed in a closed system, we add 60% of the olivine composition and 40% of the melt inclusion composition; the result is very similar to the bulk chondrule's composition
Tableau 4 Calcul de la composition du magma initial dans le chondre 15 considérant une hypothèse de formation en milieu fermé avec 60 % d’olivine et 40 % de magma ayant la composition de l’inclusion vitreuse. La composition obtenue est très proche de celle du chondre
| Na2O | MgO | SiO2 | Al2O3 | CaO | FeO | Cr2O3 | TiO2 | Total | |
| Ch15 total | 1.80 | 29.32 | 51.01 | 3.88 | 2.76 | 9.21 | 0.68 | 0.11 | 98.78 |
| Ch15 olivine | 0.04 | 48.97 | 40.45 | 0.00 | 0.11 | 8.41 | 0.49 | 0.02 | 98.49 |
| Ch15 inclusion | 3.72 | 3.93 | 69.81 | 9.20 | 7.34 | 1.84 | 0.23 | 0.27 | 96.34 |
| 60% olivine/40% inclusion | 1.51 | 30.95 | 52.20 | 3.68 | 3.00 | 5.78 | 0.38 | 0.12 |
3.3 Concentration profile
NanoSIMS profiles between the host crystals and melt inclusions do not show a sharp boundary layer, but a smooth transition zone (1 to 2 μm wide). The concentrations profiles smoothly expand between two plateaus standing for the olivine and the glass composition (Fig. 2). Note that a few profiles (like in Fig. 2d) have more complex transition zones with bumps and valleys for some elements at the edges of those transition zones – hereafter referred to as profiles B in contrast with simpler ones, as profiles A. The width of the transition zone is more or less the same for 28Si, 24Mg and 56Fe (1 to 2 μm), but it is always different for 40Ca (1.5 to 2.5 μm). The shapes of these profiles can be attributed to three different processes (i.e. analytical mixing, effect of a constitutional supercooling or diffusion between olivine and the melt inclusion, for example). These processes are now discussed.
Smooth transition zones could result from a too low spatial resolution, causing an overlap of olivine and crystals under the NanoSIMS primary beam ion spot. The variations in concentration along the profiles are indeed close to a two-end-member mixing model (Fig. 3a). However, numerical simulations (not reported here) show that, contrary to measured values ranging between 150 and 200, the primary ion spot size must be ≥1 μm in order to reproduce the observed transition zone (Fig. 3b). In addition, a mixing model caused by such a narrowed primary ion spot would not explain the difference in the transition zones between Ca and other elements. Hence, the transition zone cannot be entirely explained by an overlap of glass and olivine under the primary beam.
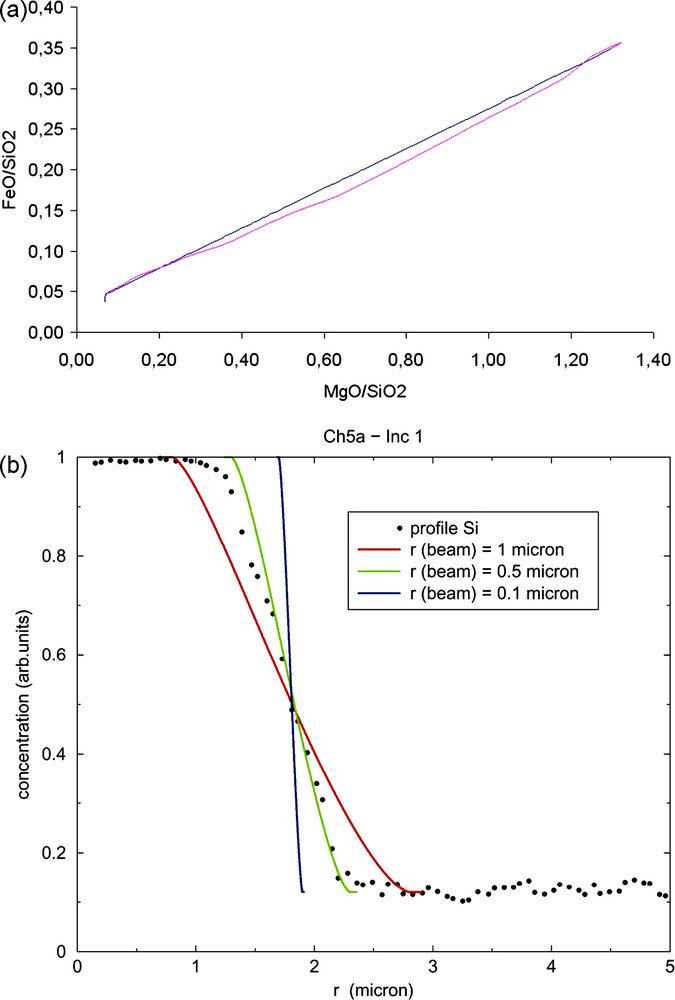
(a) Comparison between a binary mix (blue line) between the composition of olivine and that of the glass melt inclusion 2 from chondrule 5a, and NanoSIMS data for the same olivine–melt inclusion system (pink line). (b) Numerical simulation results of the profile that would be obtained by the overlap of the melt inclusion and the olivine under the primary beam (with a variable size depending on the simulation). The black circles profile is the NanoSIMS one for the inclusion 1 of chondrule 5a of Semarkona. Masquer
(a) Comparison between a binary mix (blue line) between the composition of olivine and that of the glass melt inclusion 2 from chondrule 5a, and NanoSIMS data for the same olivine–melt inclusion system (pink line). (b) Numerical simulation results of ... Lire la suite
Fig. 3. (a) Comparaison entre un mélange binaire entre la composition de l’olivine et celle de l’inclusion vitreuse 2 du chondre 5a (ligne bleue) et les données NanoSIMS pour le même système olivine–inclusion vitreuse du chondre 5a (ligne rose). (b) Résultats des simulations numériques des profils qui seraient obtenus par le recouvrement de l’inclusion vitreuse et de l’olivine sous le faisceau primaire (de taille variable selon la simulation). Le profil représenté par les cercles noirs représente le profil NanoSIMS pour l’inclusion 1 du chondre 5a. Masquer
Fig. 3. (a) Comparaison entre un mélange binaire entre la composition de l’olivine et celle de l’inclusion vitreuse 2 du chondre 5a (ligne bleue) et les données NanoSIMS pour le même système olivine–inclusion vitreuse du chondre 5a (ligne rose). (b) ... Lire la suite
Constitutional supercooling is a solidification process: when solidification appears, elements will be partitioned between liquid and solid, hence creating a variation at the melt interface composition, subsequently changing the liquidus temperature at the interface. If the liquidus temperature gradient becomes higher than the temperature gradient in the melt, it yields a supercooled zone at the interface. The compositional gradient created by this constitutional supercooling could resemble that analysed by the NanoSIMS. However, it remains difficult to explain the different sizes of the transition zone for the different elements.
A different explanation could be found in diffusion processes. Indeed, the shape of the transition zones resembles the diffusion profile between two different compositions. In this situation, the boundary layer between olivine and glass would remain chemically unchanged during the diffusion. In other terms, in diffusion, the boundary layer should be envisaged as a physical object implying that olivine's stoichiometry is conserved in the diffusion zone. This is clearly not the case since the SiO2 content drops down to 43 wt.% in the olivine (Fig. 4, thermodynamical parameters from [2,7]), while FeO does not compensate for MgO. On the contrary, in the NanoSIMS composition profiles, FeO follows MgO concentration from olivine to glass.
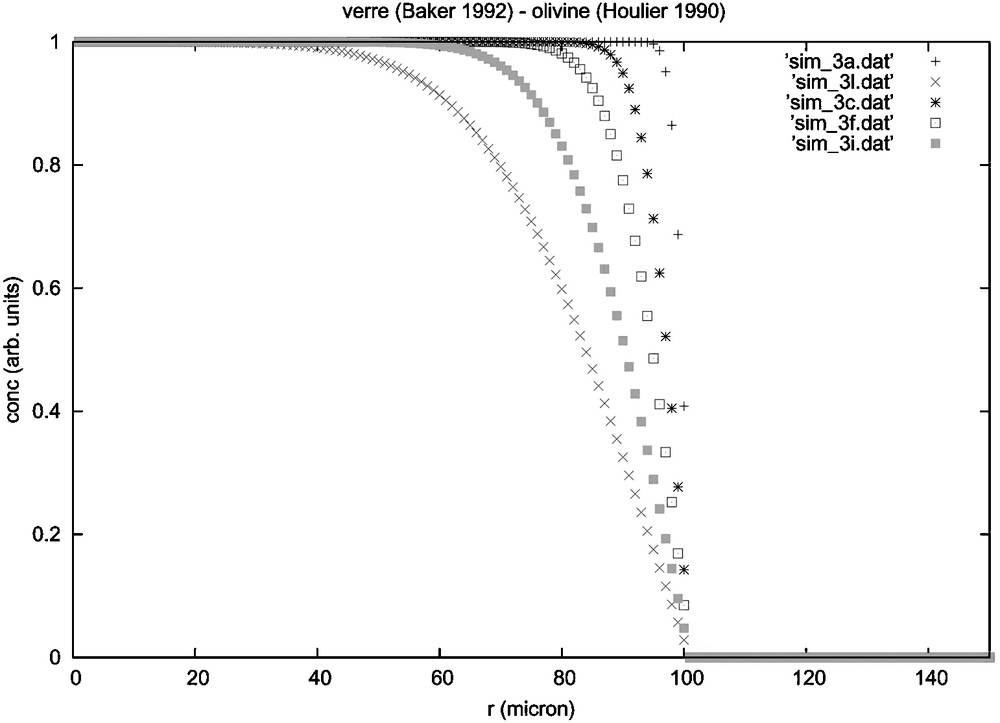
Numerical simulation of the diffusion of Si between olivine (thermodynamic parameters from [2]) and liquid (thermodynamic parameters from [7]) for different times (a = 6 s, c = 60 s, f = 150 s, i = 400 s et l = 900 s). Nothing moves inside the olivine, even for a long diffusion time.
Fig. 4. Simulation numérique de la diffusion entre un liquide, à gauche (paramètres thermodynamiques tirés de [2]), et une olivine à droite (paramètres thermodynamiques tirés de [7]) pour des temps différents (a = 6 s, c = 60 s, f = 150 s, i = 400 s et l = 900 s). Il ne se passe rien dans l’olivine.
Another process could explain the observed parallel FeO and MgO concentrations: the dissolution of olivine in the silicate melt. Olivine dissolution experiments have been done by Zhang et al. [14] in silicate melts at high pressure (Fig. 5). Their results show composition profiles with the same shape than our composition profiles in the melt, with a different scale. In their experiments, Zhang et al. [14] showed that this dissolution was controlled by diffusion, and hence the extent of the profile is related to the heating time: the shorter the heating time is, the shorter the profile size will be. Therefore, we can imagine that olivine found in type-II chondrules dissolved in the liquid of the melt inclusion. In such a situation, the residual liquid has a composition incompatible with olivine, which results in the dissolution of the crystal at the interface. If dissolution is controlled by diffusion, the dissolution process must have been very short (seconds to minutes) when considering the small size of the transition zone.

From [14]: composition profiles in quenched glass versus the distance. The quenched glass were obtained during olivine dissolution in an andesitic melt (#212: T = 1285 °C, P = 5.5 kbar, time = 18,000 s). Analyses were done by electron microprobe (CAMECA). The distance x is the distance from the crystal/liquid interface.
Fig. 5. Figure issue de [14] : profils de composition dans des liquides trempés, en fonction de la distance. Le verre est obtenu lors d’expériences de dissolution d’olivine dans un liquide de composition andésitique (#212: T = 1285 °C, P = 5.5 kbar, temps = 18 000 s). Les analyses ont été réalisées à la microsonde électronique (CAMECA). La distance x est la distance à l’interface liquide/cristal.
4 Conclusions
This article is the first report of concentration profiles obtained with the NanoSIMS for melt inclusions–olivine systems. At a 150-nm spatial resolution, the NanoSIMS analyses reveal the existence of some compositional gradients at the crystal–melt interface that are not affected by olivine crystallization and could be explained by dissolution of olivine in the melt inclusion.
Acknowledgments
The authors would like to thank Omar Boudouma for the SEM map of the meteorite, Frédéric Couffignal for the electron microprobe analysis. The simulations have been executed in the ‘Laboratoire de chimie théorique’, UMR 7616 CNRS (University Paris-6, France).