

1 Notations
ao et bo
Forchheimer’ law coefficients (s2/m2)
cSound velocity in water (c ≅ 1500 m/s) (m/s)
f o , f DEmission frequency; Doppler frequency (MHz)
h bHeight of the sediment bed (cm)
h wDraught of the fluid vein (cm)
hTotal draught, h = hw + hb (cm)
iHydraulic gradient (−)
nTotal porosity (−)
uInterstitial velocity (cm/s)
D, D 50Diameter, mean diameter of the particles (mm)
R hHydraulic radius of the fluid vein (cm)
Q fDischarge flow of the fluid vein only (l/s). Parameter characterizing the flow bed porosity (−)
RepReynolds number of the pores; (−)
D pAverage hydraulic diameter of pores; (mm)
YRatio of the position velocity on the height of the bed (−)
UVelocity ratio on interstitial maximum velocity (−)
VMean velocity flow only; (cm/s)
ReReynolds number of the flow in the fluid vein only; (−)
FrFroude number of the flow associated with the fluid vein only; (−)
2 Introduction
The sedimentary transport phenomenon is very complex and the physical processes, which are associated to it, are still badly known. Indeed, due to a lack of adapted instrumentation, the modeling of this phenomenon is still based on two standards of studies, independent, but exploited complementarily:
- • the analysis of the velocity field in the free flow, often on an impermeable bottom and always with a condition of zero velocity at the wall;
- • the determination of interstitial velocities within a flow in a uniform porous environment, made:
- ∘ either by a measurement of total flow in a uniform flow field and with a constant hydraulic gradient, with a reference to the work of Darcy [3] for laminar flow, or to that of Forchheimer [4] for turbulent flow;
- ∘ or by models based on pressure measurements and velocities deduced from experiments like Darcy's as indicated in different references [1,9,12].
Such studies do not correspond to the physical processes related to the velocity field generated by a free surface flow, above a sedimentary bottom, and this for the following reasons:
- • because of the existence of an interstitial velocity at the interface water–sediment, the velocity of the fluid in the free flow is not zero at the wall. This result was proven for a confined flow by [2];
- • to our knowledge, the majority of work which treats sedimentary transport ignores the problems of interaction between particles [5] and at the interface fluid–solid;
- • the velocity distribution within the sediment is not uniform and there is a velocity gradient function of the depth.
For such studies, the optical measurement techniques are inoperative:
- • by laser Doppler velocimetry (LDV), the laser beam cannot penetrate the sediment;
- • by velocimetry by image of particles (PIV), measurements can be carried out only at the interface between a transparent plate and the sediment, therefore not within the sediment and with in addition a condition of zero velocity at the wall of the transparent plate.
However, ultrasonic Doppler velocimetry (UDV) allows a non-intrusive and instantaneous measurement of the interstitial velocity within the sediment. The results, which we present here, correspond to the case of a free surface flow on a sedimentary bottom.
3 Material and method
3.1 Principle of velocity measurements
This measurement technique, which is relatively recent, has been very successful in the study of opaque and charged flows where other methods do not work. In this context, we can quote the reference work on velocity measurement by UDV in [6,10,11] and the modeling approaches of ultrasonic waves propagation at the fluid–solid interface [7].
We have already used this method in the laboratory in the case of flow with temperature variations [8]. The results, which we present here, correspond to the case of a free surface flow on a sedimentary bottom. The velocity measurements in the interstitial flow made it possible to know the velocity profile whether in its fluid part or in the porous part of the bed flow.
The measurement device used a ultrasonic Doppler velocimeter, functioning in pulsated mode: DOP 1000 (model 1032), which allows, thanks to the use of the Doppler effect on pulsated ultrasonic waves, to directly determine the interstitial velocity at the level of the pores of the considered porous medium.
The principle is the sending of an ultrasonic wave of known frequency fo, which when meeting a moving particle in the fluid, returns a wave of shifted frequency fr by the Doppler effect. This allows, thanks to the difference in recorded frequency fD = fo − fr, to determine the velocity of the particle in the flow at that point:
| (1) |
If we add to this frequency measurement the determination of the running time (to go and come back) of the wave train, we reach the position of the particle. Thus, in a pulsated mode, we can reach the desired space–time resolution, that is to establish the velocity profile at an adapted exploration depth along the ultrasonic beam. However, in our case, we limited our measurements to a single position (gate) at the center of the fluid vein.
3.2 Flume with continuous flow
The device consists of a flume of an overall length of 3.5 m and a rectangular section of (0.10 m × 0.25 m), making it possible to take velocity measurements by the ultrasonic Doppler velocimeter and by optical laser velocimetry, for calibration (Fig. 1). The walls and the bottom of the flume are made of 10 mm thick glass thus making it possible to make observations and optical measurements. The water arrives from a system of strainer; it is tranquillized by foam blocks, approximately 5 cm thick. In the flume, the flow is controlled by an adjustable threshold; the water overflow is evacuated towards the feed basin of the flume. The flume supply is provided by a closed loop with of a pump of maximum discharge (5.0 ± 0.1) l/s. For a better linearization of the flow and in order to reduce the effects of turbulence, two honeycomb cages were installed before the exit of the convergence cage. The flow is measured by a flow meter at the outlet of the flume.

Description of the caflume with a free surface steady flow.
Fig. 1. Description du canal à écoulement permanent à surface libre.
To ensure a good diffusion of the liquid particles in the flow and consequently to have an appreciable number of measurements, we added to the water of the channel a weak dilution of seeds made of polyamid of average diameter 20 μm and density 1030 kg/m3.
3.3 Support of the probe system
The probe is a piezoelectric transducer with an emission frequency of 4 MHz and a diameter of 12 mm. It is placed on a support of displacement of 24.0 mm width, 400 mm length and 2.7 mm thickness, forming an incidence angle of 28° with the axis of the flume. The vertical displacement of the probe is ensured by means of a differential micrometric increment, which makes it possible to obtain a maximum number of microdisplacements and a maximum number of measurement points in the sediment bed and at the interface fluid–sediment. The minimal displacement ensured by the UDV device is 0.5 mm.
Taking into account the dimensions of the ultrasonic beam, measurements are treated by a statistical filtration method. The transducer and displacement support are protected by a PVC plate of low curvature, forming a transducer box. In this system, we took into account the refraction between the different media: water–PVC and PVC–water. We used for the sediment bed several materials of different porosities and structure, alveolar foams and bubbles foam, glass beads and sand. The thickness of the bed varies between 30 and 75 mm.
The protection plate of the displacement system is a sector of circular element 8 mm thick, made from a PVC tube (diameter 49 mm, thickness 2 mm).
4 Data processing
The ultrasonic beam delivered by the probe is cylindrical (slightly conical after a certain distance). In our case, it was placed in a horizontal plan perpendicular to the median plan of the flow. The particles subjected to this beam emit in answer an echo also collected by the probe. This echo, which depends on the angle between the ultrasonic beam and the direction of the flow, has two principal characteristics:
- • its frequency, which gives access to the velocity of the particles (Doppler effect);
- • its intensity, which depends on the size of the particles.
The treatment of the signal emitted by the particles is then approached in two different and quite distinct ways:
- • that related to the size of the particles;
- • that related to the dimension of the ultrasonic beam.
In this study of the interstitial velocity within the sediment, we have two quite distinct sizes of particles:
- • very large sedimentary particles;
- • particles (very small) in suspension in the fluid which circulates between the pores.
By eliminating, in the received signal, the echoes of great intensity, we eliminate the echoes resulting from the large sediment particles whose speed is in addition null (except for the water–sediment interface where sediment transport can exist, but this will be the subject of a forthcoming specific study). We thus only keep the echoes resulting from the suspended particles in the fluid (with the traditional assumption that they have the same velocity as this fluid).
In addition, within the ultrasonic beam, the measurement volume is a cylinder whose diameter is that of the beam 8.0 mm and the length 0.74 mm, that is the depth of the gate (distance to which measurements are taken). The recorded measurements are thus those which are associated to the particles which cross this measurement volume. However, taking into account the nature of the velocity field and the section of the measurement volume (a circular or slightly elliptic disc), the fastest or slowest particles cross the superior or inferior circular sectors which have a small section. There are thus very few particles in this category. A statistical study of the recorded values confirms this and the Gaussians form of the results allows us:
- • to eliminate the very few, too large or too low values;
- • to keep an average value of the most probable velocities as being the measurement velocities at the level of the ultrasonic beam axis.
Table 1 presents the physical characteristics of the study and the flow parameters in the fluid vein only. Indeed, the total flow rate is the sum of two flows, one in the fluid vein and one in the porous medium of the bed sediment, but these are easily quantifiable individually. So we privileged the parameters associated with the fluid vein to characterize the flow, which are exploited in practical studies. The definition of the flow parameters is given in the notation list.
Characteristics of the tests for various porous beds.
Tableau 1 Caractéristiques des essais pour différents lits poreux.
| Type of bed | h (cm) | __ | u (cm/s) | Rep __ | V (cm/s) | Rh (cm) | Qf (l/s) | Re × 103 | Fr __ |
| Alveolar foam | 8.00 | 0.23 | 0.061 | 52. 52 | 7.30 | 1.15 | 0.11 | 0.84 | 0.19 |
| hb = 6.5 cm | 11.70 | 0.80 | 0.103 | 86.11 | 5.90 | 2.55 | 0.31 | 1.41 | 0.08 |
| Dp = 3.1 mm | 12.50 | 0.92 | 0.124 | 106.8 | 22.80 | 2.73 | 1.37 | 5.84 | 0.30 |
| n = 96.4% | 12.75 | 0.96 | 0.384 | 330.3 | 31.60 | 2.78 | 1.98 | 8.25 | 0.40 |
| Bubbles foam | 10.90 | 0.45 | 0.020 | 4.95 | 7.10 | 2.02 | 0.24 | 1.35 | 0.12 |
| hb = 7.5 cm | 11.50 | 0.53 | 0.076 | 12.43 | 14.60 | 2.22 | 0.58 | 3.04 | 0.23 |
| Dp = 0.9 mm; n = 94.5% | 12.90 | 0.72 | 0.170 | 19.90 | 27.60 | 2.60 | 1.50 | 6.74 | 0.38 |
| Glass beads; n = 37.5 | 11.00 | 2.67 | 0.340 | 14.95 | 5.94 | 3.08 | 0.47 | 1.72 | 0.07 |
| hb = 3.0 cm | 11.40 | 2.80 | 0.670 | 16.59 | 11.55 | 3.13 | 0.97 | 3.39 | 0.13 |
| D = (3.8–4.4) mm | 15.40 | 4.13 | 1.020 | 22.84 | 13.03 | 3.56 | 1.61 | 4.36 | 0.12 |
| Sand; n = 32.0% | 11.70 | 2.90 | 0.430 | 0.81 | 5.70 | 3.17 | 0.50 | 1.70 | 0.06 |
| hb = 3.0 cm, | 14.70 | 3.90 | 0.850 | 1.55 | 11.50 | 3.50 | 1.35 | 3.78 | 0.11 |
| D50 = 0.406 mm | 15.40 | 4.13 | 1.840 | 3.35 | 13.00 | 3.56 | 1.61 | 4.35 | 0.12 |
Fig. 2 explicitly translates the distribution of the measured values compared to the normal distribution for different positions of the probe. In the porous medium, velocities were given for probability intervals varying from 70 to 75% compared to the value of the average velocity and the standard deviation of a measurement volume; we estimated that the absolute measurement error on velocity is equal to ± 0.2 mm/s. In order to compare and validate the measurements obtained by UDV, measurements by LDV were carried out in the case of a flow on an impermeable bed with a smooth bottom. Fig. 3 shows the profiles determined by the two techniques. They are globally identical; the only difference lies in the instantaneous frequency deviation of acquisition and the appearance of fictitious frequencies of the UDV close to the surface of the glass bottom of the flume.
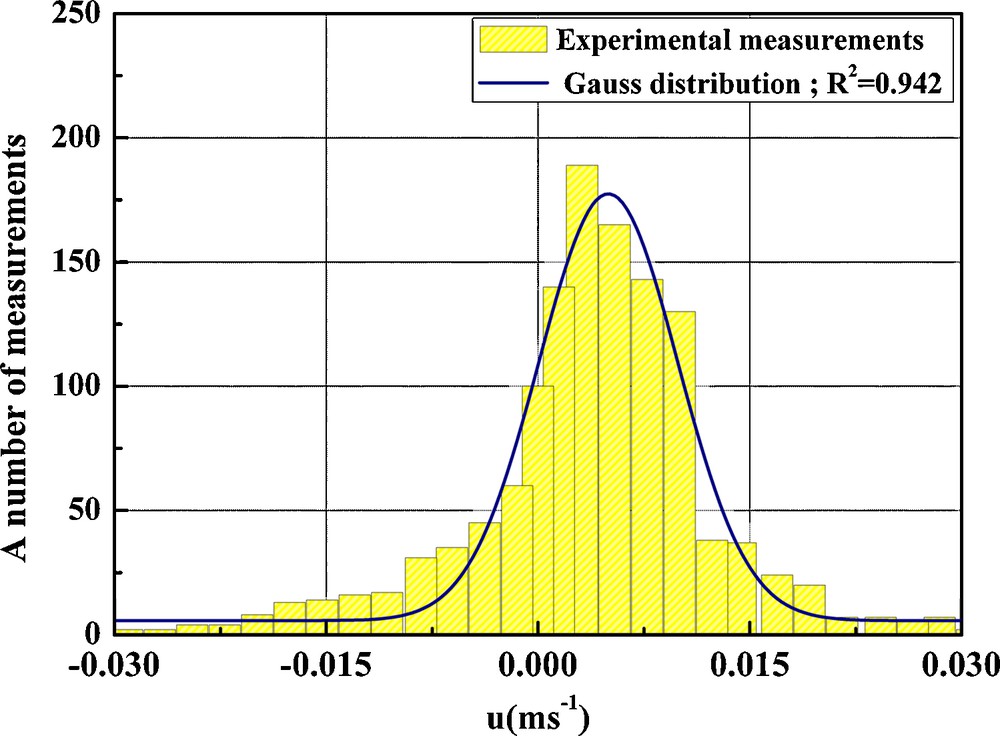
Velocity distribution compared with the Gaussian distribution for a number of measurements for a position in the alveolar foam bed, Qf = 0.31 l/s.
Fig. 2. Distribution des vitesses, comparée à la loi normale pour un volume de mesures pour une position dans un lit en mousse alvéolaire Qf = 0,31 l/s.
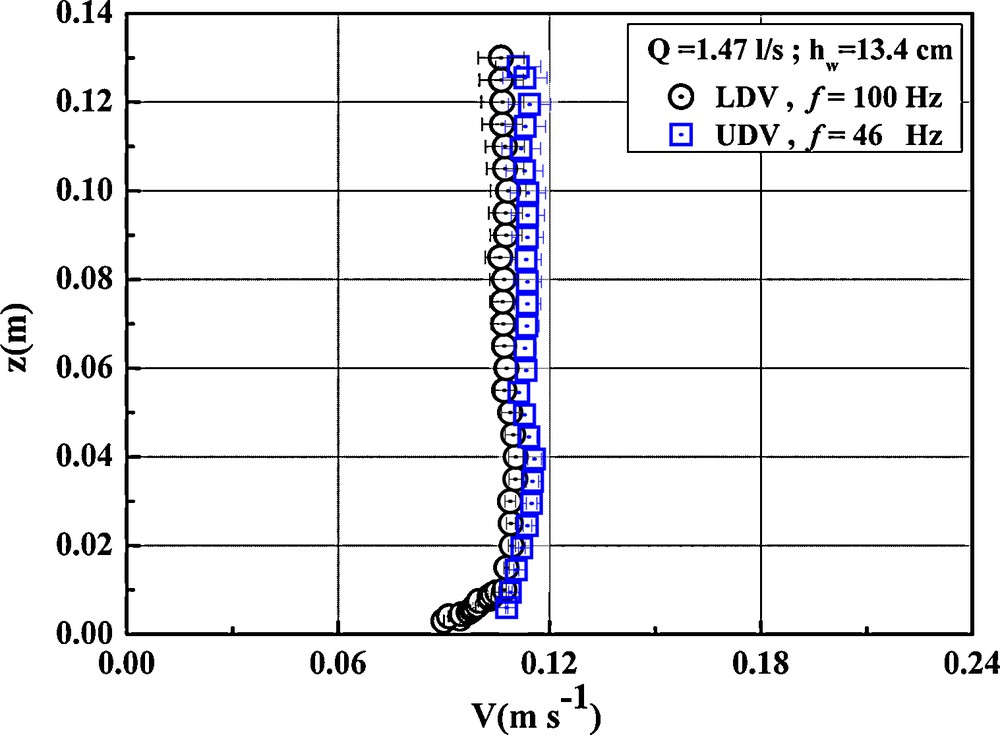
Comparative velocity profiles obtained by LDV and UDV.
Fig. 3. Profils comparatifs des vitesses obtenues par VDL et VDU.
From the ensemble of the tests made and validated, we can give an initial representation of the instantaneous velocity of a free-surface flow on a porous alveolar foam bed for three different vertical positions of the probe: within the bed, close to the bed–fluid interface and in the fluid vein (Fig. 4). This representation illustrates well the velocity ranges as a function of the height z as well as the effects of turbulence generated in the presence of a rough flow.
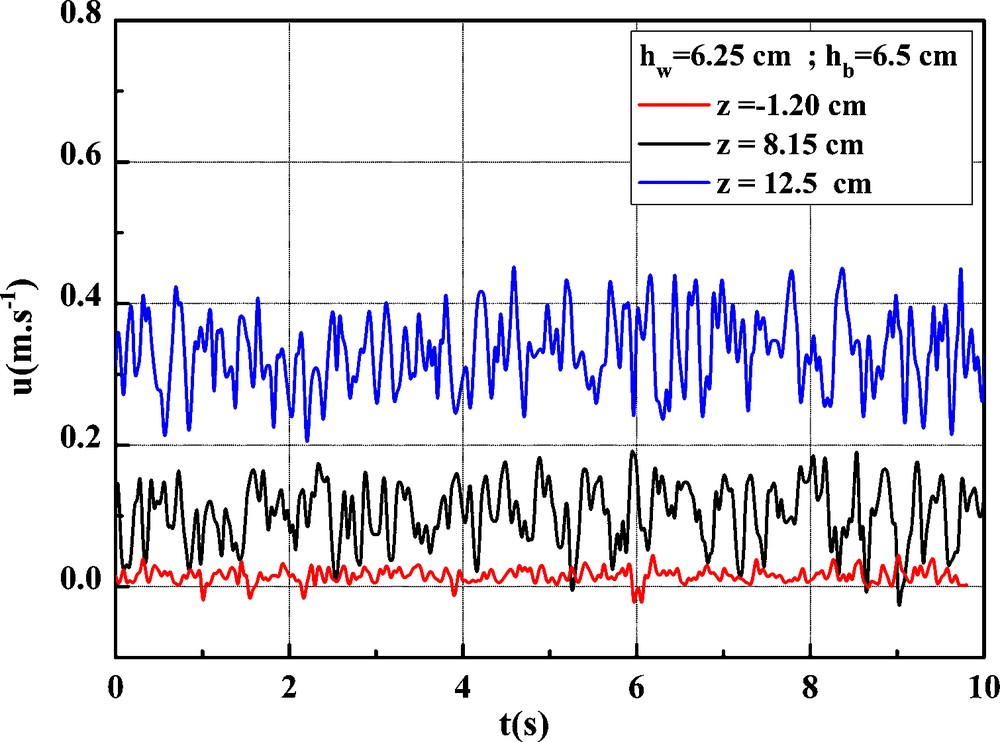
Evolution of the instantaneous velocity for a flow on a bed made of alveolar foam, h = 12.75 cm and Qf = 1.98 l/s.
Fig. 4. Évolution de la vitesse instantanée pour un écoulement sur un lit en mousse alvéolaire h = 12,75 cm et Qf = 1,98 l/s.
5 Results
The study of the velocities for various sediment beds made it possible to establish the vertical velocity profile along the z-axis for various flow conditions while considering the depth for the sediment and water height for the fluid vein. The position zero “0” corresponds to the interface water–sediment (Fig. 5). These results highlight:
- • a strong velocity “discontinuity” at the water–sediment interface, that is a very important gradient function of the flow and the nature of the sediment;
- • a non-zero velocity at the bottom (for the fluid vein);
- • defining:
| (2) |
| (3) |
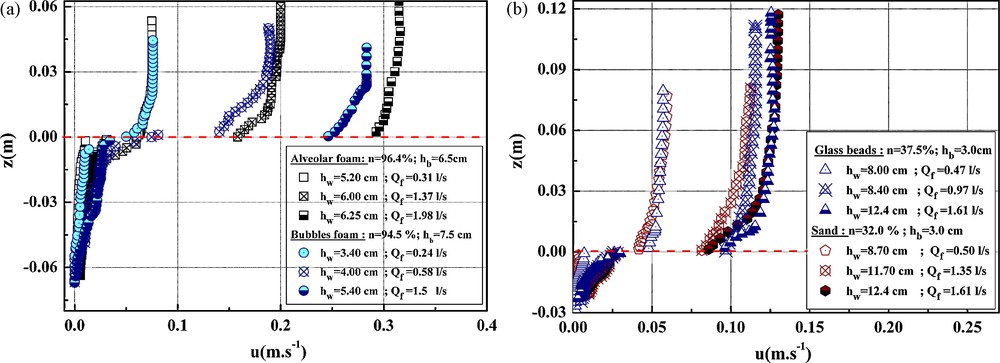
Velocities profiles. a: for porous beds in alveolar and bubbles foam. b: for porous beds in glass beads and sand.
Fig. 5. Profils de vitesses. a : pour des lits poreux en mousse alvéolaire et à bulles ; b : pour des lits poreux en billes de verre et en sable.
A and α are two experimental parameters which depend on the flow conditions in a porous environment at the fluid–sediment interface. The parameter α characterizes the flow bed porosity and the flow mode in the pores of the bed.
From the layout of the graphs lnU = f(Y) which correspond to velocity measurements in the porous bed, we can deduce the value of the parameter α from the slope of the straight linear regression. It can be noted that this parameter depends not only on the nature of the sediment but also on the flow mode at the pore scale. It is influenced by the pore size of the bed (Fig. 6).
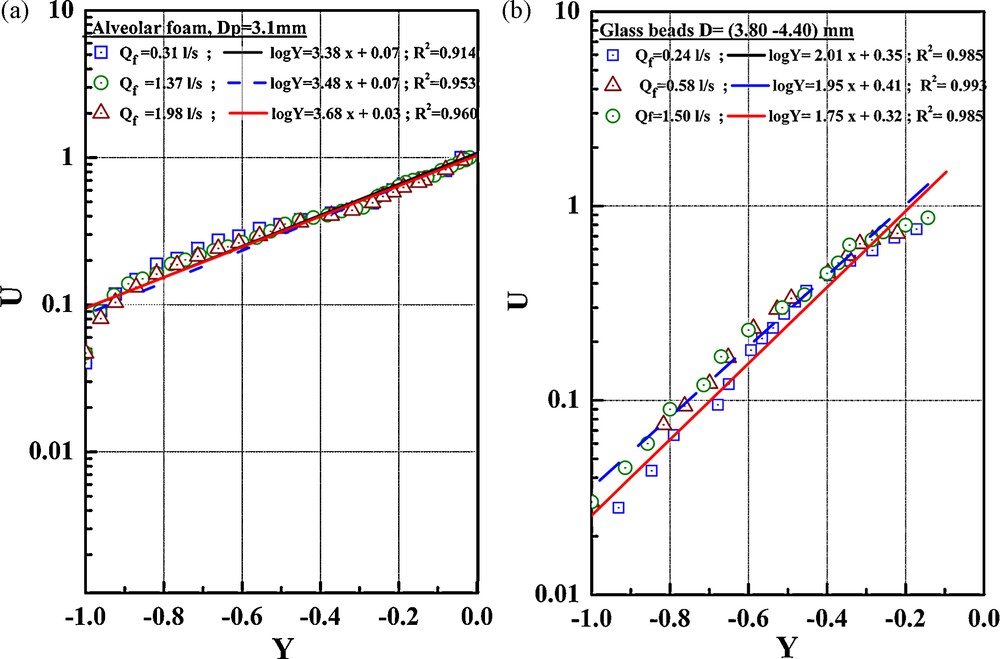
Evolution of the parameter α. a: case of the alveolar foam Dp = 3.1 mm; b: case of glass beads D = (3.8–4.4) mm.
Fig. 6. Évolution du paramètre α. a : cas de la mousse alvéolaire Dp = 3.1 mm ; b : cas des billes de verre D = (3,8–4,4) mm.
6 Conclusion
These results obtained by the UDV velocity measurement technique for a free surface flow on a permeable bed show that the velocity profile is not zero inside the bed. The flow profile in the porous medium has an exponential form which is characterized by an important velocity gradient at the water–sediment interface.
This shows that the traditional models of determination of the friction constraint τp with the wall are not well adapted because they are based mainly on the characteristics of the free flow without taking into consideration the nature of the sediment. The characteristics of the sediment (porosity) and that of the interstitial flow, in particular the Reynolds number of the pores, need to be taken into account. This friction constraint τp is associated with a movement threshold. It thus seems significant to us to define it while taking into account these characteristics of the sediment. This is the objective of our current work which consists in studying the effect of shearing under the action in particular of the swash zone.
Acknowledgements
This work has been made thanks to a funding by the intergovernmental cooperation programme for higher education between Algeria and France (PROFAS). We also thank Dr J-C Willemetz, manager of the Signal Processing SA Society for this additional support and his availability.