

1 Introduction
The Mediterranean coast enjoys a benign climate that strongly favors early-cropping agriculture; it is also the destination of choice for a large number of tourists. The combination of these two factors has given rise to serious seasonal and structural water shortages [20]. One of the technological solutions available is the commissioning of desalination plants. In many cases, these take their water supply from boreholes in coastal aquifers that are in hydraulic connection with the sea [22,29].
There are already 20 plants in operation in Spain, and as many are planned, most of which are already at an advanced stage of construction [1,4,18]. At one of these, the desalination plant for the city of Almería, an experimental site has been installed. The plant is situated on the left bank of the river Andarax near its mouth on the delta (Fig. 1); it takes water from the detritic aquifer [26].
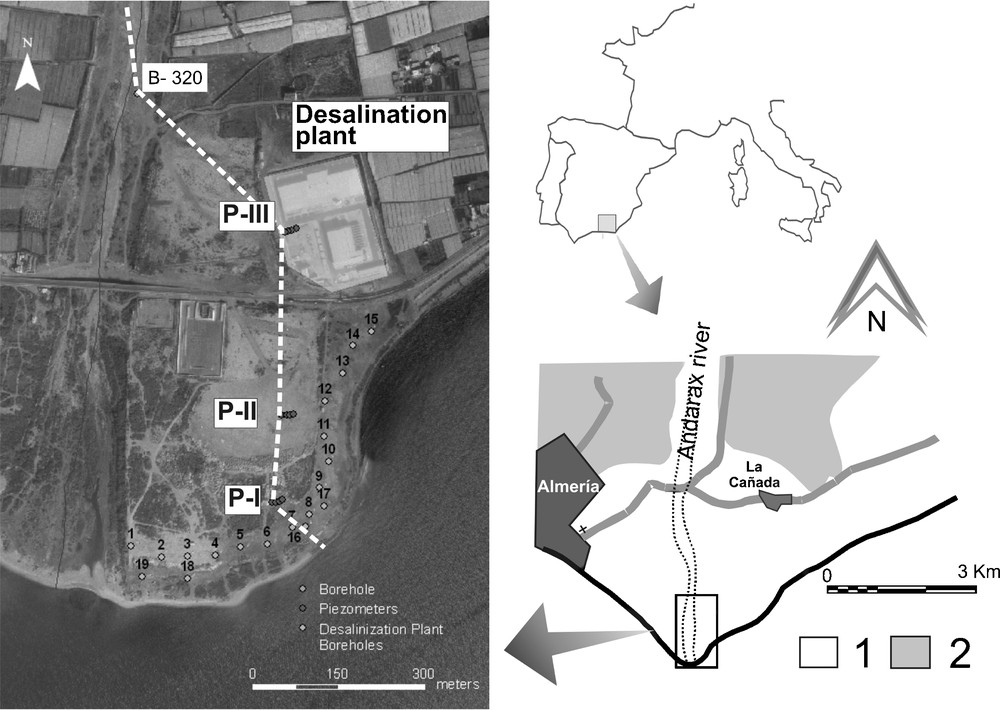
Situation of Almeria's seawater desalination plant, indicating the seawater extraction boreholes (1–19), the three clusters of monitoring piezometers (P-I, P-II and P-III) and the observation borehole (B-320) situated in the bed of the river. The white dotted line indicates the position of the cross-sections features represented in Figs. 2, 6 and 7. 1. Quaternary deposits (gravels, sands and silts). 2. Pliocene deposits (marls and sandy silts).
Situation de l’usine de dessalement d’eau de mer d’Almeria, avec indication des forages de pompage d’eau de mer (1–19), les trois groupes de piézomètres d’observation (P-I, P-II et P-III) et le forage d’observation (B-320), situés dans le lit de la rivière Andarax. La ligne blanche en tiretés indique la position des coupes représentées sur les Fig. 2, 6 et 7. 1. Sédiments quaternaires (graviers, sables et limons). 2. Dépôts pliocènes (marnes et limons sableux).
The Quaternary delta deposits in Almeria are marine formations in lateral continuity with the alluvial deposits of the river Andarax. They consist of gravels, medium-fine sands and some lutites distributed rather heterogeneously, with numerous changes in facies in both the horizontal and vertical planes (Fig. 2). A bed of cemented bioclastic sandstones at the base of the Quaternary deposits separates these coarser Quaternary materials from the underlying Pliocene beds that have a much finer granulometry and act as aquitards [24,25].
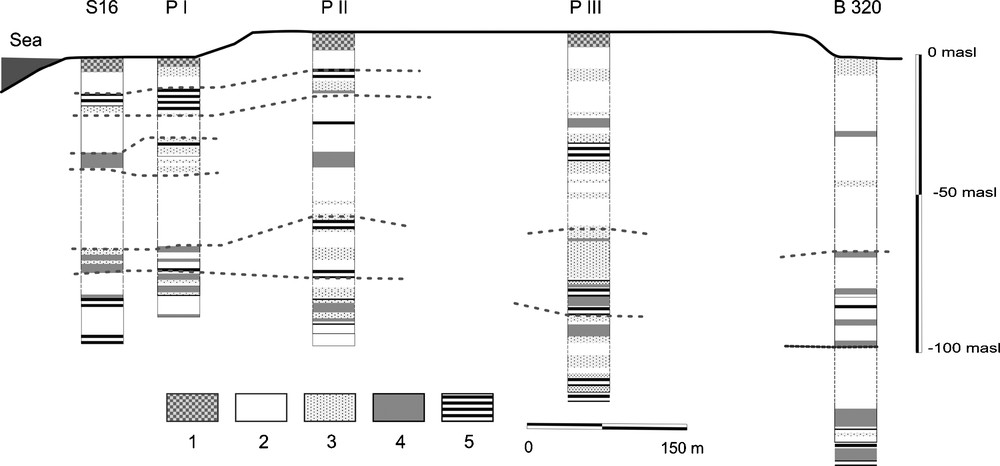
Transverse geological section as indicated in Fig. 1 by the white dotted line. 1. Fill materials. 2. Heterometric sands and gravels. 3. Gravels, sands and clays. 4. Fine sands and silts. 5. Lutites.
Coupe géologique transversale dont la situation est indiquée sur la Fig. 1 (ligne blanche en tiretés). 1. Matériaux de remplissage. 2. Sables et graviers hétérométriques. 3. Graviers, sables et argiles. 4. Sables fins et limons. 5. Lutites.
Work on the City of Almería desalination plant was completed in 2000 [22]. The plant went into operation at the end of 2006, although well below its capacity. The water intake consists of nineteen exploitation boreholes complemented by three duly-equipped piezometer clusters that make up the observation and monitoring system for the aquifer (Fig. 3). This system provides sufficient data to characterize in detail this small but complex, heterogeneous aquifer system. The production boreholes, extending to between 85 and 150 m depth, are cemented over the freshwater and mixing zones (between 40 and 50 m), so that the inflow of freshwater into the plant is minimized [5,7,22].

Scheme showing the piezometer clusters and the continuous monitoring sensors. Tables 1 and 2 summarise the characteristics of the sensors and their location. (The situation of the piezometers is given in Fig. 1).
Schéma des groupes de piézomètres et des capteurs de mesure en continu. Les tableaux 1 et 2 indiquent les caractéristiques des capteurs installés et leur situation (situation des piézomètres sur la Fig. 1).
The initial inactivity of the plant meant that the aquifer could be monitored under a natural regime, in addition to being able to assess its response to sporadic seawater pumping that took place in 2004 as part of the cleaning and set-up of the plant [9]. The almost continuous pumping that has occurred since the plant went into operation (September 2006) has allowed long-term monitoring of the aquifer under the influenced regime, thus completing the observation of the system under both natural and influenced scenarios.
The problems associated with marine intrusion are well-known and have been widely studied, with various measures being put forward to reduce intrusion [2,16,17,28]. One of the solutions proposed to mitigate the effects of intrusion is the extraction of seawater near to the coast. Recently, this idea has been analyzed using numerical simulations and the results indicate the effectiveness of this methodology in controlling seawater intrusion and enhancing groundwater quality in coastal aquifers [12,27,28].
In numerous coastal detritic aquifers, piezometers placed close to the coast have been employed to sample various physicochemical parameters in order to study the main processes associated with the marine intrusion [6,14,23]; they also serve to analyze fluctuations in piezometric level [3], or even to undertake continuous monitoring of certain parameters [8], or to estimate variations in the depth of the fresh water–salt water interface using pressure data [13]. On the river Andarax delta, a network of multipiezometers at different depths is available in the vicinity of the desalination plant (Fig. 1). These have enabled continuous monitoring of the piezometric level at various depths (fresh water, interface and seawater) and a detailed analysis of its evolution under natural conditions and under a regime of intensive seawater extractions.
The main objective of this study is to describe, in a qualitative way, the dynamics of the freshwater-seawater interface of this coastal detritic aquifer as it responds to large extractions of seawater for the desalination plant.
2 Methodology
The monitoring system consists of three piezometer clusters, each of which includes four simple piezometers: one that is slotted over its entire permeable length, and the remaining three that have only one meter slotted sections situated at particular depths: in the fresh water, salt water and mixing zones. The detail of the distribution of the piezometers in each set is represented in Fig. 3. The difference between each cluster is in the depth at which the piezometers are positioned, as this is dependent on the position of the fresh and salt water bands in each monitoring group. The three piezometer groups were constructed using a procedure similar to the production wells [7], but using a smaller diameter well-lining: 165 mm in the piezometers and 450 mm in the production boreholes. Table 1 indicates the depths of the piezometers in each cluster. In addition, an investigation borehole was used, 132 m deep and screened along all the permeable sections, which is situated in the riverbed about 875 m from its mouth (B-320 in Fig. 1).
Situation des capteurs du niveau piézométrique et de la conductivité électrique dans chaque groupe de piézomètres (P-I, P-II et P-III ; Fig. 1 et 3).
| Piezometers | Depth of the sensors (m) | Slotted length (m) | Depth of Piezometer (m) |
| P-I | |||
| Fresh water | 10 | 9–11 | 13 |
| Interface | 36 | 35–37 | 40 |
| Salt water | 72 | 71–73 | 76 |
| P-II | |||
| Fresh water | 10 | 9–11 | 15 |
| Interface | 46 | 45–47 | 49 |
| Salt water | 83 | 82–84 | 85 |
| P-III | |||
| Fresh water | 11 | 10–12 | 13 |
| Interface | 46 | 45–47 | 48 |
| Salt water | 103 | 94–96 | 99 |
The temporal evolution of piezometric level and electrical conductivity was recorded using fixed sensors in the piezometers slotted in their basal section and at particular depths (numbered 2, 3 and 4 in each cluster). Likewise, logs of electrical conductivity of the vertical water column in piezometer 1 (long-screened) of each cluster were recorded monthly (Fig. 3).
The fixed sensors consist of a Meteodata/Hydrodata series 1256C station that uses software for data storage and communication at 10-min intervals. Table 1 summarizes their location. The types of sensors, as well as their range and precision are given in Table 2. The vertical logs were made using GeoVista down-hole logging equipment with two probes (conductivity and flowmeter), together with specific programmes to store and process the data: GeoVista Logger 5.4 for storing the raw data and Viewlog 2.3 for its representation and later treatment [9].
Caractéristiques des capteurs de niveau piézométrique et de conductivité électrique de l’eau (Fig. 1 et 3).
| Data | Type of Sensor | Range | Resolution | Precision (%) | Periodicity of measurement |
| Piezometric level | 1830 Series | 0–10 m | 0.01 | ±0.1 | 10 minutes |
| Conductivity | CT-10SE7INOX | 0–70 S/cm | 0.10 | 5 | 10 minutes |
Equivalent freshwater heads were computed from hydraulic head data measured in the piezometers. Due to the different water salinity, this applies mainly to piezometers 3 and 4. The formula used for this calculation is given in [7]:
3 Results and discussion
3.1 Temporal analysis
Based on the temporal evolution of water level and electrical conductivity, the behavior of the aquifer was observed under different exploitation regimes of the desalination plant. A detailed analysis of the natural regime over a 48-hour period shows a periodic oscillation of the water level as a consequence of the tides. The greatest oscillation of 16 cm is seen in P-I, which lies closest to the coastline, while the oscillation decreases with distance from the coast (Fig. 4).
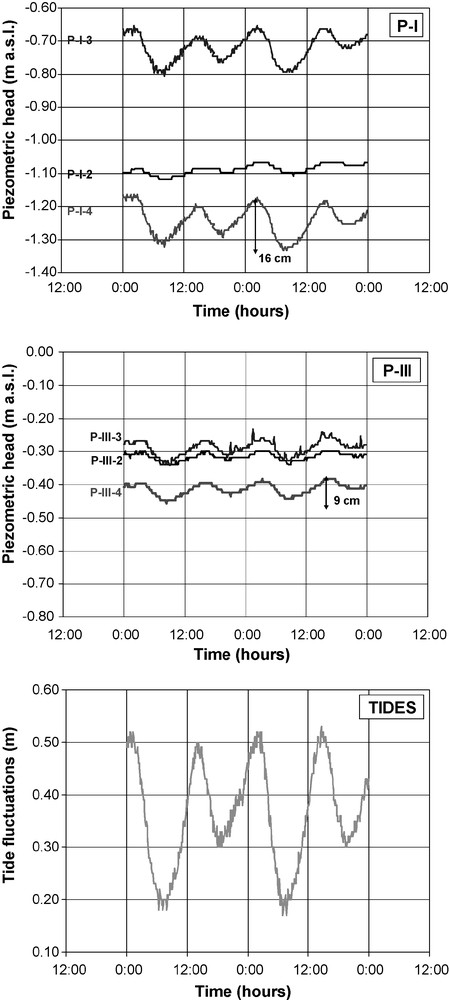
Fluctuation of water heads in piezometers P-I and P-III, expressed as equivalent freshwater heads, under a natural regime over a 48-hour period (10–11 June 2006), compared with tides oscillations in the Almeria port. Piezometers are identified in Fig. 3 and their situation is shown in Fig. 1.
Fluctuation des charges hydrauliques dans les ensembles de piézomètres P-I et P-III, exprimée en charge hydraulique équivalente en eau douce sous régime naturel, sur une période de 48 heures (10 et 11 juin 2006), comparée à l’oscillation des marées dans le port d’Almeria. Les piézomètres sont identifiés sur la Fig. 3 et leur situation sur la Fig. 1.
In the shallower piezometers that are slotted over the fresh water section, oscillations were more modest (between 3 and 5 cm) and coincided with the unconfined layers of aquifer. Meanwhile, oscillations in the deeper piezometers varied from 9 cm (P-I) to 16 cm (P-III), since these piezometers lie in confined or semi-confined layers of the aquifer. The fluctuations were cyclical, following the semidiurnal tides that characterize the Bay of Almería (Fig. 4) – two high and two low tides, each of different amplitude and slightly out of phase with respect to the marine tides [6].
Water levels in the piezometers in the three vertical water bands are negative (Fig. 4). In theory, in the general context of the discharge zone of a coastal aquifer, piezometers screened in fresh water (2) and interfaces (3) tend to be positive, whilst those with screens in the salt water band (4) tend to be negative. At the same time, the piezometric level of the interface (3) could be higher than in the fresh water, due to the inflection of the equipotential line in the discharge zone at depth. There may also be a contribution from confined or semi-confined levels that may exist. Nevertheless, the water heads in piezometers 2 and 3 of the clusters are also negative, and this fact may be attributed to the context of the aquifer at that time. For one thing, the measurements were taken during the dry season (summer) and in this water year (2005/06), the annual precipitation was below average. As a consequence, there was scant recharge to the aquifer. Secondly, extractions were being made upstream of the piezometer cluster for irrigation, and this represents the main reason that, historically, the delta of the Andarax has given negative piezometric levels [21].
Analysis of the data over a longer interval allowed the evolution of the piezometric level and electrical conductivity to be observed under different exploitation regimes at the desalination plant. Fig. 5 shows the evolution of piezometric level and electrical conductivity from September to December 2006 corresponding to the first 4 months of operation of the plant. Over this period, the plant extracted a continuous flow of nearly 1400 m3/h from five boreholes, alternating the boreholes used every 3 or 4 weeks, with some interruption in mid-September. This volume represents a third of the maximum capacity of the desalination plant [10]. The figure highlights the sharp fall in water level in piezometers P-II-3 and P-II-4 following the start-up of the desalination plant: drops of 1.58 and 1.47 m were recorded, respectively, over a period of 48 hours. After 4 months, the level in P-II-4 dropped by 1.70 m. In contrast, the water level in the shallower piezometers P-II-2 fell more slowly: only 0.17 m in the first 48 hours and 0.46 m after 4 months of operation of the plant.
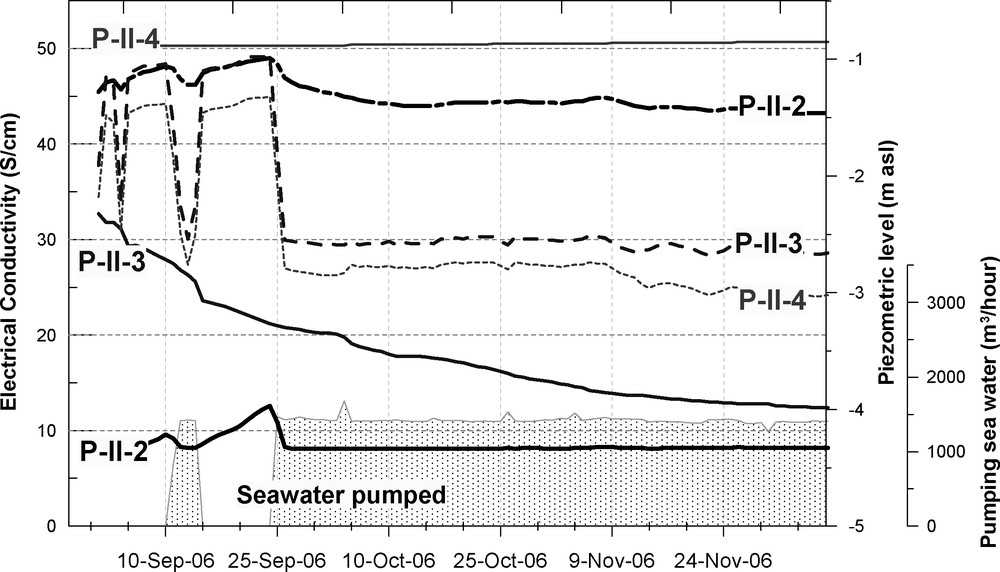
Evolution of piezometric level and electrical conductivity in the piezometer cluster P-II. Piezometric level (m a.s.l.) in solid lines. Electrical Conductivity (S/cm) in dotted lines. See piezometer scheme in Fig. 3 and their situation in Fig. 1.
Évolution du niveau piézométrique et de la conductivité électrique dans l’ensemble des piézomètres P-II. Niveau piézométrique (m s.n.m.) en ligne continue ; conductivité électrique (S/cm) en traits. Voir le schéma des piézomètres sur la Fig. 3 et leur situation sur la Fig. 1.
Another salient result was the progressive drop of electrical conductivity in P-II-3 (Fig. 5). The slotted section of this piezometer coincides with the interface and its conductivity fell from 22.4 mS/cm in September to 12 mS/cm in December. The vertical logs of the piezometers slotted over their entire depth confirm a very sharp and rapid drop in the level of the fresh water–salt water contact when intensive pumping occurs. Likewise, this contact was very clear in the vicinity of the production boreholes, close to piezometers P-I and P-II, where the fall exceeded 20 m [11,6].
Piezometer P-II-4 is slotted in its basal section where it is in direct contact with seawater; therefore, its electrical conductivity was unaffected when intensive extractions of seawater began. In the shallower P-II-2, conductivity remained quite stable, with a slight increase between 15 and 24 September when seawater pumping was stopped.
There were also slight rises and falls in the piezometric level associated with changes in pumping conditions. Thus, at the end of October, the fall recorded was due to the increase in the volume pumped from 1400 to 1533 m3/h. Nevertheless, this direct relationship was not always detected since the increase in pumped volume occurred when there was a switch to a different production borehole, such that the part of the aquifer being tapped lay further from the monitoring piezometers. In any case, water levels were not stable over time, but rather showed a falling trend, especially in November to December, despite the fact that the volume of seawater abstracted was very stable (1400 m3/h).
3.2 Spatial evolution
To analyze the spatial variations of the fresh water–salt water contact, two cross-sections were drawn (situation in Fig. 1). These two cross-sections represent the two proposed scenarios (natural regime and regime of extraction of saltwater) and the data used to draw them came from geophysical logs of electrical conductivity in the borehole situated in the riverbed (B-320) and the fully-slotted piezometers of the three clusters under both scenarios. The cross-section in Fig. 6 shows the situation in September 2006 before the desalination plant was put into operation and so it represents the natural situation in the aquifer. One can recognize the model of saltwater intrusion where fresh water–salt water contact extends landward with a very shallow gradient. Such a shallow gradient could indicate the presence of a multilayer system in which a semi-confined layer of low permeability separates the aquifer levels (Fig. 2), which, in addition, have elevated hydraulic conductivity [6].
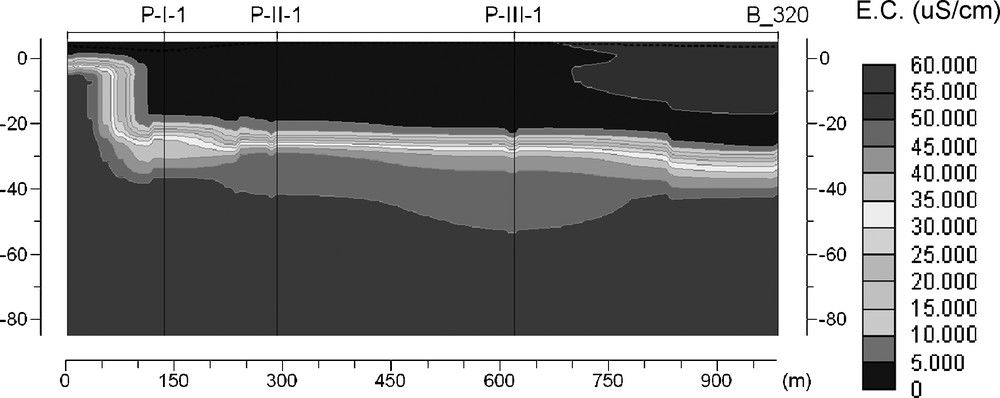
Electrical conductivity profile for the Andarax delta under a natural regime, with no pumping (September 2006). The left limit of the cross-section corresponds to the sea.
Coupe de conductivité électrique du delta de l’Andarax, en régime naturel sans pompage (septembre 2006). La limite gauche de la coupe correspond à la mer.
The cross-section drawn in Fig. 7 (May 2007) shows the situation when the plant was operating and pumping around 1400 m3/h of salt water. The same figure shows the fall in electrical conductivity, which is more pronounced close to the coast, where the three sets of monitoring piezometers are located (P-I-1, P-II-2 and P-III-3). A fall was even recorded in borehole B-320, situated in the riverbed some 875 m away from the coast. The generalized fall in the conductivity of the water along the cross-section corresponded to the drop in conductivity observed in the temporal evolution of piezometer P-II-3, situated at an intermediate depth (Fig. 5).
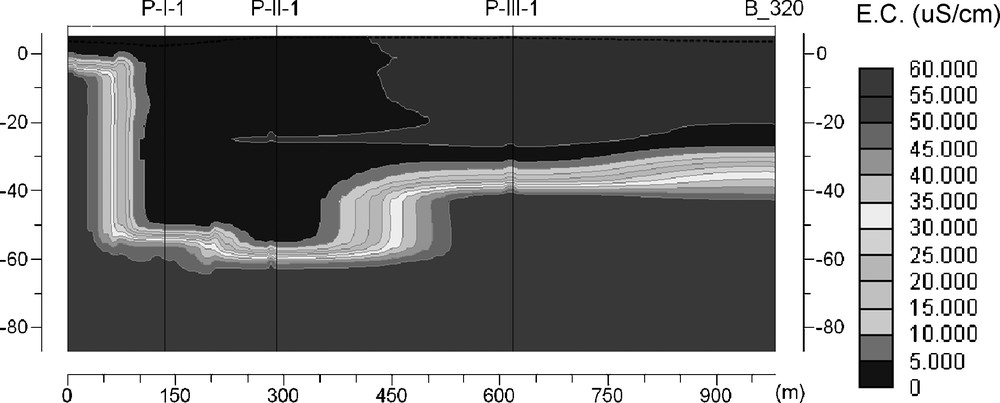
Electrical conductivity profile for the Andarax delta when the plant is pumping 1400 m3/h of salt water (May 2007). The left limit of the cross-section corresponds to the sea.
Coupe de conductivité électrique du delta de l’Andarax pendant le pompage de 1400 m3/h d’eau de mer (mai 2007). La limite gauche de la coupe correspond à la mer.
The spatial variation between the cross-sections of electrical conductivity was most noticeable in two phenomena: the reduction in the thickness of the interface and its position at a greater depth. Taking values of 10 000 and 50 000 mS/cm to mark the beginning and end of the interface, respectively, it can be seen that the extraction of seawater from beneath the fresh water–salt water contact provoked a reduction in thickness of the interface of between 2 and 18 m, and caused it to drop by between 8 and 40 m (Table 3).
Profondeurs de la surface supérieure de l’interface, profondeur de l’eau de mer et épaisseur de l’interface (m), obtenues à partir des coupes représentées sur les Fig. 6 et 7.
| Regime | P-I-1 | P-II-1 | P-III-1 | B-320 | |
| Depth to start of interface | Natural | 22 | 22 | 28 | 32 |
| Influenced | 55 | 60 | 40 | 40 | |
| Depth to seawater | Natural | 35 | 42 | 35 | 35 |
| Influenced | 60 | 62 | 42 | 41 | |
| Thickness of interface | Natural | 33 | 38 | 12 | 8 |
| Influenced | 25 | 20 | 7 | 6 |
Another interesting phenomenon identified on comparing the profiles of the two regimes (Figs. 6 and 7) is the inversion of the “saline gradient” of the fresh water–salt water contact; this is especially noticeable close to the coast.
Both phenomena were partially highlighted by electrical resistivity tomography cross-sections made perpendicular to the coast in a nearby sector (Fig. 8), though the scale of observations was too different to make a clear comparison and the presence of the seashore makes the image more complex to interpret [15,19].
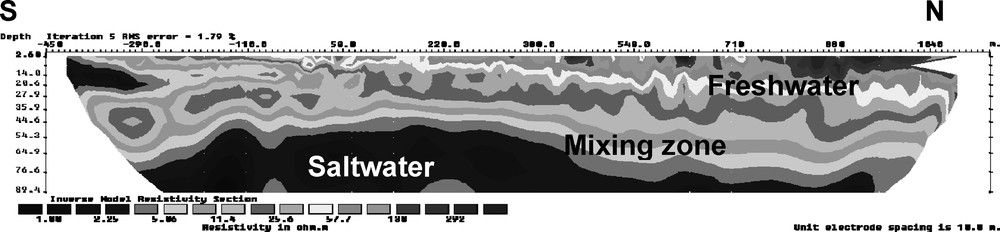
2D electrical resistivity tomography image along Andarax riverbed, taken on July 2007 (during plant pumping).
Tomographie de résistivité électrique 2D le long du lit de la rivière Andarax, prise en juillet 2007 (pendant le pompage).
4 Conclusions
The observation and monitoring system was designed to record the spatial and temporal evolution of piezometric level and electrical conductivity, and to provide the necessary information to assess any modification in the fresh water–salt water equilibrium in a detritic coastal aquifer subject to large seawater extractions.
Continuous monitoring and monitoring over short time intervals constitute an ideal tool for observation of coastal aquifers subject to different exploitation regimes on different spatial-temporal scales. Under natural conditions, stability is observed both in water level and conductivity of the water column in the aquifer, with the influence of tides being more pronounced in the deepest piezometers. The vertical heterogeneity of the aquifer lithology also plays a role in the variation of water heads measured in the piezometers at different depths. Under a pumping regime, and after 7 months of uninterrupted pumping to extract seawater from beneath the fresh water–salt water contact, the aquifer behavior became very dynamic: the most pronounced decline in water level was recorded in the deepest piezometers (P-I-4 and P-II-4), and there was a marked descent of the interface (25 m), which brought about a gradual fall in electrical conductivity in the piezometers situated at an intermediate depth (P-I-3 and P-II-3). For practical purposes, changes of water levels and conductivity typically occur through the incorporation of continental fresh water into the slotted sections of the boreholes (freshwater intrusion).
The logs of electrical conductivity from the piezometers slotted over their whole length, both under natural and influenced regimes, permitted the vertical distribution of salt water within the aquifer to be known under different extraction scenarios. They also allowed the position of the interface and its thickness to be determined: there was a significant reduction in its thickness (between 2 and 18 m), a migration to greater depth (of between 8 and 40 m) and an inversion of the “saline gradient” in the vicinity of the desalination plant.
Finally, it is important to highlight that the most immediate implication of those phenomena is a fall in the electrical conductivity of the water intake to the desalination plant, as well as the partial extraction of continental fresh water from the delta aquifer, which could possibly affect other water users (those taking water for crop irrigation), that is to say, withdrawing saltwater from the delta coastal aquifer may have important consequences on the freshwater availability upstream.
Acknowledgements
This study was undertaken within the framework of the EU-financed ALERT Project (Contract No. GOCE-CT-2004-505329) and the MEC-financed Project CGL2007-63450/HID. We extend our thanks to the UTE PRIDESA-ABENGOA technicians responsible for the management of the Desalination Plant, who allowed us free access to the installations and who provided the necessary technical data, and to the Almería Port Authority who supplied tidal data. Finally, we would like to express our sincere acknowledgement to Dr. Ph. Renard for all the revisions and suggestions made to improve this manuscript.