

1 Introduction
Saturn's largest satellite Titan is the only moon in the solar system with a dense atmosphere mainly composed of nitrogen. Methane, the second most abundant gas species, is transformed by solar radiation into complex organic molecules and aerosols which eventually deposit onto the surface. Proving that an ocean exists and determining its depth would provide strong constraints on the processes involved for organic molecules interacting with liquid water. Such oxygenated chemistry is important for the prospect of prebiotic chemicals being present on Titan's surface and/or subsurface (Raulin et al., 1998). With respect to its mass and radius, Titan is similar to Jupiter's moons Ganymede and Callisto, where the presence of a buried ocean was inferred after the discovery of an induced and/or intrinsic magnetic field, revealed by the magnetometer on board the Galileo spacecraft (Schubert et al., 2004). Such a determination is not achievable on Titan because the flyby altitude is limited by atmospheric drag. However, the Schumann resonances (Schumann, 1952; Sentman, 1990) might lead to a similar discovery because they are trapped waves within the atmospheric cavity, more precisely, between the ionized upper atmosphere and a reflecting ground or a subsurface conductive boundary. The Plasma Wave and Altimetry (PWA) experiment, a subsystem of the Huygens Atmospheric Structure Instrument (Fulchignoni et al., 2002) on board the Huygens Probe that landed on Titan on January 14, 2005 (Lebreton et al., 2005), was designed to perform measurements of atmospheric conductivity and Extra Low Frequency (ELF) waves with such ideas in mind (Grard et al., 1995). Several forward-looking articles were published by the wider PWA team, well-before the mission and soon after landing (Grard et al., 1995; Nickolaenko et al., 2003; Simões et al., 2007). These studies were more or less speculating about the possible existence of lightning activity in Titan's atmosphere, thereby implying both a Schumann resonance and the presence of a conductive ground or a buried ocean.
After a quick-look analysis of the Huygens data, it was soon noticed that the signal observed at approximately 36 Hz with the PWA instrument (Grard et al., 2006) might satisfactorily fit the range of values predicted by models to be a second eigenmode of a Schumann resonance (Nickolaenko et al., 2003; Simões et al., 2007). Given the absence of any acknowledged lightning activity on Titan (Fischer et al., 2007), contrary to what exists permanently on Earth, it was postulated that systems of currents induced in the moon's ionosphere, driven by the plasma flow of Saturn's magnetosphere colliding with Titan at velocity up to 200 km s−1, could be a convenient power source available to triggering a “Schumann-like” resonance (Béghin et al., 2007). According to conventional models (Neubauer et al., 1984), such an interaction induces a dc electric field of 1–2 mV/m within Titan's ionosphere, directed along the anti-Saturn direction. This field develops a permanent potential drop up to 5 kV between both edges of the hemisphere opposed to Saturn. The global current system induced through this interaction is associated with a strong distortion of the impacting magnetic field lines of Saturn which appear to be draped around the Titan's upper ionosphere (Neubauer et al., 1984). The current system extends far away along a comet-like tail in the wake direction. The current lines are closed within the highly conductive ionosphere of Titan after penetrating through the entry points of the so-called Induced Magnetospheric Boundary (Béghin et al., 2009; Bertucci et al., 2009). The strength of these currents carried essentially by ionospheric ions may reach hundreds of kA, yielding thousands of megawatts available power. Only a 2% fraction of that power appears sufficient to be converted into ELF electromagnetic radiation through nonlinear processes, and afterwards backscattered in the atmospheric cavity (Béghin et al., 2007; Béghin et al., 2009).
A preliminary model of the most likely mechanism for such a new kind of Schumann resonance has been recently developed by making use of complementary measurements performed by other instruments of the Huygens-Cassini mission (Béghin et al., 2009). The best understanding of the probe dynamics during the descent was made possible thanks to the observations of the DISR camera (Karkoschka et al., 2007). Comprehensive models of magnetic field and plasma interaction mechanisms in Titan's upper ionosphere have became more and more accurate after tens of Titan flybys by the Cassini orbiter (Bertucci et al., 2009; Rosenqvist et al., 2009). Although a thorough achievement of our model is still under development, we have enough experimental and theoretical convergent arguments to draw the main constraints involving the properties of the cavity necessary to account for the observations. Namely, we may constrain the parameters of the atmospheric conductivity and the depth of a requisite perfectly conductive surface that ought to be hidden beneath the ice crust.
2 Electron permittivity and ELF wave measurements
The PWA instrumentation and its main scientific objectives have been described in details by Grard et al. (Grard et al., 1995). Here, we are concerned with the wave and permittivity results only, which are relevant to our model of Schumann-like resonance. The ELF electric-field measurements were performed within the range 6–96 Hz over one component, using a short dipole made of two electrodes separated by about 2 m, with the Huygens Probe body in between. In addition to passive observations of waves, the package included the active Mutual Impedance (MI) instrument making use of the same dipole antenna and designed for deriving the local value of the electron conductivity. The latter experiment made possible the discovery (Hamelin et al., 2007) of a thin ionized layer at the unexpected low altitude of 60–70 km. This layer is attributed to ionization of neutral molecules and aerosols by solar and galactic cosmic rays, and is named hereafter as GCR layer in short. The operations, starting at 141 km altitude, were conducted during 2 h 25 min, until the surface was reached, where ground permittivity measurements were performed for 30 min before the transmission link to the Cassini orbiter was interrupted. The data above 105 km are discarded in this study because the PWA instruments misbehaved during the initial part of the descent, most likely due to the fact that at least one boom was not properly locked into its nominal position (Béghin et al., 2007; Hamelin et al., 2007). After several years of thorough technical and methodological investigations, the most significant features of the 36 Hz signal and of the atmospheric conductivity profile may be summarized as following:
- • the earliest quick-look analyses of the ELF range data soon revealed the presence of a quasi-monochromatic line near 36 ± 3 Hz (Grard et al., 2006), visible throughout the descent, showing a regular amplitude versus altitude profile with significant short time stochastic fluctuations (Béghin et al., 2009). In the regions where the signal amplitude is well above the noise level, it appears clearly as a resonance, with a quality factor, Q, estimated equal to 6 (Fig. 1). Due to severe instrumental limitations, the fundamental and successive harmonics of the presumed resonance are not unambiguously visible (Béghin et al., 2007);
- • using the Huygens Probe attitude dynamics deduced from the Descent Imager Spectral Radiometer camera and from the automatic gain control of the Huygens-Cassini link (Béghin et al., 2009; Karkoschka et al., 2007; Lebreton et al., 2005), the spin modulation of the signal allowed us to show that the electric-field component is essentially horizontal (EH), with no vertical component detected within the instrumental capabilities;
- • the EH amplitude modulation at twice the gondola spin period exhibits the usual signature of a quasi-linear polarization, or at least of a non-circularly polarized electromagnetic wave;
- • the average altitude profile of EH amplitude is best fit by three successive portions of linear variations (Fig. 2), with a maximum near 90 km, and a sudden break at 60 km. This break is found to coincide exactly with the crossing of the GCR layer (Béghin et al., 2009);
- • the latter coincidence, added to the visible relationship between the EH amplitude and the conductivity profiles throughout the descent (Fig. 2), provide a substantial complementary reason to argue that a natural electric field solely may be so closely controlled by the atmospheric conductivity;
- • the EH amplitude is not zero near the surface contrary to what should have been observed while approaching a conductive ground. This fact is consistent with the surface permittivity and the weak conductivity measured by the MI instrument after landing (Grard et al., 2006). Although the latter values involve ELF properties only, the data agree nevertheless with the topology and electrical properties of Titan's surface known after several tens of flybys by the Radar onboard the Cassini orbiter (Wye et al., 2007). Titan's global surface appears merely as a poorly conductive dirty water-icy crust, studded in high latitude regions with a few lakes filled with methane, ethane and other hydrocarbons (Brown et al., 2008);
- • all the above features are converging to claim that the observed 36 Hz signal definitely exhibits the expected characteristics of a natural wave, rather than other causes initially invoked, such as instrumental artifact, mechanical vibrations or induced aerosol shot-noise (Béghin et al., 2007).
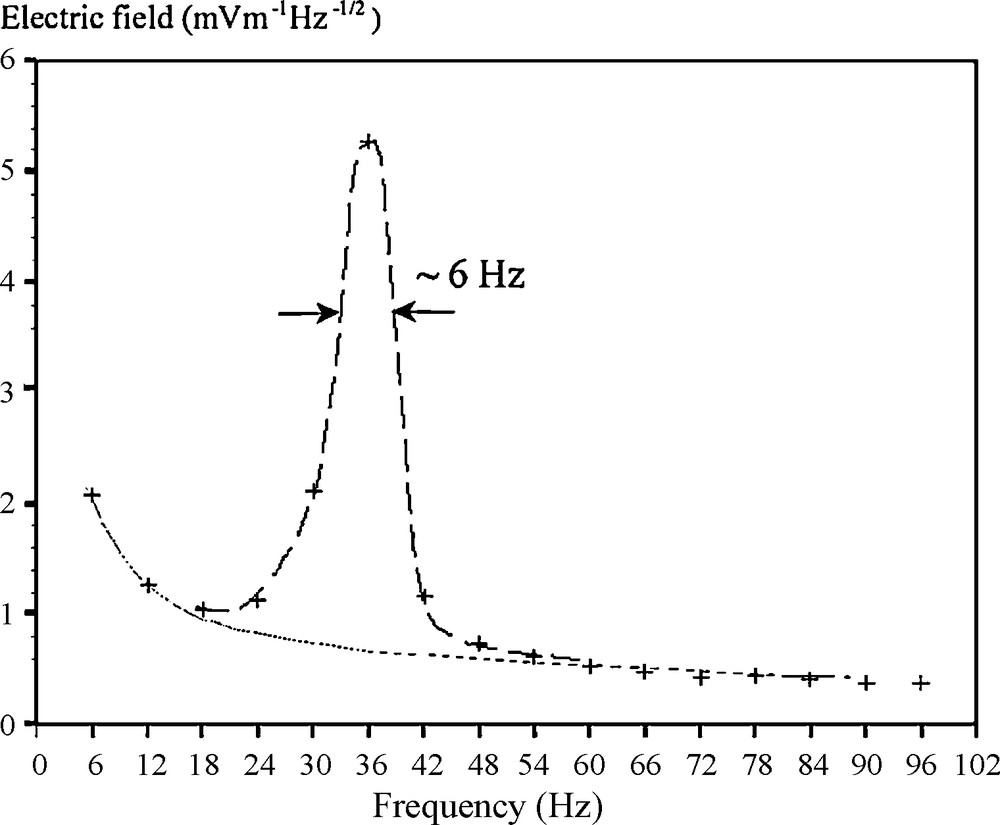
Mean value of 61 ELF power spectra within altitude range 80–90 km. Dot line is the background noise, essentially due to instrumental origin. The half-power quality factor Q = f/Δf of the resonance is ∼6.
Valeur moyenne de 61 spectres de puissance ELF dans la gamme d’altitudes de 80 à 90 km. La courbe en pointillés est le niveau du bruit essentiellement d’origine instrumentale. Le facteur de qualité de la résonance Q = f/Δf est ∼ 6.
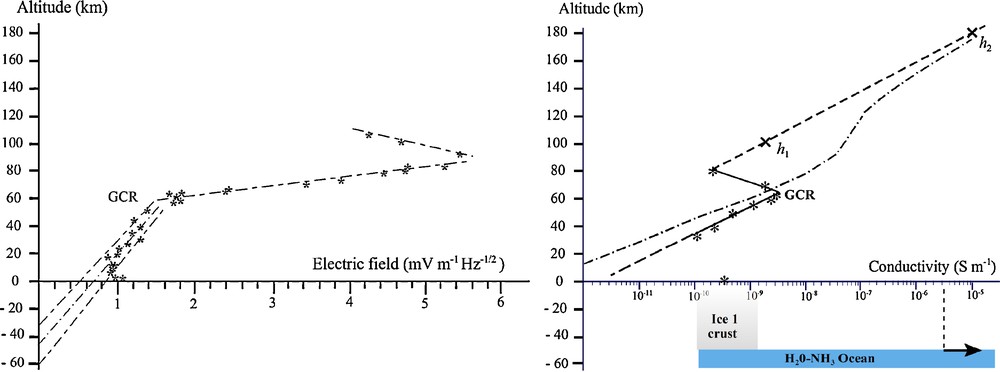
Left panel: smoothed radial (vertical) altitude profile of the 36 Hz horizontal electric-field amplitude (EH); stars: average of 32 data packs containing 30 to 100 spectra each; dash-dot lines: least-square linear regression fits, extrapolated below the surface through a presumed lossless icy crust down to a highly conductive surface. Right panel: Measured and predicted electron conductivity profile; asterisks: electron conductivity derived from PWA-MI instrument in the atmosphere and at the surface; crosses h1, h2 and dash line: conduction and reflection boundaries, respectively, and constrained model-profile (see text), dash-dot line: theoretical model-profile (Borucki and Whitten, 2008) assuming haze of aerosols with 7.2 eV photoemission threshold, lower-right arrow: minimum conductivity of the presumed ocean (blue area). Masquer
Left panel: smoothed radial (vertical) altitude profile of the 36 Hz horizontal electric-field amplitude (EH); stars: average of 32 data packs containing 30 to 100 spectra each; dash-dot lines: least-square linear regression fits, extrapolated below the surface ... Lire la suite
Panneau gauche : profil radial (vertical) d’altitude de l’amplitude moyennée du champ électrique horizontal (EH) à 36 Hz; astérisques : moyenne sur 32 paquets de données contenant chacun 30 à 100 spectres ; lignes points traits : droites de régression par moindre carré, extrapolées sous la surface à travers une croûte de glace supposée sans perte jusqu’à une surface hautement conductrice. Panneau droit : profils de conductivité électronique, mesurés et prédits ; astérisques : conductivité électronique mesurée par l’instrument PWA-HASI dans l’atmosphère et à la surface ; croix h1, h2 et ligne pointillée : respectivement les bornes de conduction et de réflexion, et le profil modèle contraint (voir texte), lignes points traits : profil modèle théorique (Borucki and Whitten, 2008) en supposant une brume d’aérosols avec un seuil de photo-émission de 7.2 eV, flèche en bas à droite : conductivité minimum de l’océan présumé (zone bleue). Masquer
Panneau gauche : profil radial (vertical) d’altitude de l’amplitude moyennée du champ électrique horizontal (EH) à 36 Hz; astérisques : moyenne sur 32 paquets de données contenant chacun 30 à 100 spectres ; lignes points traits : droites de régression par moindre carré, extrapolées ... Lire la suite
We want to emphasize that the altitude profile of the smoothed amplitude of the 36 Hz electric-field component EH, plotted in Fig. 2 (left panel), exhibits a clear relationship with the electron conductivity profile (right panel). Second, the most remarkable feature of the EH strength profile is the presence of an offset value of approximately 0.5 mV/m near the surface. We show in the following sections that several other characteristics of the signal are consistent with the expected features of the second spherical harmonic of a Schumann-like resonance. Subsequently, we highlight the main return derived from the existence of the offset of the horizontal wave electric field at the surface, namely, the requisite presence of a buried highly conductive boundary few tens of km below the Titan's solid surface.
3 Relationship between Schumann-like resonance and conductivity profile
On Earth, the well-studied Schumann resonances are spherical harmonics of transverse magnetic (TM) modes (Sentman, 1990), associated with vertical currents of lightning. As a consequence, the major electric-field component is vertical (EV), with a constant amplitude from the surface up to an altitude, h1, known as the conduction boundary. At this altitude, the imaginary part of the complex permittivity equates to its real part, according to the following relations
| (1) |
| (2) |
Above h1, both vertical and horizontal electric field components decrease rapidly and collapse at the altitude h2 known as the reflection boundary (Sentman, 1990), that obeys the following relations when the conductivity profile is that of Eq. (2)
| (3) |
As observed with terrestrial Schumann TM modes, the horizontal component EH is everywhere more than one order of magnitude weaker than EV, and it increases linearly, starting from zero at the conductive ground up to its maximum value in the vicinity of h1. According to usual theories (e.g. Sentman, 1990) the altitude profile of EH component exhibits two linear portions on both sides of h1. In case of Titan, the electric-field is essentially horizontal as seen in Section 2. Its altitude profile is thus totally different to what we were expecting from Earth-like conditions. The behavior of the EH amplitude profile plotted in Fig. 2 follows however, in the region around h1 the same rules as those for the horizontal terrestrial component. Such a property characterizes transverse electric (TE) modes triggered by horizontal currents, or by radial magnetic dipoles (Wait, 1962). This fact is self-consistent with generating sources associated with horizontal (zonal) ionospheric current systems briefly described in Section 1, and with the absence of lightning vertical currents. However, the EH amplitude exhibits an unusual altitude profile made of three linear portions instead of two, starting from the surface up to the maximum altitude of reliable PWA data (∼105 km). A break is observed when Huygens is crossing at approximately 60 km the GCR layer (Fig. 2). It is not the purpose to discuss here in much detail the mechanism of this break, as it will be considered in a forthcoming work. Briefly speaking, the GCR layer effect leads to a break-up of the EH profile into two linear portions instead of increasing straightforward from the ground up to h1, as it does on Earth. Since the EH profile in Fig. 2 resembles a slab-layered conductivity profile, we are referring to conventional metallic wave-guides filled with longitudinal dielectric slabs, where a specific form of degenerated TE mode must be considered (Béghin et al., 2009), called as longitudinal section electric (LSE) mode (Collin, 1991).
We are presently working out the analytical theory of such a mode in spherical geometry. We consider the second zonal mode LSE2,0, since the eigen-frequency of any second order spherical harmonic for a Titan cavity is always found at around 36 Hz (Nickolaenko et al., 2003; Simões et al., 2007). It is known that the preferential locations to observe the strongest EH amplitude of any of these modes are near one of the antinodes. For the second harmonic, the antinode latitudes are determined by the extreme values of the derivative of a Legendre polynomial of degree two, i.e., ideally ±(2k + 1) π/4 apart from each current source. Although it could appear as a speculative exercise, the location of the Huygens landing site (∼10° S) might fulfill such conditions for major currents sheets localized around 35° N and/or 55° S (Fig. 3).
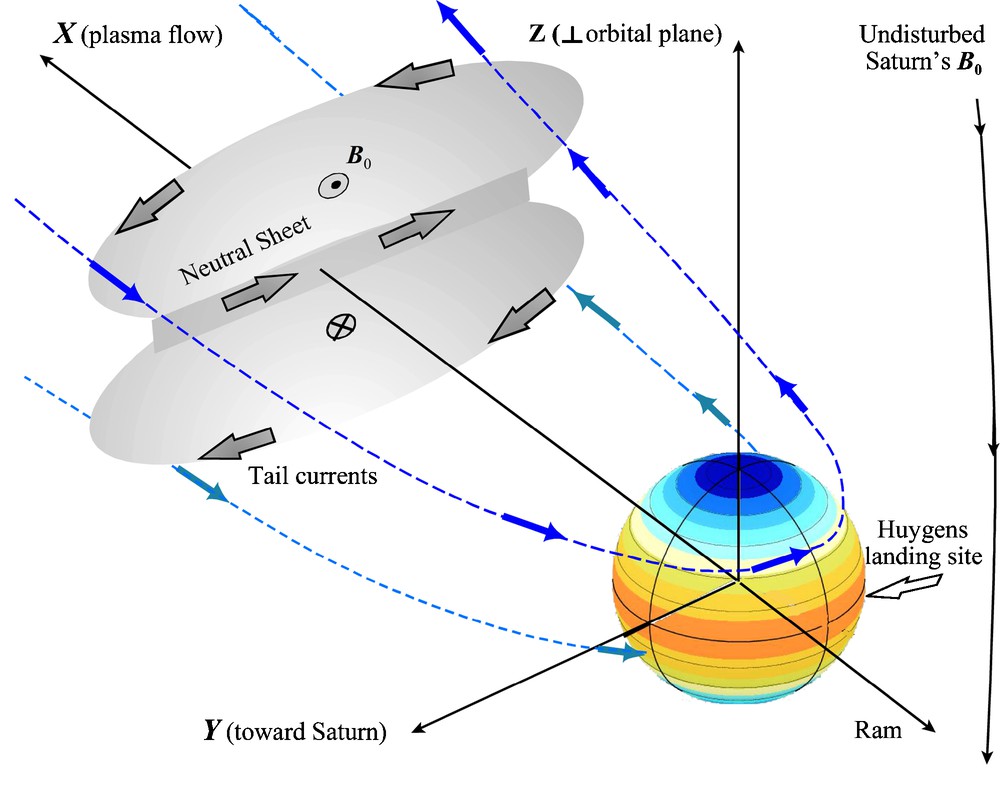
Sketch of Titan's encounter with the co-rotating Saturn's magnetosphere (not to scale). Blue and orange surfaces are antinodes of the second zonal spherical harmonic LSE2,0 of Schumann modes assumed to be triggered by radial ELF magnetic dipoles associated with ionospheric currents. The preferential observation of this mode is believed to be due to the peculiar location of the Huygens Probe landing site at nearly 10° south.
Croquis de l’interaction de Titan avec la magnétosphère de Saturne en co-rotation (non à l’échelle). Les surfaces bleues et orange sont les ventres de l’harmonique sphérique LSE2,0 des modes de Schumann supposés excités par des dipôles magnétiques ELF associés aux courants ionosphériques. On pense que l’observation préférentielle de ce mode est liée à la situation particulière du site d’atterrissage de la Sonde Huygens vers 10° de latitude Sud.
In our model, we assume that the two branches of the EH profile on both sides of the peak value at 90 km (Fig. 2, left panel) derive from the same equations as the horizontal electric field component of the terrestrial TM mode (Sentman, 1990). The values of h1 (100 km), h2 (180 km) and ζ (9.25 km) have been deduced from the experimental profile of EH (Béghin et al., 2009), in a range of a few scale heights around the maximum by considering the exponential profile of conductivity given by Eq. (2). In doing so, we constrain the global Titan's model of conductivity from h1 to h2, i.e. well above the local MI measurements (Fig. 2, right panel). One can check, nevertheless, that our estimate of conductivity (10−5 S m−1) at h2 = 180 km agrees fairly well with one of most recent theoretical models (Borucki and Whitten, 2008) assuming haze clouds of aerosols with 7.2 eV photoemission threshold in that region, during daytime. However, the latter model could not account for the unexpected decrease of conductivity observed during Huygens descent between ∼120 km and the peak of GCR layer. Below 100 km, the atmospheric conductivity is obtained from the MI instrument (Hamelin et al., 2007), and the data points are fit by two portions of exponential profile on each side of the GCR layer (Fig. 2, right panel). Since the conductivity at 30 km (∼10−10 S/m) is well below the value needed for a conduction boundary for 36 Hz, the conductivity profile may be extrapolated down to the surface for simplification without any consequence in the following discussion. The surface permittivity is found from the MI instrument (Grard et al., 2006) to have a real part around 2, similar to the value deduced from the Cassini Radar scatterometer measurements (Wye et al., 2007), and conductivity about 0.4 nS/m. The resulting refractive index is about 1.5, which is a value well too small to constitute a reflection boundary, as confirmed by the presence of an offset of EH just before landing.
Below the peak of the GCR layer, we observe again a linear decrease of the EH amplitude. This fact is interpreted as a response to the crossing of a second conduction boundary, with a conductivity similar to that of h1 (Fig. 2). Referring to dielectric slab-layered wave-guides (Collin, 1991), the GCR layer accounts for the change in slope of the field amplitude, whereas the possible subsequent change of eigen-frequency is assumed to be a second-order effect. Thus, provided that EH vanishes on a conductive layer located somewhere beneath the surface we may apply the same equations as for zonal terrestrial modes to estimate the eigen-frequency and the quality factor of the resonance (Sentman, 1990), i.e.
| (4) |
Thus, putting z1 = h1 (100) + 45 km, and z2 = h2 (180) + 45 km, Eq. (4) yields an eigen-frequency of 36.5 Hz for LSE2,0 mode (l = 2). Therefore, with ζ = 9.25 km, the quality factor is Q = 6.07. The fact that both values are fairly close to those which are actually observed validates the coherence of our model.
4 Conductivity of the icy crust
Regarding the electrical properties of the icy crust, we are concerned with the conductivity which governs the way one may extrapolate the altitude profile of EH below the surface. According to basic physics of TE and LSE modes, for any kind of dielectric material, the boundary conditions must satisfy the continuity of the EH amplitude and its radial derivative (Collin, 1991; Wait, 1962). Moreover, the subsequent change of radial derivative of EH below the surface depends on the medium conductivity, whereas the refractive index accounts only for a second order modification of the eigen-frequency through the Descartes-Snell's law acting over a short distance compared to the atmospheric thickness of the cavity. This applies for the GCR layer and for the icy crust as well. Thus, if the ice may be considered as a lossless dielectric (σdc < 1 nS/m), the field amplitude profile may be extrapolated linearly below the surface of the Huygens landing site, down to a level where EH = 0. Using the experimental altitude profile plotted in Fig. 2 (left panel), this condition implies the presence of a highly conductive layer near 45 km under the surface, with an error margin of ±15 km if we consider the dispersion due to short time statistical fluctuations of field amplitude, as usually observed with terrestrial Schumann resonances.
A significantly higher conductivity would bend the profile upwards and would reduce the estimated depth accordingly. However, a high conductivity of the icy crust would result in mimicking the interface with a virtual liquid ocean lurked 45 ± 15 km under the surface. Most of the theoretical models consider a much thicker icy crust than the above estimate, and some authors postulate a significant conductivity due to the presence of ammonium sulfate compounds (Fortes et al., 2007). In that case, in addition to the primary damping of the trapped wave due to the ionospheric conductivity, the complementary absorption within the icy crust should reduce accordingly the Q factor of the resonance. This does not appear to be the case, because the ionospheric contribution alone accounts nicely for the value of the observed Q factor according to Eq. (4). Thus, a significant conductivity within the icy crust is not likely, though we cannot rule out the presence of ammonium sulfate grains and other impurities disseminated in the ice (Lunine and Stevenson, 1987). A subsequent moderate conductivity value, of the order of 1 nS/m or so, could mimic a shallower virtual ocean lying likely within the range of the error bars. However, as noted in a previous study (Grindrod et al., 2008), the amount of ammonium sulfate in the crust is limited and should not change the bulk properties of the crust, including electric properties.
Regarding the real value of the icy crust conductivity, we are reduced to making some hypotheses based on modeling considerations (Thompson and Squyres, 1990), laboratory-grown ice measurements (Lorenz, 1998) and comprehensive experience of people analyzing the ice-core samples from Greenland and Antarctic (Moore et al., 1994; Wolff et al., 1997). The Earth's sample measurements are not directly transposable to Titan conditions because of different nature of expected chemical inclusions. General features may be nevertheless considered. It appears that the ELF conductivity is essentially controlled by the acidity of the ice (Wolff et al., 1997). Most of the high values of acidity are due essentially to the presence of HNO3 and H2SO4 in association with volcanic activity (Moore et al., 1994), a pollution that can be excluded on Titan. Regarding anions, the most likely is ammonium in water solution which could be present in the form of liquid inclusions because H2O and ammoniac dihydrate (NH3, 2H2O) crystals are not miscible. However, measurements show that the ELF conductivity is not significantly affected by such inclusions (Moore et al., 1994), contrary to high frequency conductivity (Lorenz, 1998). The most abundant pollution material of Titan's icy crust comes from organic solid inclusions, seen at the surface (Zarnecki et al., 2005) and is thought to be bound on form of organic tholins (Khare et al., 1984). The Cassini remote sensing instruments have also shown that Titan's surface is mostly solid, with few lakes identified at high latitudes. The lakes are thought to be fed by precipitations of essentially methane and ethane, and smaller proportions of other hydrocarbons (Brown et al., 2008). Moreover, Huygens observations at low latitude reveal a “dirty” cohesive surface, with scattered ice pebbles (Tomasko et al., 2005; Zarnecki et al., 2005). Although such hydrocarbon components may affect the microwave losses over small thickness (Thompson and Squyres, 1990), the predicted ELF conductivity (0.5 nS/m) should not differ significantly from the surface value. Thus, we may reasonably consider the ice crust to be nearly a lossless dielectric, allowing us to retain the linear extrapolation of the field amplitude profile through it.
5 Discussion and conclusion
Regarding the buried conductive layer, most models (Tobie et al., 2005) are based upon the existence of a native liquid water-ammonia at Titan's surface after accretion (Lunine and Stevenson, 1987) that persists today beneath a superficial frozen crust (Grasset and Sotin, 1996). The presence of ammonia in the primordial ocean is suggested by the existence of nitrogen as a major constituent of Titan's atmosphere, presumably derived from the conversion of ammonia during the early stage of the moon evolution. It is well known that only few percent of a water ammonia-rich solution would raise the conductivity up to 5.5 μS/m, i.e., several orders of magnitude above that of pure water (Fig. 2). Such high conductivity offers the alone possibility for an excellent reflection boundary requisite to sustain the observed high quality factor of the resonating cavity (Fig. 1). Regardless of ELF wave measurements, other possibilities of revealing the existence of a subsurface ocean have been proposed. For example, it was anticipated (Tokano and Neubauer, 2002) that the exchange of angular momentum between the atmosphere and the icy crust may lead to a measurable non-synchronous rotation if an ocean is present. Such a non-synchronous rotation inferred from the apparent mislocation of geological features by the radar instrument has recently been revised to a lower value which is within the uncertainty of the pointing (Stiles et al., 2010). It does not mean that an ocean is not present, but that its presence does not provide large enough values of non-synchronicity as several other models have proposed (Karatekin et al., 2008; Sotin and Tobie, 2008). Other techniques involve gravity measurements (Rappaport et al., 2008), orbital characteristics (Bills and Nimmo, 2008), or magnetic field observations (Schubert et al., 2004). In spite of the numerous flyby opportunities during the nominal Cassini mission, none among these methods has been successful. It is expected that the additional flybys during the Cassini Solstice Mission (2010–2017) will provide the information necessary to prove the presence of an induced magnetic field and to determine the value of the periodic k2 Love number which strongly depends on the presence of an ocean. Future missions to Titan should carry the necessary instruments to study the Schumann resonance. In situ dc-ELF combined magnetic and electric field measurements should be performed either close to the surface, or better, by height-scanning throughout the atmosphere aboard a descent module. Such combined measurements should be considered as essential to seek for the eventual existence of a weak internal magnetic field.
One issue regarding the depth of the ocean is the size of impact craters. On Titan, the density of craters is small, which suggests that the surface is young (Lorenz et al., 2007). Most of the clearly identified craters have a diameter smaller than about 35 km (Wood et al., 2010). The largest impact discovered so far is Menrva crater, 450 km in diameter (Elachi et al., 2006). A crater of that dimension is believed to be older than 200 million years (Wood et al., 2010). It is not clear that this impact structure is a multi-ring impact basin similar to those observed on other icy satellites, such as the Asgard structure on Callisto (∼1700 km across). The initial topography created by an impact is subsequently relaxed, as predicted by models invoking a shallow depth for a viscous layer. The initial depth due to the excavation of material at the time of the impact is ∼5% of the radius, a value which has been deduced from studies of craters larger than 10 km on the Moon (Schenk, 1993). Applied to Menrva, it translates into an excavation depth less than 12 km. Such a depth is much lower than the smaller thickness of the icy crust derived from our study (∼30 km). Therefore, the constraints imposed by impact craters are still compatible with the presence of a liquid ocean 45 ± 15 km under the surface. It is also worth noting that very large impact structures have been observed on Callisto which is believed to have an internal ocean at a depth of less than 300 km (Zimmer et al., 2000). As a conclusion, our results are the first ones to unambiguously require the presence of a highly conductive interface buried a few tens of kilometers below the surface. Combined with theoretical models and compared with findings on Jovian icy satellites, our results yield the strongest evidence that such an interface is most likely the present-day melted limit of a primitive ammonia-rich ocean beneath a frozen crust 45 ± 15 km thick.
Acknowledgements
The authors acknowledge hundreds of people, from ESA-ESTEC and HASI Experimenter teams, who have been involved in the design, building, testing and interpretation of the experiment. We like to thank the Space Science Institute, Bern, Switzerland for hosting and supporting the members of Team No. 84 during three fruitful post-mission meetings. We gratefully appreciated the invaluable scientific discussions with Drs E. Karkoschka (LPL, Univ. Arizona, Tucson), C. Bertucci (IAFE, Univ. Buenos Aires) and W.S. Kurth (Dept. Astronomy, Univ. Iowa) which have allowed us to progress in the development of the present model. Thanks are extended to Dr C. Vigny, ENS, Paris, who provided us with spherical harmonic LSE2;0 color chart. Part of this work was carried out at the Jet Propulsion Laboratory-California Institute of Technology, under contract with the National Aeronautics and Space Administration, and at LPC2E, CNRS-University of Orléans and LATMOS-IPSL, CNRS-INSU-University of Versailles St Quentin, under contract with the Centre National d’Etudes Spatiales. Many thanks to Ken Lawrence for reviewing the English of the revised version. We are grateful to the two unknown reviewers who have provided very pertinent and professional recommendations that allowed us to improve significantly the quality of this article.