

1 Introduction
During the last few decades, the hydrodynamic analysis has greatly improved with the use of a particular numerical model. Overall, models depict the phenomena well on a grand scale and their results are reliable and usable. However, these results are not perfect and do not reproduce accurate results for time and place consistently, particularly on a small scale. For coastal areas, global patterns may be perturbed with bathymetry, coastal lines, tide, and wind impact, on a grand scale (Lamouroux, 2006; Millot, 1989, 1999). To improve the models, in situ data are collected during cruises or by moored sensors and compared with model output data to ensure data accuracy for the area. Often the comparison between in situ data and modelling data has been done by current, wind, or wave data (Petrenko, 2003), but few papers make this comparison with hydrologic data (Leredde et al., 2007). In this article, we present an adaptation of the 3D Symphonie model for the Strait of Bonifacio (SoB), and a one-year series of in situ measured temperature, with which the simulated temperature is compared.
2 Materials and methods
2.1 Strait of Bonifacio Réserve Naturelle des Bouches (RNBB) de Bonifacio localisation
The SoB is located in the northwestern area of the Mediterranean sea between the islands of Corsica and Sardinia, where the Liguro-Provencal and Tyrrhenian basins converge (between 8.8° E and 9.5° E and 41.3° N and 41.6° N, see Fig. 1). As narrow as 14 km, the SoB dwells on 80,000 ha and is dotted with many islands and islets.
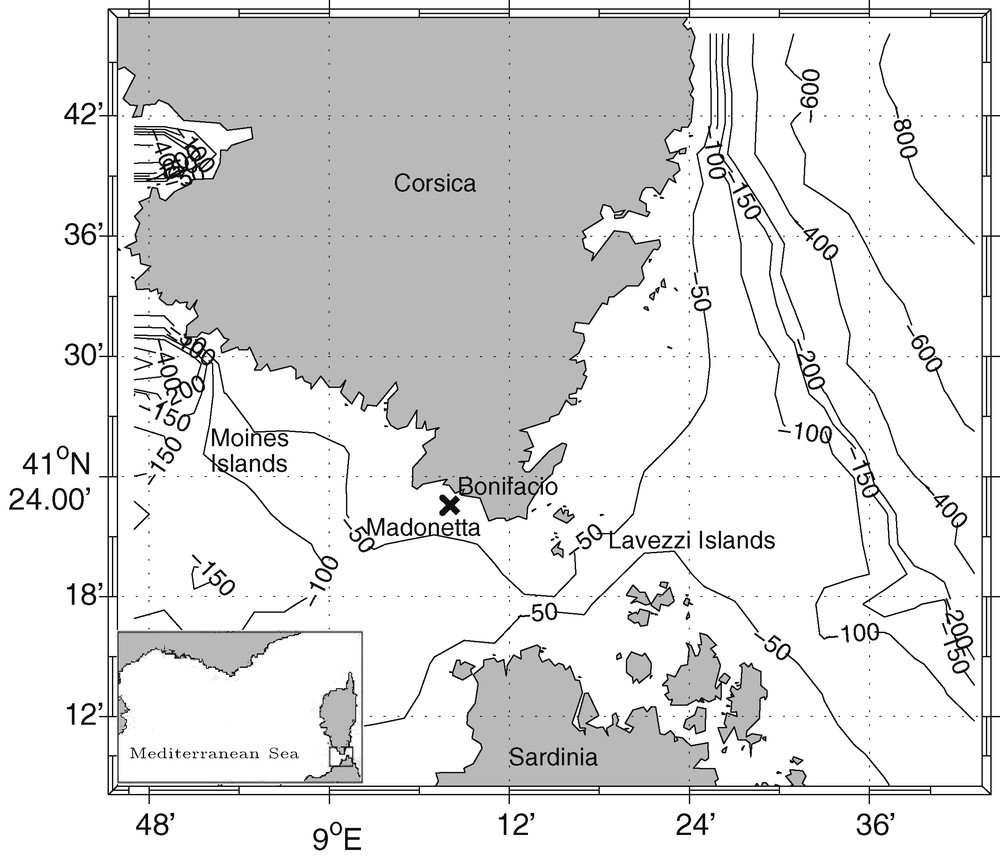
The strait of Bonifacio, between the islands of Corsica and Sardinia.
Bouches de Bonifacio, localisées entre la Corse et la Sardaigne.
The wind regime in this region is dominated by two main situations. First, a westerly wind (about 50 percent of the wind regime) blows between 260° and 300° and is present during all seasons, most of the time with speeds up to 8 m.s−1. The second situation in frequency (about 30 percent of wind regime) is an easterly wind, which blows between 60° and 100°, during winter, with speeds ranging from 5 to 8 m.s−1.
This area is considered as a sensitive zone and thus an international sea park (http://www.parcmarin.com/) was created in the SoB. The RNBB team has permitted an extensive temperature database to be developed, which we use in this article.
2.2 In situ temperature data: Réserve Naturelle des Bouches de Bonifacio temperature data
The set of temperature data used in this study was provided by RNBB. Four thermometers were installed at different depths (–11 m, –25 m, –35 m, –42 m) at Madonneta island (41° 23′ 07′′ N and 9° 08′ 07′′ E, see Fig. 1), at the localisation of the SoB, and the temperatures were recorded with a half-hour sampling frequency. At this location, the depth of the water column is 45 m. Those thermometers are ThermoTidbit (ST Pro sensors) with 0.05 °C resolution, 0.2 °C precision, and –5 °C range at 35 °C.
2.3 The Symphonie 3D model
The primitive equation model of Symphonie (http://sirocco.omp.obs-mip.fr) for ocean circulation was used. A description of the model is given in Marsaleix et al. (2008) and Ulses et al. (2008). The atmospheric forcing was provided by 3 h averaged outputs from the weather forecast model Aladin (Leredde et al., 2007). The three components of current, surface elevation, temperature and salinity are computed on a C grid, using classical finite difference methods (Leredde et al., 2007). This model was adapted to the SoB, with a resolution of 500 m. To recover the temperature modelling data, a point as close as possible to the real location of in situ RNBB temperature records was selected in the model grid, and the simulated temperature was recovered at the four corresponding depths of the RNBB series during the entire year of 2005.
3 Results: a comparison of a one-year series between in situ (RNBB) and modelling data
In Table 1, the two sets of temperature data (RNBB and model) were compared by their monthly averages, which were based on 24-hour daily averages. When all the depths are considered, the temperature values ranged from 12.33 °C to 22.56 °C for the RNBB data, and 12.69 °C and 21.13 °C for the model data. The two monthly minima were close; they were checked at the deepest level (42 m), but not during the same months (respectively, March and April). Between the two distributions, a difference (1.43 °C) exists for the maxima values, which were checked during the same month (September), and in situ temperatures were higher than the model ones. For the three first depths, the RNBB annual averages were slightly higher than in simulated data, but conversely, they were lower for the 42 m layer. However, the statistical treatment presented above masked the larger differences that exhibited dynamics during the year.
Moyenne mensuelle des températures de l’année 2005 pour les données Réserve Naturelle des Bouches de Bonifacio et celles du modèle.
| RNBB | Model | |||||||
| 11 m | 25 m | 35 m | 42 m | 11.15 m | 24.52 m | 35.67 m | 42.36 m | |
| 01/05 | 13.77 | 13.69 | 13.81 | 13.60 | 15.34 | 15.31 | 15.26 | 15.20 |
| 02/05 | 12.66 | 12.59 | 12.71 | 12.49 | 13.85 | 13.84 | 13.83 | 13.80 |
| 03/05 | 12.71 | 12.56 | 12.61 | 12.33 | 13.13 | 13.04 | 12.98 | 12.95 |
| 04/05 | 13.73 | 13.56 | 13.60 | 13.35 | 13.19 | 12.86 | 12.74 | 12.69 |
| 05/05 | 16.20 | 15.39 | 14.66 | 14.18 | 13.73 | 13.13 | 13.01 | 13.02 |
| 06/05 | 19.04 | 17.14 | 15.34 | 14.57 | 15.44 | 14.42 | 14.01 | 14.02 |
| 07/05 | 21.79 | 19.98 | 17.10 | 15.77 | 17.05 | 15.77 | 15.11 | 14.85 |
| 08/05 | 21.82 | 20.56 | 17.91 | 16.17 | 18.85 | 17.21 | 16.30 | 15.84 |
| 09/05 | 22.56 | 20.73 | 17.12 | 15.68 | 21.13 | 19.04 | 17.11 | 16.13 |
| 10/05 | 20.41 | 19.79 | 17.73 | 16.41 | 20.95 | 19.82 | 17.84 | 16.41 |
| 11/05 | 18.57 | 18.31 | 17.61 | 17.06 | 19.16 | 18.77 | 17.84 | 16.94 |
| 12/05 | 14.51 | 14.51 | 14.54 | 14.47 | 16.63 | 16.60 | 16.54 | 16.47 |
| min | 12.66 | 12.56 | 12.61 | 12.33 | 13.13 | 12.86 | 12.74 | 12.69 |
| max | 22.56 | 20.73 | 17.91 | 17.06 | 21.13 | 19.82 | 17.84 | 16.94 |
| mean | 17.31 | 16.57 | 15.39 | 14.67 | 16.54 | 15.82 | 15.21 | 14.86 |
It is during winter and early spring that the temperatures, homogenous in the water column, were colder. These temperatures were higher for the model data than for RNBB data.
Contrarily, during the warm months with a stratified water column, monthly average in situ temperatures from the RNBB series were higher than the simulated ones.
The spring and autumn values were included between the summer and winter values. They slightly decreased with depth showing a start or an end to stratification.
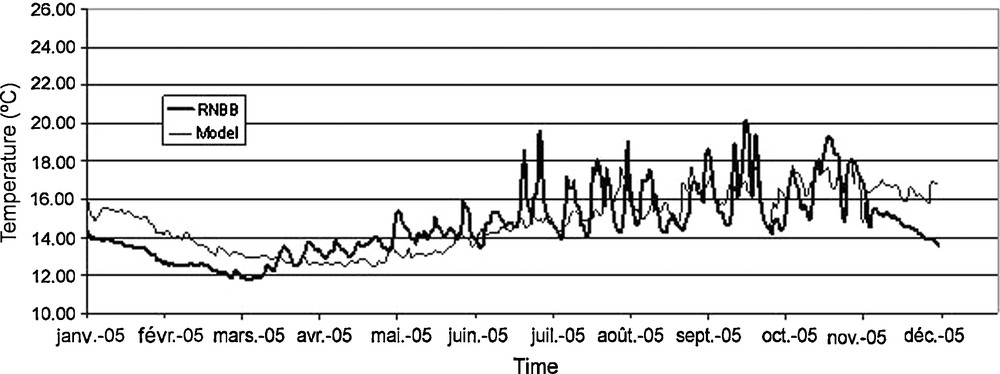
To show the differences, the RNBB and model average daily temperatures were time-plotted for two depths (–11 m and –42 m), Figs 2 and 3 respectively. As expected, the seawater temperatures showed more amplified variations during the summer than during the winter. Usually, they are likely to be synchronous in both in situ and model series; however, from May to September, they were smothered and lower in the model data than in RNBB temperature data. Conversely, the model values of the two selected depths (the two others, not presented here, provided the same results), were elevated more than the in situ data during the winter. Two six-month clusters of the year (from January through May, plus December, and from June to November) showed a significant bilateral difference between the two sets of data at the P 0.01 level in almost all cases. The only exception was during the summer for the –42 m group, when the difference is significant only at the P 0.1 level (where p is the probability of risk for rejecting the null hypothesis, Ho).
The overestimation of simulated data, as compared to in situ temperatures, regularly decreased from January to April and regularly increased (but at a lesser rate) from September to December for all depths studied. In the summer, if the underestimation of seawater temperatures provided by the model was clear, the in situ recorded temperature discrepancies were not as clear, due to high thermal variability levels. However, the difference between the two data sets decreased with depth. Despite these differences, inside each “cold” and “warm” month group, the relationships were highly significant (at P 0.001 level; respectively n = 180 and n = 183) between simulated and in situ RNBB seawater temperature data (Table 2). This was verified for all the depths studied.
Tableau de corrélation entre les données in situ et le modèle pour toutes les profondeurs, pour les deux groupes été et hiver.
| R | ||
| Depth | Winter | Summer |
| 11 | 0.29 | 0.44 |
| 25 | 0.29 | 0.38 |
| 35 | 0.42 | 0.46 |
| 42 | 0.52 | 0.53 |
4 Discussion
The two data set values (simulated and in situ) correspond to those typically encountered in the northwestern coastal water areas of the Mediterranean Sea, in terms of extreme values, amplitude of variations, and seasonal cycles (Ivanoff, 1972). In winter, the seawater temperatures do not fall below 12 °C, which is a standard characteristic of the Mediterranean sea (Travers and Travers, 1972). Summer monthly averages for the simulated data do not exceed 22 to 23 °C, which is also a standard characteristic of northwestern Mediterranean temperatures. However, it is possible to obtain warmer values (24 to 27 °C in surface layer) for simulated and in situ data, but these values correspond with the local effect, which dramatically decreases with increasing depth. The simulated temperature data may be considered as an accurate representation for the range of variations in this local system, as well as its dynamic on annual and monthly time scales.
Nevertheless, the overestimation during winter on the one hand and underestimation during summer on the other by the simulated data, as compared to in situ records, needs to be explained. To our knowledge, such a comparison with hourly frequencies during an entire year does not exist in literature.
During the summer, the differences may be partly explained by the rapid in situ temperature changes, which are probably smoothed by the model. By using the same underwater thermometers at five locations in the northwestern area of the Mediterranean, Bensoussan et al. (2010) also reported these frequent changes elsewhere during the warm months and under the bi-layer summer situation. This hypothesis appears to be formulated from the facts that the monthly averages are close for the two data sets and the difference is weaker for the 42 m-depth layer than at the 11 m one.
During the cold months, the divergence is not as easy to explain. First, the seawater temperature is stable, as attested by the good concordance between the two data set evolutions (Figs. 2 and 3). Next, the in situ temperatures that were recorded and reported here are clearly closer not only because it is classically considered as a norm for the northwestern area of the Mediterranean (Ivanoff, 1972), but also because they were measured elsewhere in this part of the Mediterranean using the same instruments and recording strategies. We note that the differences between the two data sets progressively decrease from winter to spring, as the bi-layer situation tends to be installed when thermocline formation begins. In parallel, the difference progressively increases from September to December with the disappearance of the bi-layer system.

Daily temperature averages recorded by the Réserve Naturelle des Bouches de Bonifacio and model during 2005 to a depth of –11 m.
Moyenne journalière des températures enregistrées par la Réserve Naturelle des Bouches de Bonifacio et le modèle au cours de l’année 2005 à –11 m de profondeur.
Daily temperature averages recorded by the Réserve Naturelle des Bouches de Bonifacio and model during 2005 to a depth of –42 m.
Moyenne journalière des températures enregistrées par la Réserve Naturelle des Bouches de Bonifacio et le modèle au cours de l’année 2005 à –42 m de profondeur.
If we consider the in situ data to be accurate, then five reasons for the discrepancies between the model and observations can be identified:
- • the calibration for the deep penetration of solar radiation or other optical parameterisation may possibly be wrong;
- • a more global effect on the rest of the Mediterranean basin may be imposed locally by forcing the boundary conditions and advection by currents;
- • the atmospheric data (particularly wind) or model integration may be imprecise;
- • the accuracy meshes (500 m) may not faithfully reproduce the coastline sufficiently;
- • there may be an absence of modelled phenomenon, such as the tide, the river, stream.
The discrepancies between the model and the observations (underestimation during the summer and overestimation during the winter) can explain why some biological phenomenon is not taken into account for the optical parameterisation (turbidity increases due to the presence of phytoplankton).
Concerning the local effect on the hypothesis, the only resolution to this problem is to test the model in other areas, which may be a future study.
Regarding the wind data, it is necessary to compare the Aladin results with the local data more thoroughly; for example, with the semaphore Pertusato data (9°E 11′ and 41°N 22′). Moreover, the presence of great cliffs, near the in situ data point may make an impact; however, it is difficult to quantify this.
One difficulty in conducting this study is the use of a 500 m mesh, which does not faithfully reproduce the coastline. For this comparison, the measurement point was located along the coast and the mesh point chosen for comparison in the model was a few hundred meters. Since the temperatures are relatively uniform in this area (with local variations of up to 1 °C, Gerigny, 2010) this difference in distance does not influence the comparison between the two data sets. However, this would not have been the case if the comparison had been made on current data (coastal areas are known for their high temporal variability-term space, Astraldi et al., 1999) Nonetheless, when the sensor is near the coast, it will translate the up-welling and down-welling phenomenon (temperature variation) extremely well, and the phenomenon will be reduced by the model because of the mesh size. To verify this hypothesis, the best way is to use a more accurate mesh, but the computational time will increase rapidly.
When some phenomenon is absent, such as the tide or river, it is possible that the discrepancies between the model and observations will result. However, a study has showed that the tide was a weak effect (almost zero) on the current (Gerigny et al., 2010) and the fact that Symphonie does not take the presence of very small streams into account may explain this difference.
In summary, the source of error causing the discrepancies between the model and observations could be due to the current dynamics or the atmospheric forcing (optical parameterisation and the modelling errors). In all cases, it is difficult to find the discrepancy origins only using our data to determine the current or forcing impact.
5 Conclusion and prospects
The aim of this study was to apply the Symphonie model to the SoB and compare the simulated data to in situ seawater temperature records, in order to complete the environmental information on this sensible marine area for the past, when in situ temperatures were not available. During this study, and only based on one year and one point, the results were contradictory. On an annual time scale, the model accurately represents the seasonal dynamics of seawater temperatures and average values, constituting a very useful tool when in situ data is lacking. During the winter, further studies or some corrective equations may probably reduce overestimation resulting from simulated data. The average summer monthly difference (2 °C) between simulated and in situ data can be considered as weak in absolute terms.
For modellers, we can say that temperature comparisons at this specific point provides reasonably good results, such as for seasonal tendencies, but for an environmental manager, the temperature gap between in situ and modelling data is still too elevated. In fact, this difference may be as high as 2 °C and the probable consequences for species, particularly during extreme temperatures will probably be difficult to detect using the Symphonie model presented in this paper. One example of this is the heat waves that occurred in 1999, 2003, or 2006, which caused massive mortalities in various coastal marine species (Lejeusne et al., 2010). However, the ability to detect these differences will be verified by applications on other sites and for different periods. To determine why these discrepancies exist, it is necessary to test in situ data and simulated data at another location. It is the project of a future study to initiate the Symphonie model at other local coastal areas.
Acknowledgements
The authors warmly thank the Reserve Naturelle des Bouches de Bonifacio, the Office de l’Environnement de la Corse, and Dr J.M. Culioli for supplying the in situ temperature records. We also thank the SIROCCO group, who developed the Symphonie ocean model. Sources are available at http://sirocco.omp.obs-mip.fr/outils/Symphonie/Sources/SymphonieSource.htm.