

1 Introduction
The basic principles of analysis of stress fields acting in the certain volumes of the Earth's crust were formulated by M.V. Gzovsky (Gzovsky, 1954, 1975). He was one of the first geologists who started systematic studies of present and ancient tectonic stresses and suggested their reconstruction using a method based on identification of shear conjugate pairs of fractures. This principle is the basis of a large group of methods (Nikolaev, 1977; Sim, 1991). A second group of methods analyzes tectonic dislocation vectors on slickensides (Angelier, 1975; Goustchenko, 1973, 1979; Rebetsky, 1999, 2000). Rebetsky called the first group ‘methods of structural analysis’, and the second one ‘methods of dislocation analysis’ (Rebetsky, 2000). Planes with striations, traces of dislocations (slip planes) can be of any age and origin. Sliding over them can occur when they are in a favorable orientation with respect to the superimposed stress field. Most of the acting planes in the case of a triaxial stress-state (σ1≠σ2≠σ3) must be close to the planes of maximal shear stress τ2 (τmax). In case of a uniaxial stress-state (μσ = –1 or +1), such planes diverge cone-like from the axes of the σ1–minimal or the σ3–maximal compressive stress.
Identification of local paleostress-states by stereograms of in situ measurements of dislocation vectors on slip plane frames using a cinematic method makes possible qualitative analysis of the stress-state type, which is defined by the Lode-Nadai coefficient, μσ. Analysis reveals certain cases when the distribution of the planes does not correspond to the model predictions. Moreover, a significant scatter in orientation of the local principal normal stress axes is found within the regions under study. This observation leads to formulation of two problems to study:
- • searching for an explanation of the inconsistency found when examining the data on the geological structure of massifs under a stress-strain state, and;
- • elaboration of a formalized approach for the identification of stress field ranks.
2 Results
In a stress tensor under triaxial loading (σ1≠σ2≠σ3), the difference of absolute values of the principal normal stresses σ1 and σ3 gives the maximal shear stresses τmax or τ2; the difference of absolute values of (σ1–σ2) and (σ2–σ3) gives the shear stresses τ3 and τ1, which are smaller than τmax. In real media, because of heterogeneity, there are cases when the last stress field activates planes which are close to the orientation of the τ1 or τ3 planes. Formation of shear planes bearing dislocation traces close to the orientation of τmax plays either a secondary role, or only one system of shearing is formed, or such planes do not occur at all.
According to the graphic method based on the calculation of the τn shear stress orientation, on arbitrary oriented planes of “n” vectors in the case of uniaxial stress, vectors coincide with the arch of the cyclographic projection, diverging from σ1 (Fig. 1g, h) and σ3 axes (Fig. 1c, d, i, j). In the case of triaxial stress in the given stress field, most dislocation vectors have to be within a sharp angle enclosed by a pair of arch systems, diverging from the σ1 and σ3 axes (Fig. 1f).
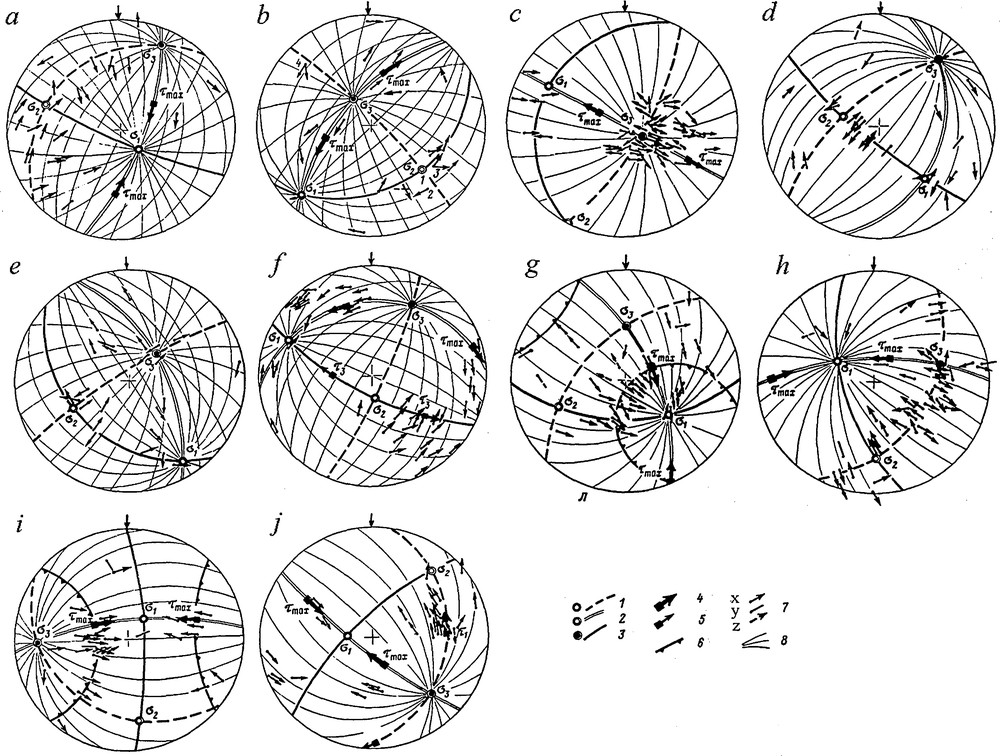
The Realizations of slickensides planes in different natural rock massifs (Wulff stereonet, lower hemisphere). 1–3: axes of normal principal stresses and slip planes: 1: σ1 (tension), 2: σ2, 3: σ3 (compression); 4, 5: poles of planes of maximal shear stress τ2 (4) and τ1,3 (5); 6: conic surfaces which axes are coincided with axes σ1 and σ3; 7: slip vectors on weak surfaces (x–confident, y–uncertain signs; z–contradictory to stress field); 8: systems of cyclographic projection which are divergent from axes σ1 and σ3. Stereograms locations: b–Polar-Ural, е–Baikal rift, d–Kazakhstan, other–Sub-Polar Ural.
Analyse de miroirs de faille dans différents massifs rocheux naturels (diagramme stéréographique de Wulff, hémisphère inférieur). 1–3 : axes de contrainte principale perpendiculaires et plans actifs : 1 : σ1 (tension), 2 : σ2, 3 : σ3 (compression) ; 4, 5 : pôles des plans de contrainte maximale de cisaillement τ2(4) et τ1,3 (5) ; 6 : surfaces coniques dont les axes coïncident avec les axes σ1 et σ3 ; vecteurs de déplacement sur des surfaces fragiles (x–signe de confiance, y–signe d’incertitude, z–contradiction par rapport au champ de contrainte) ; 8 : systèmes de projection cyclographique qui sont divergents par rapport aux axes σ1 u σ3. Localisation des stéréogrammes : b = Oural polaire, e = rift du Baïkal, d = Kazakhstan, autres–Oural sub-polaire.
From Fig. 1a, b, e, it follows that most of the dislocation vectors coincide with the cyclographic projection, diverging from the σ1 and σ3 axes, and less than 1/3 are located within the sharp angle between the arches. On the stereogram Fig. 1a, most vectors in the reconstructed stress-state give evidence for a uniaxial stress-state (9 dislocation vectors correspond to steep tension, 7 to sub-meridional gentle angle of compression). In the sharp angle sector between the arches of great circles there are fewer vectors; at the same time, they do not contradict to the principal normal stress axes. We call such a special type of stress-state the ‘Variation of Stress-State Type’ (VSST). It is characterized by the presence of dislocation vectors generated both under uniaxial compression and uniaxial tension in the same volume of rocks, i.e. the μσ coefficient (μσ = 1–2R), varies from +1 to–1 (see Fig. 2). To the local VSST stress-state are ascribed the points in which dislocation vectors generated under triaxial stresses are less than 1/4 of all measurements. Korchemagin et al. (2005) calls such a type of stress-state the “maximal dispersion of the Lode-Nadai coefficient”.
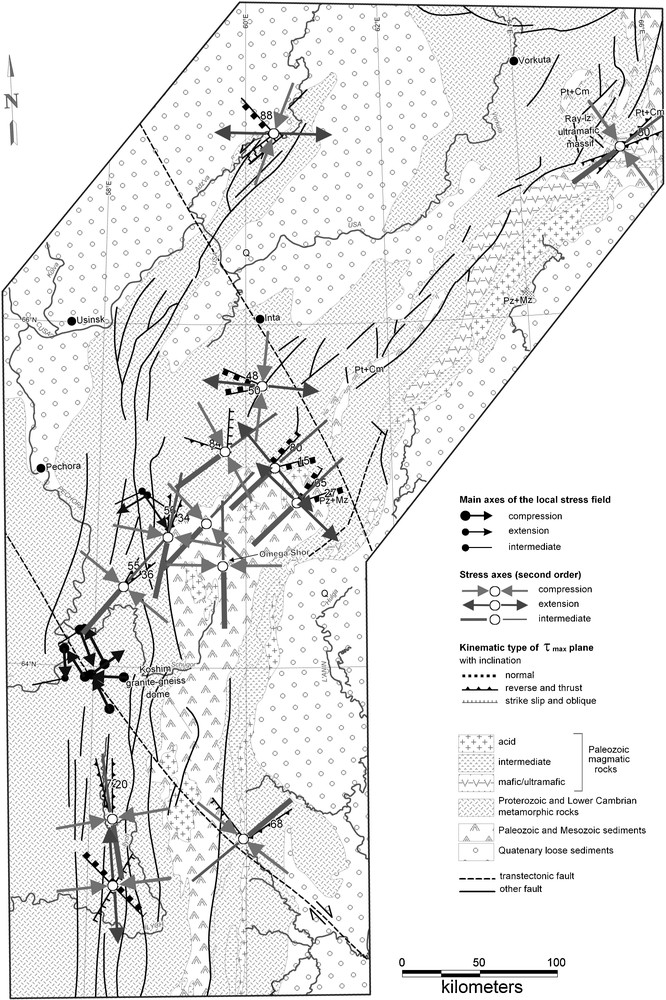
Sketch map of the northern-, the subpolar- and polar-Ural (from Sim, 2000, with changes).
Carte schématique de l’Oural septentrional, sub-polaire et polaire (d’après Sim, 2000, modifié).
Phenomena of distribution of planes bearing striation lines were found in situations close to the uniaxial compression (Fig. 1d, i, j) and uniaxial tension (Fig. 1g, h). If compression and tension axes are assumed to be cone axes, with apex angle equal to 90°, then, under a uniaxial stress-state, plane poles of acting shear stresses will be at the cone traces or close to them (within the given accuracy of reconstruction of axis positions). Stereograms in Fig. 1g, i show the tendency of grouping of the planes with dislocations near conic surfaces around the σ1 and the σ3 axes. The other traces of dislocations are formed, probably, over pre-existing weak planes in the volume.
In Fig. 1c, the slip planes are grouped near the compression axis. These are foliation planes. Usually they show a certain scatter in orientation and direction of dislocation over them. Although the foliation is sub-normal to the reconstructed compression axis, dislocations occur over it, regardless of theoretical restrictions. This can possibly be explained by low friction on foliation planes making tectonic dislocations easier, which is conditioned by an assemblage of phyllosilicate minerals on them. The given example, together with the VSST, requires detailed analysis.
A major part of local strain-stress stereograms on Fig. 1 are related to the Polar Urals; the geological scheme and different scale tectonic stresses are shown in Fig. 2.
The stereogram in Fig. 1c is composed of traces of tectonic dislocations observed in Proterozoic metamorphic rocks in the Koshim granite-gneiss dome core in the Sub-Polar Urals. Foliation planes were formed, most probably during the Baikalian orogeny and were reactivated afterwards, during the Hercynian epoch. In the Late Hercynian epoch, when magmatic activity in the anticline core ceased, the Sub-Polar Ural quartz-bearing province was formed (Karyakin and Smirnova, 1967).
The Late Hercynian age of the quartz-crystal veins is defined based on the absolute age of minerals in the veins (Bukanov, 1974). In certain cases, traces of dislocations over planes parallel to the foliation and cutting crystals of quartz in the veins were observed. Orientation of dislocations over planes cutting the crystals coincides with orientation of foliation planes of the rocks, which host these veins. That is why we assume that the latest dislocation traces were measured over ancient planes. Taking into account their sub-parallel position to the compression axis, dislocations over them is possible only in the state of triaxial tension, when an opening of planes normal to compression axis is minimal. Existence of such a situation is proved by the occurrence of many Late Hercynian thick quartz veins in the core of the Lyapin anticline in the quartz-bearing province. The VSST cases were found within this province at the intersection of feeding channel faults with ore controlling faults. The VSST can reflect a pulsing regime of dislocations along faults, which assists in the migration of hydrothermal fluids and formation of quartz-crystal veins. Effect of such an influx of hydrothermal fluids under the VSST conditions can be compared with sharp increment of oil and water debits (for example, during the Dagestan earthquake in 1970) (Sadovsky, 1989). One can assume that formation of quartz veins occurred also during palaeoearthquakes.
Based on geological structure, episodes of vein formation and ore deposition were recognized in the Sub-Polar Urals (Karyakin and Smirnova, 1967). Poles of quartz veins, shown in Fig. 3A (empty triangles) and veins with quartz nests (black triangles), were measured in the Omega-Shor block. The tension axis (empty circles) and pressure axis (black circles) of local stress-states shown in Fig. 3B were measured in the same block. It is clear that veins with rock quartz (nest stage) and local tension are located in the cone with vertex angle 45°. The rest of veins originated at an earlier vein stage. This part of the Lyapin anticline is characterized by numerous accumulations of quartz; several quartz veins of different orientation are found there. Most of the determinations of local uniaxial stress-state are reconstructed in the Koshim granite-gneiss dome and Omega-Shor block.
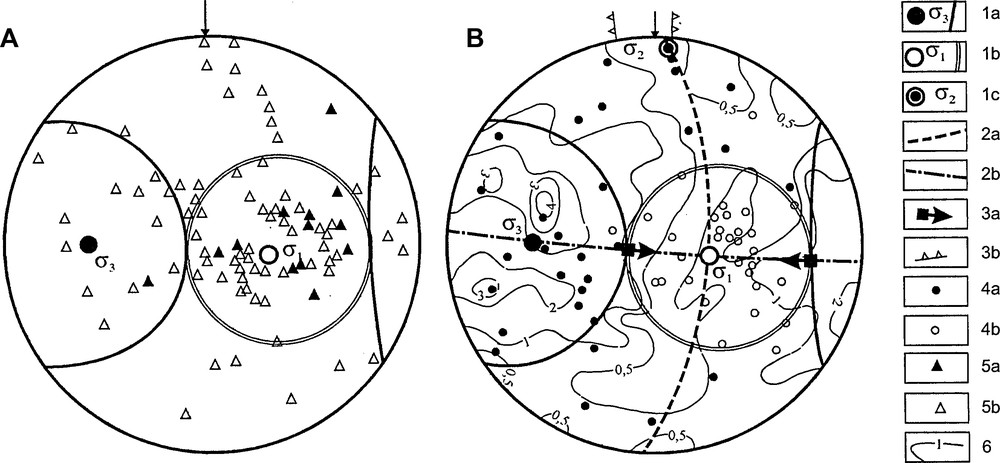
The determination of general stress field based on data of stress-states for local volumes (Omega-Shor block) Wulff's stereonet, upper hemisphere. 1–Axes: σ3–maximal, slip plane and compression cone of general stress field (a), σ1–minimal and tension cone of general stress field (b), σ2–inter-median (c) stress of general field, 2–Axes of principal normal stress-states of local rank: а–compression, b–extension; 3–Poles of plains of shear stress action τ2 (τmax) (a) and kinematic type is reversed fault (b) of general field. 4–Poles of quartz vein with quartz nests (a) and empty quartz vein (b). 5- Isolines of density of all poles of slip planes. A- Poles of quartz vein with quartz nests and empty quartz vein. B- Axes of principal normal stress-states of local rank. Wulff's stereonet, upper hemisphere.
Détermination du champ général de contrainte, basée sur les données d’états de contrainte pour des volumes locaux (bloc Omega-Shor). Diagramme stéréographique de Wulff, hémisphère supérieur. 1 - Axes : σ3 - plan de glissement maximal et cône de compression du champ général de contrainte (a) ; σ3–plan de glissement minimal et cône de tension du champ général de contrainte (b), σ2 -contrainte intermédiaire (c) du champ général de contrainte, 2–Axes des principaux états de contraintes perpendiculaires, de type local : a–compression ; b–extension ; 3–Pôles de plans de cisaillement actifs τ2 (τ max) (a) et faille inverse de type cinématique (b) du champ général ; 4–Pôles de veines de quartz, avec (a) et sans (b) cristaux de quartz ; 5–Isolignes de densité de tous les pôles de plans de glissement. A–Pôles de veines de quartz avec ou sans cristaux. B–Axes des principaux états de contraintes perpendiculaires, de type local. Diagramme stéréographique de Wulff, hémisphère supérieur.
In principle, using the VSST, it can be assumed that slickensides also correspond to two stages of deformation, but because tectonophysical features of nest type were observed only at quartz-crystal deposits, to extend this deformation type for the entire Sub-Polar Urals is not a correct procedure. The possibility that dislocation vectors in Fig. 1a have different ages and belong to different deformation stresses is negligible. In some cases, in quartz veins enclosing quartz-crystal nests, reconstructed uniaxial tension local stress-states have the maximal deviatoric tension axis in accordance with the deviatoric tension axis in the quartz-crystal nest. Based on the above discussion, we assume that the low-rank tectonic stresses characterizing the VSST developed during the Late Hercynian deformation epoch. It was first found in the Sub-Polar Ural quartz-bearing province and is strictly related to the quartz-crystal nests (Sim et al., 1983). Later the VSST was confirmed in Donbass in the Nikitovskaya shafts of ore field. There is gold mineralization in the same region and the maximum of the μσ value dispersion is accepted as one of the favorable tectonophysical conditions for gold mineralization (Korchemagin et al., 2005). Such a stress-state type is proposed to be used as a tectonophysical criterion identifying places where hydrothermal and hydrothermal-metasomatic mineral deposits are localized. Based on their VSST, two sets of quartz veins were recommended for prospecting as a result of this work.
The relative concentration of plane poles with slickenlines close to the planes normal to the maximal compression axis (Fig. 1d) and maximal deviatoric tension axis (Fig. 1h) indicates that dislocations occur over planes sub-parallel to the σ3 and σ1 axis. When there is uniaxial tension, as on stereogram Fig. 1h, such a distribution can be explained by the fact that under tension the slightest opening induces cracks, parallel to the tension axis–over them traces of dislocation were fixed. It does not mean that no dislocation occurred over other planes, but striation lines could not develop due to the opening inducing low friction between crack borders.
The same distribution of slip planes under uniaxial compression cannot be explained in the same manner. Usually Gopher's rule was used for identification of striae direction: a friction of fingers during sliding on slickenside surface without mineralization is less in the direction of the movement of the opposite block. In this case, we can assume that measurements were held in rocks in which the direction of dislocation has to be defined, not following Gopher's rule, but the opposite, i.e. the maximal compression axis has to be the maximal tension axis. Such a definition of dislocation directions has been discussed in the literature (Gromin, 1970). This situation requires additional studies using microscopy of the microform formation mechanism over sliding plane and determines if there are stylolites, or instead, growth minerals.
The distribution of dislocation vectors in Fig. 1b, f, g, i is concentrated near poles of the τ2 planes. Here, the main maximum of slip planes in Fig. 1f is located near the τ3 pole, and the most pronounced maximum in Fig. 1j is associated with the τ1 pole. The examples given show that in heterogeneous media in the last stress field when rock deformation pre-exists, heterogeneities are often used, rather than generating fresh pairs of shear planes having (45°-α) angle toward the compression axis. If, for the reconstruction of compression and tension axis along the shear pairs, we use maximums of planes concentrated in Fig. 1f near the τ3 pole and one of the maximums near the τ2 pole, the reconstructed local stress-state will be wrong. In old heterogeneous rock massifs, shear planes with tectonic dislocation in a young stress field require special attention as in areas of high shear stresses. They can constitute weak zones in case of technological activities. Such examples are important both from methodological and practical points of view.
3 Identification of stress field ranks
The principle of local stress orientation variation in the fault vicinities, under shear deformation over it, makes the basis for ranking the tectonic stresses. This variability was found through optical and mathematical modeling (Osokina, 1987, 1997). According to this data, in the shear fault vicinities, orientation of local stress axis varies in the 45° range relative to stress axis causing shear dislocation. Let us relate all axes of local stresses around the fault to the II rank and stress axis causing shear dislocation to the I rank. Plotted on the same stereogram, compression and tension axes of the II rank can be enclosed by compression and tension cones having the 90° apex. Within the compression cone, tension axes are forbidden, whereas within the tension cone, compression axes are forbidden. Axes of two cones will give the I rank compression, and tension axes, correspondingly, will cause shear dislocation. If within the studied volume several faults of different ranks are present, the description of local σ1 and σ3 axes according to the given requirements will be impossible. Fig. 3 outlines the general stress field based on local stress-states in certain observation points within the Omega-Shor block, which was identified in the Sub-Polar Urals based on structural features. This part of the Lyapin anticline is characterized by numerous accumulations of quartz; several quartz veins of different orientation are found there. Most of the determinations of local uniaxial stress-state are reconstructed in Koshim granite-gneiss dome and Omega-Shor block. We should note that the local scale compression axis composes a belt along the slip plane of general compression stress field demonstrating different orientation, and tension axis are concentrated in the tension cone, which indicates that the block is in the state close to the uniaxial tension.
Isolines in Fig. 3B show the density of all slickenplanes over which local stresses in the block are reconstructed. It is clear that the maximal concentration countered by 4% isoline is close to the pressure axis. These are foliation planes discussed on local stereogram Fig. 1c.
4 Conclusions
In geological media, because of heterogeneity, deviations from classic models of deformation processes are possible. Peculiarities of distribution of planes showing traces of tectonic dislocations in local volumes depend on the stress-state type (μσ coefficient). Analysis of the stress-state type makes it possible to identify its special type, called variation (VSST). The initial heterogeneity of rocks (presence of an ancient crack system, sedimentation planes, foliation planes, etc.) is favorable for striation line occurrence over planes which are distinct from the local stress-state planes, if the friction over planes which are distinct from them is small. When deformation of ancient rocks in latest tectonic stress fields, pre-existing in rock massifs, heterogeneity planes of different origin and age are used rather than the creation of fresh shear planes. Criteria to identify ranks of tectonic stresses based on model of tectonic stress distribution near faults are suggested. Reconstruction of multi-scale tectonic stresses is used to solve problems: methodological–the role of heterogeneities on occurrence of shear planes in the over-imposed stress field; and practical–tectonophysical criterion of hydrothermal deposits origin.