

1 Introduction
The studied area is the north-western pericline of the Greater Caucasus (GC) which developed between the Scythian platform to the north and the Black Sea-Transcaucasian Massif to the south (Fig. 1). The Paleozoic-to-Jurassic succession displays southwest-vergent folds and thrusts and forms the core of belt. The southern flank of the north-western belt consists of Cretaceous and Paleogene deposits folded and thrusted in a same way while the same deposits of the northern flank comprise northeast-vergent structures. These prominent NW-SE structures developed in a major Late Eocene episode of shortening (Beliaevsky et al., 1961; Giorgobiani and Zakaraya, 1989; Grigor’yants et al., 1967; Khain, 1975, 1994; Lozar and Polino, 1997; Mikhailov et al., 1999; Milanovsky & Khain, 1963; Milanovsky et al., 1984; Muratov et al., 1984; Nikishin et al., 1998a; Nikishin et al., 1998b; Nikishin et al., 2001; Robinson, 1997; Robinson et al., 1996; Shardanov and Peklo, 1959). However, some authors assume that the episode of main deformation occurred in Miocene times (Dotduyev, 1987; Kopp, 1991; Kopp and Shcherba, 1998; Shcherba, 1987, 1989, 1993; Zonenshain et al., 1990). This assumption is based on the conspicuous large influx of orogeny-derived sediments in troughs surrounding the belt during the Neogene-Quaternary times although the underlying Oligocene deposits in the same basins also derived from the belt (Lozar and Polino, 1997). It is herein argued that the fold-and-thrust belt development is Late Eocene in age and that, in addition, a severe uplift of the NW-GC occurred in Miocene times (which might have been the consequence of another pulse of shortening; see discussion in Saintot et al., 2006).
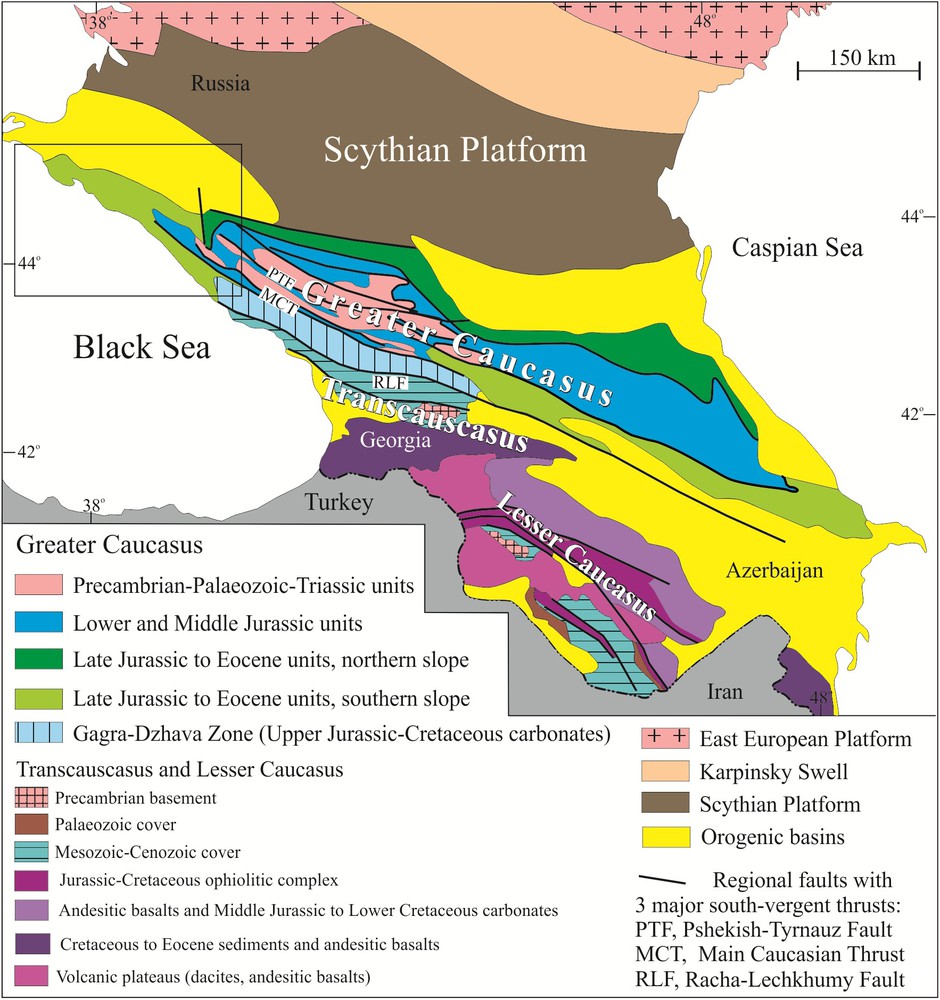
Simplified geological map of the Greater Caucasus and surroundings (after Belusov et al., 1988; Milanovsky & Khain, 1963). The frame depicts the palaeostress study area as on Figs. 5 and 6. .
Carte géologique simplifiée du Grand Caucase et des régions avoisinantes (d’après Belusov et al., 1988 ; Milanovsky & Khain, 1963). Le rectangle indique la zone étudiée des Fig. 5 et 6.
Two independent groups of researchers used the same field structural dataset in order to determine paleostress regimes in the NW-GC and to investigate therefore the conditions of deformation along the belt. They however interpreted their results based on different geological models of the studied area. The results were independently published by Russian researchers (Marinin, 2001, 2003; Marinin and Rastsvetaev, 2008; Rastsvetaev et al., 1999) and by French researchers (Saintot, 2000; Saintot and Angelier, 2002). The dataset consists of kinematic indicators, classically including fault slips, tension gashes, shear fractures, stytolithic peaks and dykes.
2 Methods
The Russian group's method (“structurno-parageneticheskii” method in Russian) uses the “structural geometrical patterns” of paragenetic brittle structures that developed under a single stress-strain state in a given rock volume (Rastsvetaev, 1987). They distinguish three main categories of kinematic indicators: (1) tensional fractures (tension gashes, dykes); (2) compressional fractures (stytolithic peaks/pressure dissolution seams); (3) shear fractures (shear joints, strike-slip faults, thrusts and normal faults). Indicators of the first category allow to obtain the position of σ3 axis, the ones of the second category specify the position of σ1 axis. The principle of a paragenetic method is to reveal the characteristics of a micro-fault population that ensues from a certain type of stress condition. The latter characterizes a synchronous geological episode of deformation. The French group uses J. Angelier's method (Angelier, 1984; Angelier, 1989; Angelier, 1990), which is a fault slip data inversion. They both apply the principle of mechanical consistency of a dataset.
The flow chart of both methods is in five steps (Table 1). The first step is to collect the kinematic indicators (orientations of structures, determination of the types of fractures, striations etc.) on favourable outcrops and to evidence the relationships between the observed brittle structures. The hierarchic relationships between small and large structures are also determined where possible. In a second step, the collected data are inverted to determine the orientation of the three principal stress axes and the type of stress states. The stress states at each field site (i.e. local stress states) are thus determined during the first and second steps of the study.
Comparaison des méthodes de reconstruction des paléo-contraintes et des résultats dans l’étude du Grand Caucase nord-occidental.
| Steps | Tectono-dynamic group of Moscow State University (L.M. Rastsvetaev, T. Yu. Tveritinova, A. S. Birman, A.V. Marinin) |
Tectonic group of University P. & M. Curie, Paris (A. Saintot, J. Angelier) |
Comparison |
| 1. Collection of field dataset, types of data | Fault slip data, tension gashes, stytolithic peaks/pressure dissolution seams, shear joints | Fault slip data, tension gashes, stytolithic peaks/pressure dissolution seams, shear joints | Coincidence |
| 2. Determination of local stress state | Determination of the structural synchronous development at the observation point. The orientation of the stress axes and the type of stress state are determined based on the structural paragenesis (i.e. applying the method of structural-paragenetic analysis; Rastsvetaev, 1987) | Determination of the orientation of the three principal stress axes and of the stress magnitude ratio (cf. Angelier, 1989, 1990) | Coincidence |
| 3. Determination of the stress field succession | The succession of local stress states for different large blocks in the belt is analyzed. The succession is controlled by crosscutting relationships between structures, the stratigraphic ages of affected units and the discordances. Three states are defined: 1) pre-folding state (stress affecting horizontal layers has an orientation that is different from the axis of the folding episode), 2) syn-folding stage (from horizontal layering to deformed structure under the same stress), 3) post-folding stage (stress affecting folded layers has an orientation that is different from the axis of the folding episode) | Ten successive stress fields were determined, with a chronological succession unified for the whole structure of NW-GC. The chronology is based on (1) cross-cutting relationships between the structures used to determine the local stress states, (2) the reconnaissance of post- and pre-folding/tilting fault slip data/stress states and (3) the stratigraphic ages of affected units | Difference and coincidence |
| 4. The results with regards to the geological model (geological heterogeneity vs. homogeneity of the belt) | Determination of structures (or blocks) showing stress state properties that differ from the paleo-stress fields. From the spatial variations of stress field subsequent characterization of the differences of structures from one zone (block) to another one | Some local stress particularities may be marked (if the purpose of the study is to recognize local variations of stresses). To reconstruct paleo-stress fields with a regional significance (i.e. at the scale of the tectonic plates), the NW-GC belt is mainly considered as an entity | Sufficient difference |
| 5. The interpretation, the reconstruction of a geodynamic model | Reconstructed paleo-stress fields are used to describe the tectono-dynamic conditions of structure development | Reconstructed paleo-stress fields are used to characterize the major tectonic phases and to implement a geodynamic model of evolution of the entire NW-GC as well as to describe the development of the regional structures (based on their kinematic properties) | Difference and coincidence By applying the two methods, the main tectonic phases are recorded |
Local stress states are grouped to form a stress field in a third step. The gathering of the local stress states highly depends of the purpose of the study, and of the pre-existing structural model of the investigated region. From the Russian group's point of view, several factors cause difficulties to select successive stress regimes and they are studied in a fourth step. They are: (1) the block structure of a mobile belt, that deviates the orientations of the principal stress axes, (2) the possible instantaneous (at the scale of the geological time) change in the orientations of the principal stress axes, (3) the characteristics of the folded and faulted structures, which may have different age of formation in different parts of the studied area. Thus the Russian group tends to show maximal caution for separating the stages of deformation and for the localization of deformation relatively to the regional structures.
The French researchers group the local stress states similar in stress axis orientation and type in order to form uniform stress fields at the scale of the entire NW-GC. The similar local stress states should spatially be well distributed over the whole investigated zone. The uniform stress fields are expected to be representative of regional stresses acting at the scale of the plates and to reflect important tectonic phases in the geological development of the belt. Thus in a first attempt the French group considers the NW-GC as a uniform structure at each times of development. It means that local stress perturbations (resulting in different stress states) are not included and examined since the purpose of the study was to recognize the major tectonic phases that have affected the entire belt (and not the local variations of stresses). Such approach allows to select the highest number of separate stress fields for a given region. However, some of the separated stress fields are later on combined, if consistent, to form a single tectonic phase. As such, several stress fields can be identified into a specific phase of deformation.
The phases of major deformation are extracted from the successive reconstructed paleostress fields in a fifth step.
3 Results
The Russian group has collected more than 4900 brittle tectonic indicators at 300 field sites. The French group has reconstructed 123 stress states at 58 sites using more than 2000 kinematic indicators. Local stress-states reconstructed by both groups have shown similarities.
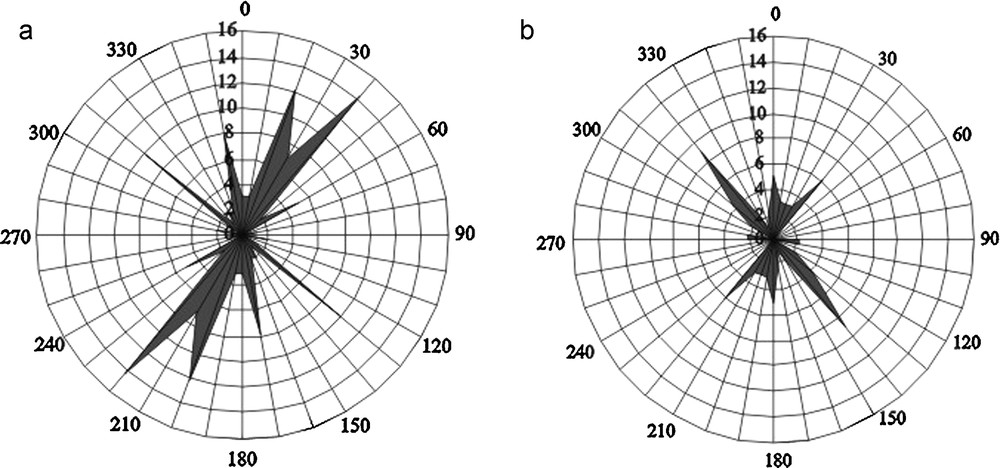
The dextral and sinistral micro-faults of the NW-GC strike NW-SE/NNW-SSE and NE-SW/ENE-WSW, respectively (Fig. 2a, b). The thrusts are predominantly NW-SE striking (Fig. 2c). A slightly predominant strike of normal faults is north-south (Fig. 2d). The prominent NE-SW stytolithic peak azimuth and the north-south tension gash strike remarkably fit with the attitude of the reverse and normal faults respectively (in Fig. 2, compare (c) with (e) and (d) with (f)).

Rose diagrams of the main strikes of structural data so determined at each field site: (a) and (b), dextral and sinistral strike-slip micro-faults, respectively; (c) and (d), reverse and normal micro-faults, respectively; (e), stytolithic peaks; (f), tension gashes (from Marinin and Rastsvetaev, 2008). Notes on the plotted data: each plotted strike corresponds to the strike which shows a steady maximum at a site (on an amount of data per site ranging from 10 to 100); therefore, the axis from 0 to 10 indicates the amount of field sites where the strike predominates; There is a filtering of the minor strikes which can occur in a site and which are not represented in the rose diagrams. Rose diagram sampling step: 10°.
Rosaces des directions principales des données structurales déterminées à chaque site : (a) et (b), micro-failles dextres et senestres, respectivement ; (c) et (d), micro-failles inverses et normales, respectivement ; (e), pics stytolithiques ; (f), fentes de tension (in Marinin et Rastsvetaev, 2008). Notes sur le type de données représentées : chaque direction dans ces rosaces correspond à la direction prépondérante à chaque site (déterminée sur une quantité de données allant de 10 à 100 par site) ; par conséquent, l’axe de 0 à 10 indique la quantité de sites où la direction prédomine ; les données sont filtrées, puisque les directions mineures qui peuvent apparaître dans un site ne sont pas représentées. Pas d’échantillonnage de la rosace : 10°.
From the entire dataset of kinematic indicators collected by the Russian group, two main trends of maximal principal stress/pressure axis were calculated (Fig. 3). The NE-SW trend is prevalent as it issued from more than 50% of data; the NW-SE trend is subsidiary (Fig. 3). From the entire dataset of kinematic indicators collected by the French group, only a main N030° quasi-horizontal trend of pressure axis is calculated as well as a perpendicular strike of tension axis (Fig. 4).
Rose diagrams of σ1 trends in the NW-GC calculated on (a) 50 to 100% data (resulting in a regional prevalent σ1 trend) and (b) 10 to 50% data (resulting in a subsidiary σ1 trend) (from Marinin and Rastsvetaev, 2008). The axis from 0 to 16 indicates the number of field sites where the σ1 stress axis trend is recorded as the best expressed (other subsidiary σ1 stress axis trends that can be determined at a site are not displayed). Rose diagram sampling step: 10°.
Rosaces des directions de σ1 calculées sur (a) 50 à 100 % des données (révélant une direction régionale prépondérante de σ1) et (b) sur 10 à 50 % des données (révélant une direction régionale de σ1 de deuxième ordre). (Selon Marinin et Rastsvetaev, 2008). L’axe de 0 à 16 indique le nombre de sites où la direction de contrainte σ1 est la mieux enregistrée (les autres directions de la contrainte σ1 qui peuvent être déterminées à un site ne sont pas représentées). Pas d’échantillonnage de la rosace : 10°.
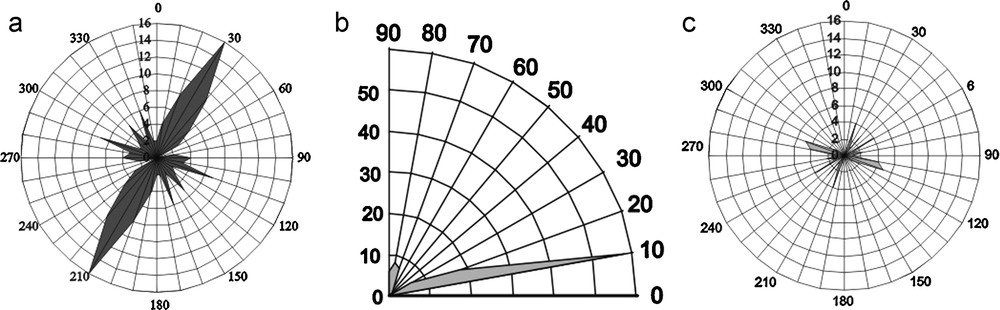
(a) Rose diagram of strikes and (b) dip angles of σ1; (c) rose diagram of σ3 strikes (based on the analysis of more than 2000 kinematic indicators). Caption as in Fig. 3.
(a) Rosace des directions et (b) angles de plongement de σ1 ; (c) rosace des directions de σ3 (basé sur l’analyse de plus de 2000 indicateurs cinématiques). Légende comme dans la Fig. 3.
These independent results show the high significance of the NE-SW striking maximal principal stress axis. It actually represents the pressure under which the major folded and faulted structures of the NW-GC synchronously developed.
Both groups have obtained a similar stress field which is characterized by a NW-SE/NNW-SSE striking pressure axis (Fig. 3 and see in Saintot and Angelier, 2002). This stress regime could correspond to the latest stage of development of the NW-GC as the youngest stratigraphic units contain the related kinematic indicators. Thus, after the first and second steps of processing, similar results are obtained at the scale of the outcrops by applying the two different methods.
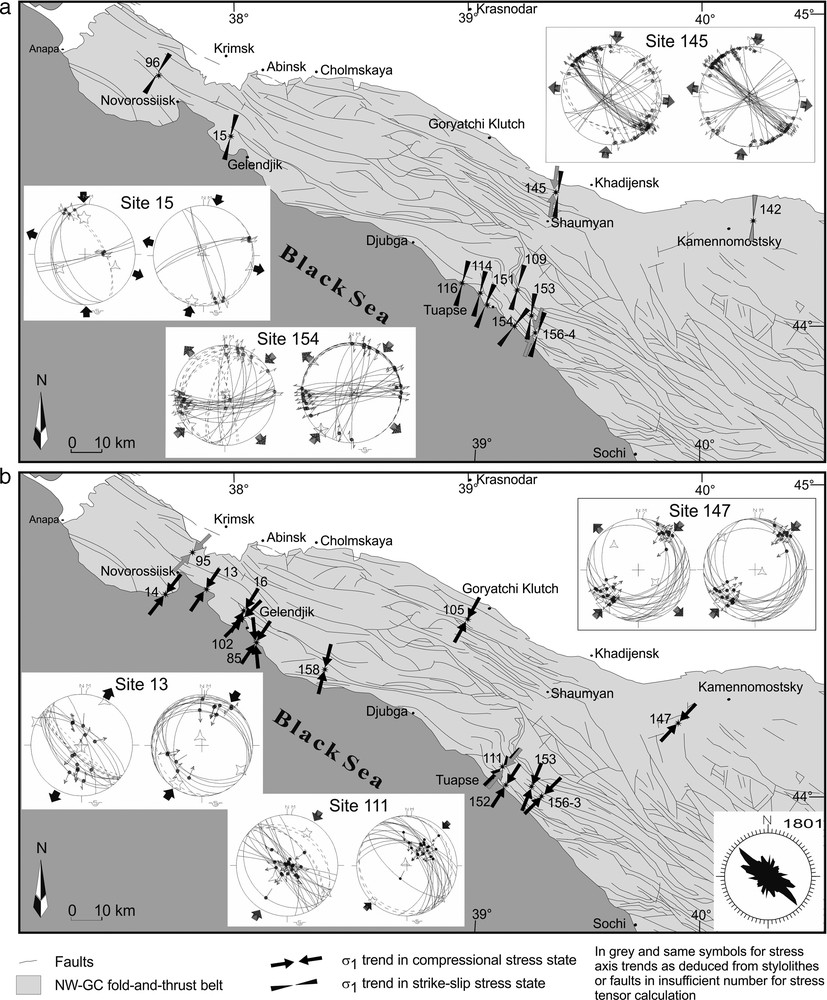
The obtained local stress states were plotted on a map of the NW-GC. The Russian group has plotted the azimuths of the maximal principal stress axis (Fig. 5a, b). The most abundant and prominent azimuth (i.e. the corresponding fault striations being the most abundant) is related to the Late Eocene tectonic phase of fold-and-thrust belt development (Fig. 5a). The subsidiary NW-SE/NNW-SSE azimuth is quite well expressed even if the corresponding striations were less abundant (Fig. 5b). At the scale of the NW-GC, the prevalent and subsidiary azimuths of the maximal principal stress axis vary (Fig. 5a, b). For example, the NE-SW regional azimuth of the maximal principal stress axis that characterized the Late Eocene stress field is clearly deviated to become NW-SE along the transverse zones of the NW–GC and along the flexural fault zones between Tuapse and Gelendjik (Fig. 5a). At these singular localities, northeast- folds are observed and are believed to be coeval to the NW-SE folds that formed in the other regions of the NW-GC.

Distribution of local stress states corresponding to: (a) a prevalent stress field related to the Late Eocene tectonic phase and (b) a subsidiary stress field, post-Late Eocene in age (due to the lack of stratigraphic constrain, it cannot be ruled out that some of the local stress states included in this stress field may however be related to the Late Eocene tectonic phase). 1: Neogene and Quaternary; 2: Paleogene; 3: Upper Cretaceous; 4: Lower Cretaceous; 5: Callovian-Upper Jurassic; 6: Lower and Middle Jurassic; 7: Palaeozoic-Triassic; 8: major faults (a); 9: prevalent (or well expressed) σ1 trend; 10: subsidiary σ1 trend; 11: vertical σ1 trend.
Distribution des états de contraintes locaux correspondant à : (a) un champ de contraintes majeur lié à la phase tectonique tardi-éocène et (b) un champ de contraintes secondaires, postérieur à l’Éocène (en raison de l’absence de contrôle stratigraphique, il ne peut être exclu que certains des états de contraintes locaux inclus dans ce champ de contraintes relèvent en réalité de la phase tectonique tardi-éocène). 1 : Néogène et Quaternaire ; 2 : Paléogène ; 3 : Crétacé supérieur ; 4 : Crétacé inférieur ; 5 : Callovien-Jurassique supérieur ; 6 : Jurassique inférieur et moyen ; 7 : Paléozoïque-Trias ; 8 : failles majeures (a) ; 9 : directions prépondérantes de σ1 ; 10 : directions secondaires de σ1 ; 11 : σ1 vertical.
French researchers group the similar local stress states according to the attitudes of the principal stress axes at the scale of the whole NW-GC to form a stress field (Fig. 6). The succession of the different stress regimes is based on: (1) the relative chronology between the structures used to determine the local stress states, (2) the reconnaissance of post- and pre-folding/tilting fault slip data/stress states and (3) the stratigraphic ages of affected units. They determined 10 successive stress fields for the whole NW-GC (Saintot and Angelier, 2002). These stress regimes were interpreted to reveal seven main tectonic events related to the structural evolution of the NW-GC from Late Cretaceous to present-day times. The oldest three stress regimes are characterized by different orientations of mainly strike-slip and dip-slip normal faults (Saintot and Angelier, 2002). These phases of brittle deformations took place before the tilting of beds which is assumed to be related to the Late Eocene major folding and thrusting phase. Four stress regimes reveal a NE–SW/NNE-SSW maximal principal stress axis. Two of them occurred before the tilting of beds and are in chronological order strike-slip (σ3 horizontal; Fig. 6a) and compressional (σ3 vertical; Fig. 6a) in type. The two other stress fields are post-tilting of beds and in chronological order compressional and strike-slip in type. They all four expressed the evolution of the stress regimes acting during the Late Eocene phase of the NW-GC fold-and-thrust belt formation. The last three stress regimes are post-folding and the recent NNW-SSE compressional stress regime predominates based on the prominent number of field sites where the associated stress states were determined.
Distribution of stress states related to (a) a strike-slip stress field with σ1 trending NE–SW to NNE–SSW, and (b) a NE–SW to NNE–SSW compressional event, with examples of stereonets that illustrate stress tensors related to each of the stress fields (in Saintot and Angelier, 2002). They acted during the Late Eocene tectonic phase but prior to the tilting of beds. At each site, the stereonets display the stress tensors calculated from fault slip data in their present and pre-tilting geometries (see, for control, the attitude of bedding planes). In lower right corner in (b): rose diagram of 1801 micro-fault trends collected in the field. The rose diagram displays the main NW–SE and WNW–ESE directions that characterize the reverse micro-fault population. These are also the trends of the major structures of the studied area (thrusts and folds). Numbers are field site numbers. Keys to stereonet: Schmidt's projection, lower hemisphere. Bedding planes as broken lines; fault planes as thin lines; striae as small arrows (inward directed = reverse, outward directed = normal, couple of thin arrows = strike-slip). Computed stress axes as 5-, 4- and 3- branch stars and σ1, σ2 and σ3, respectively. Direction of compression: inward-directed arrows; direction of extension: outward-directed arrows.
Distribution des états de contraintes locaux relatifs à : (a) un champ de contraintes de type décrochant, caractérisé par σ1 de directions NE-SW à NNE-SSW, et (b) une compression de direction NE-SW à NNE-SSW, avec des exemples de stéréonets des tenseurs de contraintes correspondant à chacun des champs de contraintes (in Saintot and Angelier, 2002). Ils correspondent à un premier événement, antérieur au basculement des couches, dans la phase tectonique tardi-éocène (voir la discussion dans Saintot et Angelier, 2002). À chaque site, les stéréonets montrent les tenseurs de contraintes calculés à partir des micro-failles dans leur position actuelle et dans leur position antérieure au basculement des couches (voir, pour contrôle, l’attitude des plans de stratification). Dans le coin inférieur droit de (b) : rosace des 1801 micro-failles mesurées sur le terrain. Les directions NW-SE et WNW-ESE caractérisent la population de micro-failles inverses. Ce sont également les directions des structures régionales de la zone étudiée (chevauchements et plis). Les nombres correspondent aux sites de terrain. Stéréonet : projection de Schmidt, hémisphère inférieur. Plans de stratification : lignes en pointillé ; plans de faille : fines lignes, stries : petites flèches (dirigées vers l’intérieur = inverses, dirigées vers l’extérieur = normales, flèches en vis-à-vis = décrochantes). Axes de contraintes calculées : étoiles à 5 -, 4 - et 3 - branches pour σ1, σ2 et σ3, respectivement. Direction de compression : flèches convergentes ; direction d’extension : flèches divergentes.
The local stress states related to the Late Eocene compressional phase of folding is the best expressed in the NW-GC and is also the stress field the best constrained in age. The related kinematic indicators were not found in the overlaying Oligocene-Miocene formations. A unconformity is observed between the folded pre-Upper Eocene strata and the Oligo-Miocene formations (although they were folded in a later episode of shortening).
4 Conclusion
The Russian and French groups of researchers used independent methods in order to reconstruct the stress fields in the NW-GC fold-and-thrust belt. They obtain similar results while the geological models of the NW-GC fold-and-thrust belt are different.
It ensues that a good knowledge of the assumptions inherent to the chosen methods coupled to an accurate description of the geological models used to describe the investigated region allow to better assess the level of reliability of the methods as well as their limitation in the interpretation of the results.
The small-scale brittle structures they gathered in the field reflect the regional NW-SE and WNW-ESE striking fault zones. The faults are thrusts, from dip-slip reverse faults to transpressional zones that are observed as small-scale fractures as well as large fault zones.
A sub-horizontal NE-SW/NNE-SSW orientation of maximal principal stress/pressure axis characterized the stress field acting during the formation of the fold-and -thrust belt of the NW-GC.
The NW-SE and NNW-SSE striking maximal principal stress/pressure axis are well expressed. The late Alpine Neogene-Quaternary structural development is related to such a stress regime.
The NNW-striking compression was active during the latest stage of development of the region.
Acknowledgments
The authors would like to thank F.L. Yakovlev who took the initiative to engage us in writing this contribution and for further advices, L.M. Rastsvetaev, T. Yu. Tveritinova and A.S. Birman for their help in processing the dataset and defining the local stress states and S.G. Korsakov, I.N. Semenukha, S.M. Gorbova and A. Ilyin for their assistance in the field. We also thank two anonymous reviewers for their comments.