

1 Introduction
In Iceland, the divergent plate boundary is marked by Holocene tectono-volcanic systems identified as West, East and North Volcanic Zones (Fig. 1), each of them being constituted by several so-called fissure swarms (Sæmundsson, 1978). Most fissure swarms are typically 5 to 20 km wide and 40 to 150 km long (Guðmundsson, 1995, 2000) and are arranged in en-échelon arrays. Each fissure swarm commonly comprises a central volcano and is characterized by a high amount of sub-parallel fractures, including normal faults and dilatational volcanic and non-volcanic fissures (Fig. 1). Note that “fissure” is used in Iceland in a rather imprecise sense since it means any “open fractures” (the fissure swarms including both tension fractures and open normal faults at the surface). Analyzing the geometry of fractures, the regional stress field and the local stress perturbations, is thus of critical interest not only for understanding the fracturing mechanisms of the Icelandic rift systems but also when evaluating seismic and volcanic hazards.
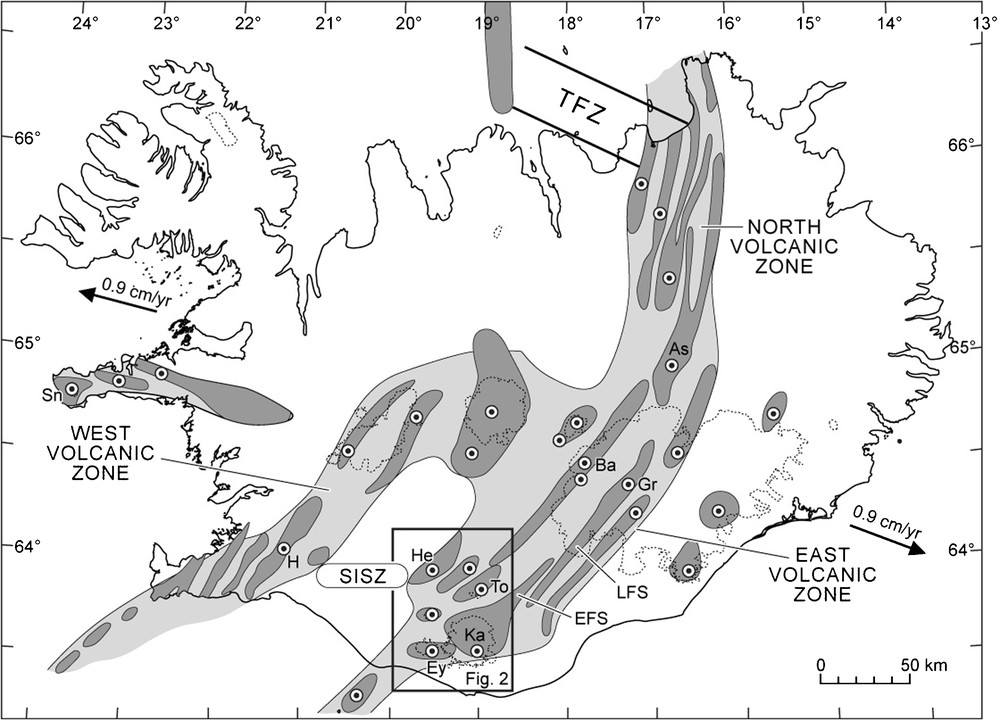
Volcanic zones, fissures swarms and central volcanoes in Iceland (modified after Sæmundsson, 1978 and Guðmundsson, 2000). Active rift zone is indicated in light grey. Fissures Swarms (FS) are in dark grey: EFS: Eldgjá, LFS: Laki. Central volcanoes as white dots: As: Askja; Ba: Bardarbunga; Ey: Eyjafjallajökull; Gr: Grimsvötn; H: Hengill; He: Hekla; Ka: Katla; Sn: Snaefellsjökull; To: Torfajökull; RP: Reykjanes Peninsula. Transform zones: SISZ: South Iceland Seismic Zone; TFZ: Tjörnes Fracture Zone. Black arrows: direction and velocity of plate divergence according to NUVEL-1 global plate motion model (DeMets et al., 1990, 1994).
Zones volcaniques, champs de fractures et volcans centraux en Islande (modifié d’après Sæmundsson, 1978 et Guðmundsson, 2000). Zones de rift actives en gris clair. Champs de fractures en gris foncé : EFS : Eldgjá, LFS : Laki. Volcans centraux (petits ronds blancs) : As : Askja ; Ba : Bardarbunga ; Ey : Eyjafjallajökull ; Gr : Grimsvötn ; H : Hengill ; He : Hekla ; Ka : Katla ; Sn : Snaefellsjökul ; To : Torfajökulll ; RP : Péninsule de Reykjanes. Zones transformantes : SISZ : Zone Sismique Sud-Islandaise ; TFZ : Zone de Fracture de Tjörnes. Les flèches noires indiquent la direction et la vitesse de divergence des plaques (NUVEL-1 ; DeMets et al., 1990, 1994).
While detailed studies concern some fissures swarms of the North Volcanic Zone (Angelier et al., 1997; Dauteuil et al., 2001; Guðmundsson and Bäckström, 1991; Hjartardóttir et al., 2009; Opheim and Guðmundsson, 1989; Tentler and Mazzoli, 2005), of the West Volcanic Zone (Friese, 2008; Guðmundsson, 1987b; Sonnette et al., 2010) and of the Reykjanes peninsula (Clifton and Kattenhorn, 2006; Grant and Kattenhorn, 2004; Guðmundsson, 1987a), the East Volcanic Zone (EVZ) remains little studied.
The EVZ is the youngest part of the Icelandic rift and is active since 2–3 Ma (Jóhannesson et al., 1990). Its northernmost part being mostly hidden by the Vatnajökull ice cap, we focus this study on its southern part, in between the latitudes 63°15′N et 64°15′N. With the exception of the volcanic systems (e.g., Thordarson and Larsen, 2007; Thorarisson and Sæmundsson, 1979) the EVZ is still little described and, above all, poorly documented in terms of tectonics, especially in its southernmost and western part. This area is located at the junction with an east-west left-lateral transform zone, the South Iceland Seismic Zone (SISZ). Its southern part (south of Torfajökull, Fig. 2) is a kind of transition zone, often considered as outside of the rift zone (off-rift flank zone) because south of the intersection with the transform zone, but very probably representing the propagating southwestward rift (e.g., Guðmundsson, 2007).
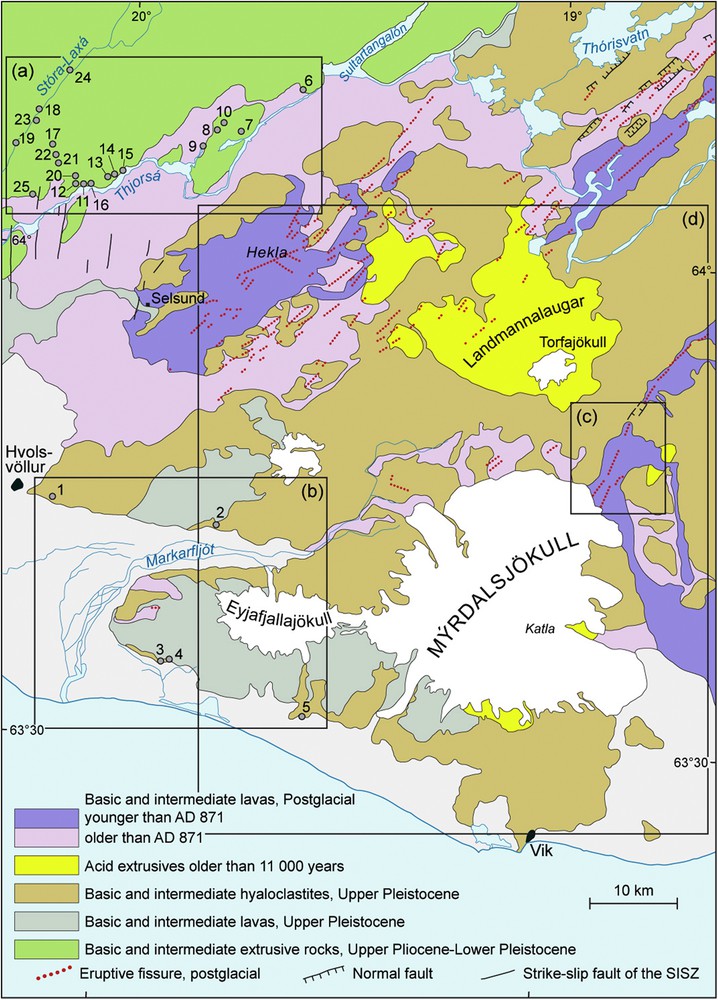
Geological map of the southern part of the Eastern Rift Zone of Iceland (simplified after Jóhannesson and Sæmundsson, 2009 and Jóhannesson et al., 1990). Boxes indicate the areas selected for fault-slip data collection (a and b), for photogrammetric study (c) and for seismological study (d). The location of the measurement sites is indicated by grey dots, numbers refer to Table 1.
Carte géologique de la partie sud de la zone de rift orientale de l’Islande (simplifiée d’après Jóhannesson et Sæmundsson, 2009 et Jóhannesson et al., 1990). Les cadres indiquent les régions de mesures de failles (a et b), d’étude photogrammétrique (c) et d’analyse sismologique (d). La localisation des sites de mesures est indiquée (points gris) et les numéros se rapportent au Tableau 1.
Because large parts of the southern EVZ are covered by ice, Holocene sediments (Sandur), volcanic scoriae and ashes are not accessible, this work is based on three complementary approaches, allowing us to study fractures of various scales and types:
- • analysis of fault-slip data collected in the field;
- • aerial photographs study;
- • analysis of focal mechanisms of earthquakes.
Our collection of fault slip data has been focussed on two areas offering adequate outcrops: the western edge of the rift along the Þjorsá River (Fig. 2a), in basic and intermediate extrusive rocks of Upper Pliocene-Lower Pleistocene age (0.8–3.3 Ma), and the Eyjafjallajökull area (Fig. 2b), in the basic and intermediate lavas and hyaloclastites of Upper Pleistocene age (younger than 0.8 Ma). The most recent faults and fissures have been analysed, using photogrammetric techniques, close to the eastern part of the rift, in post-glacial lavas, north of the Mýrdalsjökull (Fig. 2c). And finally, the present-day brittle tectonics is pointed up by the focal mechanisms of earthquakes, these latter being essentially located in the Eyjafjallajökull, Mýrdalsjökull and Torfajökull areas (Fig. 2d). Therefore the brittle mechanisms can be reconstructed from both the geological and seismological observations, since the beginning of this rift activity to the present time, in between the western and eastern borders of the rift.
2 Methodology
Three main approaches have been employed during this work, each of them using an appropriate methodology:
- • where outcrops were easily accessible and when the facies of the outcropping volcanic formations were appropriate (i.e., a significant number of fault slips can be easily measured), we collected numerous measurements of minor faults (length of tens of centimetres to tens of metres, with centimetric to metric displacements) in order to determine the characters of faulting and to reconstruct quantitatively the paleostress regimes by the inversion of fault slip data. Because all the inversion methods based on stress-shear relationships have been widely used for about thirty years, and extensively discussed in the literature (e.g., Célérier et al., in press; Lisle et al., 1998), they are not developed in the present paper. We used herein a fault-slip inversion method based on:
- ∘ minimizing the angle between the theoretical shear vector and the actual slip vector (stria),
- ∘ simultaneously making relative shear-stress magnitudes as large as possible. This method is referred to as INVDIR (Angelier, 1990). Each paleostress state is thus characterized by its type (reverse-, normal- or strike-slip-type), the attitude of the three stress axes σ1, σ2 and σ3 with σ1 ≥ σ2 ≥ σ3, and the ratio Φ = (σ2–σ3)/(σ1–σ3) with 0 ≤ Φ ≤1;
- • because the access to outcrops is often difficult, particularly close to the main Icelandic glaciers, it has been demonstrated that photogrammetry can constitute a powerful tool in order to study large areas of the rift zone (e.g., Clifton and Kattenhorn, 2006; Hjartardóttir et al., 2009; Sonnette et al., 2010), and especially to characterise the geometry of the fault and fissure swarms. In favourable cases, such studies are complemented by check observation points in the field. We used herein aerial photographs at a scale of 1: 40,000, digitized by the Icelandic Geodetic Survey (“Landmælingar Íslands”) with high-resolution (2000 dpi), covering an area of approximately 140 km2. The main steps of our photogrammetric study were:
- ∘ the construction of the photogrammetric models for the whole area, based on stereo-photographic pairs, following the principles of parallel stereoscopy (Kasser and Egels, 2001),
- ∘ the extraction of the Digital Elevation Model (DEM),
- ∘ the building of an ortho-mosaic (resolution: 1pixel ≈ 0.6 m2). For these purposes, we used ERDAS® softwares. The mosaic and photogrammetric models were then both used for mapping fractures traces using ArcGIS 10®;
- • the most recent tectonics has been investigated using the focal mechanisms of earthquakes provided by the seismological database of the Icelandic Meteorological Office (IMO, “Veðurstofa Íslands”). Several methods have been developed to invert focal mechanisms (e.g., Angelier, 2002; Gephart and Forsyth, 1984; Michael, 1984). The usual inversion practice consists in dividing the studied area into several sub-areas, and independently computes the stress tensor from the focal mechanisms of each sub-area. This often gives rise to spatial variability, which can be partly attributed to artifacts. To alleviate this difficulty, we performed herein a damped regional-scale stress inversion described by Hardebeck and Michael (2006) in order to avoid these artifacts while retaining any stress variations that are strongly required by the data. We thus simultaneously inverted data in all sub-areas while minimizing the difference in stress components between adjacent sub-areas. The scalar damping parameter (e) controls the relative weighting sum of two values: the data misfit and the model length (model variance) in the minimization process. The model length is represented by the L2 norm of the vector containing the differences between each stress tensor component for each pair of adjacent grid points (see details of the method in Hardebeck and Michael, 2006). Examination of the trade-off curve for a range of e values allows us to select the preferred value of e that best jointly minimizes misfit and model length. The nodal planes are randomly chosen, and the size of the grid may vary, which allows adjusting it in order to have a sufficient number of earthquakes.
3 Results
3.1 Characters of faulting and paleostress tensor reconstructions on the shoulders of the rift zone
The shoulders of the active rift zone (EVZ) correspond to the eroded oldest rift-zone left inactive by plate motion and thus allow the observation of shallow structures of the Upper Pliocene to Upper Pleistocene rifting now outcropping, whereas only the surface deformation is accessible in the active part (cf. section 3.2). The sites 1 to 5 are located on the southeastern border of the EVZ, which represents also its southern termination. The sites 6 to 10 are characteristic of its western border, while the sites 11 to 25 are located in an area obviously influenced by both the EVZ and SISZ tectonics. A total of 1180 brittle structures were measured in 25 sites, mainly canyons, road cuts and some quarries, in order to characterize the faulting nature and to determine the paleo-stress pattern (Figs. 3 and 4).
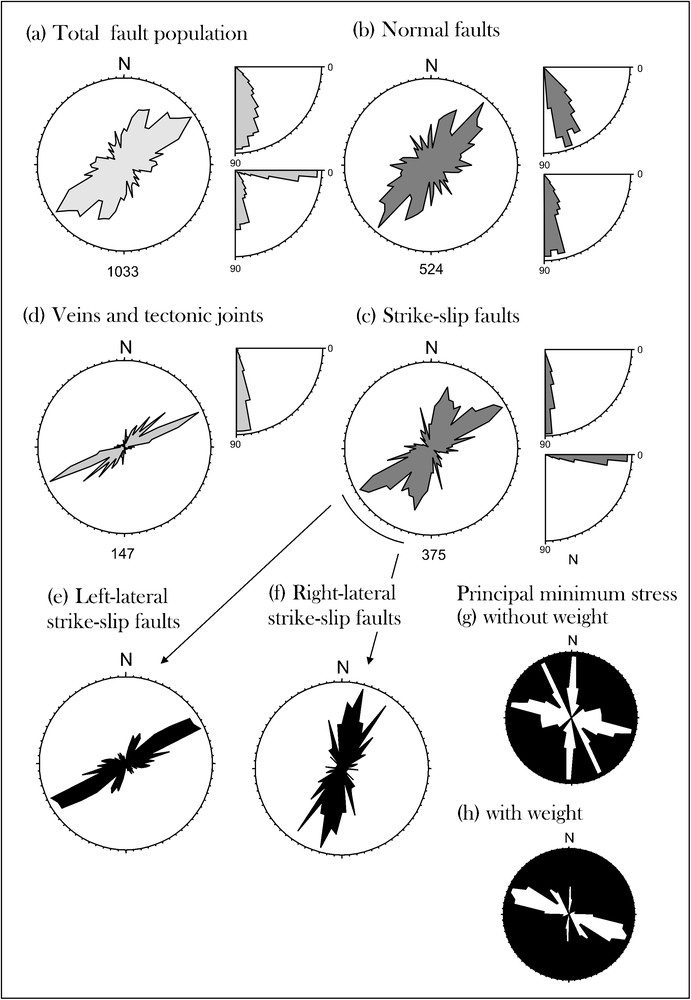
Rose diagrams of brittle structures and stress axes. The number of measurements is indicated below the diagrams. On the right of the rose diagrams a, b, c and d, the quarter-diagrams indicate the dip of the planes (upper) and pitch of the striae (lower).
Diagrammes directionnels des structures cassantes et des axes de contraintes. Le nombre de mesures est indiqué sous chaque diagramme. À droite des diagrammes a, b, c et d, les quarts de diagrammes représentent le pendage des failles (en haut) et le « pitch » des stries (en bas).
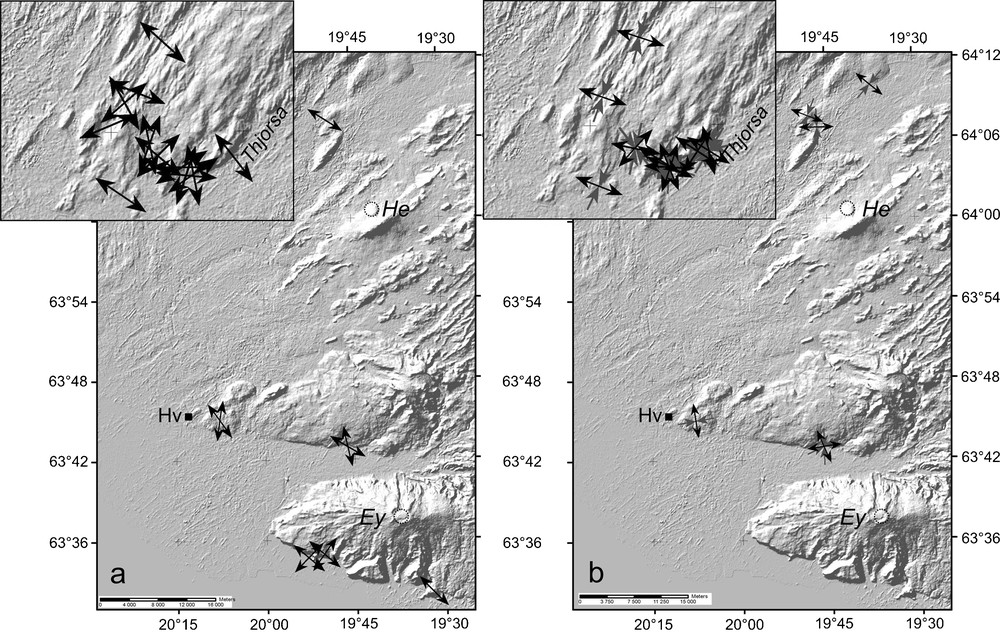
Paleostress states issued from fault-slip data inversion, in the Upper Pliocene-Lower Pleistocene, and Upper Pleistocene formations; a: normal regime. Horizontal stress axes σ3 as divergent black arrows; b: strike-slip regime. Horizontal stress axes σ3 and σ1 as divergent black arrows and convergent light grey arrows, respectively. Poor quality stress tensors (Q = D in Table 1) have been omitted. The map corresponds to the boxes (a) and (b) of Fig. 2. Its northwest part is enlarged because of the denseness of measurements sites in this area. The background is constituted by a Digital Elevation Model (DEM) with 20 m resolution, ASTER GDEM (product of NASA(EOS) and METI). Ey: Eyjafjallajökull; He: Hekla; HV: Hvolsvöllur.
États de contraintes issus de l’inversion des données de failles dans les formations du Pliocène supérieur et du Pléistocène ; a : régime normal. Axes de la contrainte horizontale σ3 : flèches divergentes noires ; b : régime décrochant. Axes des contraintes horizontales σ3 et σ1 : flèches divergentes noires et flèches convergentes grises, respectivement. Les tenseurs de mauvaise qualité (Q = D dans le Tableau 1) ont été omis. La carte correspond aux cadres (a) et (b) de la Fig. 2. Sa partie nord-ouest a été agrandie en raison de la densité des sites dans ce secteur. Le fond est constitué par un modèle numérique de terrain (MNT) de 20 m de résolution, ASTER GDEM (produit NASA(EOS) et METI). Ey : Eyjafjallajökull ; He : Hekla ; HV : Hvolsvöllur.
Faulting is represented by 524 minor normal faults and 375 minor strike-slip faults (Fig. 3b–c), which constitute respectively 44% and 32% of the total measurements. The 134 remaining minor faults (12%) are oblique-slip and show both strike-slip and normal components. The trends of the normal faults are relatively scattered, nevertheless their major direction is N40°-55°E, another peak around N10°-25°E can also be distinguished (Fig. 3b). Most of the dips range between 60° and 80°. The trends of the strike-slips faults range between N10°E and N65°E with two marked peaks at N45-65°E and N10-35°E, corresponding respectively to the main major sets of left-lateral and right-lateral strike-slip faults (Fig. 3e–f). We note that 147 of the measurements (12%) are tectonic joints and crystallized veins (Fig. 3d). They have been measured in the zone at the junction of EVZ and SISZ (in sites 11, 12, 18 and 20) and mainly trend N45°-65°E, which is the trend of the left-lateral faults in the studied area (compare diagrams 3d and 3e), as well as in the whole SISZ (Bergerat et al., 1998, 1999), revealing an opening component perpendicular to this direction.
Because the tectonics is polyphased and most sites displaying heterogeneous data set, the total population of fault slip data of each site:
- • has been divided in sub-groups, based on mechanical consistencies and relative chronological criteria when available;
- • analyzed in terms of stress tensors using inversion of fault-slip data.
The results are summarized in Table 1 and Fig. 4. It is noticeable that, in many cases, separation between strike-slip and normal faulting modes may be mechanically unnecessary, the same directions of extension being determined for both modes (Fig. 4a–b). Considering both the strike-slip and normal regimes, the rose diagram of the computed σ3 axis trends shows three main peaks at 100°-115°, 150°-155° and 0°-5° (Fig. 3g). However, such representation does not take into account the relative importance of these three stress states, the introduction of a weighting based on the number of corresponding fault measurements, allows one to identify a major peak at 100°-125°, and two minor ones at 145°-155° and 0°-5° (Fig. 3h). The main direction of extension is between the direction of the spreading vector, oriented N105°E in this part of Iceland (DeMets et al., 1990, 1994), and the perpendicular to the EVZ, N135°E. The two other minor directions are related to local stresses, as already pointed out in some off-rift zones in Iceland (e.g., Bergerat et al., 1990; Plateaux et al., in press; Villemin et al., 1994). There is no noticeable difference between the paleostress states reconstructed in Upper Pliocene-Lower Pleistocene and those reconstructed in Upper Pleistocene (Fig. 4).
Tenseurs de contraintes calculés à partir de l’inversion donnée de glissements de failles. De gauche à droite : numéro du site (Fig. 2) ; nom du site ; coordonnées (Latitude, Longitude) en degrés ; âge de la roche affectée (UP–LP : Pliocène supérieur–Pléistocène inférieur ; UP : Pléistocène supérieur) ; nombre de failles utilisées pour le calcul ; type de régime de contrainte (SS : décrochant, N : normal) ; σ1, σ2, σ3 : axes de contraintes principaux, maximal, moyen et minimal, avec σ1 ≥ σ2 ≥σ3 (direction et plongement, en degrés) ; Φ = (σ2–σ3)/(σ1–σ3) : rapport de forme Φ avec 0 ≤ Φ ≤1 ; RUP : critère de la méthode INVDIR (Angelier, 1990) entre 0 % (excellent) et 200 % (mauvais), résultats acceptables si RUP < 75 % ; α : angle moyen (en degrés) entre la strie calculée et la strie réelle, résultats acceptables si α < 30° ; Q : estimateur de qualité du tenseur calculé (A : excellent ; B : bon ; C : acceptable ; D : médiocre). Quand des veines minéralisées sont présentes dans un site, elles sont indiquées avec la direction d’extension perpendiculaire.
| Site | Name | Latitude | Longitude | Rock age | N | Type | σ1 | σ2 | σ3 | Φ | RUP | α | Q |
| 1 | Fljótshlið-1 (Breiðabólstaður) | 63,75 | –20,12833 | UP | 21 | N | 32–76 | 236–12 | 144–5 | 0.3 | 40 | 13 | A |
| 4 | SS | 260–3 | 163–69 | 351–20 | 0.6 | 33 | 8 | C | |||||
| 8 | N | 138–70 | 275–15 | 8–13 | 0.3 | 26 | 8 | B | |||||
| 2 | Fljótshlið-2 (Barkarstaðir) | 63,716 | –19,76916 | UP | 22 | N | 190–74 | 32–15 | 300–6 | 0.3 | 33 | 13 | A |
| 4 | SS | 245–3 | 146–73 | 336–17 | 0.2 | 39 | 12 | C | |||||
| 7 | N | 98–87 | 257–3 | 347–1 | 0.3 | 38 | 10 | C | |||||
| 4 | SS | 167–6 | 68–56 | 261–33 | 0.6 | 31 | 12 | D | |||||
| 12 | N | 178–72 | 351–17 | 81–2 | 0.2 | 41 | 12 | A | |||||
| 3 | Eyjaffjöll-4 (Hvammur) | 63,578 | –19,884 | UP | 10 | N | 0–79 | 221–9 | 130–8 | 0.4 | 37 | 14 | B |
| 20 | N | 140–71 | 313–19 | 44–2 | 0.3 | 42 | 13 | A | |||||
| 4 | Eyjaffjöll-5 (Núpur) | 63,582 | –19,84 | UP | 11 | N | 217–78 | 40–12 | 310–1 | 0.4 | 41 | 10 | A |
| 4 | SS | 159–52 | 305–33 | 46–17 | 0.3 | 64 | 19 | D | |||||
| 15 | N | 158–72 | 302–15 | 35–10 | 0.2 | 41 | 9 | C | |||||
| 5 | Eyjaffjöll-7 (Skógar) | 63,534 | –19,536 | UP | 11 | N | 176–80 | 46–6 | 315–7 | 0.4 | 26 | 9 | A |
| 6 | N | 250–75 | 346–1 | 76–15 | 0.3 | 19 | 6 | D | |||||
| 6 | Þjórsá-1 | 64,165933 | –19,62078 | UP–LP | 82 | SS | 40–3 | 145–79 | 309–11 | 0.4 | 35 | 12 | A |
| 7 | Þjórsá-4 (Stífla) | 64,114 | –19,774 | UP–LP | 7 | SS | 8–1 | 104–77 | 278–13 | 0.5 | 22 | 6 | D |
| 13 | SS | 177–16 | 15–74 | 269–5 | 0.5 | 24 | 8 | A | |||||
| 8 | Þjórsá-5 (Skeljafell) | 64,1229 | –19,81858 | UP–LP | 27 | N | 248–83 | 32–6 | 122–4 | 0.3 | 29 | 10 | A |
| 7 | N | 34–80 | 295–2 | 205–10 | 0.1 | 40 | 14 | D | |||||
| 9 | Búrfellvirjun | 64,10833 | –19,83333 | UP–LP | 5 | SS | 15–21 | 150–61 | 277–19 | 0,3 | 33 | 12 | D |
| 4 | SS | 285–1 | 159–88 | 15–1 | 0.4 | 14 | 4 | D | |||||
| 10 | Skeljafell | 64,12833 | –19,8 | UP–LP | 19 | SS | 201–1 | 45–89 | 291–0 | 0.5 | 66 | 26 | C |
| 11 | Þjórsá-8 | 64,06393 | –20,09538 | UP–LP | 21 | SS | 3–4 | 115–79 | 273–10 | 0.4 | 48 | 24 | A |
| 11 | N | 149–78 | 325–12 | 55–1 | 0.2 | 34 | 7 | B | |||||
| 13 | SS | 288–1 | 24–79 | 198–12 | 0.3 | 31 | 16 | A | |||||
| 12 | Þjórsá-9 | 64,0639 | –20,1086 | UP–LP | 9 | N | 97–80 | 5–0 | 275–10 | 0.3 | 44 | 12 | B |
| 21 | N | 175–79 | 287–5 | 18–10 | 0.2 | 27 | 10 | A | |||||
| Veins indicating a NNW-SSE extension | |||||||||||||
| 13 | Þjórsá-10 (Líkný) | 64,07216 | –20,05375 | UP–LP | 5 | SS | 294–0 | 203–80 | 24–10 | 0.5 | 32 | 6 | D |
| 14 | Þjórsá-11 (Hrútaklettur) | 64,07766 | –20,04083 | UP–LP | 9 | SS | 34–3 | 142–19 | 303–10 | 0.6 | 37 | 7 | B |
| 10 | SS | 304–4 | 47–74 | 213–15 | 0.5 | 51 | 14 | C | |||||
| 15 | Þjórsá-6 (Gaukshófði) | 64,078 | –20,01813 | UP–LP | 34 | SS | 212–0 | 120–89 | 302–1 | 0.4 | 34 | 8 | A |
| 12 | SS | 344–14 | 137–74 | 169–3 | 0.4 | 28 | 9 | D | |||||
| 24 | SS | 76–4 | 294–84 | 166–3 | 0.4 | 26 | 8 | A | |||||
| 58 | N | 49–82 | 232–8 | 142–0 | 0.2 | 31 | 11 | A | |||||
| 16 | Þjórsá-7 | 64,06413 | –20,0958 | UP–LP | 19 | SS | 205–4 | 306–70 | 114–20 | 0.2 | 36 | 15 | A |
| 22 | N | 347–82 | 79–0 | 169–8 | 0.2 | 41 | 16 | A | |||||
| 27 | SS | 248–1 | 156–77 | 338–13 | 0.3 | 30 | 9 | A | |||||
| 17 | Kálfá-1 | 64,11666 | –20,2 | UP–LP | 5 | N | 321–66 | 128–23 | 220–5 | 0.3 | 31 | 9 | D |
| 18 | Stóra-Laxá-1 (Laxárdalur) | 64,13333 | –20,2 | UP–LP | 23 | N | 144–79 | 23–6 | 292–9 | 0.5 | 29 | 12 | A |
| Veins indicating a NW-SE extension | |||||||||||||
| 19 | Stóra-Laxá-2 (Skelhóll) | 64,1055 | –20,2555 | UP | 4 | N | 89–83 | 211–4 | 301–6 | 0.6 | 17 | 3 | D |
| 6 | N | 36–77 | 156–7 | 247–11 | 0.5 | 23 | 9 | A | |||||
| 20 | Fossnes | 64,07083 | –20,116666 | UP–LP | 4 | SS | 213–10 | 21–80 | 122–2 | 0.4 | 27 | 7 | B |
| 13 | N | 93–88 | 0–0 | 270–2 | 0.3 | 38 | 8 | B | |||||
| 9 | N | 111–68 | 331–17 | 237–13 | 0.1 | 31 | 10 | C | |||||
| Veins indicating a NW-SE extension | |||||||||||||
| 21 | Stora-Mástunga | 64,0805 | –20,16166 | UP–LP | 13 | SS | 193–7 | 356–83 | 102–2 | 0.5 | 21 | 6 | A |
| 14 | N | 277–76 | 38–7 | 130–12 | 0.5 | 30 | 11 | B | |||||
| 4 | SS | 142–11 | 243–46 | 42–42 | 0.4 | 38 | 9 | C | |||||
| 16 | N | 261–89 | 135–1 | 45–1 | 0.4 | 31 | 12 | A | |||||
| 22 | Minni-Mástunga | 64,09 | –20,178333 | UP–LP | 12 | N | 39–73 | 260–13 | 168–10 | 0.3 | 34 | 12 | A |
| 14 | N | 173–79 | 289–5 | 20–10 | 0.4 | 23 | 8 | B | |||||
| 23 | Stóra-Laxá-3 (Leirdalur) | 64,125 | –20,225 | UP–LP | 13 | SS | 20–1 | 111–64 | 289–26 | 0.3 | 28 | 11 | A |
| 14 | N | 252–81 | 60–9 | 151–2 | 0.2 | 33 | 11 | A | |||||
| 19 | N | 100–74 | 322–12 | 229–11 | 0.3 | 38 | 13 | A | |||||
| 24 | Stóra-Laxá-4 (Miðfell) | 64,175 | –20,15 | UP–LP | 22 | SS | 15–8 | 265–66 | 108–22 | 0.3 | 23 | 9 | A |
| 13 | N | 19–70 | 224–19 | 132–8 | 0.5 | 38 | 9 | A | |||||
| 25 | Kálfá-2 (Hamratunga) | 64,04866 | –20,23333 | UP–LP | 21 | SS | 26–8 | 131–60 | 291–28 | 0.3 | 39 | 15 | A |
| 27 | N | 31–85 | 214–5 | 124–0 | 0.3 | 34 | 16 | A |
3.2 Geometry of faulting in the active rift zone
In between the borders of the EVZ, basic and intermediate Upper Pleistocene and Holocene lava flows outcrop. The general map of this area (Fig. 2) shows that these lavas are affected by eruptive fissures and, especially to the north, some imbricate normal faults.
Despite a northeast-southwest general trend obviously perceived in the morphological features (see DEM on Fig. 6), the presence of the youngest lava flows and, above all, the abundance of the overlaying volcanic scoria and sand permit neither the observation of the oldest structure nor the smallest ones. The analysis of the available photographs, using photogrammetric techniques, allows distinguishing and mapping 28 individual fractures which are mainly normal faults, all located in the Upper-Pleistocene formations, and three segments of a large eruptive fissure in the post-glacial lavas (Fig. 5). The length of the individual fractures ranges between 56 m and 655 m, the maximum throw of the normal faults is 14 m. The main east-facing and west-facing normal faults describe a well exposed graben structure. The normal faults and eruptive fissures constitute a fracture strip which can be followed on more than 12 km on the studied photographs. The average azimuth of this strip is N20°E, but we can note a slight inflection to the northeast in the upper part of the photo-mosaic (see also Fig. 6). These faults and fissures constitute the so-called Western fissure (Thodarson et al., 2001) of the major Eldgjá fissure swarm (Fig. 1).
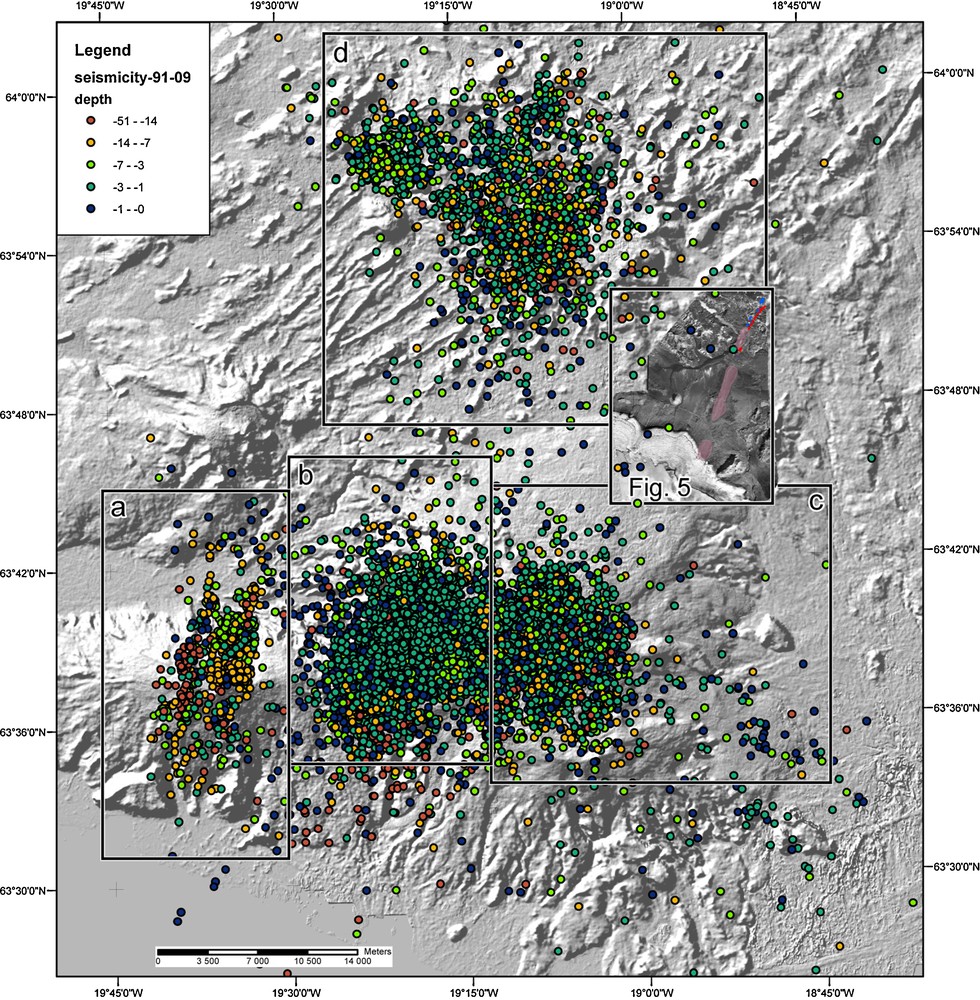
Seismicity of the East Volcanic Zone (EVZ) (IMO database 1991–2009). Epicenters of the 16.524 earthquakes with Mw greater than 1 symbolized by coloured dots as a function of depth (see gradual color bar), located on the same DEM as in Fig. 4. Also depicted at its place is the Fig. 5. Boxes indicate the earthquakes used for focal mechanisms inversion of Fig. 7: Eyjafallajökull (a) West- and East-Mýrdalsjökull (b and c, respectively), Torfajökull (d).
Sismicité de la Zone Volcanique Est (base de données IMO 1991–2009). Les épicentres des 16,524 séismes avec magnitude de moment (Mw) supérieur à 1 sont symbolisés par des points de différentes couleurs en fonction de la profondeur et localisés sur le même MNT que sur la Fig. 4. L’emplacement de la Fig. 5 est également indiqué. Les cadres indiquent les séismes utilisés pour l’inversion des mécanismes au foyer (cf. Fig. 7) : Eyjafallajökull (a) Ouest- et Est-Mýrdalsjökull (b et c, respectivement), Torfajökull (d).
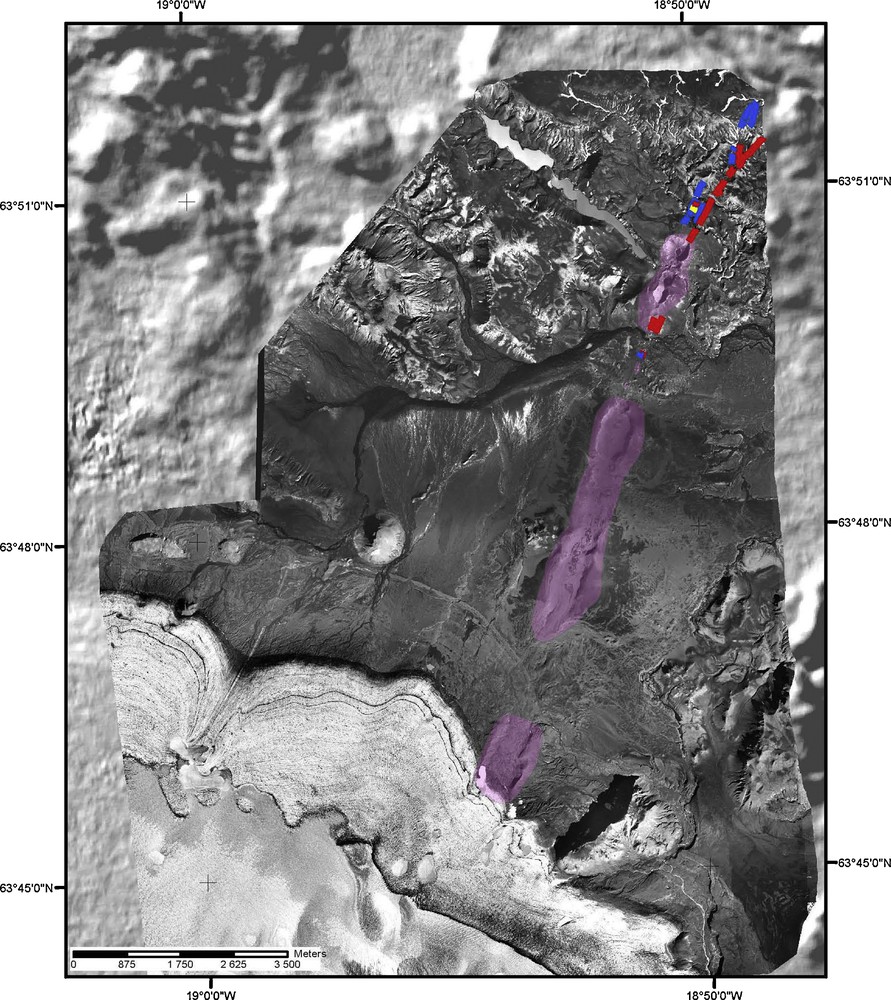
Aerial photograph mosaic in the East Volcanic Zone (EVZ), north of the Mýrdalsjökull (photographs L6132 to 6135 and L6164-6165, Landmælingar Íslands). The mosaic corresponds to the box (c) of Fig. 2. Out of the mosaic (where aerial data were not available), the background is constituted by the same DEM as in Fig. 4. Faults identified in this study are shown as red (NW facing) and blue (SE facing) coloured lines, eruptive fissures as pink coloured surfaces. The eruptive fissures correspond to the 934 AD eruption of Eldgjá.
Mosaïque de photographies aériennes dans la Zone Volcanique Est, au nord du Mýrdalsjökull (photographies L6132 à 6135 et L6164-6165). La carte correspond au cadre (c) de la Fig. 2. À l’extérieur de la mosaïque (là où les photographies aériennes n’étaient pas disponibles), le fond est constitué par le même MNT que sur la Fig. 4. Les failles identifiées lors de cette étude sont soulignées par des traits rouges (regard NW) et bleus (regard SE), les fissures éruptives par des surfaces roses. Les fissures éruptives correspondent à l’éruption de l’Eldgjá datant de 934 AD.
3.3 Mechanisms of present-day faulting
The earthquakes recorded by the IMO network since 1991 to 2009 in the southern part of the EVZ are essentially located in the vicinity of the main volcanoes and have been sorted herein in four sub-areas (Fig. 6): Torfajökull, Eyjafjallajökull and West- and East-Mýrdalsjökull (Katla). We selected earthquakes with moment magnitude Mw greater than 1, except for the East-Mýrdalsjökull area (Mw > 2) because of the great number of earthquakes at that place. Then, 7828 earthquakes revealing all type of faulting were used for inversion. For each sub-area, we performed different inversion models with grids from 0.4 × 0.4 km to 2.5 × 2.5 km, and damping values (e) between 0.6 and 1.5. Fig. 7 presents characteristic examples of inversion results for these four sub-areas. As illustrated in Fig. 7a1–a3, changes of e value may induce a slight smoothening of the stress trajectories and, in some places, some variations of the Φ ratio (σ2–σ3)/(σ1–σ3) as well as changes from a strike-slip to a normal regime (or inversely). Nevertheless, σ3 axis remains relatively constant in direction. The best value of the damping parameter (e) would be chosen near the corner of the trade-off curve where both the data variance and model length are relatively small. For the Eyjafjallajökull example, the best e value is thus 0.6 (Fig. 7e). However, there is not a unique solution for such inverse models. Note that, despite the slight changes observable in (a1), (a2) and (a3) of Fig. 7 (for three different e values), the general pattern of stresses remains stable and the data variance as well as the model length changes between those e values remain relatively small.
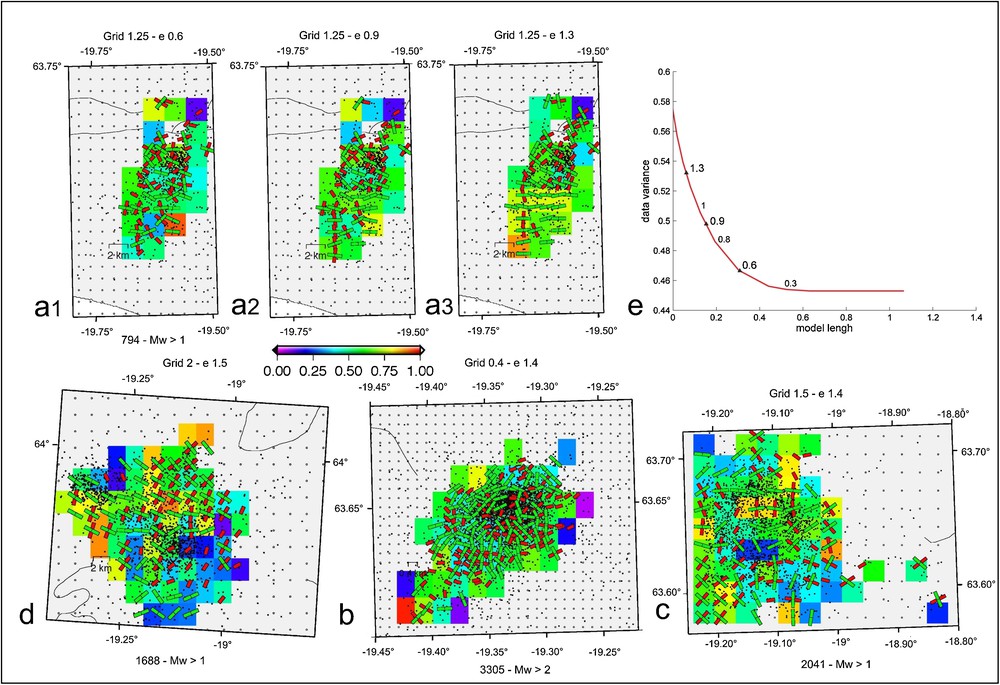
Stress states determined from focal mechanisms inversion around Eyjafjallajökull (a1, a2, a3), Torfajökull (d), and West- (b) and East- (c) Mýrdalsjökull. Eyjafjallajökull trade-off curve (e) between model length and data variance for the full range of possible values of the damping parameter e; black triangles indicate values of e used in the (a1), (a2) and (a3) illustrated examples (Hardebeck and Michael, 2006 method). In the maps, earthquake epicentres are represented by black dots, and nodes of grid are indicated by light grey dots. Horizontal stress axes σ1 and σ3 as represented as red and green bars, respectively, for the strike slip regime. For the normal regime, only σ3 (in green) is represented and then the reverse regime is indicated as σ1 (in red). The shape ratio Φ = (σ2–σ3)/(σ1–σ3) is symbolized by the background color (see gradual color bar scale: 0 ≤ Φ ≤ 1). Grid interval (in km) and damping parameter (e) are noted above each sub-area. The number of earthquakes selected for inversion according to their moment magnitude (Mw) is indicated below each sub-area.
États de contraintes déterminés à partir de l’inversion des mécanismes au foyer dans les secteurs Eyjafallajökull (a1, a2, a3), Torfajökull (d), et Ouest- (b) et Est- (c) Mýrdalsjökull. Courbe d’optimisation entre la norme du modèle et la variance (dispersion) des données pour l’Eyjafallajökull (e) pour l’ensemble des valeurs possibles du paramètre d’amortissement e ; les triangles noirs indiquent les valeurs de e correspondant aux trois exemples montrés en (a1), (a2) et (a3) (méthode Hardebeck and Michael, 2006). Sur les cartes, les épicentres des séismes sont représentés par des points noirs et les nœuds de la grille par des points gris. Les axes des contraintes horizontales σ1 et σ3 sont respectivement figurés par des traits rouges et verts pour le régime décrochant. Pour le régime normal, seul σ3 (en vert) est représenté et de la même manière, seul σ1 (en rouge) est indiqué pour le régime inverse. Le rapport Φ = (σ2–σ3)/(σ1–σ3) est symbolisé par la couleur du fond (voir la barre d’échelle de couleurs : 0 ≤ Φ ≤1). La maille de la grille (en km) ainsi, que le paramètre d’amortissement (e) sont indiqués au-dessus des cartes de chaque secteur. Le nombre de séismes utilisés, en fonction de la magnitude de moment (Mw), est indiqué sous chaque secteur.
Three points deserve consideration:
- • both strike-slip and normal mechanisms are present whatever the applied value of e;
- • some sparse reverses mechanisms exist with σ1 axes parallel with the rift axis implying locally a σ2/σ3 permutation;
- • when the earthquakes are expected directly in connection with the volcanic processes, actually the average stress trajectories obviously match with the regional tectonics.
Further off the volcanoes, the average directions of σ1 (NNE-SSW to NE-SW, when horizontal) and σ3 (WNW-ESE to NW-SE) reflect the state of stresses related to the rift tectonics. The main stress perturbations are well marked close to the central volcanoes (e.g., ring pattern of σ3 around the Katla: Fig. 7b, or inflexions of σ1 trajectory close to the Torfajökull: Fig. 7d) denoting there a close relationship with volcanic phenomena.
4 Discussion
4.1 Association of strike-slip and normal faulting
Comparison between the Upper Pliocene, Pleistocene and active faults, characterized by field measurements of minor faults on the one hand, and focal mechanisms of earthquakes on the other hand, reveals neither major change in the nature of faulting, nor change in the average direction of extension, through time. Both old and present-day faulting include normal and strike-slip modes, with identical direction of extension (σ3). In both past (off-rift) and active rift zones the ratio of strike-slip faults is on the order of 50%, suggesting that these strong similarities in the past and present tectonic regimes result from the same causes. This has already been shown in other regions of Iceland, even apart from the transform zones (e.g., Bergerat et al., 1990; Jakobsdóttir et al., 2009; Plateaux et al., in press) and seems to characterize the general rifting mechanisms in Iceland.
The only important difference relates to the nature and size of the major fractures at the surface. The main faults of the rift zones are of normal type, present multi-kilometric length, and are accompanied by large extensional fractures (often eruptive), as illustrated herein on the aerial photographs (Fig. 5); no major strike-slip faults occurred. On the contrary, in transform zones such as the SISZ, the major faults are of strike-slip type (e.g., Bergerat and Angelier, 2003; Bergerat et al., 1999).
4.2 Stress permutations
Even if strike-slip faults in the rift remain minor structures with little displacements, these features are quite unexpected where only extensional tectonics should prevail, and their abundance at shallow depth, both in the old and present-day rift zones, is mechanically significant. Because of the parallelism of the directions of computed minimum stress axes (σ3) for normal and strike-slip faulting (Fig. 4), the two faulting modes can be associated to the rifting, the only difference consisting in a permutation between σ1 and σ2, implying similar values of stress magnitudes. The mechanical conditions allowing such permutation are various (Hu and Angelier, 2004), such as accommodation of deformation within pre-existing and heterogeneous structural patterns, variations in lateral confining pressure and overburden pressure. Plateaux et al. (in press) have pointed out an uniaxial extensional stress ellipsoid as defined by Angelier (1994) (σ1 = σ2 > σ3 and Φ = 1), to describe the state of stress permitting such permutation in the same rift zone, north of the Vatnajökull. However, the occurrence of reverse mechanisms, even if limited, is also to be taken into account because they may involve σ2/σ3 (uniaxial compressional ellipsoid, Φ = 0) or even σ1/σ3 permutations which cannot be consistent with an uniaxial extension attributed to the rifting processes. In the Icelandic rift where volcanic activity and fluid circulation occur, it is likely that stress changes are partly and locally controlled by fluid overpressure. Particularly, Guðmundsson et al. (2008) described normal faults reactivated with a reverse motion when close to dykes, and demonstrated (by numerical modeling) that overpressured dykes may temporarily change the horizontal stress from σ3 to σ2 or even σ1.
In addition, it has been demonstrated that such fluid overpressure may reduce crustal strength sufficiently so that failure occurred, generating local seismicity (Plateaux et al., in press).
4.3 Direction of extension and spreading
The main computed direction of σ3 axis is roughly perpendicular to the rift axis and consistent with the overall kinematics, i.e., the spreading. Nevertheless its distribution, between N100°E and N155°E (Fig. 3g, h), as well as the scattered trend of the minor normal faults, mainly between N10°E and N55°E (Fig. 3b), reflect some stress perturbations. Because such perturbations are also observed in the present-day stress field (Fig. 7), this suggests a same origin for both these old and present variations in trends (cf. section 4.4).
Even if the EVZ southwest of Torfajökull is not actually a rift zone, the existence and nature of minor faulting and the NW-SE trend of the σ3 axis in this area (Table 1; Fig. 4) validate its probable occurrence as a propagating rift zone, developing and extending southwestward (Guðmundsson, 2007; Guðmundsson and Brynjolfsson, 1993; Sæmundsson, 1979).
The last minor direction of σ3, (N5°E, Fig. 3g, h) is sub-perpendicular to the spreading vector, and thus is inconsistent with the overall kinematics. This corresponds to a stress permutation between σ2 and σ3 and has been observed elsewhere in the Icelandic rift (e.g., Bergerat et al., 1990) where it has been interpreted as a probable result of stress drop, elastic rebound and/or dyke injection.
4.4 Role of Eyjafjallajökull, Katla and Torjajökull volcanoes
In each seismic sub-area (Fig. 7) the trend of σHmax (i.e., σ1 for the strike-slip mechanisms and σ2 for the normal ones) is roughly north-south to NNE-SSW close to the volcano and NE-SW farther away. Thus, the stress trajectories of σHmax issued from the inversion of focal mechanisms of earthquakes show more or less sigmoid patterns (e.g., Fig. 7d) revealing local stress deviations and thus suggesting a possible role of the volcanoes as mechanically disruptive elements. Also the change of the direction of the Eldgjá structures (Figs. 5 and 6) from N20°E close to the Katla to N45°E northward, indicates an effect of the presence of this volcano.
Andrew and Guðmundsson (2008) and Guðmundsson and Andrew (2007) developed some series of numerical finite-elements models, regarding the volcanoes of the EVZ as elastic inclusions softer (low Young's modulus) than the host rock (matrix), and the magma chambers as holes. These authors demonstrated that tensile stress-concentration zones may develop between nearby volcanoes, encouraging the propagation and sharing of dykes and volcanic fissures when the trajectories of σHmax within these zones are favorable, that is, primarily NE-SW. Their models obviously reveal deviations of the stress trajectories which are in good agreement with those displayed by our inversion of earthquake focal mechanisms. Such stress pattern may be an indication that central volcanoes in close proximity may interact mechanically (Guðmundsson and Andrew, 2007) and, in any case, constitutes evidence that volcanoes have a strong role in local deviations of the general stress field. The effect of inclusions on stress distribution has been studied since a long time especially by means of modeling (e.g., Edmonds and Beevers, 1968; McConaughy and Engelder, 1999). The presence of an inclusion (with elastic modulus lower or higher than the matrix) induces stress deviations in its vicinity, both in compressive or extensive environments. The amount of curvature of the fractures (and thus of stress trajectories) is mainly related to the contrast in Young modulus between the inclusion and the matrix (McConaughy and Engelder, 1999).
The scattered directions of σ3 displayed by the inversion of fault slip data in Upper Pliocene-Pleistocene formations of the off-rift areas (corresponding to previous rift zones) can also be explained by such local deviations due to the volcanoes which were active during this old rifting.
5 Conclusion
The multi-methods study which has been carried out here for the EVZ is not a common approach in Iceland where the analyses of the rift zones are generally based entirely on one or another method, and are thus by nature incomplete. The advantage of combining the analyses of different objects (fault-slip data, focal mechanisms, aerial photographs) is that we may access:
- • the structures both at the surface and at depth;
- • the past as well as to the present fracturing mechanisms.
The main points which have been evidenced are as follows:
- • the stress field did not change significantly since the Upper Pliocene and is characterized by an important amount of minor strike-slip faults (about half of the fault population). The occurrence of both normal and strike-slip stress states implies stress permutations which can be explained by the presence of hydrothermal and magmatic fluids producing a significant overpressure. Such mixed strike-slip and normal-slip behavior can thus be considered as characteristic of the volcano-tectonic systems of the Icelandic rift;
- • despite the concentration of the earthquakes around the main volcanoes, the stress states revealed by the inversion of their focal mechanisms obviously demonstrate that they globally reflect the regional stress field, and thus the rifting tectonics;
- • in the off-rift (i.e., old rift) and rift (active) zones of the EVZ, the main direction of extension ranges WNW-ESE to NW-SE, which is consistent with the overall kinematics (the spreading vector being N 105°E). In detail this scattering reflects both the general extensional stress field perpendicular to the main rift structures and local perturbations related to the presence of central volcanoes. The likelihood that nearby volcanoes mechanically interact, as suggested by analytical modeling, is thus reinforced.
Acknowledgements
Financial support was provided by the Arctic Program 316 (IPCROCI) of the French Polar Institute (IPEV). We are indebted to Bergþóra S. Þorbjarnardóttir for her help in providing the earthquakes data of the IMO database. We thank Águst Guðmundsson and an anonymous referee for constructive comments.