1 Introduction
Since the early 1980s, much effort has been devoted to quantifying chemical weathering to better understand the global cycles of the elements, reconstruct paleo-environments and past climate, and to decipher continental and oceanic carbon sinks (Berner, 1995; Walker et al., 1981). Only recently, however, have “elementary mechanisms-based” numerical models of weathering been developed to describe weathering across spatial scales ranging from a few to thousands of kilometers and time scales ranging from tens to more than a hundred thousand years. These mechanistic models have been used to describe weathering processes and fluxes at the watershed scale (Goddéris et al., 2006, 2009), to interpret mineral and aqueous species profiles in weathered regoliths (Brantley and White, 2009; Goddéris et al., 2010; Maher et al., 2009), to quantify the reactive transport of CO2 injected in deep saline aquifers (Daval et al., 2010; Knauss et al., 2005; White et al., 2005; Xu et al., 2005), and to predict the response of a large arctic watershed to future climate change (Beaulieu et al., 2012). These models are based on a rigorous description of the reactive transport occurring in the critical zone taking into account the effects of water drainage. They require the accurate characterization as a function of time of many parameters including rainfall and vertical water fluxes in the critical zone, vegetation and its impact on hydrology and chemical exchange, and mineral reactive surface area in the different soil layers. This study focuses on a critical issue controlling the accuracy of reactive transport modeling: the rate laws selected to describe the kinetics of mineral-water interactions and, in particular, the dependence of mineral dissolution and growth rates on the departure from equilibrium.
Mineral dissolution and precipitation rates are commonly described using (Lasaga, 1995)
| (1) |
2 Mineral dissolution and precipitation rate near equilibrium
Mineral dissolution/precipitation kinetics are often described within the framework of Transition State Theory (TST; Eyring, 1935) which assumes: (1) that reactants have to pass an energy barrier, often referred to as the activated complex, to yield products; and (2) dissolution and precipitation are driven by the direct and reversible attachment of reactants at mineral surface sites as illustrated in Fig. 1c. According to TST, Eq. (1) can be thus rewritten1
| (2) |
| (3) |
In a plot rate versus ΔG, Eq. (2) suggests a simple dependence of dissolution and precipitation rates on ΔG. This behavior is illustrated in Fig. 1a by the green solid and dashed lines. Plotting the rates calculated using Eq. (2) and σ = 1 as a function of solution saturation state Ω (Ω = eΔG/RT) yields a linear dependence for both dissolution and precipitation rates on Ω (Fig. 1b). The linear behavior generated by TST for crystal growth contrasts with the parabolic behaviors induced by spiral growth (r = r+(1–Ω)2, Fig. 1d) or 2-dimensional growth (r = r+exp(–C/lnΩ), Fig. 1e).
Because TST-derived rate laws such as Eq. (2) are usually implemented in geochemical modeling codes describing water-rock interaction, it is essential to assess their capacity in reproducing experimental dissolution and growth data at near-to-equilibrium conditions. With the notable exception of calcite, there are few rate data on rock-forming minerals available at close to equilibrium conditions. Some of these data are shown on Fig. 2. It can be seen that at near-to-equilibrium conditions, boehmite dissolution and growth and quartz dissolution (Fig. 2a and b) closely follow TST-based rate equations, quartz growth (Fig. 2b) exhibits either a linear or parabolic behavior whereas dolomite growth (Fig. 2c, Pokrovsky and Schott, 2001) appears inconsistent with the TST rate equation. Furthermore, the huge dispersion of available data on calcite growth (Fig. 2d) suggests either that no single growth model can describe these data or that potentially other parameters need to be taken into account.

Examples of mineral dissolution and precipitation rates as a function of ΔG. Figure d represents experimental calcite growth rates plotted against rates calculated using Wolthers et al. (2012) model.
Exemples de vitesses de dissolution et croissance de minéraux en fonction de ΔG. Dans la figure d sont reportées des vitesses de croissances expérimentales de la calcite en fonction des vitesses calculées à l’aide du modèle de Wolthers et al. (2012).
3 Magnesite microscopic and macroscopic growth rates
Several studies have used hydrothermal atomic force microscopy (HAFM) to investigate the effect of temperature, pH, and organic and inorganic ligands on magnesite far from equilibrium dissolution mechanisms (Higgins et al., 2002; Jordan et al., 2001, 2007). However, to our knowledge, Saldi et al. (Saldi, 2009, Saldi et al., 2009, 2012) were the only ones to combine HAFM and mixed flow and batch reactors for quantifying magnesite microscopic and macroscopic growth rates to investigate the impact of the crystals surface properties on the reactions mechanisms and rates. HAFM experiments were performed on the (104) cleaved surface of transparent single magnesite crystals using a hydrothermal AFM flow cell working in contact mode than can operate to 150 °C (Higgins et al., 1998). These studies demonstrated that magnesite growth from 80 to 120 °C occurs mainly by defect-assisted nucleation at steps where the concentration of linear defects is high (Fig. 3a), and a spiral growth mechanism controls magnesite precipitation (Fig. 3b and c). Microscopic growth rates deduced from layer generation frequency (Fig. 4a) and macroscopic growth rates measured in a mixed flow reactor are in good agreement (Fig. 4b) and consistent with r = kp(Ω–1)2 and spiral growth step generation controlling magnesite precipitation.
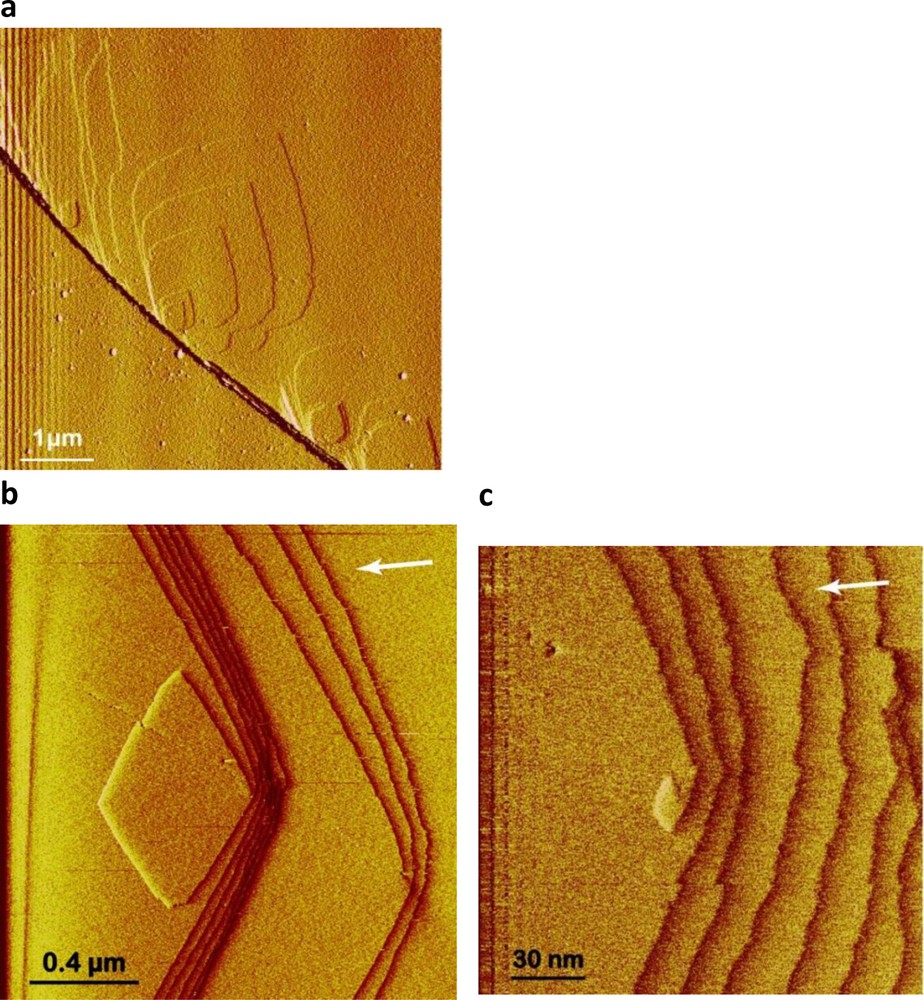
HAFM images showing magnesite growth. a: defect-assisted nucleation at macrosteps where the concentration of linear defects is high; b, c: spiral growth at a screw dislocation (c is the detail at the nucleation centre of image b), T = 100 °C, Ω = 47.3, from Saldi et al., 2009.
Images d’AFM hydrothermale illustrant la croissance de la magnésite à 100 °C et pour Ω = 47,3 (Saldi et al., 2009). a : nucléation assistée par des défauts au niveau de macro-gradins où la concentration de défauts linéaires est élevée ; b, c : croissance en spirale au niveau d’une dislocation vis (c’est un détail de l’image b au centre de la dislocation).
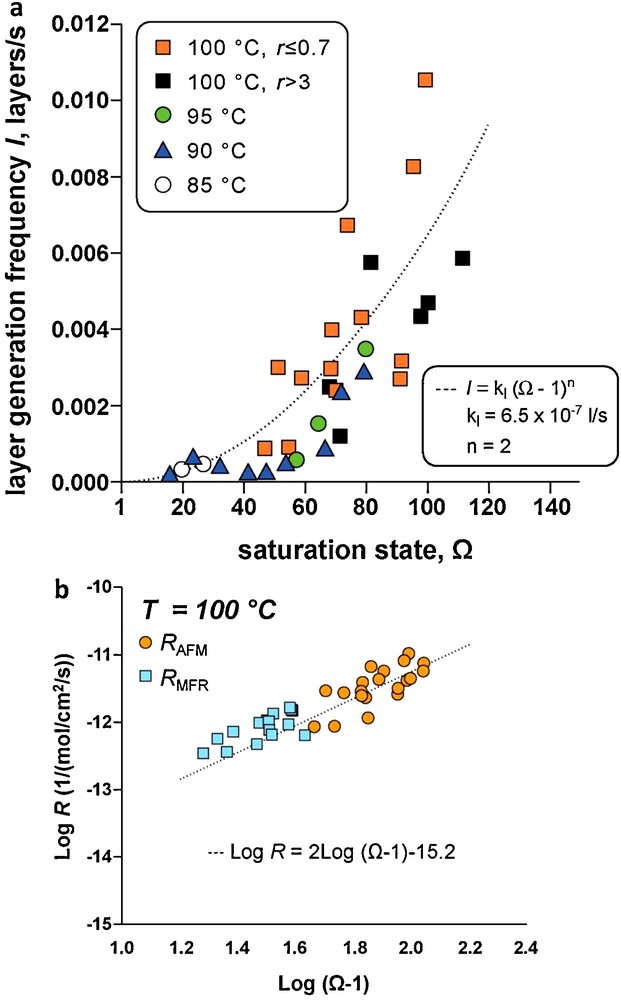
Microscopic and macroscopic growth rates of magnesite. a: Layer generation frequency, I, plotted as a function of saturation state Ω between 85 and 100 °C, the data are consistent with a parabolic dependence of I on Ω (after Saldi et al., 2009); b: comparison between microscopic growth rates (rAFM) and macroscopic growth rates measured in a mixed flow reactor (rMFR) at 100 °C showing both types of rates are in good agreement and consistent with a parabolic rate dependence on Ω (n = 2) (after Saldi et al., 2009).
Vitesses de croissance microscopiques et macroscopiques de la magnésite. a : fréquence de génération de nouvelles couches, l, tracée en fonction de l’état de saturation Ω entre 85 et 100 °C, les données sont compatibles avec une variation parabolique de l avec Ω (d’après Saldi et al., 2009) ; b : comparaison des vitesses de croissance microscopiques (rAFM) et des vitesses macroscopiques mesurées dans un réacteur à circulation (rMFR) à 100 °C: les deux séries de vitesses sont en bon accord et compatibles avec une loi parabolique (ordre de 2 par rapport à Ω), d’après Saldi et al., 2009.
The growth mechanism and rate of synthetic magnesite crystals (5–40 μm, Sgeometric ∼750 cm2/g; Fig. 5a) appear to depend on the availability of active growth sites. This is shown in Fig. 5 which compares the macroscopic growth rates of these synthetic magnesite crystals measured at 150 °C in a mixed flow reactor (Fig. 5b) and in a batch reactor (Fig. 5c). Whereas, magnesite growth rates measured in the mixed flow reactor are proportional to (Ω – 1)2 in accord with a spiral growth control, growth rates measured in the batch reactor are proportional to Ω – 1 with a rate constant about 40 times larger than that measured in the mixed flow reactor. As both experiments were similarly stirred, these distinct growth rates and mechanisms cannot originate in differences in the fluid-mineral interfacial surface area. It seems most likely that these differences originate from the different growth site densities at the crystals surfaces. In the mixed flow reactor, where a supersaturated solution flows on magnesite crystals, there are relatively few growth sites (e.g. pits, kinks, edges, and steps) and crystallization occurs primarily by defect-assisted or 2-dimensional nucleation (Fig. 5d). In the batch reactor experiments, magnesite growth is provoked by a temperature increase following ∼250 h of magnesite dissolution. The initial dissolution step generates active sites that help promote magnesite growth (Fig. 5e). This is further confirmed by HAFM observations of Saldi (2009) on the (104) cleaved surface of a magnesite single crystal showing that: (i) a prior-to-crystallization far from equilibrium dissolution process generates active sites where growth can occur when a supersaturated solution replaces the undersaturated solution; and (ii) magnesite growth quickly stops as dissolution-generated growth sites are destroyed by magnesite growth. Thus, when precipitation occurs after significant dissolution, its rates obeys a linear TST law, but when it occurs via the disruption of a long period of equilibrium, its rates obeys a parabolic rate law (Fig. 5d and e). Note that because active sites are destroyed with time during linear growth, this process is inevitably transient and eventually a spiral growth mechanism will dominate in the long-term.

Comparison of magnesite growth rates measured at 150 °C on the identical magnesite crystals in an open (mixed flow) and in a closed reactor. a: SEM photomicrographs of synthetic crystals (200 °C, pCO2= 50 bars) used in growth experiments; b: magnesite growth rate versus solution saturation state measured in a mixed flow reactor where a supersaturated solution directly flows on the magnesite crystals: a parabolic rate law is observed, consistent with a spiral growth mechanism; c: magnesite growth rate versus solution saturation state measured in a closed reactor where magnesite growth is provoked by a temperature increase following a long (∼250 h) stage of magnesite dissolution: a linear rate law is observed in accord with TST; d: schematic sketch illustrating the distribution of steps, kinks and etch pits on magnesite crystals at the onset of crystallization in the mixed flow reactor; e: schematic sketch illustrating the distribution of reactive sites on magnesite crystals at the onset of crystallization in the closed reactor after the dissolution stage; note that the roughness is significantly higher than for the crystals at the onset of crystallization in the mixed flow reactor (in d).
Comparaison des vitesses de croissance de la magnésite mesurées à 150 °C sur des cristaux synthétiques identiques de magnésite, dans un réacteur à circulation et dans un réacteur fermé. a : image MEB en électrons secondaires des cristaux synthétiques (200 °C, pCO2 = 50 bars) utilisés lors des expériences de croissance ; b : vitesse de croissance de la magnésite en fonction de l’état de saturation de la solution (Ω) mesurée dans un réacteur à circulation où une solution sursaturée s’écoule sur les cristaux de magnésite: une loi de vitesse parabolique, compatible avec un mécanisme de croissance en spirale, est observée ; c : vitesse de croissance de la magnésite en fonction de Ω mesurée dans un réacteur fermé où la croissance de la magnésite est provoquée par une augmentation de température succédant à une longue période (∼250 h) de dissolution des cristaux de magnesite: une loi de vitesse linéaire, compatible avec la TST, est observée ; d : schéma simplifié illustrant la distribution des gradins, kinks, arêtes et puits de corrosion sur les cristaux de magnésite au démarrage de la cristallisation dans le réacteur à circulation ; e : schéma simplifié illustrant la distribution des sites réactifs sur les cristaux de magnésite, au début de la cristallisation dans un réacteur fermé qui succède à une longue période de dissolution; on notera que la rugosité des faces cristallines est nettement plus forte que lors de la cristallisation dans un réacteur à circulation (Fig. d).
4 Near-equilibrium magnesite dissolution rates
Evidence suggests that magnesite near-equilibrium dissolution rates may also depend on active site availability. This is demonstrated by measurements of magnesite dissolution/growth rates at 100 °C and pH = 5.6 using a hydrogen-electrode cell. This cell allows in situ pH measurements to 250 °C with a precision of 10−3 pH units and thus determination of reaction rates very close to equilibrium – i.e. |ΔG| less than a few hundreds J/mol– (Bénézeth et al., 2011). The synthetic magnesite single crystals used in these experiments (Fig. 5a) were originally prepared by Saldi (2009) for the growth experiments shown in Figs. 5b and c. Near-equilibrium (500 ≤ |ΔG| ≤ 6000 J/mol) dissolution and growth rates were determined by perturbing magnesite-solution equilibrium via changing temperature and following the evolution of the system to a new equilibrium. In experiments where precipitation was provoked by the perturbation of the system after a long period of equilibrium (∼452 hrs), it can be seen that magnesite growth follows a parabolic law (rp/mol cm−2 s−1 = 10−14.7(Ω–1)2, Fig. 6a).
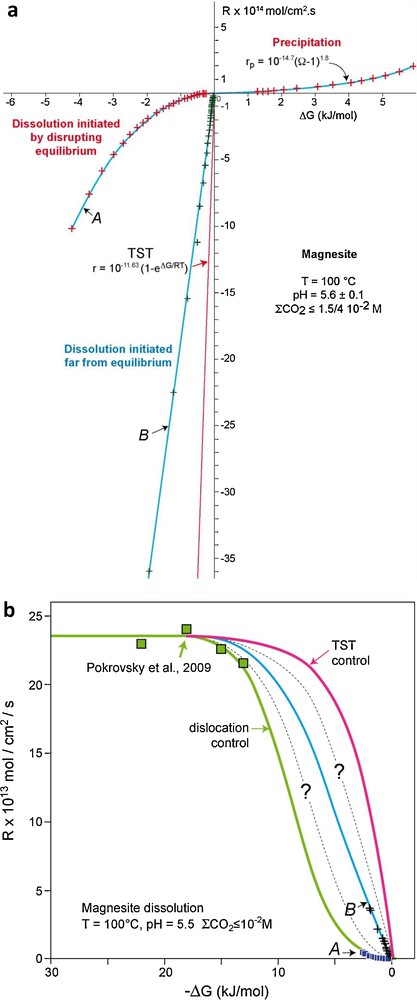
Magnesite dissolution and growth rates measured at near-to-equilibrium conditions at 100 °C and pH = 5.5 in a hydrogen-electrode concentration cell (HECC). a: dissolution and growth rates of synthetic single crystals as a function of ΔG, A: dissolution initiated by perturbing magnesite-solution equilibrium, B: dissolution initiated far from equilibrium; b: magnesite near-to-equilibrium (data from Fig. 6a) and far-from-equilibrium (data from Pokrovsky et al., 2009) dissolution rates as a function of ΔG, the green solid line has been generated using Eq. (4) with parameter values listed in the text, the blue solid line corresponds to a fit of run B data, the red solid line corresponds to the TST rate law whereas the dashed lines represent possible intermediate rate functions.
Vitesses de croissance et de dissolution de la magnésite, mesurées à proximité de l’équilibre à 100 °C et pH = 5.5 dans une cellule potentiométrique à électrode d’hydrogène. a : vitesses de croissance et de dissolution de monocristaux synthétiques en fonction de ΔG, A : dissolution initiée par perturbation de l’équilibre magnésite-solution, B : dissolution initiée loin de l’équilibre ; b : vitesses de dissolution de la magnésite à proximité de l’équilibre (données de la Fig. 6a) et loin de l’équilibre (données de Pokrovsky et al., 2009) en fonction de ΔG ; la ligne continue verte a été engendrée à l’aide de l’Éq. (4) et des valeurs de paramètres reportées dans le texte, la ligne continue bleue a été tracée à partir des données de l’expérience B, la ligne continue rouge correspond à la loi de vitesse dérivée de la TST, tandis que les lignes en pointillés correspondent à des lois de vitesses intermédiaires.
The slow near-equilibrium dissolution rates reported in Fig. 6a (curve A) are inconsistent with the direct detachment/attachment of reacting units at reactive sites (e.g. Eq. (2)). Indeed, in a plot dissolution rate versus ΔG there is a striking discontinuity between these near-to-equilibrium rates (A, small squares in Fig. 6b) and magnesite far from equilibrium rates (|ΔG| > 12 kJ/mol) measured at the same temperature and solution composition by Pokrovsky et al. (2009) (big squares in Fig. 6b). Rate data reported in Fig. 6b suggests a change in controlling dissolution mechanism as equilibrium is approached. Interestingly, a duplicate experiment performed using the same hydrogen concentration cell, temperature, solution pH, and synthetic magnesite crystals but initiated far from equilibrium instead of by perturbing a long-term equilibrium resulted in significantly faster near-equilibrium dissolution rates intermediate between TST-derived rates and curve A (see the B curve and crosses in Fig. 6a and b).
As proposed two decades ago by Schott et al. (1989), the bulk crystal dissolution is the result of parallel reactions occurring at active surface sites located at edges, corners, surface pits, points defects, twins or grain boundaries, microfractures, etc. The relative concentration of these different active sites and the rate constant of each process will determine the overall bulk dissolution rate (Fig. 7). In addition, the relative contribution of each parallel process will change as the chemical affinity of the mineral dissolution reaction decreases. For example, at extremely undersaturated conditions (Ω < Ωcrit1) pits can be nucleated on smooth surfaces via two-dimensional nucleation.2 At slightly lower undersaturation (Ωcrit1 < Ω < Ωcrit2), the driving force for dissolution is large enough to nucleate pits at dislocation outcrops but not on smooth surfaces. As the dissolution reaction further develops and Ω falls below Ωcrit2, etch pit nucleation should largely stop (Frank, 1951), and the contribution to overall dissolution of steps generated at dislocation outcrops should become insignificant. It can be expected that the contribution to crystal dissolution of other high energy surface sites, including point defects, grain boundaries and twin boundaries, microfractures, will also depend on their respective density, rate constant and Ωcrit values. The lack of information on: i) the energetics and distribution of the different active sites present on mineral surfaces; and ii) their temporal evolution, prevent the rigorous modeling of the dissolution of magnesite synthetic single crystals as a function of Ω. However, a much simplified approach, initiated by Burch et al. (1993) and rationalized by Lasaga and Luttge (2001), Beig and Lüttge (2006), and Hellmann and Tisserand (2006) allows the approximation of the dependence of magnesite dissolution rate on ΔG exhibited in Fig. 6b. Because of the paucity of reactive sites on the surfaces during experiment A, it is assumed that magnesite dissolution is defect-driven and controlled by two parallel reactions. Far from equilibrium (|ΔG| > 12 kJ/mol), magnesite dissolution is driven by the nucleation at dislocation outcrops of etch pits that are the source for steps traveling across the crystal surface (Lasaga and Luttge, 2001). Closer to equilibrium, below a critical ΔG (Ωcrit) value, etch pits stop nucleating and dissolution occurs only at pre-existing edges and corners at a much lower rate. According to this reaction scheme, the magnesite dissolution rates reported in Fig. 6b can be described by the following rate law representing the sum of the two parallel reactions mentioned above (Burch et al., 1993; Hellmann and Tisserand, 2006):
| (4) |
This review of microscopic and macroscopic dissolution and growth rates indicate that the rate controlling mechanisms for magnesite depends on the availability of reactive sites on the mineral surface, which itself can be related to the treatment of the surface before the experiment. A pre-etching treatment, creating active surface sites, can affect the dissolution and growth mechanism and thus the dependency of rates on the deviation from equilibrium.
5 Evidence that the Gibbs free energy dependencies of crystal growth and dissolution vary with the active sites density and the crystal history
The dissolution and growth rate behavior of a number of other minerals can be used to confirm the generality of the mechanisms and rate laws identified for magnesite at near-to-equilibrium conditions.
5.1 Minerals of high specific surface areas and surface roughness
Near-equilibrium rate data available on the growth and dissolution of hydroxides, hydroxycarbonates and clay minerals having high surface areas indicate that these minerals generally follow TST laws with a linear dependence of rates on solution saturation state. The rate data of boehmite (Fig. 2) and gibbsite (Bénézeth et al., 2008; Fig. 8a) are illuminating, as they were obtained at near-to-equilibrium conditions (|ΔG| ≥ 200 J/mol) and they show growth rates consistent with the reverse of dissolution (thus verifying the principle of detailed balancing at equilibrium). Rate laws consistent with TST have been also observed for brucite growth (Pokrovsky and Schott, 2004) and very recently for hydromagnesite (Fig. 8b, Gautier, 2012) and kaolinite (Fig. 8c; Gudbrandsson et al., 2012; Nagy et al., 1991; Yang and Steefel, 2008) growth. TST rate laws may describe these rates because sufficient reactive sites are available at the crystal edges, which generally control the dissolution and growth of these minerals, thus allowing reactions to proceed via the direct and reversible detachment/attachment of reactants at the surface sites over the full range of chemical affinity. As a result, a TST-derived rate law like that given by Eq. (2) can accurately describe the Gibbs free energy dependence of the rate of dissolution/crystal growth of minerals like hydroxides, hydroxycarbonates and clays that generally exhibit high surface area and roughness. Note that the expression of the forward rate constant r+, and in particular its dependence on fluid composition and temperature, is given by Eq. (2,3), which itself is in accord with the TST theory coupled with surface coordination chemistry (e.g. see Oelkers, 2001; Pokrovsky et al., 2009; Schott et al., 2009; Stumm, 1992).

Growth rate of gibbsite (a), hydromagnesite (b) and kaolinite (Si rates, Nagy and Lasaga data at 80 °C were extrapolated to 25 °C with ΔEk(kaol) = 52 kJ/mol) (c) plotted as a function of solution saturation state (Ω). Note the linear dependence of growth rates on Ω normalized to the stoichiometry of the mineral formula, in accord with transition state theory and Eq. (2).
Vitesse de croissance de la gibbsite (a), hydromagnésite (b) et kaolinite (vitesses basées sur Si, les données de Nagy et Lasaga à 80 °C ont été extrapolées à 25 °C avec ΔEk(kaol) = 52 kJ/mol) (c) tracées en fonction de l’état de saturation de la solution, Ω. Noter, en accord avec la TST, la variation linéaire des vitesses de croissance avec Ω normalisé à la stoechiométrie du mineral.
5.2 Minerals of low surface area and roughness
There is much evidence that minerals having low surface roughness and high surface energy have similar dissolution and growth rate behavior as a function of saturation state as magnesite. Such minerals exhibit either linear TST or sigmoidal/parabolic laws depending on the reactive site availability and on the protocol used to quantify their dissolution and growth rates. Feldspar dissolution as a function of the departure from equilibrium, which has been investigated in several careful studies, provides a good example of these dual mechanisms and behaviors. Oelkers et al. (1994) and Gautier et al. (1994) found that albite and K-feldspar dissolution as a function of ΔG at 150 °C and pH 9 can be described by a single continuous function and follows a TST-based rate law (Eqs (2), (3)). In contrast, Burch et al. (1993) and Hellmann and Tisserand (2006) found a sigmoidal relationship between albite dissolution rate (80 °C/pH 8.8 and 150 °C/pH 9.2) and chemical affinity, consistent with a dislocation control of dissolution.3 These different behaviors may result from different experimental protocols although all studies were performed in mixed flow reactors. In the Oelkers et al. (1994) and Gautier et al. (1994) rate measurements, the variation of ΔG for a given feldspar powder and Si and Al concentration of the inlet solution was achieved by varying the fluid flow rate. In contrast, each Burch et al. (1993) rates was determined with a non-reacted powder and a single inlet fluid flow rate and composition, while Hellmann and Tisserand (2006) operated using much lower fluid flow rates than the previous studies which correspond to much higher residence time of the reacting solution in the reactor. It is possible that high fluid flow rates preceding low fluid flow rates in the Oelkers et al. (1994) and Gautier et al. (1994) measurements favored the preservation of active sites compared with the longer duration measurements of Hellmann and Tisserand (2006) which were run up to 640 days at close to equilibrium conditions. This hypothesis is in accord with the results of Gautier et al. (2001) showing that the BET surface area normalized dissolution rate of a quartz powder at 200 °C is reduced by 5.6 over one year of dissolution.
Note that even though in the absence of abundant reactive sites rates can be described by “defect-assisted” rate laws, the TST/SC approach is necessary to describe the chemical reactions occurring at these reactive sites. For example, in the case of the alkali feldspars and kaolinite the rate controlling surface species is formed by the removal of Al from the reactive sites. In such cases, dissolution is inhibited by increasing aqueous Al activity. This Al inhibition can have an important impact on the rate-f(ΔG) function, resulting, for example in the case of kaolinite dissolution at 150 °C, in a ‘sigmoidal behavior’ analogous to that attributed to the dislocation control of dissolution (Devidal et al., 1997). This is illustrated in Fig. 9, which compares the dependence on chemical affinity of kaolinite dissolution/precipitation rate and albite dissolution rate determined at 150 °C by Devidal et al. (1997) and Hellmann and Tisserand (2006), respectively.
The impact of mineral preparation methods on the form of the f(ΔG) function is illustrated for the case of quartz growth and dissolution in Fig. 2b at 200 °C (Gautier, 1999). It can be seen that when crystals are pre-dissolved for several months at 200 °C in distilled water, quartz growth follows a linear TST rate law but when quartz crystal are not pre-dissolved beforehand, a parabolic rate law is observed with a lower growth constant, consistent with a spiral growth mechanism. Preliminary etching of the quartz powder generates growth sites (i.e. at steps, edges and corners) where aqueous silica species can directly adsorb for a transient period of time. Similarly, Arvidson and Lüttge (2010) found that pre-etching of albite crystals for several tens of hours in a disodium tetraborate solution resulted in a significant increase of albite near-equilibrium dissolution rates at 80 °C and pH 8.8.
These observations suggest that the form of the f(ΔG) function describing the growth and dissolution of minerals having well-developed high surface energy smooth faces – i.e. anhydrous carbonates, quartz, feldspars… – depends on the availability of reactive sites at the crystal surface and thus on the history of the mineral-fluid interaction and the hydrodynamic conditions under which the crystals are reacted. However, regardless of the reactive site availability and the form of the f(ΔG) function, the TST-derived Eq. (3) needs to be used to describe the forward rate – i.e. the chemical reactions occurring at the reactive sites and the possible subsequent catalytic (H+, organic ligands…) or inhibitory effects (e.g. Al on aluminosilicates) of dissolved species on the overall rate.
6 Impact of dissolution/growth rate laws on the prediction of the influence of climate change on future weathering rates
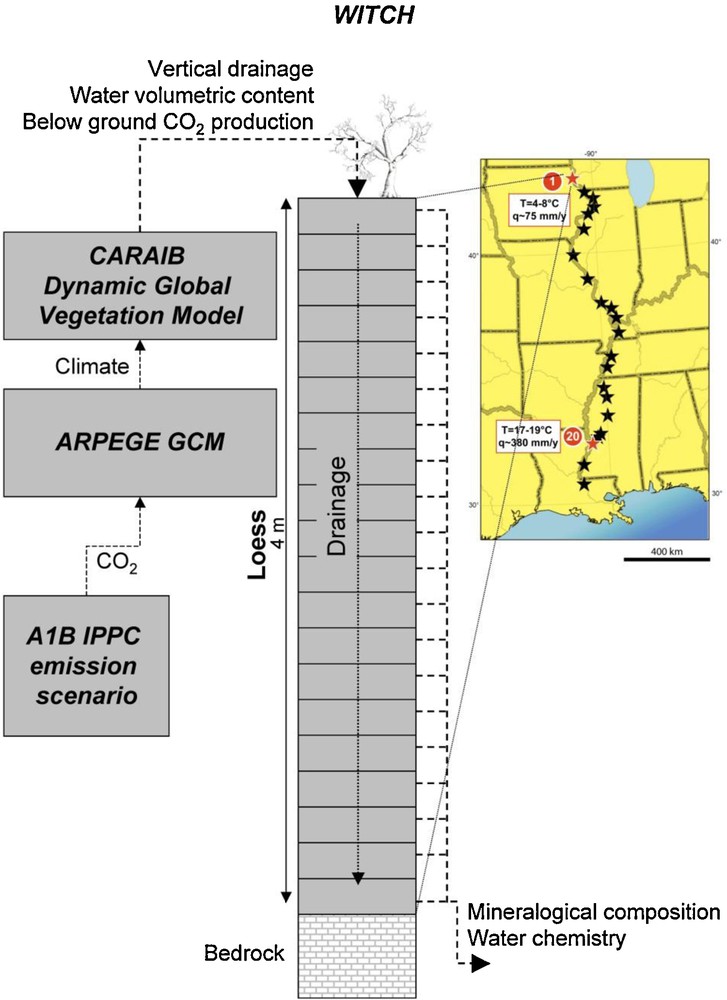
To illustrate the possible impact of these distinct rate laws on calculated weathering rates, we have modeled the elemental fluxes generated by the weathering of the Mississippi valley Peoria loess for the next one hundred years using a suite of climate (ARPEGE, Gibelin and Déqué, 2003; Salas et al., 2005), vegetation (CARAIB, Dury et al., 2011) and chemical weathering (WITCH, Goddéris et al., 2006, 2010) models (Fig. 10). The WITCH numerical model, coupled to the GENESIS climate model, has been already used to calculate the weathering rates of the Peoria loess over the last 10 kyr for two sites located at the northern and the southern ends of the Mississippi Valley, respectively (Fig. 10). This model was able to reproduce the time evolution of the mineral distribution in the two sites (Goddéris et al., 2010). WITCH, with its implemented TST rate laws, has been used recently to predict the effect of climate change on the weathering processes in the Peoria loess over the next century (Goddéris et al., 2012). Here, we briefly present the impact on calculated mineral weathering rates and element export for the northern and southern pedons of replacing in WITCH the TST rate law by a dislocation-assisted rate law. The present pedons mineralogy is reported by Goddéris et al. (2010). The main minerals are quartz, albite, K-feldspar, montmorillonite, and kaolinite. In this study we have examined the impact of the two different rate laws on albite, K-feldspar, and dolomite reactivity. The reactivity of quartz and clay minerals was only described by TST because quartz dissolution does not significantly contribute to the silica budget and the reactivity of the poorly crystallized clay minerals is not likely to be controlled by dislocations (Section 5). The TST rate law and the kinetic parameters for the minerals investigated in this study are reported in Godderis et al. (2010). The dislocation-assisted law was obtained by replacing the f(ΔG) function of the TST law by the expression given in Eq. (4) with values of the ratio k+,1/k+,2 and of the parameters n, m1 and m2, assumed to be temperature independent, taken from Hellmann and Tisserand (2006) for the feldspars and this study for magnesite (assuming they are the same for dolomite). Values of the forward rates r+,i in Eq. (4) were calculated using Eq. (3) together with parameters reported in Goddéris et al. (2010). Dolomite was allowed to grow4 with either a linear (rp,l/mol cm−2 s−1 = S × 7 × 10⁻⁶ × e−60000/RT(ΩDolo–1)) or parabolic (rp,p/mol cm−2 s−1 = S × 10−7 × e−60000/RT(ΩDolo–1)2) rate law. Clay mineral growth occurs according to a TST rate law and the feldspars were not permitted to precipitate.
The time evolution of the saturation state (Ω) of the soil solutions of the north pedon with respect to albite, calculated with the TST and dislocation-assisted laws is shown on Fig. 11a and b, respectively. The evolution of drainage in the same pedon is shown in Fig. 12. It can be seen that drainage exerts a strong control on Ω independent of the selected rate law. A strong increase of Ω is observed in the first meter of the pedon mainly due to the vertical drainage reduction induced by evapotranspiration. Large temporal Ω variations are linked to high drainage pulses interspersed with periods of low drainage. Note also the sharp Ω front below 3 m, coincident with the appearance of dolomite and the subsequent increase of solution pH. A remarkable feature of these simulations is the large decrease in Ω values linked to the replacement in WITCH of the TST rate law by the dislocation law. Plots of albite dissolution rates as a function of time and soil depth (Fig. 13) confirm the high sensitivity of the model results to the selected rate law. This is particularly obvious in the shallowest 1 m where ‘dislocation’ weathering rates are up to one order of magnitude lower than TST rates. This occurs because albite weathering rates calculated with the dislocation law drop faster with chemical affinity than TST-based rates. For example, for ΔG = –10 kJ/mol (Ω = 0.018) albite “dislocation” rates are about 20 times lower than TST rates. The “dislocation” rate law also affects K-feldspar weathering rates but only slightly alters dolomite weathering rates. Because of dolomite's higher reactivity (at 25 °C and pH 6, dolomite far-from-equilibrium dissolution rates are about 4.5 orders of magnitude higher than those of albite), soil solutions rapidly attain equilibrium with dolomite (or can become supersaturated); dolomite weathering is thus transport-controlled and almost independent of the kinetic model selected to calculate its dissolution/precipitation rates. Note that, unlike dolomite, calcite's overall reaction rate could be affected by the growth model used in the model calculation because it exhibits a high growth rate at ambient temperature (between 4 and 5 orders of magnitude higher than that of dolomite). The selected rate law for calcite growth could thus significantly affect the calculated impact of the weathering of this mineral on CO2 budget.
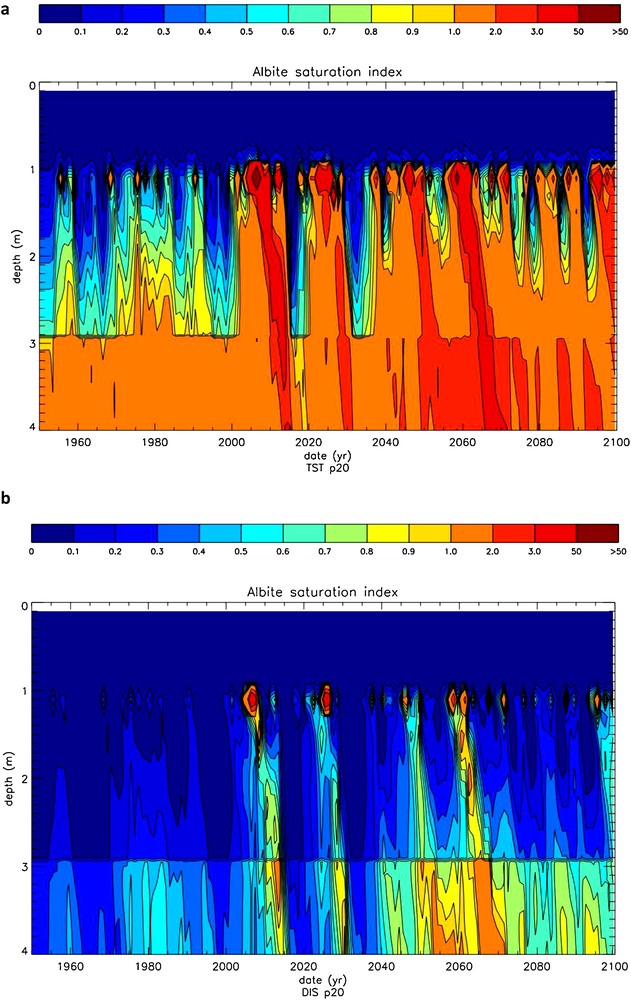
Time evolution of the saturation state of the soil solutions of the northern pedon with respect to albite as a function of depth. a: calculations using the TST-based rate law; b: calculations using the dislocation-based rate law.
Evolution temporelle en fonction de la profondeur de l’état de saturation des solutions de sol du pédon nord par rapport à l’albite. a : calcul avec une loi de vitesse dérivée de la TST ; b : calcul avec une loi de vitesse basée sur un contrôle par les dislocations.
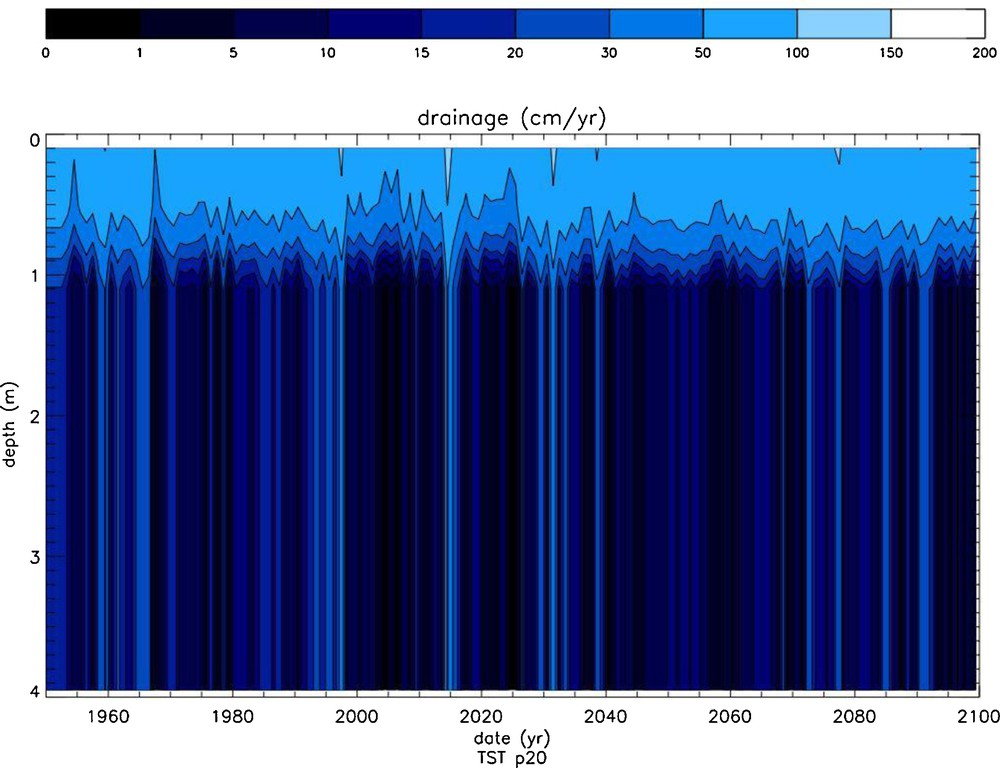
Time evolution as a function of depth of vertical drainage in the northern pedon.
Évolution temporelle en fonction de la profondeur du drainage vertical dans le pédon nord.

Albite weathering rate as a function of time and depth in the northern pedon. a: calculations using the TST-based rate law; b: calculations using the dislocation-based rate law.
Vitesse d’altération de l’albite en fonction du temps et de la profondeur dans le pédon nord. a : calcul avec une loi de vitesse dérivée de la TST ; b : calcul avec une loi de vitesse basée sur un contrôle par les dislocations.
Predicted albite annual weathering rates and its 10-year moving average in the south and north pedons, calculated using the TST and “dislocation” rate laws, are contrasted in Fig. 14. In the south pedon, besides a temporal increase of albite weathering rates (and related CO2 consumption) for both rate laws, it can be seen that rates calculated using TST-based rate equations are about three times faster than those calculated using “dislocation” rate equations. In the north pedon, use of the TST rate law again results in faster albite weathering rates by about 500%. Whereas use of the “dislocation” rate laws suggest that weathering rates increases by about 17% between 1950 and 2090, TST-based rates suggest they drop by about 30% over the same time period. Because more frequent dry events (e.g. low drainage periods) occur after the year 2000, soil solutions below 1 m depth more regularly become supersaturated with respect to albite using the TST versus the “dislocation” rate equation (Fig. 11a), and albite weathering rates decrease considerably at depths below 1 m (Fig. 13a). In TST model calculations, unlike in “dislocation” model calculations, after the year 2000, the increased albite weathering rates in the soil top layers cannot match the near lack of dissolution at greater depths (Fig. 13a).
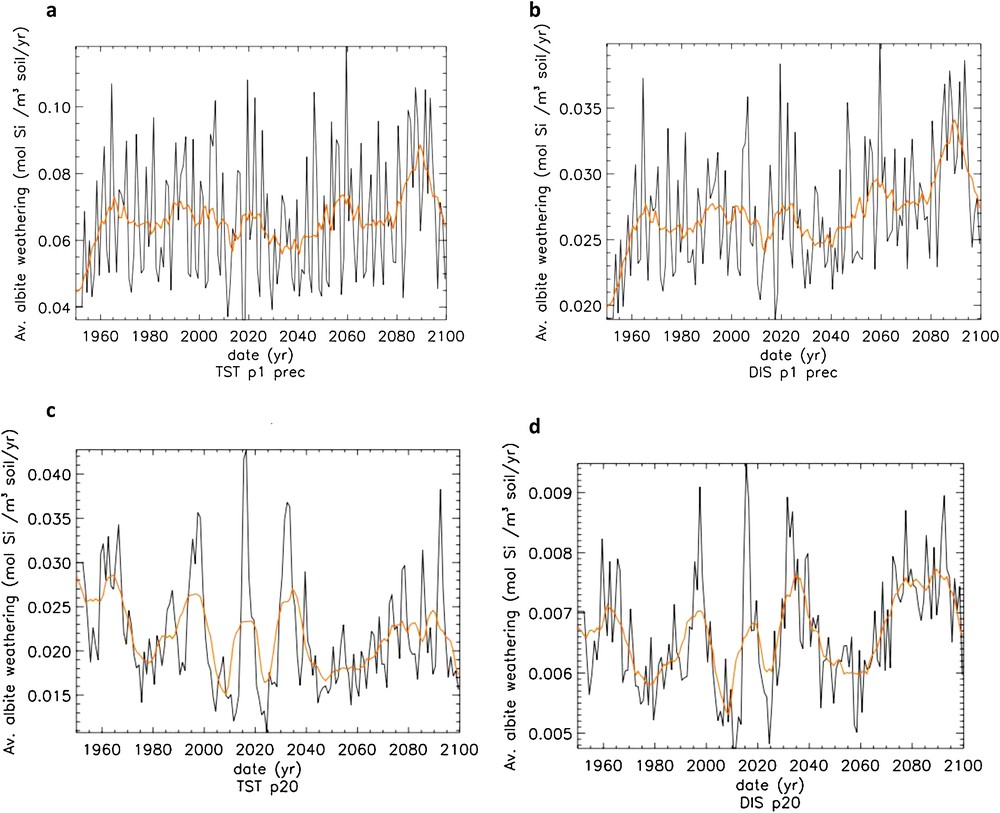
Mean annual weathering rate (black curve) and 10 years moving average of the annual weathering rate (yellow curve) of albite over the whole profile of the southern (a, b) and northern (c, d) pedons. (a, c) TST-based rate law; (b, d) dislocation-based rate law.
Moyenne annuelle (courbe noire) et moyenne mobile par pas de dix ans (courbe jaune) de la vitesse d’altération de l’albite intégrée sur l’ensemble du profil du pédon sud (a,b) et nord (c,d) basée sur une loi de vitesse dérivée de la TST (a,c) ou basée sur un contrôle par les dislocations (b,d).
The large variation of annual albite (and K-feldspar) weathering rates (Fig. 14) is due to the extensive variation of vertical drainage in response to changes in rainfall and evapotranspiration. It should be noted that the rapid succession of droughts and flood events can also modify the density of reactive sites on the feldspar surfaces, change the dissolution rate controlling mechanism, and thus could magnify the temporal variations in feldspars weathering rates.
In summary, the results of these model calculations demonstrate that the calculated response to future climate change on weathering rates is highly sensitive to the identity of the equations adopted to describe the dependence of mineral dissolution/growth rates on the distance from equilibrium. This result demonstrates that the quantification of future CO2 consumption by continental weathering requires the accurate quantitative characterization of the reactivity of primary and secondary minerals at the near-to-equilibrium conditions typical of natural soil solutions.
7 Concluding remarks
Results presented in this study on the near equilibrium (ΔG < 1 kJ/mol) dissolution/growth of oxide, hydroxide, carbonate and silicate minerals indicate that the form of the function describing dissolution and growth rates as a function of the distance from equilibrium depends on the availability of reactive sites on the mineral surface. Gibbsite, boehmite, brucite, hydromagnesite, kaolinite, have sufficient reactive sites such that their dissolution and growth rates closely follow a classical TST rate law at close to equilibrium conditions (|ΔG| < 0.5 kJ/mol). In contrast, the growth and dissolution rates of magnesite and quartz crystals, whose smoother surfaces contain far fewer active sites, exhibit either a parabolic or a linear TST-type dependence on Ω depending on the treatment they endured before reaction. It follows that the form of the f(ΔG) function describing the dissolution and growth of these minerals, as well as that of other well crystallized minerals such as calcite and feldspars, likely depends not only on the chemical reactions at reactive sites to form the activated complexes but also on the availability of these reactive sites at the crystal surface and thus on the history of the mineral fluid interface (especially the hydrodynamic conditions under which the crystals have been reacted).
The modeling of the weathering of the Mississippi valley Peoria loess for the next one hundred years shows that the form of the rate-f(ΔG) function can have a major impact on the calculated elemental fluxes generated by weathering. Accurate knowledge of the drainage and transient drainage events (droughts, pulses of high/low drainage) is also critical for predicting weathering rates.
The lack of information on the number and the distribution of the reactive sites on mineral surfaces, and the absence of reliable crystal surface energy data (note, for example, that available calcite surface energy values range from 0.1 to 2.7 J/m2, Forbes et al., 2011) presently hamper the accurate prediction of mineral-water interactions, especially near equilibrium.
Because the crystal surface roughness has the potential for being a good proxy of the reactive site density, the characterization of growth and dissolution requires both microscopic and macroscopic scale measurements. In addition, the characterization of the surface roughness and its temporal evolution is critical.
Acknowledgements
This study would have not been possible without the careful studies on the kinetics of mineral dissolution and growth performed in our laboratory by Oleg S. Pokrovsky, Giuseppe Saldi, Quentin Gautier, Jean-Marie Gautier and Jean-Luc Devidal. We are grateful to Christine Cavaré-Hester for her help in the realization of the illustrations. François Guyot is thanked for his perceptive and insightful comments on the first version of this manuscript. We thank Bertrand Fritz for bringing interesting articles to our attention. J.S. thanks Damien Daval for stimulating discussions on leached layers and sigmoidal rate laws.
1 Note that Eq. (2) is based on the assumption that a single rate-determining step controls the overall rate for all ΔG values or steady-state conditions are met, and the magnitude of ΔG for each elementary reaction is not significantly greater than RT (Nagy et al., 1991). Illustration of the dependence of mineral dissolution and growth rates on the distance from equilibrium for different reaction mechanisms. a: dissolution and precipitation rate as a function of the Gibbs free energy (ΔG) of the mineral dissociation reaction; the symbols represent quartz dissolution rates at 300 °C and pH 6 (Berger et al., 1994); b: dissolution and precipitation rates plotted as a function of the mineral solution saturation state (Ω); c: illustration of the linear growth mechanism consistent with the Transition State Theory; d: illustration of the defect-assisted nucleation; e: illustration of the two-dimensional growth. Illustration de la variation de la vitesse de dissolution et croissance d’un minéral en fonction de l’écart à l’équilibre, pour différents mécanismes réactionnels. a : vitesse de dissolution et croissance en fonction de l’énergie libre de Gibbs (ΔG) de la réaction de dissociation du minéral ; les symboles représentent la vitesse de dissolution du quartz à 300 °C et pH 6 (Berger et al., 1994) ; b : vitesses de dissolution et croissance en fonction de l’état de saturation Ω de la solution par rapport au minéral ; c : illustration du mécanisme de croissance linéaire compatible avec la TST ; d : illustration de la nucléation assistée par des défauts ; e : illustration de la nucléation bidimensionnelle.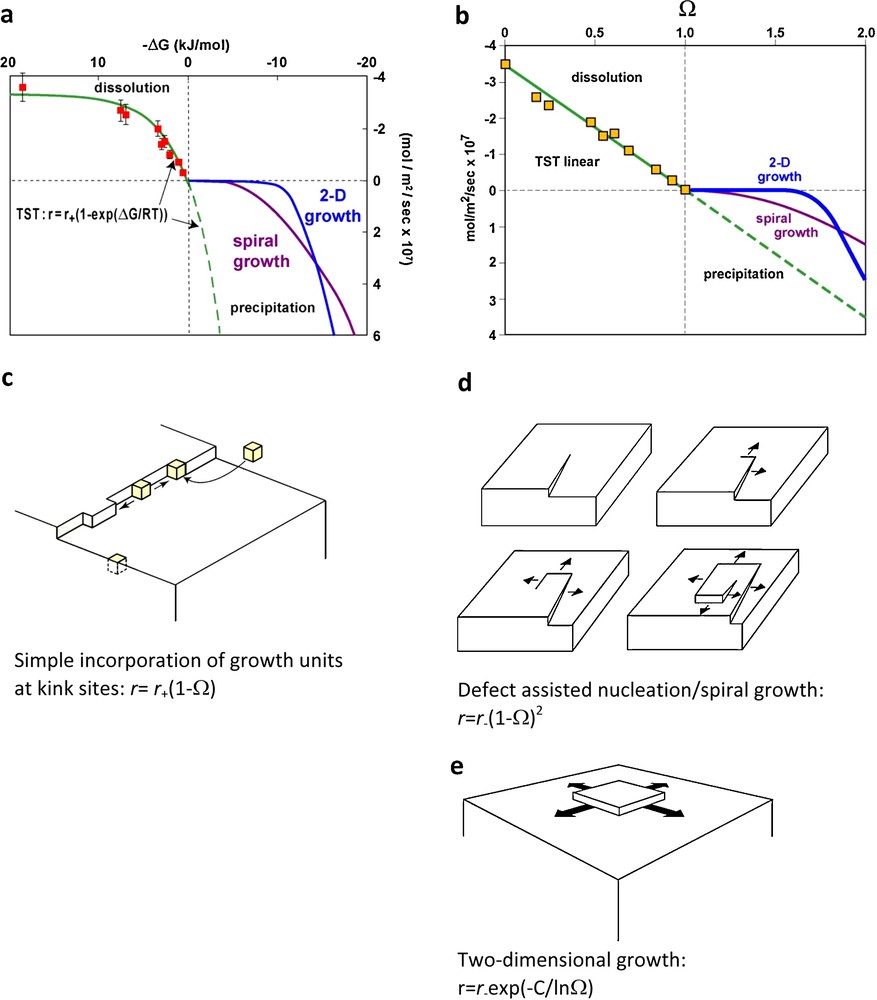
2 At very high undersaturation, 2 D nucleation could overwhelm pit formation at dislocations, thus explaining the weak impact of dislocation density on far from equilibrium dissolution rates, an apparent paradox noted by Schott et al. (2009) (see also Xu et al., 2012). Schematic illustration of the parallel processes involved in crystal dissolution. The horizontal length of each arrow indicates the relative rate of each process (actual rates can differ by several orders of magnitude); the vertical thickness of each arrow represents the relative amount of material released in solution by that process (modified after Schott et al., 1989). Illustration schématique des processus parallèles impliqués lors de la dissolution d’un cristal. La longueur horizontale de chaque flèche indique la vitesse relative du processus considéré (noter que les vitesses véritables peuvent différer de plusieurs ordres de grandeur) ; l’épaisseur verticale de chaque flèche représente la quantité relative de matière libérée en solution par le processus considéré (modifié d’après Schott et al., 1989).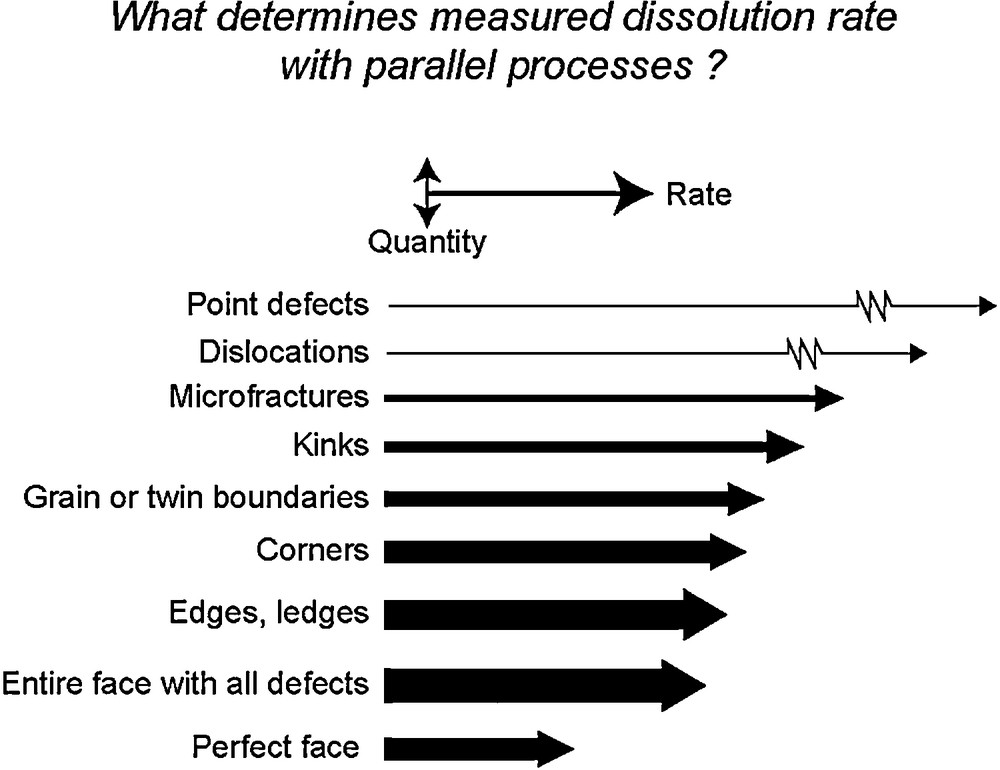
3 Note, however, that inhibition by aqueous Al of dissolution at reactive sites may contribute to the observed ‘sigmoidal’ behavior as the expressions of r+,1 and r+,2 in Eq. (4) are given by Eq. (3) (see also Fig. 9). Kaolinite dissolution/precipitation rates at 150 °C and pH = 2 (Devidal et al., 1997) and albite dissolution rates at 150 °C and pH = 9.2 (Hellmann and Tisserand, 2006) as a function of the Gibbs free energy of the mineral dissociation reaction. Kaolinite: diamonds and squares stand for Al/Si free and [Al] = [Si] inlet solutions; the dashed curve was generated using Eqs. (2) and (3) consistent with TST. Albite: the solid line represents a fit of experimental data to Eq. (4) consistent with the opening of dislocations to form etch pits controlling albite dissolution kinetics. Vitesses de dissolution/croissance de la kaolinite à 150 °C et pH = 2 (Devidal et al., 1997) et vitesse de dissolution de l’albite à 150 °C et pH = 9,2 (Hellmann et Tisserand, 2006), en fonction de l’énergie libre de Gibbs de la réaction de dissociation du minéral. Kaolinite: les losanges et les carrés représentent respectivement des solutions réactives d’entrée sans Al et Si et avec [Al] = [Si] ; la courbe en pointillés a été engendrée à l’aide des Eqs. (2) et (3) de la TST. Albite : la courbe continue représente un ajustement aux données expérimentales à l’aide de l’Eq. (4) compatible avec un contrôle de la dissolution par la nucléation de puits de corrosion à l’affleurement des dislocations.
4 As dolomite and clay minerals (montmorillonite and kaolinite) were present in the soil profiles undergoing weathering, we assumed for the sake of simplicity that their precipitation occurs only via crystal growth (see Noguera et al., 2006 and Fritz et al., 2009 for the simulation of secondary phase nucleation during weathering). Structure of the weathering model used to describe the reactive transport in the critical zone. The model is run for two sites of the Mississippi valley Peoria loess (42°59′N and 30°59′N). Structure du modèle d’altération utilisé pour décrire le transport réactif dans la zone critique. Le modèle est appliqué à deux sites du lœss Peoria de la vallée du Mississippi (42°59′N et 30°59′N).