

1 Introduction
Over the past several decades, the Himalaya have been the focus of numerous studies examining interactions among climate, erosion, and tectonics at a broad range of spatial and temporal scales (Bookhagen et al., 2005; Brozovic et al., 1997; Duncan, 1997; Duncan et al., 1998; Finlayson et al., 2002; Finnegan et al., 2008; Grujic et al., 2006; Molnar et al., 1993; Montgomery and Stolar, 2006; Thiede et al., 2004). Such studies have been encouraged by key characteristics of the Himalaya: broad ranges in rates of deformation and in topographic attributes, strong spatial gradients in the dominant geomorphic processes, a prominent monsoon, and a geomorphic and stratigraphic record that indicate large-scale temporal changes in sediment fluxes (Goodbred and Kuehl, 1999; Pratt et al., 2002). These characteristics have been augmented by the increasing availability of higher resolution data on topography (Farr et al., 2007), climate (Anders et al., 2006; Bookhagen and Burbank, 2006), geodesy (Bettinelli et al., 2008), chronology of geomorphic events (Bookhagen et al., 2006; Burbank et al., 1996; Owen et al., 2008), and both long- and short-term erosion rates (Brewer and Burbank, 2006; Galy and France-Lanord, 2001; Huntington and Hodges, 2006; Huntington et al., 2006; Vance et al., 2003; Whipp et al., 2007). Together, these new data and the dynamic Himalayan landscape and climate set the stage for illuminating studies of climate-erosion-tectonic interactions.
Despite improved quantification of these interactions, numerous gaps remain. For example, holistic overviews of the monsoon, its spatial character, its importance in the annual water cycle, and the controls exerted by topography on the monsoon are uncommon. Few studies have examined the spatially variability of short-term erosion rates or how closely this variability is coupled to spatial variability in climate, topography, or tectonics. The nature of geomorphic thresholds in the Himalaya and their modulation of erosion processes and rates remain largely unconstrained. Whether climate is the primary driver of erosion and whether tectonic rates respond to variability in erosion rates remain largely speculative (Burbank, 1992; Burbank et al., 1993; Clift, 2006; Clift et al., 2008; Clift and VanLaningham, 2010).
Here we focus primarily on the Marsyandi catchment in central Nepal, but we initially use remotely sensed precipitation data to provide a broader climatic overview of the monsoon, topographic controls on its spatial variability, and its role in the annual cycle of precipitation. We then synthesize data from a dense meteorological network in and near the Marsyandi catchment to examine topographic-climate interactions in more detail. Within this precipitation framework, we explore controls on erosion processes and contrasts in the nature of erosion between the monsoon-dominated southern Himalayan flank and the rain shadow that lies north of the Himalayan crest.
2 The Indian summer monsoon and Himalayan precipitation
2.1 Regional variations in remotely sensed precipitation
The primary source of moisture for most of the Himalaya is the Indian summer monsoon. Monsoonal onset is driven by the mid-year temperature contrast of the warm Indian subcontinent with the cooler surrounding ocean (Boos and Kuang, 2010). The resultant low pressure over the land surface creates onshore winds that transport moisture landward from the ocean. The land-sea thermal contrast reverses during the winter months, and the Tibetan Plateau becomes abnormally cold. The resultant pressure gradient generally favors northeasterly winter winds, but several other synoptic weather systems can dominate regional precipitation patterns. In the western Himalaya, for example, the Western Disturbances are westerly upper-tropospheric waves that provide most wintertime moisture (Barros et al., 2006; Bookhagen and Burbank, 2010). Such waves can be topographically focused, such that topographic notches formed by the Himalaya with the Hindu Kush in the west and with the Burmese ranges in the east funnel moisture into the western and eastern syntaxes, respectively.
Until recently, the patchy, poorly coordinated network of meteorology stations and the absence of stations throughout much of the Himalaya inhibited reliable syntheses of precipitation data across the Himalaya. The launch of the Tropical Rainfall Measurement Mission (TRMM) satellite in 1997 (Kummerow et al., 1998) provided a new window on rainfall between ∼36°S and 36°N, including almost all of the Himalaya. We have used 12 years of rainfall estimates that were observed at ∼ 4 × 6 km pixel sizes (TRMM product 2B31) and then interpolated on to a 5 × 5 km grid (Bookhagen and Burbank, 2006, 2010). These data were calibrated against over 1700 gauged rainfall stations in India, Pakistan, China, and Nepal. Stations in both the mountains (> 500 m elevation; n = 343) and the lowlands (< 500 m elevation; n = 1398) yield similar calibrations of remotely sensed rainfall rates with either annual or seasonal rainfall (r2 ∼ 0.85; Bookhagen and Burbank, 2010). Given the size of the rainfall pixels (5 × 5 km) and the fact that gauged rainfall amounts can vary by 15 to 40% over distances of 5 km in areas of high Himalayan relief (Putkonen, 2004), we consider the spatial patterns of remotely sensed precipitation data to be valid proxies for rainfall variability at scales >10 km. The spatial resolution of these remotely sensed data is far higher than previously available and enables us to define both along-strike and across-strike spatial gradients in the monsoon and to examine relationships between topography and precipitation (orographic precipitation).
Based on remotely sensed data from the Moderate Resolution Imaging Spectroradiometer (MODIS) (Hall et al., 2002), we have estimated the surface temperature (MODIS product MOD 11C2) and the mean monthly, perpixel (∼6 × 6 km) snow-covered area (MOD10C2) in each Himalayan catchment. When combined with the mean monthly solar radiation in 1 × 1 km pixels, we then estimated monthly snowmelt contributions to runoff from 2000–2008. These data enable us to estimate the relative contribution of monsoonal precipitation to the annual water flux along the length of the Himalaya and to delineate the contribution from major moisture sources. The combined TRMM 2B31 and MODIS 10C2 data provide a much more spatially uniform and higher resolution perspective on Himalayan precipitation than has previously been available (Bookhagen and Burbank, 2006, 2010).
Originating out of the Bay of Bengal, the Indian summer monsoon typically sweeps northward toward the Himalaya in June and abruptly diminishes by late September. As the monsoonal vortices encounter the Himalaya, they turn to run broadly parallel to the range with the bulk of the moisture being steered toward the west. A second monsoonal source is the East Asian monsoon (Ding and Chan, 2005) that sweeps on land from the South China Sea and delivers moisture primarily to the easternmost Himalaya. In the westernmost Himalaya, summer rainfall is delivered by westerly and southwesterly winds carrying moisture from the Arabian Sea and perhaps the Mediterranean region.
The spatial pattern of variations in remotely sensed precipitation defines several broad trends. Along the Himalaya, a 2500-km-long swath of precipitation data (Fig. 1A) that spans from the northern 200 km of the foreland (here defined as areas < 500 m altitude) across the southern 200 km of the Himalaya (defined as areas of 500–5000 m altitude) shows stark spatial contrasts. Along the length of the foreland, precipitation is greatest directly north of the Bay of Bengal and shows strongly decreasing gradients both eastward and westward. These east-west trends are robust, even though the centroid of greatest foreland precipitation is certainly enhanced by the almost inevitable encounter of northward-sweeping air masses from the Bay of Bengal with the Shillong Plateau that lies ∼150 km south of the Himalaya: an encounter that creates one of the wettest regions on Earth (Fig. 2). The westward conveyor of precipitation from the Bay of Bengal extends over 1000 km to ∼77°E during which a ten-fold decrease occurs in the moisture delivered to the foreland (Fig. 1B).
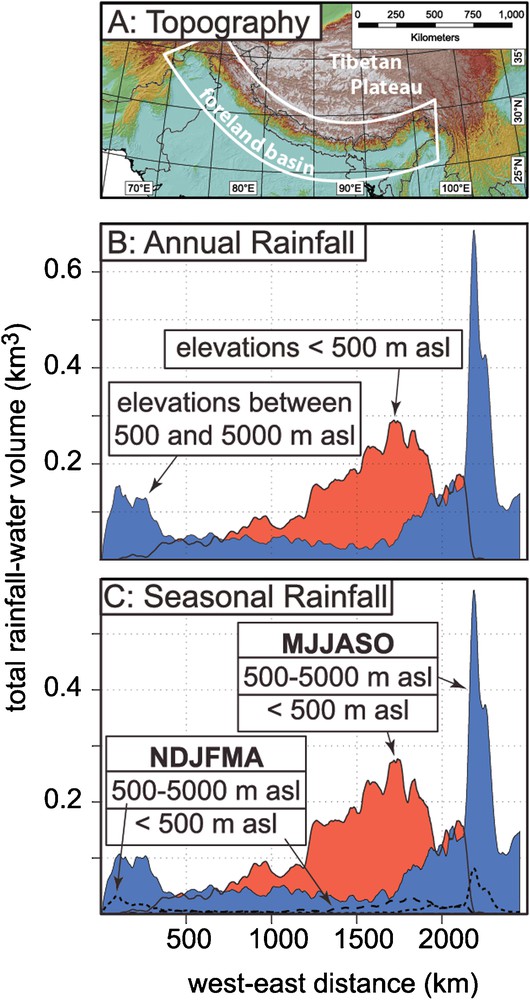
Location of the swath (400 × 2500 km) for precipitation data. A. For each 1 km × 400 km swath across the range, rainfall is summed and averaged to calculate rainfall per 1-km2 pixel for all pixels with mean elevation either > 500 m above sea level (asl) or < 500 m. B. Annual patterns comparing rainfall on the foreland (defined as < 500 asl) with rainfall in the mountains (500–5000 m). C. Seasonal rainfall comparing summer (solid colors) versus winter (dashed lines). Note generally uniform amounts of rainfall in the mountains for 1500 km in the central Himalaya.
Localisation de la zone concernée par les données de précipitations (400 × 2500 km). A. Pour chaque parcelle de 1 km × 400 km, la pluviosité est sommée et moyennée pour calculer la pluviosité par 1-km2 pixel pour tous les pixels, avec une altitude moyenne, soit > 500 m au-dessus du niveau de la mer (asl), soit < 500 m. B. Diagrammes annuels comparant la pluviosité sur l’avant-pays (défini comme < 500 asl) avec la pluviosité dans les montagnes (500–5000 m). C. Pluviosité saisonnière comparant l’été (couleurs) et l’hiver (lignes tiretées). À noter que les quantités de pluie sont généralement uniformes dans les montagnes sur 1500 km dans l’Himalaya central.
Figure modified after Bookhagen and Burbank, 2010.
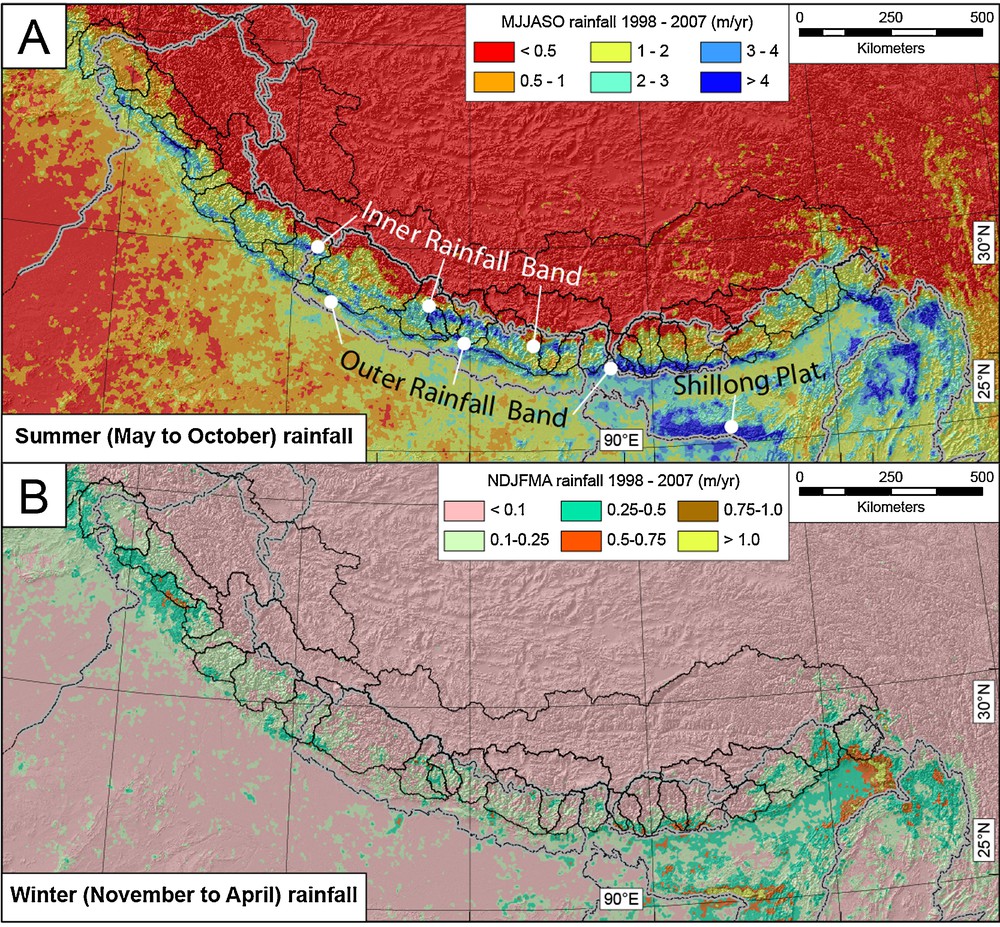
Seasonal rainfall during the Indian Summer Monsoon (ISM) from (A) May to October and (B) during the winter season (November to April). Note the pronounced west-to-east gradient along the Himalayan foreland during the ISM. Winter precipitation is dominated by moisture influxes to the western and eastern ends (syntaxes) of the orogen by the Westerlies and the East Asian Monsoon, respectively.
Pluvosité saisonnière pendant la mousson d’été indienne (ISM) (A) de mai à octobre et (B) pendant la saison hivernale de novembre à avril. À noter le gradient prononcé d’ouest en est dans l’avant-pays himalayen pendant l’ISM. Les précipitations en hiver sont dominées aux terminaisons ouest et est (syntaxes) de l’orogène par des venues d’humidité dues aux Westerlies et à la mousson est-asiatique, respectivement.
Figure modified after Bookhagen and Burbank, 2010.
Despite this pronounced, lateral precipitation gradient along the foreland, the amount of precipitation falling on the Himalaya (regions above 500 m altitude, Figs. 1B and C) is remarkably constant across the central 1500 km of the range. This steadiness yields to significantly greater precipitation in the Himalaya near the eastern and western termini of the range due to moisture delivered by the East Asian monsoon and the Westerly Disturbances, respectively (Fig. 1B). The pattern of precipitation in the winter months broadly mimics the variations during the monsoon, except that total precipitation is much less and the aggregate amount of winter precipitation is greater in the Himalaya than over the foreland (Fig. 1C).
2.2 Monsoon precipitation in the Himalaya
The TRMM 2B31 data (Fig. 2) highlight the pronounced orographic precipitation gradient across the Himalaya from the foreland to the Tibetan Plateau. Typically, 1 to 3 meters of rain fall in the foreland during the wet season, whereas less than a half meter of rain fall on the Tibetan Plateau that lies in the rain shadow of the Himalaya.
The pattern of wet season precipitation within the Himalaya also shows notable variability with rates varying from less than 1 m/yr to greater than 4 m/yr (Fig. 2A). A nearly continuous band of high rainfall is found along the leading edge of the Himalaya where it abuts the foreland. Along some segments of the range, a second zone of high precipitation occurs 80 to 100 km north of the range front. Data swaths oriented perpendicular to the range are used to compare the mean topography and relief with the mean rainfall, as measured along the 50-km swath width at each increment along its 350-km length. These swath-averaged trends in topography and relief clarify why either a single or a double zone of high precipitation prevails in different parts of the range (Fig. 3). Wherever the topography rises rather steadily from the edge of the foreland up to more than 3 to 4 km in the Greater Himalaya (Fig. 3B), a single pronounced peak dominates monsoonal rainfall, whereas when the topography contains two significant steps (Fig. 3 C), a double peak in rainfall is common. Topographic relief, as measured using a 5-km radius from each point, predicts where these rainfall peaks occur along a swath (Fig. 4). The outer rainfall peak occurs where relief first exceeds 1 to 1.5 km, as happens where the foreland abuts the outer Himalaya (Bookhagen and Burbank, 2006). The effectiveness of this first topographic barrier in extracting rainfall depends on the magnitude of relief: ∼40 to 50% of the atmospheric moisture is extracted as rainfall if relief in the outer barrier lies between 1 to 1.5 km; whereas more > 80% can be extracted where relief approaches 3 km, such as where the topography rises particularly steeply and persistently at either the inner or (less commonly) the outer peak (Bookhagen and Burbank, 2010),.
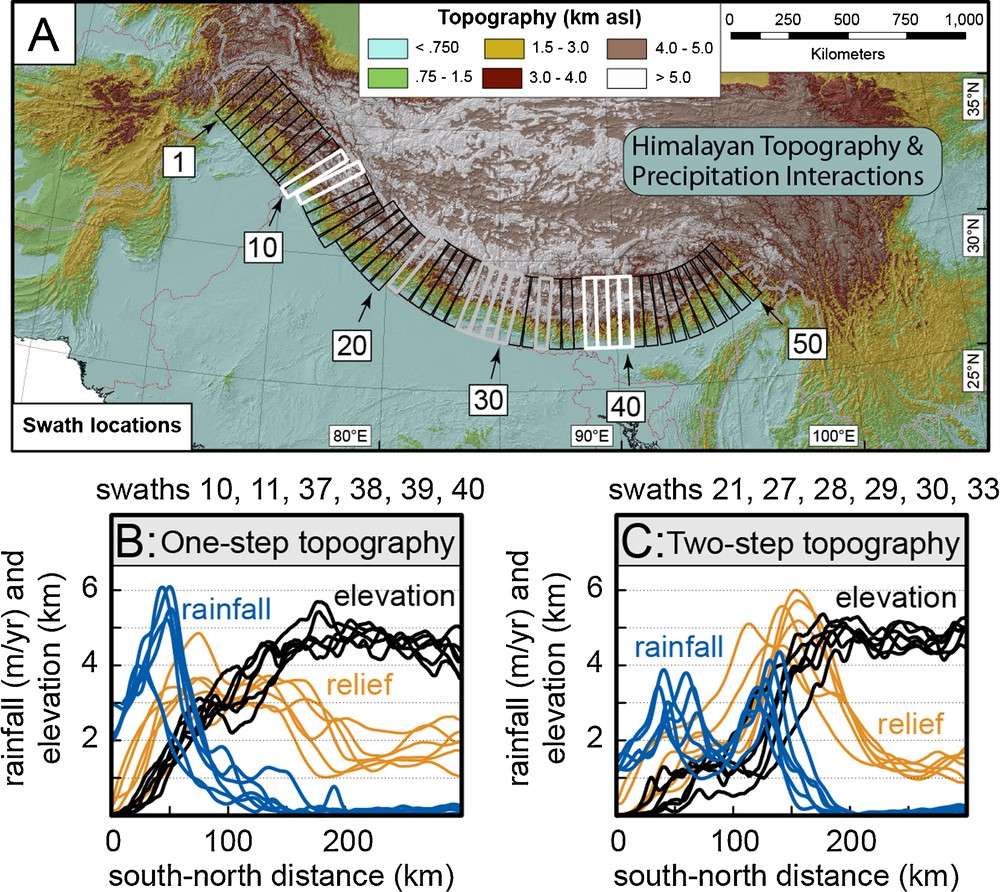
Relationship of topography and relief to monsoonal rainfall. A. Himalayan topography showing sequential, 50 × 350 km swaths in which topography, relief, and rainfall are averaged. B. Steadily rising topography to > 4 km generates a single peak in rainfall. Swath numbers refer to swaths in A. C. Two-stepped topography (commonly spanning the Lesser and Greater Himalaya) leads to double rainfall peaks.
Relations de la topographie et du relief avec la pluvisoité de mousson. A. Topographie himalayenne montrant une séquence de parcelles de 50 × 350 km, dans lesquelles la topographie, le relief, et la pluviosité sont moyennées. B. La topographie s’élevant régulièrement jusqu’à plus de 4 km génère un unique pic de pluie. Les numéros de parcelles sont les mêmes qu’en A. C. Une topographie à double étagement (qui couvre les Lesser et Greater Himalayas) conduit à de doubles pics de pluviosité.
Figure modified after Bookhagen and Burbank, 2010.
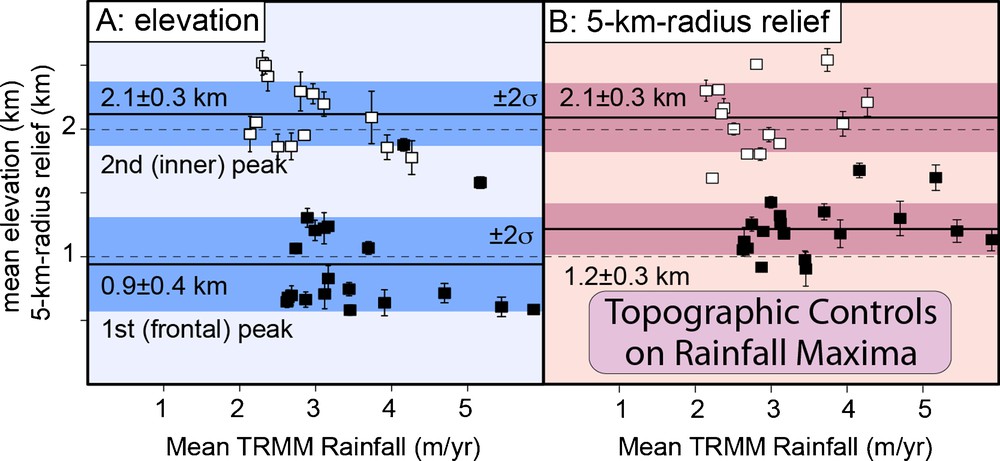
Spatial association of zones of high rainfall with thresholds of topographic relief. An apparent threshold of topographic relief (measured within 5-km radius each pixel and averaged across the swaths of Fig. 3A) is associated with the position of the inner and outer rainfall peaks (Figs. 2 and 3) for major Himalayan catchments. Relief at the outer rainfall band is ∼1.2 km, whereas relief is ∼2.1 km for the inner rainfall band.
Association spatiale de zones à forte pluviosité avec des seuils dans le relief topographique. Un seuil topographique apparent (mesuré dans un rayon de 5 km pour chaque pixel et moyenné entre les parcelles de la Fig. 3A) est associé avec la position des pics de pluie interne et externe (Fig. 2 et 3) pour les principaux bassins himalayens. Le relief dans le cas de la bande de pluie externe est d’environ 1,2 km, tandis que le relief est d’environ 2,1 km dans le cas de la bande de pluie interne.
Figure modified after Bookhagen and Burbank, 2006.
2.3 Contribution of snowmelt to discharge
Whereas monsoonal precipitation certainly dominates the overall moisture flux to central the Himalaya (Fig. 1), its contribution to runoff exhibits pronounced spatial variability along the range (Bookhagen and Burbank, 2010). In the central Himalaya, for example, the monsoon contributes about 80% of the annual discharge, whereas in the western Himalaya, the contribution to the annual discharge of May-to-October rainfall may be as little as 25% (Fig. 5). On a catchment-by-catchment basis, the contributions to annual discharge from snowmelt range from < 20% to > 60%. Those Himalayan catchments with extensive headwater areas lying north of the main Himalayan crest are ones for which snowmelt represents a significant component of annual discharge. Not surprisingly, these upper catchments lie in the rain shadow of the Himalaya and receive very restricted amounts of summer precipitation in comparison to the southern Himalaya. These catchments tend to be nourished by either Westerlies in the western Himalaya or the East Asian monsoon in the eastern Himalaya (Fig. 5).
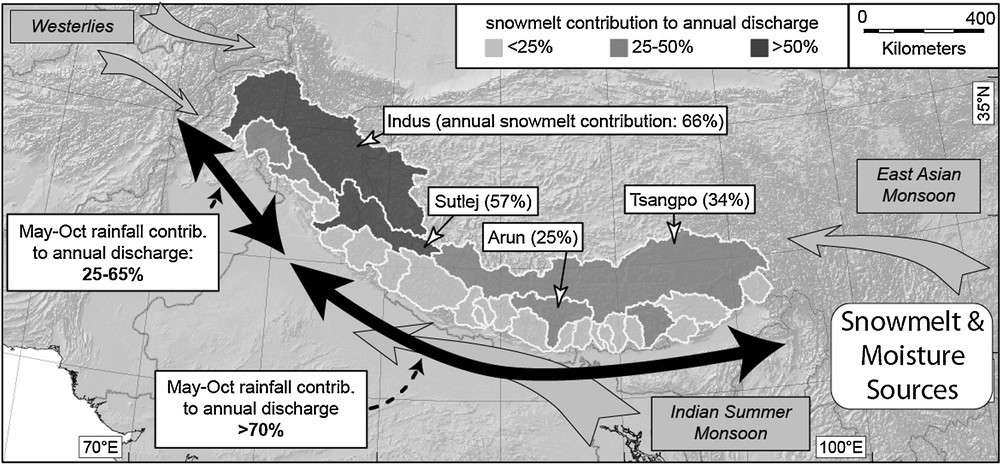
Major Himalayan moisture sources and monsoonal contributions to annual discharge. Winter precipitation is most important at the east and west ends of the Himalaya, where spring snowmelt in the Himalayan rain shadow (shaded catchments) generates up to 65% of the annual runoff.
Principales sources d’humidité himalayennes et contributions de la mousson au débit annuel. Les précipitations hivernales sont plus importantes aux terminaisons est et ouest de l’Himalaya, où la fonte des neiges de printemps dans la zone d’ombre de pluie himalayenne (bassins ombrés) génère plus de 65 % du ruissellement annuel.
Modified from Bookhagen and Burbank, 2010.
3 Precipitation and erosion in the Marsyandi catchment, Central Nepal
3.1 Meteorological results in the Marsyandi catchment
In 1999 to 2000, an 18-station meteorological network was installed in the middle and upper Marsyandi catchment (Barros et al., 2000). For logistical reasons, two additional stations were constructed ∼80 km farther west in the Lesser Himalaya (Fig. 6A). The network was dismantled in the post-monsoon season of 2004. Despite interference from Maoist uprisings in the region during this time, most stations functioned throughout this interval.
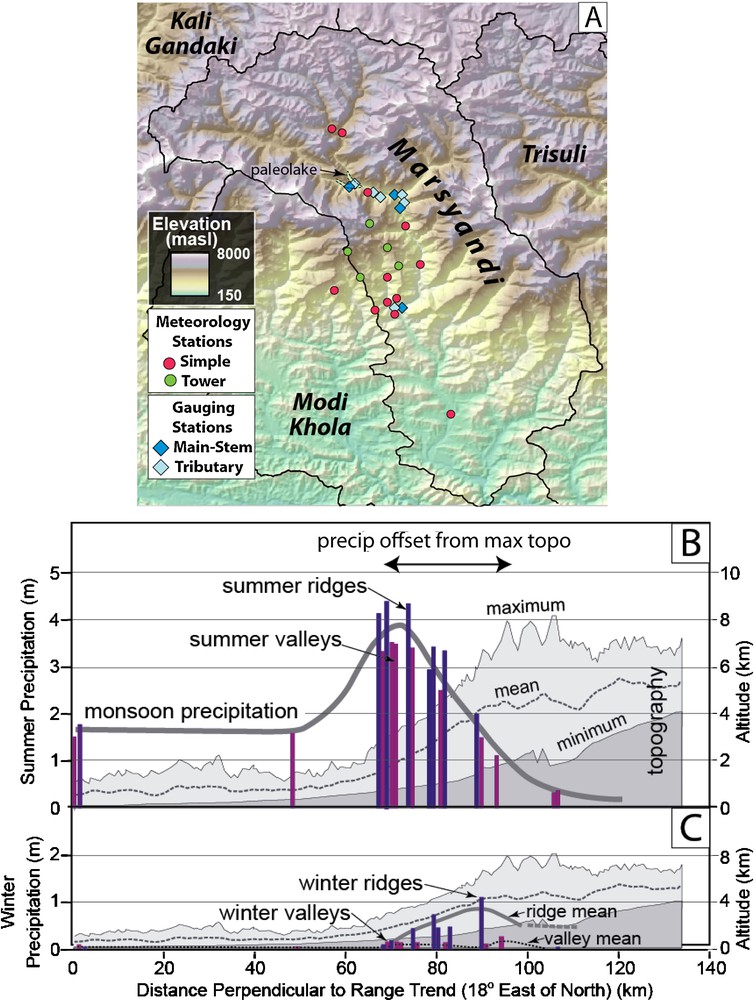
A. Map of meteorological and river-gauging network. Spatial gradient of precipitation across the Marsyandi network showing contrast in monsoon precipitation between ridges versus valleys during the monsoon (B. July to September) and wintertime (C. January to March).
A. Carte du réseau météorologique et de jaugeage des rivières. Gradient spatial des précipitations au travers du réseau Marsyandi montrant le contraste des précipitations de mousson entre rides montagneuses et vallées pendant la mousson (B. juillet à septembre) et l’hiver (C. janvier à mars).
Two types of local stations were installed. “Simple” stations comprised 1 to 2 rain gauges, temperature and relative humidity sensors, and data loggers that recorded half-hourly totals and averages. “Tower” stations were built at sites where significant winter snowfall was expected. In addition to the instrumentation at simple stations, these stations included 10-m-high towers equipped with “look-down” sonic sensors to measure the height of the snow surface and with gamma-ray loggers that were either flush with the ground surface or at ∼9 m, such that the difference in fluxes could be used to calculate snow-water-equivalents in the snowpack (Putkonen, 2004).
Several striking results emerge from the meteorological data obtained with this network. First, a ten-fold, north-south gradient in monsoonal precipitation exists across the Himalaya with peak rainfall exceeding 4 m on the southern flank while < 40 cm of precipitation falls in the depths of the rain shadow (Fig. 6B). Second, the peak in monsoonal precipitation does not occur near the range crest, but instead is offset 20 to 30 km south (upwind) of the highest topography and occurs where elevations are typically 2 to 3 km. Note that the topographic profile across this area shows a two-step topography, but that the outer peak in rainfall (swaths 28, 29 in Fig. 3A and C) is not well captured by these data: it occurs between 40 to 60 km on the profile; a zone for which no data were collected in the local network. Third, the magnitude of the contrast between ridge-crest and valley-bottom stations is strongly seasonal. During the monsoon (Fig. 6B), the ridge-crests receive 10 to 40% more rainfall than do the adjacent valleys. During winter (Fig. 6C), the valley bottoms are rather dry, but nearby ridge tops can receive 5-10 times more precipitation in the form of snowfall (Putkonen, 2004). During the winter, no significant snowfall occurs below 2.5 km altitude, whereas the winter snowfall on the higher ridges can constitute as much as 40% of the annual total precipitation (Fig. 6C). In contrast to the strong storm-to-storm differences in rainfall observed during the monsoon season between sites that are at similar elevations, but on different ridges, winter snowfall appears to be far more spatially uniform, having a strong altitude dependence, but much less spatial dependence. Such an increase in snowfall with increasing elevation is unlikely to be sustained as air cools adiabatically at higher altitudes. Using glacial mass balances, current glacial extent, topography, and a cellular automaton model, Harper and Humphrey (2003) estimate that, especially in comparison to snowfall between 4 to 6 km elevation, relatively little snow accumulates above 6.2 to 6.3 km, such that the lofty Himalayan summits are cold and semi-arid (Fig. 7B).
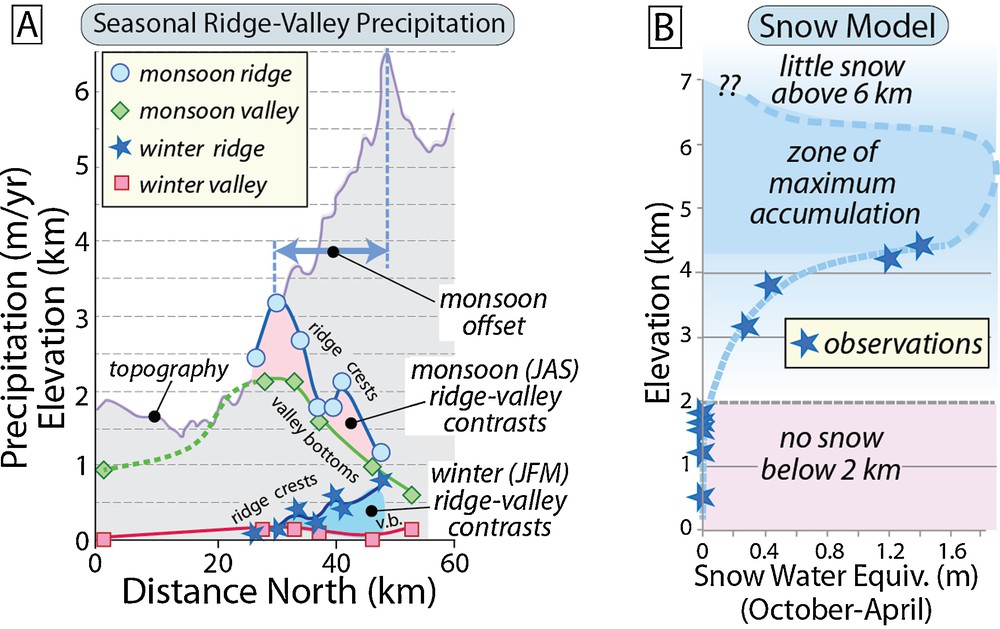
A. Contrast in precipitation between ridges versus valleys during the monsoon (July–September) and wintertime (January–March). Note the opposite trends of precipitation in a north-south direction in the winter versus the monsoon. Monsoon offset shows the lateral offset from the highest topography to the zone of highest monsoon precipitation. B. Conceptual model for snow accumulation in the Nepalese Himalaya based on weather-station data and modeling of glacier mass balances (Harper and Humphrey, 2003).
A. Contraste dans les précipitations entre les rides de montagne et les vallées pendant la mousson (juillet–septembre) et l’hiver (janvier–mars). À noter les tendances opposées des précipitations dans une direction nord-sud en hiver en comparaison avec la mousson. La mousson montre un décalage latéral à partir de la topographie la plus haute jusqu’à la zone de plus fortes précipitations de la mousson. B. Modèle conceptuel pour l’accumulation de neige dans l’Himalaya népalais, basé sur les données d’une station météorologique et modélisation des bilans de masse de glaciers (Harper et Humphrey, 2003).
We infer that these seasonal contrasts arise from the differences between the dynamics of convective summer storms versus more altitudinally stratiform winter snows. The absence of significant winter precipitation in valley bottoms at a time when ridges are receiving 1 to 2 meters of water-equivalent snow suggests that very active subcloud evaporation (Lee and Fung, 2007) greatly restricts precipitation at lower elevations.
3.2 Modern erosion in the Marsyandi catchment: catchment-wide rates
In tandem with the meteorological network, a suite of ten water and sediment discharge gauging stations (Fig. 6A) were maintained from 2000 to 2004 (Gabet et al., 2008). Four stations were sited on the Marsyandi's main-stem at drainage areas of about 800, 1900, 2600 and 3200 km2, four were at the mouth of major tributary catchments ranging in area from 90 to 1100 km2, and two were on small tributaries ranging from 7 to 30 km2. During the monsoon season, three suspended sediment load samples were manually collected from the upper meter of the water column twice a day (∼7 a.m. and ∼7 p.m.) at each station, whereas from October to May, the suspended load was measured once per week at our most southerly (and accessible) station along the Khudi Khola (Fig. 6A). Overall, these data enable calibrated estimates of the suspended sediment load, measured and specific discharge, and both spatial and temporal variations in sediment loads.
The data from the Khudi catchment (Fig. 8) display characteristics typical of drainages in the monsoon-drenched, southern flank of the Greater Himalaya. From October through April, water discharge is low and fairly steady, and sediment discharge is negligible. In mid-to-late May, water discharge gradually increases until the monsoon commences sometime in June. During the monsoon, discharge on a given day most closely correlates with rainfall on the previous five days (Craddock et al., 2007), thereby suggesting that water is temporarily stored and then drained from the regolith and fractured near-surface bedrock. The “spiky” nature of the water discharge curve (Fig. 8A) is indicative of the highly variable intensity of runoff and rainfall on a given day, especially due to increasingly saturated soils, rain-on-snow events (Wulf et al., 2010); and the multi-day phases of high rainfall (active monsoon phases: Barros et al., 2006) that are interspersed with periods of much less intense rainfall.
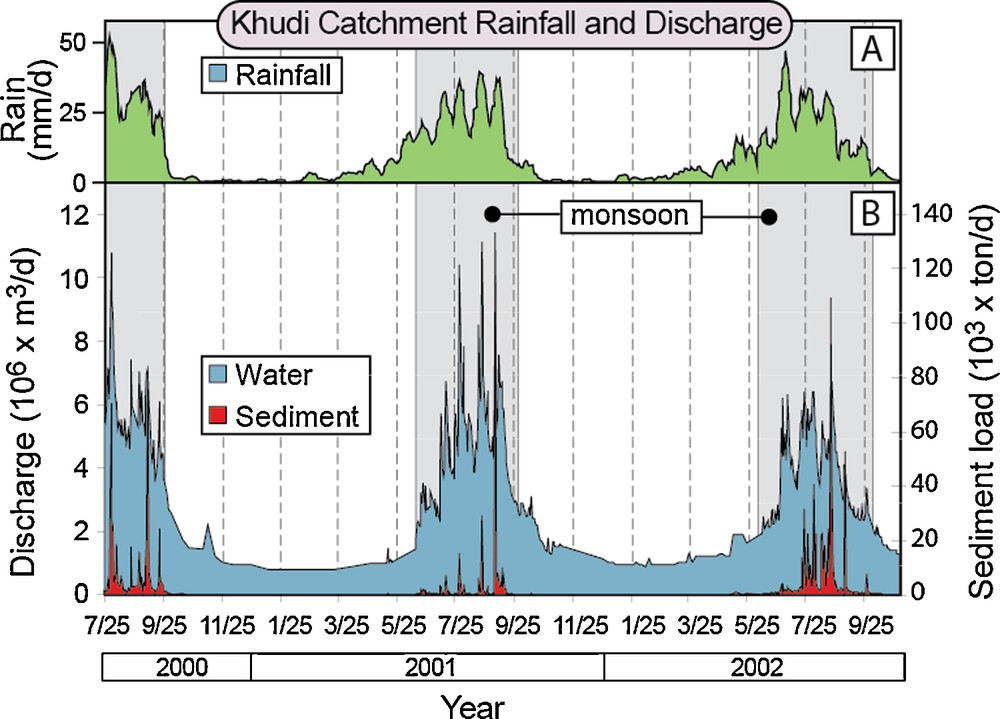
Rainfall from 2000 to 2002 with corresponding water and sediment discharge from the Khudi catchment in the Marsyandi drainage. A. Annual rainfall with notable active and weak monsoon phases lasting one to two weeks. B. Water and sediment data show strongly peaked discharge. Major sediment pulses are brief and occur significantly after the monsoon onset.
Pluviosité des années 2000 à 2002 avec débit correspondant d’eau et de sédiment. Données tirées du bassin du Khudi dans le drainage du Marsyandi. A. Pluviosité annuelle avec des phases actives et faibles durant une à deux semaines. B. Les données sur l’eau et le sédiment indiquent un débit à pic important. Les principales émissions de sédiment sont brèves et se produisent significativement après l’établissement de la mousson.
Modified after Gabet et al., 2004.
Notably, in those regions receiving 2 to 4 m/yr of rainfall, sediment discharge is even more peaked in nature (Fig. 8B), such that one- to two-day-long sediment pulses during five-to-ten monsoonal events each year account for more than 90% of the total annual sediment discharge. It is noteworthy that, even though the monsoon greatly intensifies in June, significant sediment discharge only begins several weeks after the monsoon intensifies.
Although suspended loads are typically assumed to represent ≥ 90% of the total sediment discharge, the Marsyandi and its tributaries can be highly energetic. During some high flows, numerous boulders exceeding 2 to 3 meters in diameter are moved considerable distances, and at our most downstream, main-stem station, surface-water velocities of ∼3 to 5 m/s were sustained for weeks on end. Hence, it is likely that bedload plays a significant role in sediment transport far from the headwaters.
In an effort to calibrate the proportion of bedload within the total sediment discharge, we exploited the preserved deposits of a lake (Fig. 6A) that formed in response to a 400-m-high landslide dam about 5400 years ago (Pratt-Sitaula et al., 2007). The deltaic-lacustrine infill behind that dam extended ∼6 km upvalley and attained a thickness of ∼120 m prior to breaching of the dam and rapid subsequent incision. Reconstruction of the upper surface of the fill (based on laser-ranger surveys) and discrimination between bedload (sands and gravels) versus suspended load (silts and muds) deposits underpinned a volumetric estimate of the ratio of suspended-to-traction loads as being ∼2:1. Hence, we conclude that about one-third of the average sediment load in the Marysandi is represented by bedload. Although this ratio is significantly higher than average in most rivers, it is consistent with some other glacier-fed channels (Humphrey et al., 1986), with modern bedload changes along the Marsyandi (Attal and Lavé, 2006; Humphrey et al., 1986), and with suspended-to-bedload measurements in recently studied western Himalayan catchments (Wulf et al., 2010). We, therefore, employed this ratio to calculate the total sediment discharge as a function of the suspended sediment loads that were measured with our modern gauging network.
Similar to monsoonal rainfall, erosion rates that are averaged over the four years of gauging display a pronounced north-south spatial gradient across the Marsyandi catchment (Gabet et al., 2008) (Fig. 9). Whereas modern erosion rates in the dry, alpine rainshadow of the Himalaya hover around 0.1 mm/yr, the rates are ∼2 mm/yr in the Khudi catchment on the monsoon-dominated southern Himalayan flank. Among the intervening catchments whose rates range from 0.2 to 0.8 mm/yr, the highest rates are in the upper Marsyandi (Fig. 9): a catchment whose southern boundary is defined by the elongate Annapurna Range, which is characterized by extensive present-day glaciation on its northern slopes.
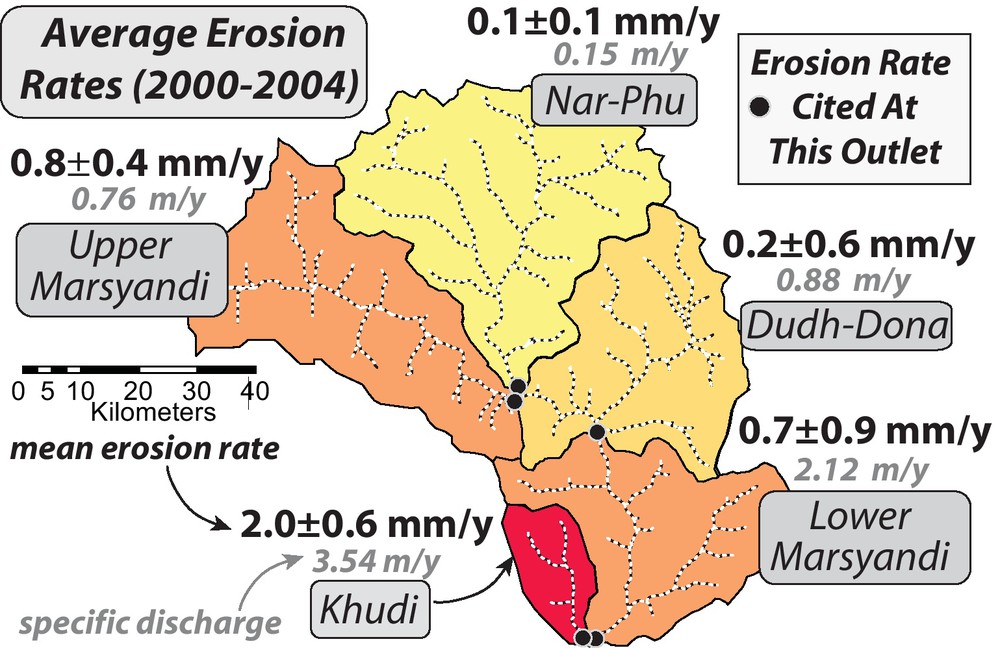
Modern erosion rates in the Marsyandi catchment during the monsoon. Rates derived and averaged from stream gauging records spanning 2000 to 2004. Rates are calculated at the outlet of each subcatchment.
Vitesses d’érosion actuelles dans le bassin du Marsyandi pendant la mousson. Les vitesses sont dérivées et moyennées à partir d’ enregistrements de jaugeage du fleuve s’étalant sur la période 2000 à 2004. Les vitesses sont calculées à la sortie de chaque sous-bassin.
Figure modified after Gabet et al., 2008.
The ∼20-fold gradient in modern erosion rates across a north-south transect of the Marsyandi catchment broadly mimics the ∼10-fold gradient in monsoonal precipitation along this same transect. Correlations based on measured erosion rates from individual catchments (Fig. 10) suggest that, at decadal time scales, erosion rates scale both with precipitation during the monsoon (r2 = 0.88) and with specific discharge (r2 = 0.92) (Gabet et al., 2008). Although these correlations appear strong, they are highly leveraged by data at the extremes of the distributions of both rainfall and erosion rates. Especially near the extremes, more data over longer time scales, such as from detrital cosmogenic concentrations in non-glaciated catchments, are needed to confirm these correlations and to investigate relationships with channel steepness, hillslope angles, and specific stream power (Craddock et al., 2007; Ouimet et al., 2009).
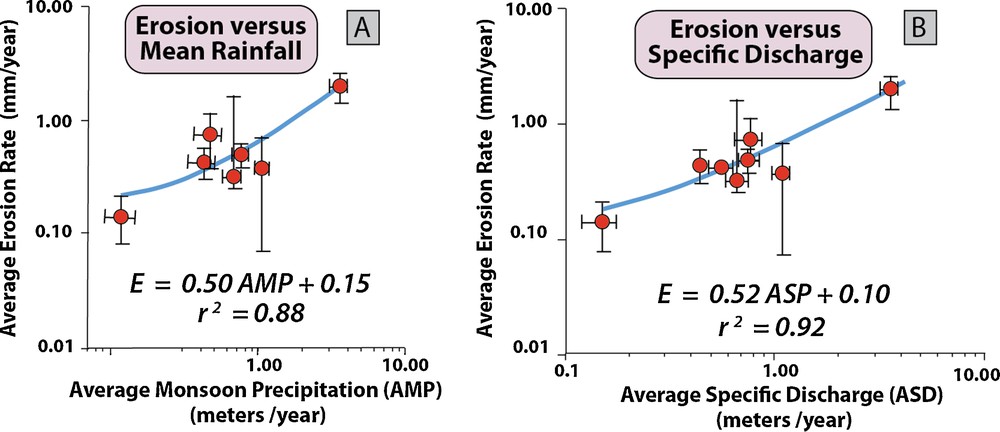
Erosion rates in the Marysandi catchment (2000 to 2004). A. Average erosion versus mean rainfall. B. Erosion versus specific discharge. Note the log-log scale and that correlations are leveraged by isolated data at the extremes of the distribution.
Vitesses d’érosion dans le bassin du Marsyandi (2000 à 2004). A; Érosion moyenne en fonction de la pluvsiosité moyenne. B. Érosion en fonction du débit spécifique. À noter l’échelle log-log ; à noter aussi que les corrélations sont influencées par des données isolées aux extrêmes de la distribution.
Figure modified after Gabet et al., 2008.
3.3 Modern erosion in the Marsyandi catchment: erosion dynamics
3.3.1 Monsoon-dominated catchments
When landscape erosion rates exceed the rate of soil-production or rock-to-regolith conversion, erosion in nonglacier-covered terrain must be dominated by landsliding that involves bedrock (Burbank, 2002). Soil-production rates are poorly known in the Himalaya, but elsewhere in the world, few rates exceeding 0.3 mm/yr (Heimsath et al., 1999) have been documented. If such a soil-production rate limit applies to the Himalaya, then bedrock-involved landslides would be expected to be major contributors to the denudation in much of the Marsyandi catchment. Moreover, if landslides dominate the sediment flux, pulses of sediments would be expected to be injected into river systems, and the record of these pulses should differ from more “chronic” sediment inputs due to shallow overland flow or to steadier hillslope processes, such as creep.
Given the detailed record of day-by-day storms and sediment fluxes in the Khudi catchment (Fig. 8), the relationship between rainfall, runoff, and sediment loads can be quantified (Gabet et al., 2004). Because the record of sediment loading indicates that 95% of the sediment load is transported in brief, high-sediment load spikes, we interpret that these pulses result from landslides dumping hillslope debris into rivers; and the smaller grain-size fraction of that debris is subsequently (within hours) manifested downstream as an enhanced suspended sediment load.
A plot of days in the Khudi catchment with significant sediment loads versus those without them as a function of daily rainfall and accumulated rain during the monsoon reveals a discrete rainfall-limited field in which landslides have occurred (Gabet et al., 2004) (Fig. 11). Note that “accumulated rain” is a rough proxy for time during the monsoon. The bounds on this landslide field reveal three key attributes of the impulsive sediment supply. First, no landslides occur before ∼850 mm of rain have accumulated from previous storms. Second, the threshold for the daily rainfall that can trigger a landslide decreses from ∼40 mm/day early in the “landslide” season to ∼11 mm/day after nearly 2.5 m of rain have fallen during the monsoon. Finally, numerous storms fall within this domain, but produce no significant sediment pulses.
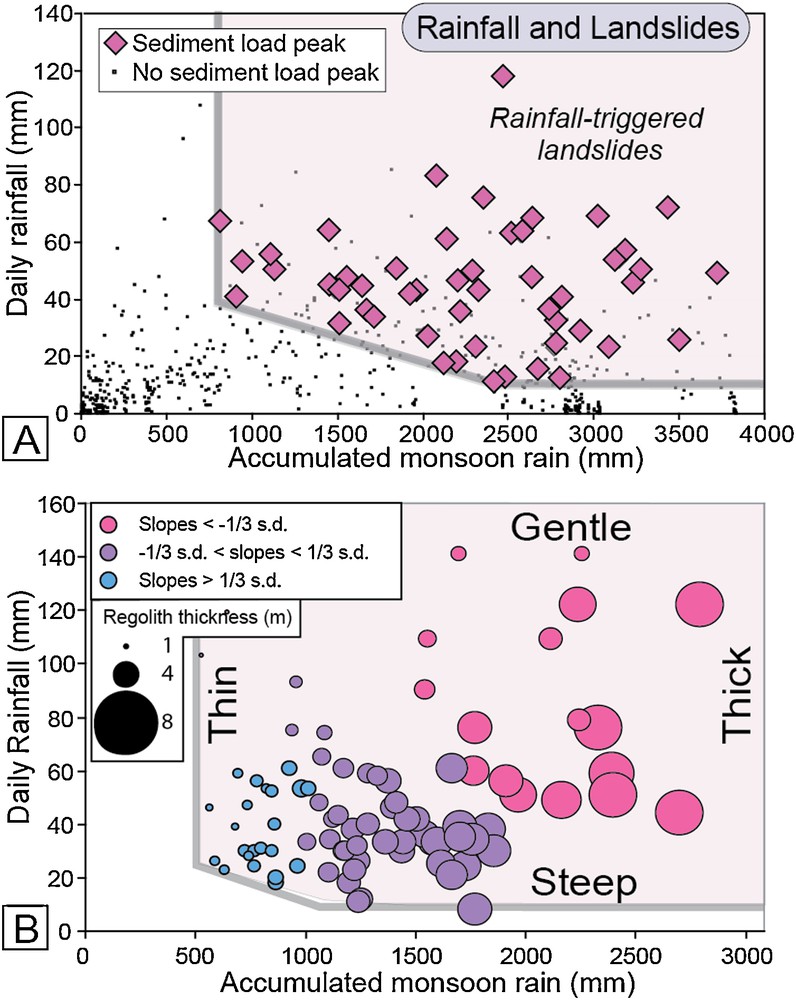
Domain of implusive sediment loads as defined by rainfall thresholds. A. Observations. In any given year, no large loads occur before ∼850 mm of prior rain has accumulated. When impulsive loads begin, 40 mm/day of rain is necessary to trigger them, whereas by mid-monsoon, only 11 mm/day is needed. B. Model results. Thin soils on steep slopes fail early in the landslide season, whereas thicker soils on gentler slopes fail later in the monsoon season. General distributions of observed boundaries are mimicked by the model output.
Domaine des charges soudaines de sédiment, telles qu’elles sont définies par des seuils de pluviosité. A. Observations. Pour une année donnée, aucune charge importante ne se produit avant 850 mm de pluie préalablement accumulée. Lorsque les charges soudaines commencent, 40 mm/jour de pluie sont nécessaires pour les déclencher, tandis qu’à la mi-mousson, seulement 11 mm/jour sont nécessaires. B. Résultats du modèle. Des sols minces sur pente raide disparaissent tôt dans la saison des glissements de terrain, tandis que des sols plus épais sur des pentes plus douces le font plus tard, dans la saison de mousson. Les distributions générales de limites observées sont mimées par la sortie du modèle.
Figure modified after Gabet et al., 2004.
Several inferences can be drawn from these bounds. The requirement for nearly a meter of antecdent rainfall is interpreted to represent the amount of rainfall needed to saturate the field capacity that is represented by the regolith: the soil moisture volume that, when exceeded, causes gravity-driven drainage. The observation that the ratio of rainfall to runoff decreases during this build-up to 850 mm (Fig. 12) supports the concept that the regolith is gradually filling with moisture over time, such that an increasingly large fraction of new rainfall runs off, rather than being held in the regolith. Note that, if snowmelt were a significant contributor to runoff, a decreasing contribution from snowmelt as the snowpack melts in the early summer could produce the same effect. Given the hypsometry of the Khudi catchment and our snow-cover data, however, snowmelt makes negligible contributions to summer discharge, except perhaps in discharges from deep groundwater reservoirs.
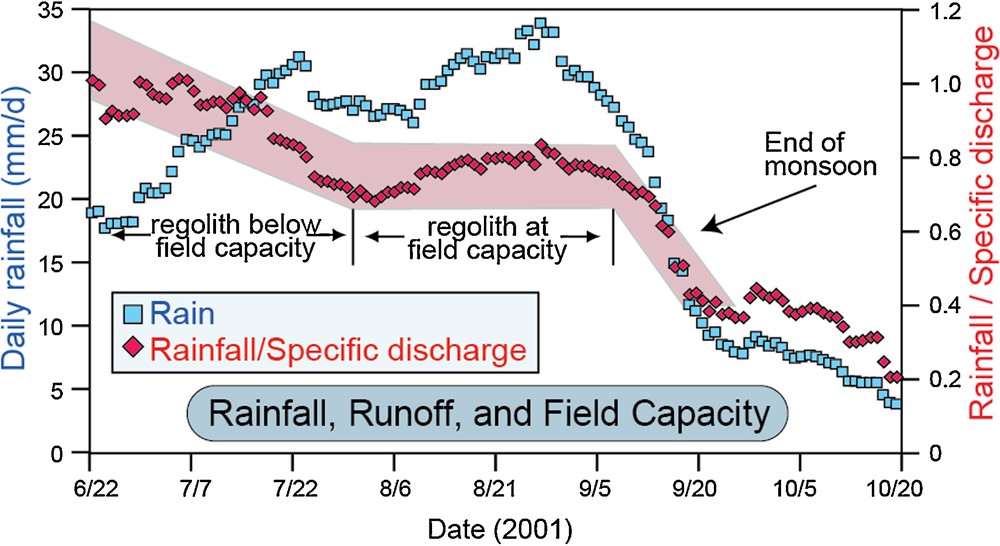
Daily rainfall and the ratio of rainfall to specific discharge during the monsoon of 2001. A decreasing rainfall-to-discharge ratio indicates that a increasing fraction of the rainfall is being expressed as discharge while less of given day's rainfall is retained in the regolith. A steady rainfall-to-discharge ratio (as seen from late July to mid-September) implies that the regolith's field capacity to retain water has been reached.
Pluviosité journalière et rapport de la pluviosité au débit spécifique pendant la mousson de 2001. Une diminution du rapport indique qu’une fraction croissante de la pluviosité s’exprime en tant que débit, tandis que moins de la pluviosité d’un jour donné est retenu dans la régolithe. Un rapport stable pluviosité–débit (tel qu’observé de la fin juillet à la mi-septembre). implique que la capacité au champ de la régolithe à retenir de l’eau a été atteinte.
Figure modified after Gabet et al., 2004.
Second, the threshold in the daily rainfall that is sufficient to trigger landslides likely relates to the destabilizing effect of the creation of excess pore pressures within or at the base of the regolith. We interpret the time-dependent decrease in this threshold from ∼40 mm/day to 10 mm/day to be a reflection of the distribution of hillslope angles and soil thicknesses within the catchment, such that thin soils on steep slopes should fail before thick soils on gentle slopes (Gabet et al., 2004). The excess pore pressure is likely sustained only for some fraction of a day due to chronic drainage from the regolith, such that renewed rainfall is necessary to trigger subsequent landslides. Overall, the landslide-triggering process can be conceptualized as a two-bucket system (Fig. 13): a field-capacity reservoir that must be filled prior to any landsliding; and a leaky excess-moisture reservoir that receives the overflow when the field-capacity is exceeded. With respect to generating landslides, each of these reservoirs is site specific due to local variability in the moisture storage capacity of the regolith, the rate that water drains from the regolith, the hillslope angle, and the local soil thickness. In fact, a numerical model that predicts landslide occurrences based on a safety-factor approach (ratio of stresses to strength in the regolith) does a good job of mimicking the observed boundaries that define the impulsive sediment field (Fig. 11) (Gabet et al., 2004). That model uses the Khudi catchment's observed rainfall and hillslope angle distributions as input, and it includes estimates for a fixed field capacity, for the rate at which water drains from soil, and for variables controlling slope stability. The success of the model suggests that the essence of the controls on sediment inputs to the channel via landsliding is captured by this straightforward approach to hillslope stability.
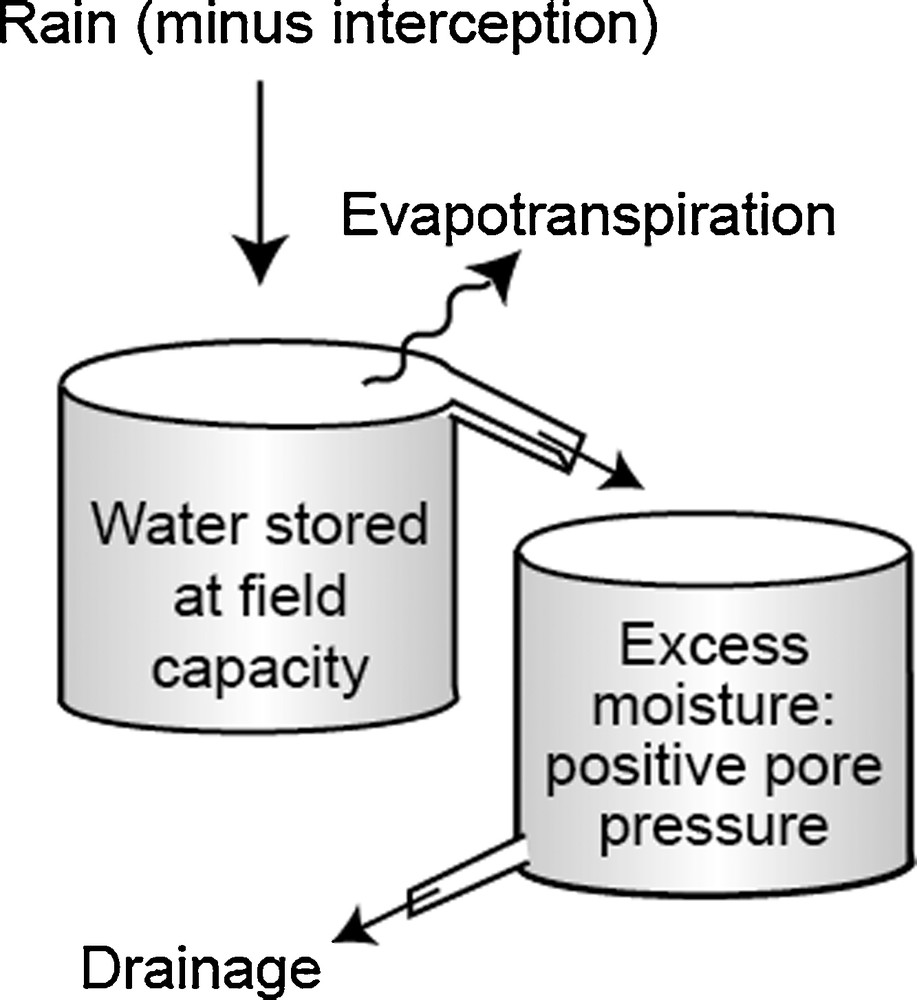
Conceptual representation of rainfall controls on landsliding. Field capacity must be exceeded prior to development of positive pore pressures that trigger landslides. Excess soil moisture must be constantly renewed to substitute for chronic moisture loss.
Représentation conceptuelle du contrôle de la pluviosité sur un glissement de terrain. La capacité au champ doit être excédendaire avant le développement d’une pression positive des pores qui déclenche les glissements de terrain. Un excès d’humidité doit être constamment renouvelé pour être substitué à une perte d’humidité chronique. Figure modifiée d’après Gabet et al. (2004).
Figure modified after Gabet et al., 2004.
3.3.2 Semi-arid, alpine catchments
The Nar-Phu catchment in the northern Marsyandi watershed receives less than ∼40 cm of precipitation per year (Bookhagen and Burbank, 2010; Burbank et al., 2003) and has a modern erosion rate of ∼0.1 mm/yr (Fig. 9). The hydrograph at the mouth of the Nar-Phu catchment (Fig. 14) tends to lack the peakedness that characterizes the Khudi catchment. Nar-Phu's smoother hydrograph can be attributed to three factors. First, the Nar-Phu catchment is much larger than that at Khudi and results in a more integrated signal. Second, the day-to-day difference in rainfall magnitude is much smaller than in Khudi (Craddock et al., 2007). Finally, diurnal variations in discharge (Gabet et al., 2008) indicate that snowmelt, which more closely reflects summer temperature than rainfall, accounts for a significant fraction of the discharge. Because relative, daily variations in mean temperature are much smaller than those of daily rainfall, the discharge generated from snowmelt at daily time scales shows less day-to-day variability. Overall, we estimate that over half of the summer runoff derives from snowmelt in this area.
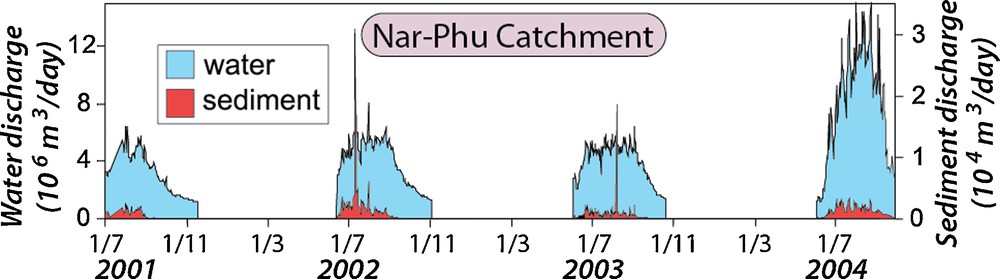
Water and sediment discharge at the mouth of the Nar-Phu catchment, 2001 to 2004. In comparison to Khudi, the Nar-Phu discharge is smoother and contains only a few impulsive sediment discharge peaks.
Débit d’eau et de sédiment à l’embouchure du bassin du Nar-Phu (2001–2004). En comparaison avec celui du Khudi, le débit du Nar-Phu est plus lisse, contenant seulement quelques pics de décharge soudaine de sédiment.
The sediment flux in the Nar-Phu catchment (Figs. 14 and 15) is strikingly different from that seen in the Khudi catchment (Fig. 8) in three respects. First, rather than showing an impulsive sediment loading as seen in Khudi, the Nar-Phu sediment load represents a more chronic sediment input with relatively steady fluxes through time punctuated by a few (≤ 1/year) impulsive events that appear analogous to landslide-driven sediment loads in Khudi. Second, little antecedent rainfall appears necessary to trigger the type of chronic sediment delivery that provides 80 to 100% of the sediment load during the monsoon according to four years of sediment flux monitoring. Consequently, sediment loading begins early in the monsoon season. Third, the sediment delivery is largely decoupled from daily rainfall (Fig. 15). Whereas water discharge in Khudi correlates with the 5-day rainfall record (Craddock et al., 2007) and the impulsive sediment fluxes due to landslides occur during some of these high water discharges (hence, rainfall, runoff, and sediment fluxes are correlated: Fig. 8), water discharge in the Nar-Phu catchment is far less peaked (Fig. 14) (Gabet et al., 2008), and sediment discharge is largely unrelated to rainfall events (Fig. 15). In fact, many of the larger rainfall events in the latter half of the monsoon produce no significant sediment flux: a finding consistent with measurements in a similar orographic rain shadow region of the upper Sutlej Valley in the western Himalaya (Wulf et al., 2012).
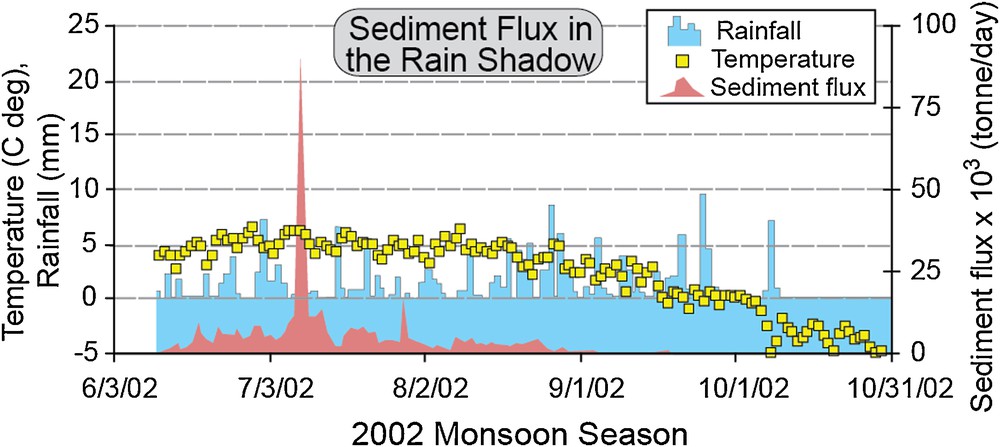
Rainfall, temperature, and sediment flux during the monsoon in the Nar-Phu catchment, central Nepal. Sediment flux is significant only when the mean daily temperature is above freezing. Rainfall is poorly correlated with enhanced sediment flux. After mid-August, the sediment flux is negligible despite the largest rainfall events of the monsoon season.
Flux de pluviosité, température et sédiment pendant la mousson dans le bassin du Nar-Phu, centre du Népal. Le flux de sédiment est significatif, seulement lorsque la température journalière moyenne est supérieure au gel. La pluviosité est faiblement corrélée à un flux de sédiment augmenté. Après la mi-août, le flux de sédiment est négligeable en dépit des gros épisodes pluvieux de mousson.
Figure modified after Gabet et al., 2008.
In contrast to the independence of both sediment and water discharge from rainfall in the Nar-Phu catchment, they both do exhibit a sensitivity to temperature (Fig. 16). Water discharge rises as a function of mean daily temperature with notable increases beginning when the temperature rises above –3 °C at the average elevation of the glacier snouts (∼5200 m). Of course, given average lapse rates in this region (5 °C/km), temperatures of –3 °C at 5200 m imply mean temperatures at or above freezing at all elevations below 4500 m. Hence, this initial rise in discharge is interpreted as primarily a snowmelt signal that evolves into a snow- and ice-melt signal as temperatures exceed 0 °C at the snouts of the glaciers. The acceleration above 0 °C in water discharge due to snowmelt appears to be partially a hyposometric effect (Brozovic et al., 1997): with valley bottoms between 3000 to 4500 m in the rain shadow (compared to much lower valley bottoms on the southern Himalayan flank), a larger landscape area and a greater fraction and mass of the winter snowfall occurs between 4500 and 6000 m, thereby providing a larger source volume for runoff. A discrete thermal threshold of ∼1.5 °C at 5200 m appears to modulate sediment discharge (Fig. 16), which is always very low when temperatures at this altitude are < 1.5 °C. Given that 5200 m coincides spatially with the toes of many glaciers in the Nar-Phu drainage, we interpret that much of the sediment discharge is related to release of subglacial sediment by outwash channels. We infer that melting on glacial surfaces and enhanced water fluxes to their bases serve to accelerate (or initiate) basal sliding and sediment delivery to subglacial channels (Anderson et al., 2004). Despite continued melt discharge and intermittent rainfall events, the absence of significant sediment discharge in the last third of the monsoon season suggests that subglacial sediment discharge is supply limited and that most subglacial bedrock erosion or regolith evacuation occurs early in the melt season, as is seen in some well-monitored, small Alaskan glaciers (Riihimaki et al., 2005). The apparent limits on sediment supply on an annual basis cause a clockwise hysteresis when water and sediment discharge are plotted through time (Fig. 17), whereby for the same river discharge, sediment flux is persistently higher in the early monsoon season compared to the late monsoon season.
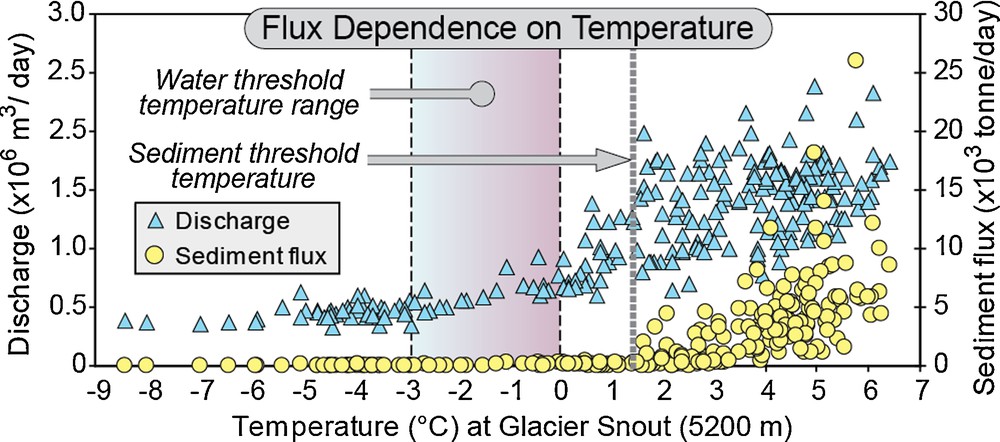
Water and sediment fluxes in the Nar-Phu catchment as a function of mean daily temperature near the glacier snouts. Water discharge increases between –3 to 0 °C, whereas a discrete threshold exists for sediment discharge at ∼1.5 °C.
Flux d’eau et de sédiment dans le bassin du Nar-Phu en fonction de la température journalière moyenne près du front du glacier. Le flux d’eau augmente entre –3 et 0 °C, tandis qu’un seuil discret existe pour le flux de sédiment à environ 1,5 °C.
Figure modified after Gabet et al., 2008.
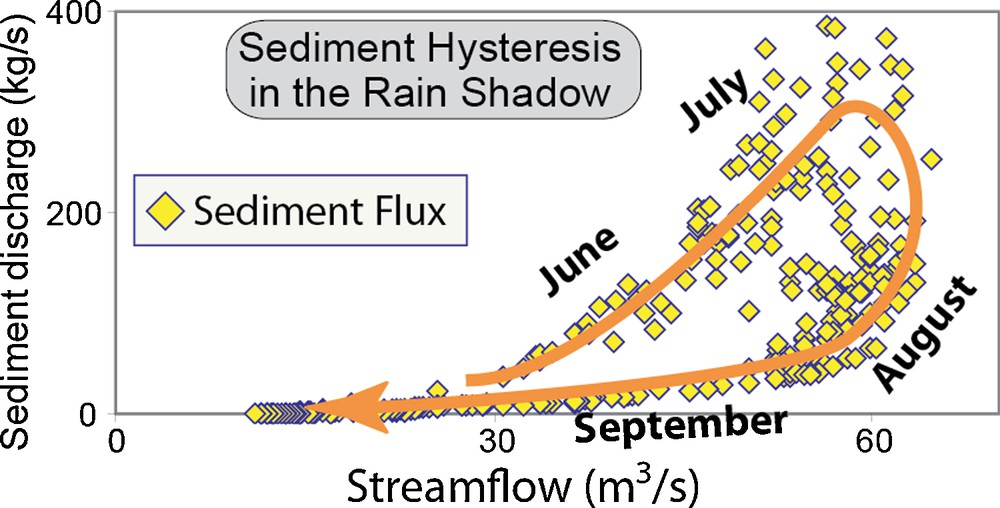
Sediment hysteresis in the Nar-Phu catchment during the monsoon. The decrease in sediment discharge in August and September, its independence from rainfall (Fig. 15), and its dependence on temperature (Fig. 16) suggest sediment is supply limited and is dominantly subglacial in origin.
Hystérésis relative au sédiment dans le bassin du Nar-Phu, pendant la mousson. La diminution du flux de sédiment en août et septembre, indépendante de la pluviosité (Fig. 15) et dépendante de la température (Fig. 16) suggère que le sédiment est limité dans son alimentation et est d’origine essentiellement glaciaire.
Figure modified after Gabet et al., 2008.
4 Discussion and conclusions
4.1 Caveats
The data presented here on modern weather and related sediment fluxes represent significant improvements in the density, precision, and temporal resolution of Himalayan climate data. The 5 × 5 km resolution of the TRMM data that spans the last 12 years of precipitation across the Himalaya is unprecedented and provides new insight on interactions between weather systems and large-scale topography. Similarly, the density both of meteorological stations in central Nepal and of sediment and water discharge stations there are unique up until now. Despite this wealth of new data, several caveats related to each data set should be kept in mind.
Each pixel in the Himalaya is observed by the TRMM precipitation satellite once every day or two. Hence, the evolution of weather systems at the time scale of hours or days is poorly resolved. In addition, the time of observation varies from day-to-day depending on the satellite orbits. Given that the summer monsoon in many places has a systematic daily cycle, it is common that satellite observation of the interval of highest or least precipitation is missed on any given day. For example, in the valley bottoms of central Nepal, the heaviest monsoon rainfall commonly occurs between 8 p.m. and 6 a.m., whereas on some mountain ridges, rainfall is heaviest between 11 a.m. and 5 p.m. (Barros et al., 2000). The unevenly timed satellite observations have the advantage of sampling an entire day over time, but require stacking of extended time series of data in order to obtain robust measures of average monthly or seasonal precipitation. Now, with over a decade of TRMM precipitation data available, the spatial variability in precipitation at monthly and longer time scales is well established (Bookhagen and Burbank, 2010).
Although the Nepalese Department of Hydrology and Meteorology runs a network of hundreds of weather stations, more than 90% of them are located in valley bottoms. The data from the relatively dense station network in the Marysandi have revealed significant contrasts between valleys and nearby ridges in their seasonal precipitation (Fig. 7), as well as during individual storms (Craddock et al., 2007). The climate record from the Marysandi network, however, only encompasses five monsoon seasons and is likely to have missed some of the abnormally strong monsoon years when rainfall penetrates much farther into the Himalaya and may drive intervals of considerably intensified erosion, particularly in normally dry areas (Bookhagen et al., 2005).
Few systematic data have been collected on snow accumulation in the Himalaya, especially on a daily basis using an automated network. The daily measurements of snowpack thickness and water-equivalent described here provide new insight into the altitudinal dependence of snowfall in the Nepalese Himalaya and its surprising spatial uniformity at any given altitude (Putkonen, 2004). Because wind so readily modifies the snowpack, however, these snowfall measurements should not be overinterpreted. In an effort to minimize the impact of drifting snow, most snow stations were situated in flat-ish areas with little abrupt topography nearby that might promote snow drifts. Surprisingly, winds are typically quite light on Himalayan ridges–a condition that should restrict drifting. Furthermore, the uniformity of snow accumulation among multiple stations at nearly the same elevation, but on different ridges, suggests that drifting of snow was limited.
Whereas continuous water and sediment discharge measurements would be ideal, the stations in the Marsyandi catchment (Fig. 6A) were measured twice a day at about 7 a.m. and 7 p.m.. Given the size of our sampled tributary catchments (a range from 7 to 500 km2), common water velocities of ≥ 2 m/s, and the impulsive nature of sediment discharge into the rivers from landslides, many sediment pulses could travel downstream in a few hours and be completely missed by the twice-daily sampling scheme. The four-year duration of sampling is too short to capture the typical variability seen in longer discharge records, and the observed suspended sediment flux can be perturbed either by lower than average fluxes over the sampling period or by unusually high fluxes. For example, in one 500-km2 catchment, one debris-flow event accounted for about half of the total measured sediment flux over the 4-yr sampling period (Gabet et al., 2008). By averaging across several tributary catchments, we suggest that the relative rates between catchments are meaningful and define a reliable regional gradient in modern erosion rates (Fig. 9).
4.2 Precipitation and topography
The regional overview of monsoonal rainfall from satellite data shows that, despite a nearly 10-fold, east-to-west decrease in rain that falls on the foreland, the amount of precipitation carried into the Himalaya from the foreland along the length of the range remains remarkably constant. Although the summer Indian monsoon certainly dominates the water budget, the syntaxial regions of the Himalaya are strongly impacted by the Westerlies in the NW Himalaya and by the East Asian monsoon near the eastern syntaxis. Moreover, the central Himalaya receive > 70% of their annual precipitation during the monsoon, whereas the western syntaxis receives only 25 to 65% of its precipitation during the summer. Similarly, the contribution of snowmelt to runoff is greatest near the syntaxes and least along the central Himalaya.
The availability of a reliable digital elevation model for the Himalaya (Farr et al., 2007; Hirt et al., 2010) and precipitation data with a high-spatial resolution provides new opportunities to explore interactions among climate and landscapes. These data show that profound control is exerted by topography on the across-strike distribution of precipitation in the Himalaya. The variability in topographic relief on the upwind (southern) flank of the Himalaya appears to be of great importance in controlling the loci of maximum precipitation at decadal timescales (Fig. 3). The presence of either one or two bands of high precipitation along the length of the Himalaya is closely linked to whether the topography between the foreland and the Himalayan crest encompasses one or two abrupt steps in mean elevation or relief. A threshold appears to exist for the relief required to create a noticeable precipitation peak: the outer peak that is closest to the foreland requires at least 1 km of relief, whereas the inner band nearer the crest is associated with relief exceeding 2 km (Fig. 4). A similar correlation of rainfall with relief is appparent in the central and northern Andes: a setting where initial relief of ∼1 km (in a 3-km radius) is consistently associated with peaks in rainfall on the windward side of the range (Bookhagen and Strecker, 2008).
Observations from both the MODIS satellite and the Marsyandi network have yielded new insights on the distribution and amount of snowfall in the Himalaya. In the syntaxial regions, for example, snowfall (and subsequent melting) makes a far larger contribution to discharge than in the central Himalaya. Whereas little snow accumulates below ∼2 km altitude in the central Himalaya, snow accumulations steadily increase at higher altitudes of up to of ∼4.5 to 5 km, before apparently leveling off and then dramatically decreasing above ∼ 6 km elevation. Although global warming could just shift this pattern vertically as temperatures rise, the abrupt decrease in topography lying above 6 km suggests that vast reductions would occur in the cumulative volume of snow and should generally lead to an average decrease in glacial size in the face of continued warming.
Whereas measured monsoon rainfall displays a 10-fold decrease in rainfall from south to north across the main Himalaya, the gradient in annual erosion is ∼20-fold across this same transect. A strong contrast between the northern and southern Himalaya also exists in style of erosion and the apparent role of rainfall. In the monsoon-drenched southern Himalayan flank, landslides appear to deliver impulsive sediment loads into rivers during big storms, but nearly a meter of antecedent rain must have fallen prior to the onset of any significant sediment input into the rivers. In the northern catchments lying in the rain shadow, the sediment flux does not correlate with rainfall either on a daily basis or on several successive days, and although this flux correlates with water discharge during the first half of the monsoon, it becomes decorrelated with discharge in the second half of the monsoon season as the sediment flux drops precipitously in late August.
These observations suggest that, in the rain shadow, hillslopes are not supplying the bulk of the sediments via rain-modulated landslides (as they do on the southern flank), that rainfall-independent snowmelt on hillslopes might saturate near-surface layers and mobilize sediments into channels in a “chronic” style, or that most of the sediment is supplied by subglacial channels. This last contention would be consistent with recent cosmogenic nuclide analyses in the Marsyandi catchment (Godard et al., 2012) that suggest that erosion rates of several millimeters per year beneath modern glaciers generate a sediment flux that, during downstream transport, becomes highly diluted by sediment-poor discharge from slowly eroding, non-glacial catchments in the rain shadow.
The combination of regional precipitation overviews from satellite observations with detailed observations of precipitation and erosion from dense local networks appears to provide a powerful perspective that underpins new insights on how topography, precipitation, and erosion processes interact at daily to decadal time scales. More local networks and an increased temporal density of satellite observations promise to continue to augment and improve this perspective.