

1 Introduction
Vegetation debris has been identified as a factor able to disrupt a wide range of stakeholder activities, including fishing, irrigation pumping stations, and hydroelectric and nuclear power plants (Batalla and Vericat, 2009; Palau et al., 2004). More precisely, vegetation debris occasionally threats infrastructures, increases operating costs, and reduces the productivity of power-generating plants and water-pumping devices (Gómez et al., 2013). Until recent years, few studies have focused on natural, plant-derived debris. Scientific literature has mainly considered biogenic detrital matter as sources of food or habitat (Wei et al., 2012).
Marine litter, defined as manufactured or processed solid material disposed or abandoned, either directly or indirectly, in the marine and coastal environment (Derraik, 2002; Hastings and Potts, 2013), is nowadays recognized to have worldwide repercussions leading to an increased international interest to address problem associated with it. Because marine and transitional environments provide important services for society, marine litter and natural debris occurrence results in unmeasured economic and environmental costs (Kirkley and McConnell, 1997). Estimating the fluxes of debris is therefore crucial in order to understand their potential impacts (Kataoka et al., 2013).
There have been no previous investigations in highly-turbid, macrotidal estuaries, where high concentrations of suspended particulate matter (SPM) conceal this coarse fraction (Etcheber et al., 2007; Savoye et al., 2012), although plant detritus can be trapped in the turbidity maximum zone (TMZ) and be subject to tidal resuspension for several weeks (Suzuki et al., 2012). In western Europe, the Gironde Estuary is the largest fluvio-estuarine system, characterized by a well-developed TMZ (Allen et al., 1980; Jouanneau and Latouche, 1981). In recent years, a new economic impact of vegetation debris (according to the Environmental Protection Agency (EPA) impact classification) is reported in the Gironde Estuary: the electricity production process of the Blayais Nuclear Power Plant (NPP), located since 1976 in the central estuary, has been disturbed after the reception of large and sporadic amounts of terrestrial vegetation debris, particularly at the end of the winter season (Travade and Guerin, 2009). Because large volumes (∼160 m3 s−1) of estuarine waters are continuously pumped and filtered through the NPP cooling system, the functioning of the NPP can thus be interrupted by clogging of the filtration units.
This study is, consequently, the first attempt to investigate the spatiotemporal distribution of coarse particulate matter (CPM) in the Gironde Estuary. Our objectives were: to describe CPM trends during neap and spring tides, to understand the seasonal and interannual dynamics of CPM, in relation to hydrological context, and the impact of a flood on CPM. Finally, we present the first estimate of the contribution of CPM organic fraction to the carbon budget of the Gironde Estuary.
2 Materials and methods
2.1 Study area
The Gironde fluvio-estuarine system (SW France, 170 km long, Fig. 1) drains a watershed with an area of 71,000 km2. During its propagation along the estuary, the tidal wave becomes asymmetrical, favouring flood dominance in the upper reaches (Allen et al., 1977). The resulting residual circulation, combined to the length of the estuary, induce long residence times of water and particles, which have been estimated to be approximately 20–86 days for water and 12–24 months for SPM, depending on river discharges (Jouanneau and Latouche, 1981; Saari et al., 2010). The high residence times generally favours the existence of a highly-concentrated TMZ (Uncles et al., 2002). Thus, suspended sediment concentrations in the Gironde are regularly greater than 1 g L−1, even in surface waters (Sottolichio et al., 2011), and up to 10 g L−1 near the bottom (Jouanneau and Latouche, 1981). In the TMZ, exchange of particles between the water column and the bed are intense and mainly controlled by tidal currents at the scale of the semi-diurnal tidal cycle. At the fortnightly tidal scale (14-d lunar cycle), a modulation of current velocities occurs, leading to periods of net bed erosion and maximum SPM in the water (spring tides) and periods of net bed sedimentation and minimum SPM (neap tides). The latter favour the formation of fluid mud on the bed, where the concentration exceeds 100 g L−1 (Allen et al., 1977). In addition to tidal effects, the TMZ moves along the estuary axis according to water discharge (Selva et al., 2007). When water discharge increases, the TMZ moves down the estuary (PK20-PK80) (Fig. 1B/C). In contrast, during low river flow periods, the TMZ is localized in the fluvial and central estuary (PK0-PK50; PK: kilometric distance from Bordeaux City). Consistently with these river flow variations, fluid mud deposited upstream during low river discharge can be swept out during flood events (Abril et al., 1999). Estuarine particulate material is flushed in the Bay of Biscay under extreme hydrological conditions, including series of floods, high water discharges (> 3000 m3 s−1) and spring tides (Castaing and Allen, 1981). Most of particulate matter exports toward the adjacent shelf occurs as large plumes (Froidefond et al., 1999), and also within benthic nepheloid layers (Jouanneau et al., 1999).
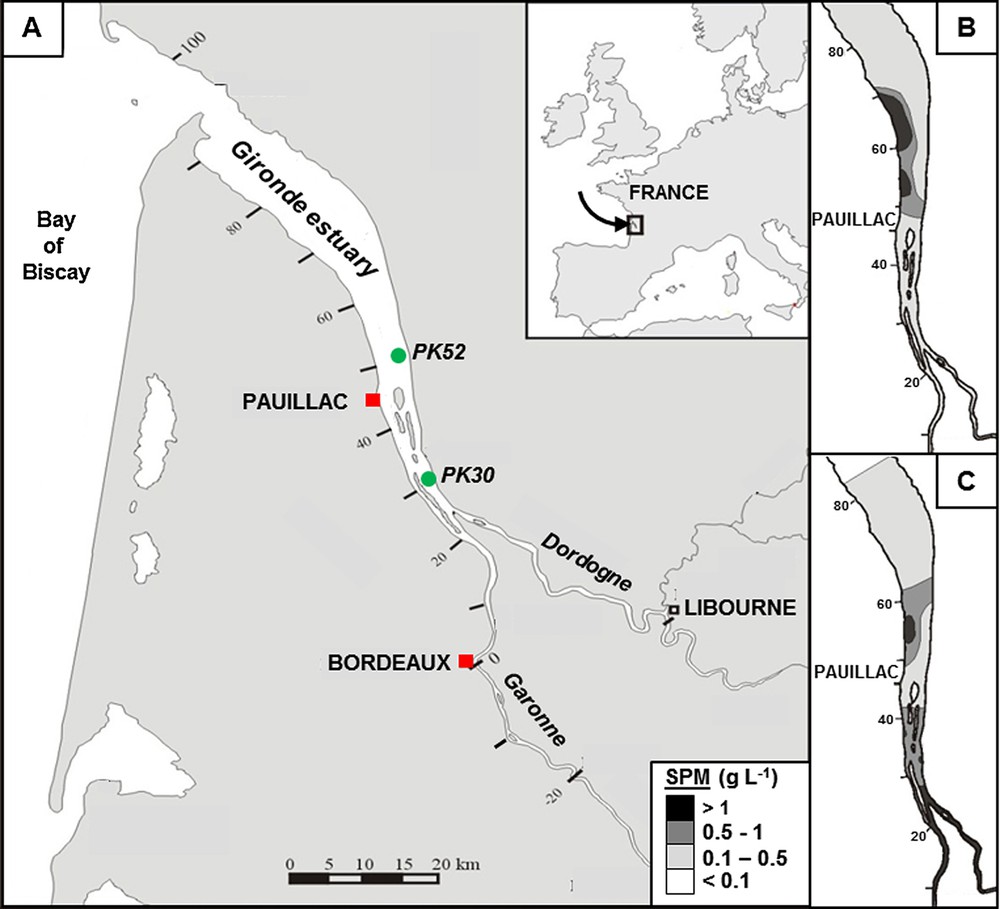
(Colour online). Location map of the Gironde fluvial–estuarine system, showing the main tributaries (Garonne and Dordogne) and the mean position of the TMZ (A). The two sampling sites, PK30 and PK52 (PK = kilometric distance of the site from the city of Bordeaux) are located in the TMZ. Pauillac and Bordeaux are equipped with real-time automated stations. The TMZ moves up and down along the estuary depending on the tidal cycle and fluvial discharge. The insets show SPM concentrations in surface waters at low tide under moderate (B) and low (C) river flow conditions.
Modified from Sottolichio and Castaing (1999).
The supply of particles by riverine transport into the TMZ is continuous through the year (Abril et al., 1999; Jouanneau and Latouche, 1981) and is estimated at two to three million tons (Veyssy et al., 1998). Estuarine particles are mainly composed of clays and silts (Castaing et al., 1984), predominant in this estuary (Jouanneau et al., 1999); their organic content is about 1.5%, with negligible seasonal change and main terrestrial origin. The low penetration of light prevents photosynthetic activity (Irigoien and Castel, 1997) and favours heterotrophic processes (Crump et al., 1998; Goosen et al., 1999). Therefore, the percentage of estuarine autochthonous particulate organic matter (estuarine phytoplankton and/or macrophytes) is negligible in comparison to the terrestrial organic fraction (Etcheber et al., 2007; Savoye et al., 2012).
2.2 Sampling and analyses
This investigation was conducted at two stations located in the central estuary, PK30 and PK52 (Fig. 1), where the TMZ is present most of the year (Sottolichio et al., 2011). These stations were sampled monthly in two different years: from February to November 2011, and from January to April 2013, to encompass different hydrological contexts. Sampling was conducted at medium/neap tides during 2011 and at spring and neap (March, April) tides during 2013. During each surveyed semi-diurnal tidal cycle, SPM and CPM were sampled in surface and bottom waters at mid-ebbing, when concentrations of particles are the most abundant due to resuspension (Sottolichio et al., 2011). The determination of SPM concentrations was obtained by the filtration of a known volume (10–100 mL) of water on pre-combusted and pre-weighed Whatman GF/F filters, which were dried at 50 °C and weighed. Currently, there is no standardized method for the recovery of coarse fractions in transitional waters. In rivers, classical approaches for estimating CPM river budgets are used (Allan, 1995; Heartsill Scalley et al., 2012; Selva et al., 2007; Wallace et al., 1995), whereas in open waters (ocean areas), probably due to the growing interest in marine litter, new systems/techniques are being developed (Mace, 2012; Ryan, 2013). In this study we have developed a method using a phytoplankton net (WP 200 μm) equipped with a flow meter to filter a large volume of estuarine waters (several cubic meters) required to recover the coarse fraction. After filtering the known volumes, the samples were then separated mainly into two size fractions (0.3–1 mm; 1–3 mm) and, when necessary, another two more size fractions have been added (3–5 mm; > 5 mm), dried for 24 h at 50 °C and weighed to determine the CPM concentration. To verify the reproducibility of CPM sampling during the sampling window (mid-ebb), triplicate samples of bottom waters at the two sites have been recovered, to determine the sampling error associated with this type of coarse material estimate.
The organic carbon contents of SPM and of the two size fractions of CPM were determined by combustion in a LECO CS 200 analyser (Etcheber et al., 1999, 2007). Samples were acidified in crucibles with 2 N HCl, drop by drop (100 to 200 μL), to remove potential inorganic carbon. The analyses were performed by direct combustion in an induction furnace, and the CO2 produced was determined quantitatively by IR absorption. Particulate and coarse particulate organic carbon (POC and CPOC) refer to the particulate carbon of SPM and CPM, respectively.
River discharge and turbidity were used as complementary variables. River discharges in the Dordogne and Garonne rivers are measured at sites selected at the upstream limit of propagation of the tide, by the French service of fluvial discharge measurement (DREAL Midi-Pyrénées; DDT Dordogne). Since 2005, an automated continuous monitoring network, called MAGEST (MArel Gironde ESTuary), provides the real-time measurements of subsurface turbidity in the Gironde at four stations, including Pauillac and Bordeaux (Fig. 1) (Etcheber et al., 2011). The turbidity sensor measures values between 0 and 9999 NTU, with a precision of 10%; 9999 NTU corresponds to a SPM concentration of approximately 10 g L−1.
3 Results
3.1 Reproducibility of the CPM sampling
In order to estimate the reproducibility of the CPM contents in estuarine waters, we measured CPM concentrations in four sets of triplicate samples. Mean values and standard deviation are indicated in Fig. 2: for example, 2.30 ± 0.22 g m−3 for the 0.3–1-mm size fraction. One heterogeneous sample (PK52, 0.3–1 mm: mixture of fine sands, mineral micas and different shapes and sizes of vegetal debris) presents a large scattering of values (factor 3: 0.81 to 2.59 g m−3).
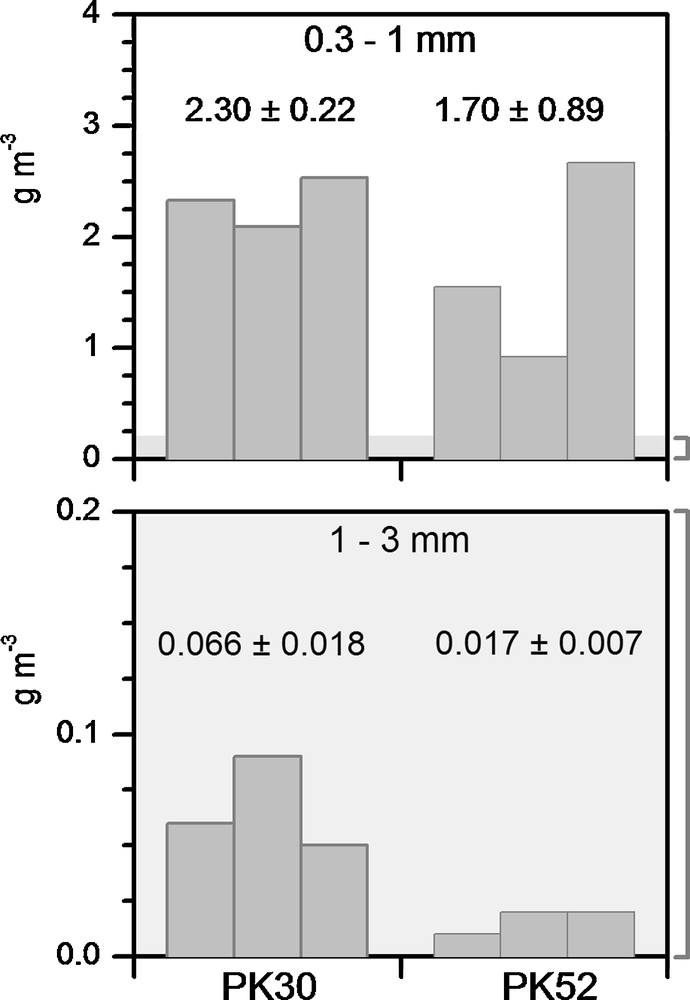
Reproducibility in the CPM determination based on triplicate samples collected in February 2012 at sites PK30 and PK52 (see “Methods” section for details). Mean value and standard deviation are given for each triplicate series. The results are plotted separately for the two size fractions, 0.3–1 mm and 1–3 mm, due to the large differences in the concentration ranges. The grey areas and the accolade indicate the correspondence between the scales of the two graphs.
However, considering the very low concentrations of the coarse material, which are less than a few grams per cubic meter, we consider these differences as natural variability within the sampling window. Our results present logical and interpretable spatiotemporal trends of CPM concentrations, considered in the discussion.
3.2 Hydrological context and TMZ occurrence
The main parameters controlling TMZ position in the fluvio-estuarine system of the Gironde are river flow and tides (Etcheber et al., 2011; Sottolichio et al., 2011). The comparison of turbidity recorded at Pauillac (central estuary) and Bordeaux was used then to detect the precise location of the TMZ, according to river discharge (Fig. 3).
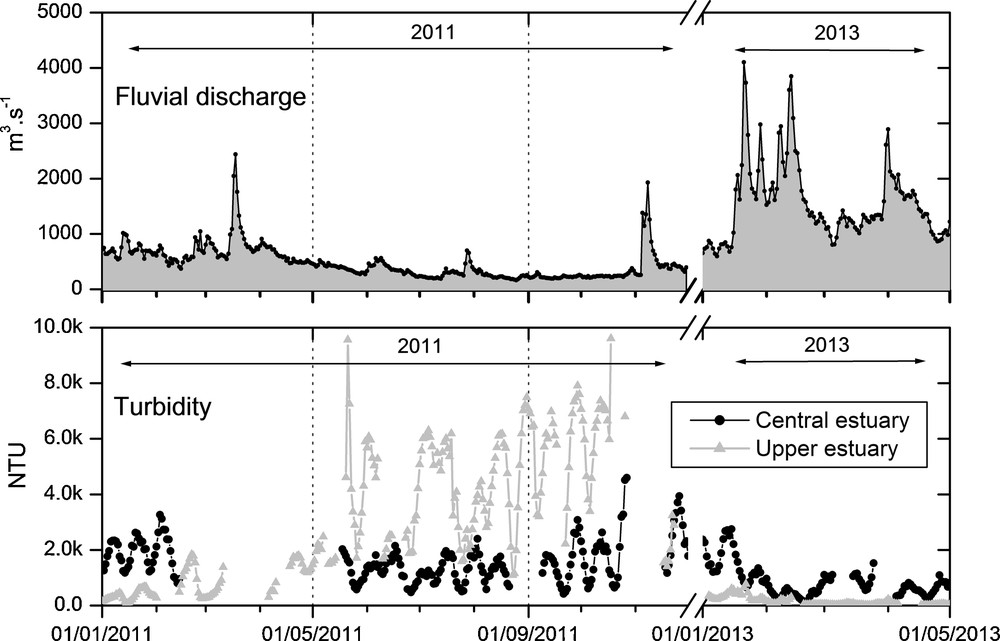
Evolution of daily-averaged fluvial discharge (m3 s−1) and turbidity (NTU) in the central and upper estuary from January to November 2011 and from January to April 2013.
During the year 2011, the fluvial discharge was characterized by two moderate flood events in March and November; the period of low discharge continued from May to late October (Fig. 3). At Pauillac, the average daily turbidity is between 421 and 4597 NTU, which confirms the persistence of the TMZ in the central estuary. Upstream, Bordeaux presents a large range of turbidity values, from negligible values (minimum of 91 NTU) during flooding to 9613 NTU, which are the highest values recorded in the low-discharge period during summer.
Concerning the year 2013, a first peak of freshwater flow occurred on 21 January (4000 m3 s−1), once our sampling had started (Fig. 3). After, fluvial discharge remained higher than 1500 m3 s−1 during almost two months, with a second significant peak of 3800 m3 s−1 on 13 February (23 days after the first one). As a consequence of the large volume of freshwater flowing between these discharge peaks, the daily-averaged turbidity at Bordeaux decreased drastically from 607 NTU to 40 NTU, and at Pauillac from 2680 NTU to 158 NTU, respectively. After these events, the fluvial discharge remained steady, between 1000 and 2000 m3 s−1, which favoured the recreation of the TMZ in the central estuary.
3.3 Spatiotemporal variability of CPM contents
For the year 2011 (Fig. 4), regardless of the season or of the coarse particulate fraction (0.3–1 mm or > 1 mm), the CPM concentrations are 3–10 times higher at the PK30 station than at the PK52 station. Furthermore, the concentrations are systematically higher in the bottom waters than in the surface waters, except for the 0.3–1-mm size fraction in October at PK30. In comparison to the SPM concentrations, however, the CPM concentrations are generally moderate at the PK30 station (0.3–1 mm: 0.1–1.6 g m−3; > 1 mm: 0.01–0.29 g m−3) and much lower at the PK52 station (0.3–1 mm: 0.01–0.2 g m−3; > 1 mm: 0.01–0.1 g m−3). Only one marked increase is observed in February for both fractions at the PK30 station (0.3–1 mm: up to 1.6 g m−3; > 1 mm: up to 3.1 g m−3). During summer and autumn low fluvial discharge, the 0.3–1-mm fraction increases at the PK30 station (1 to 2 g m−3), simultaneously with the high turbidity of waters at this upstream station.
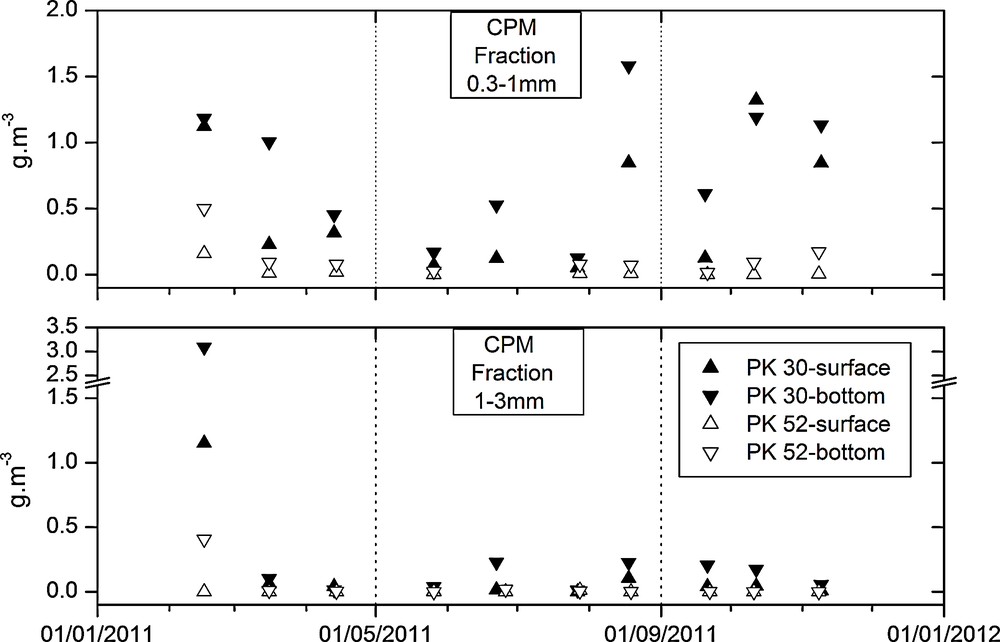
Coarse particulate matter concentration (g m−3) at neap tides, from February to November 2011. Two fractions are showed (0.3–1 mm and 1–3 mm) for two levels of water column depth (surface and bottom) and for both stations (PK 30 and PK 52).
In 2013, globally, CPM concentrations (Figs. 5 and 6) were in the same range as those measured in 2011 and showed most of the time, similarly, higher CPM contents at PK 30 than at PK 52. However, one of the main differences was the record of two additional fractions (3–5 mm and > 5 mm) during the spring tides of March. Indeed, the size of the CPM in previous sampling was systematically lower than 3 mm. The fraction > 5 mm was exclusively found at PK 52 (this fraction is not represented in Figs. 5 and 6).
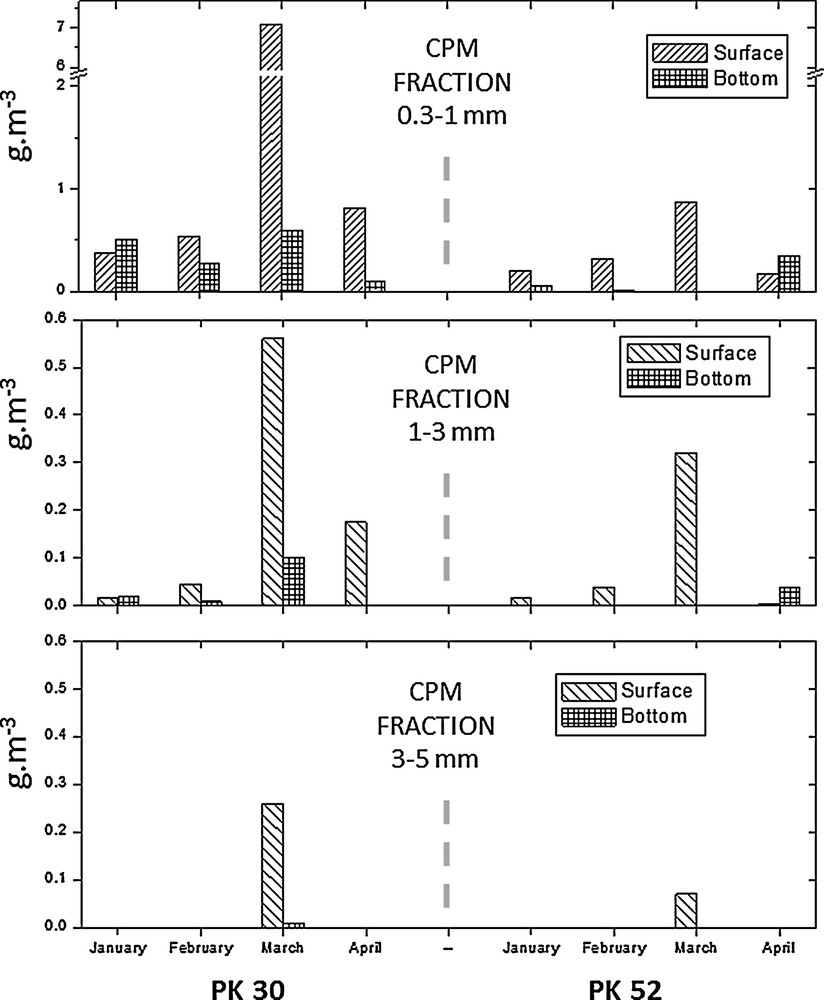
Coarse particulate matter concentrations (g m−3) at spring tides, from January to April 2013. Three fractions are showed (0.3–1 mm, 1–3 mm and 3–5 mm) for two levels of water column depth (surface and bottom) and for both stations (PK 30 and PK 52). The fraction > 5 mm is not represented due to the existence of only one value (in March, at PK 52, surface) equal to 0.03 g m−3.
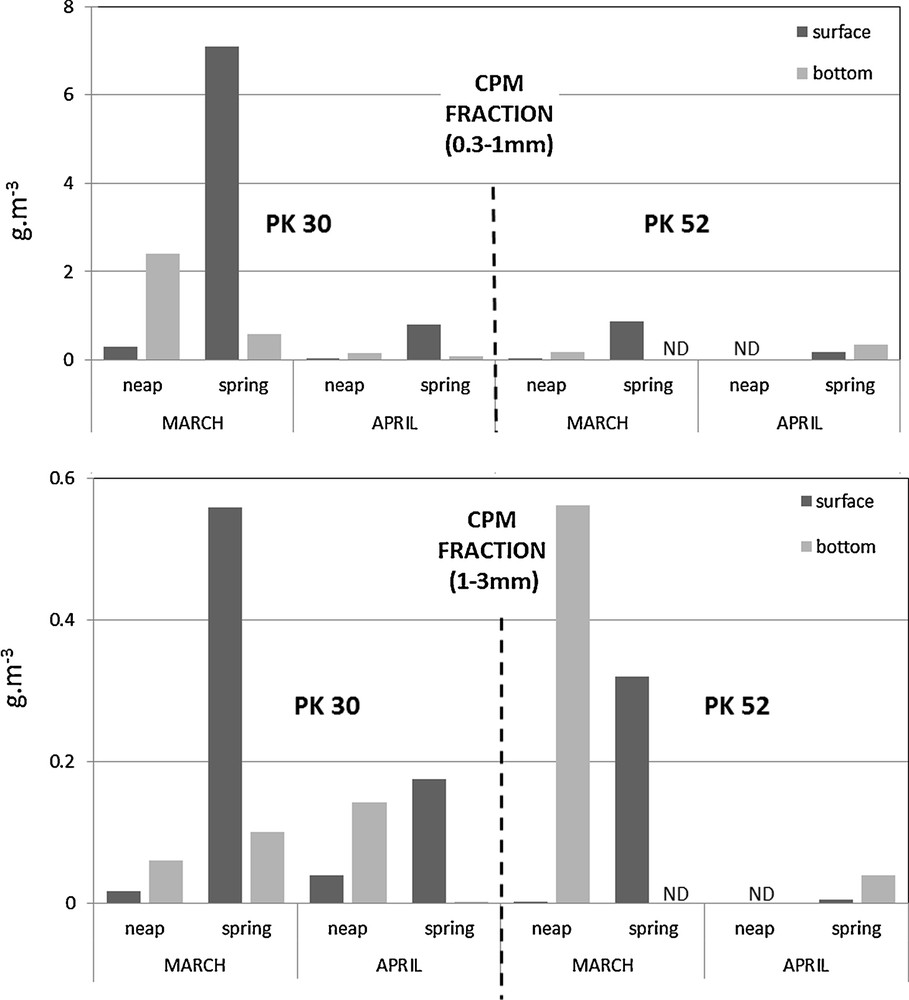
Comparison of CPM concentrations (g m−3) according to neap or spring tides in March and April 2013, at stations PK30 and PK52. Two fractions are showed (0.3–1 mm and 1–3 mm) in surface and bottom waters. ND: not determined.
Concerning the monthly evolution from January to April 2013, there is, at both stations, a perceptible increase in the smallest CPM fractions in March (0.3–1 mm: up to 7.1 g m−3; 1–3 mm: up to 0.56 g m−3; Fig. 5) in comparison to those registered during the rest of this period. In addition, this increase of CPM contents was more pronounced at PK 52 station (× 10) than at PK 30 (× 6). This highlights a higher sensibility of the central estuary facing to the modifications of the CPM content, in spite of systematic higher CPM contents at PK 30 station (upstream station). The link with the hydrological context is detailed in the “Discussion” section.
Furthermore, the highest values of CPM concentrations are observed in surface waters during spring tides from January to March 2013. Such result is the opposite of the trend that we have regularly observed at neap tides, where the highest values were always obtained in bottom waters (Fig. 6). March was the only month when CPM concentrations of the fraction 1–3 mm reached higher values during neap tides than during spring tides (regardless of the depth and the station).
Finally, at both stations, the comparison of coarse and fine particulate matter concentrations over the course of the entire year shows that the coarse fractions, regardless of the fortnightly tidal cycle, never exceed 0.2% of the estuarine SPM and, most of the time, remain below 0.05%.
3.4 Organic carbon content of the CPM
The organic carbon content of CPM (expressed in the percentage of dried matter) shows large variability (Table 1) as a result of the possible presence of fine sands and mineral micas in the samples. The 0.3–1 mm fraction contains 16–25% organic carbon; the percentage increases in the 1–3-mm fraction (32–38% of organic carbon) and in the largest fractions only recovered in March 2013 (3–5 mm: 42.2%; > 5 mm: 41.1%). In the central estuary, the POC percentage of the abundant fine particles ranges between 1.3–1.7% (average value: 1.5%) (Abril et al., 2002). Therefore, the ratio of CPOC to POC in the Gironde Estuary never exceeds 3% and remains approximately 1.3% at station PK30 and 0.1% at station PK52. This low contribution is the result of the large difference in CPM and SPM concentration, measured in g m−3 and g L−1 respectively.
Contribution of CPOC to POC (in %; n: number of samples; ± standard deviation), according to CPM size class at stations PK30 and PK52 in the TMZ of the Gironde Estuary. Data concerning the year 2011 correspond to neap tides, whereas those for 2013 are related to spring tides.
| Year | Station | Size fraction | CPOC (%) | ||
| (mm) | n | Mean | ± | ||
| 2011 | PK30 | 0.3–1 | 20 | 16.5 | 6.4 |
| 1–3 | 20 | 35.5 | 8.4 | ||
| PK52 | 0.3–1 | 19 | 24.3 | 10.2 | |
| 1–3 | 10 | 32.7 | 18.8 | ||
| 2013 | PK30 | 0.3–1 | 7 | 19.3 | 1.7 |
| 1–3 | 7 | 38.4 | 1.6 | ||
| 3–5 | 1 | 42.2 | 1.4 | ||
| PK52 | 0.3–1 | 8 | 20.0 | 4 | |
| 1–3 | 8 | 36.0 | 2 | ||
| 3–5 | 3 | 37.0 | 1 | ||
| > 5 | 1 | 41.1 | ND |
4 Discussion
4.1 Vegetation origin of coarse particulate organic matter
As nearly no autochthonous organic matter is produced inside the estuary by submerged macrophytes or phytoplankton, the predominant fine terrestrial POC and the CPOC are transported from upstream during high water discharges (Etcheber et al., 2007; Savoye et al., 2012). The high CPOC content and a visual identification clearly suggest that vegetation debris is predominant in the coarse organic fraction. The measured C/N ratios (> 20, Fuentes-Cid, 2014) are characteristic of terrestrial plants (Meyers, 1994) and confirm this hypothesis. In a macrotidal estuary such as the Gironde, where residence times of particles are long enough (several months) to allow physicochemical transformation of the labile fraction of the CPOC, the presence of vegetation material in a large range of sizes, densities and degrees of degradation is expected.
A riparian origin of CPOC has been studied in numerous streams (Abelho, 2001; Heartsill Scalley et al., 2012; Wallace et al., 1995; Webster and Benfield, 1986); however, very few studies have focused on large river systems (Kendall et al., 2001), and none on the CPOC in macrotidal estuarine systems. The main reasons must be related to the fact that POM sampling is frequently biased towards the fine-fraction of suspended matter and to the difficulty to sample in large river systems. Indeed the huge concentration in fine particles implies sampling of small water volumes, typically < 100 mL, which are not able to capture larger-sized terrestrial debris.
In spite of the low concentrations of the coarse material, which are less than a few grams per cubic meter, and of the heterogeneous nature of the coarse matter, our work demonstrates that collection of this material is possible by using an appropriate sampling strategy and evidences logical trends in spatiotemporal CPM concentrations.
4.2 Transport processes of coarse and fine particulate matter in the estuary
Particulate organic matter transport in estuaries is determined by the interaction between the physical and chemical properties of waters and sediments, hydrodynamic variability and retention mechanisms (Golladay et al., 1987; Jacobson et al., 2000; Naiman, 1982; Pozo, 2005; Tank et al., 2010). Thus, estuaries can be considered as filters for particulate matter, due to trapping, settling and transport processes.
4.2.1 Tidal control in CPM dynamics
As described for the fine particles, the transport and behaviour of CPM are expected to be governed by river flow and by the repeated deposition and resuspension cycles. These cycles are driven by ebb and flood currents, which are modulated by tidal range. The resuspension of the largest CPM fractions is expected to be more effective under highest velocity currents, which occur mainly at spring tides (Fig. 6). In our survey, the largest CPM fractions (> 3 mm) were detected only in March 2013, during spring tides. This confirms the existence of a tidal control on CPM resuspension.
Because of its physical properties (mainly weight, but also size and shape), CPM is recognized to be transferred preferentially by bedload transport to the central estuary (Odum et al., 1979). That trend is coherent with the CPM survey of 2011 and 2013 (the group of samples obtained at neap tides) when CPM concentrations were systematically higher in bottom waters compared to surface waters. However, in 2013, CPM concentrations at spring tides did not follow this rule, with higher values in surface than in bottom waters.
4.2.2 The flood-pulsed transport of CPM
The smaller the particle size, the more closely its transport is related to hydrological conditions (Thomas et al., 2001). In this study, hydrological contexts were remarkably different during the two sampling periods; discharge was particularly high during the first semester of 2013.
If floods do not occur in autumn/winter, as observed in 2011, fine particles are trapped in the upstream estuary, and the TMZ extends toward the fluvial section of the Gironde Estuary. The low river discharge is then unfavourable to the downstream transport of CPM from the rivers, when CPM is released from the falling of autumn leaves. Therefore CPM remains mainly upstream through the year and exclusively a minor part of the CPM riparian load that achieves to enter into the central estuary (as observed in 2011). For this reason, CPM in the central estuary is dominated by the smallest fraction and the highest CPM concentrations are observed in the upstream estuary, close to its source (riparian watershed).
On the contrary, when an increase in the fluvial discharge occurs in autumn/winter, there are large changes in SPM and CPM distributions. The increase of the fluvial discharge in 2013 was rapidly followed by a downstream translation of TMZ toward the central estuary close to the Blayais NPP. Thereafter, there is a successive and delayed appearance of the different CPM fractions at station PK 52. First, there was a translation of TMZ simultaneously to discharge increase. Then the smallest fractions of CPM (0.3–1 mm and 1–3 mm) increase, and lastly, the largest ones (3–5 mm and > 5 mm) were observed at the central estuary 66 days after the discharge peak (4000 m3 s−1), and about 37 days after the downstream TMZ displacement.
There is an obvious increase of the temporal lag at the arrival of the CPM in the central estuary, with increasing particle sizes. Miliša et al. (2006) had previously shown the decreasing influence of flow velocity with the increase of the size of organic particles. Our result supports the critical role of flood on the CPM estuarine dynamics, although other factors could be, initially, thought of as decisive as well (season, fortnightly tidal cycle, interannual variability). During the rise of fluvial discharge, the resuspension and carriage of the coarse material, deposited in the fluid mud (on river bottoms) or on the riverbanks, are likely to create pulsed inputs of vegetation-derived coarse organic matter. The flood-pulsed input of CPM has been detected in the central estuary for two reasons: the rise of CPM concentrations but, above all, the appearance of the largest fractions (> 3 mm) in the water column in March 2013. In addition, the disappearance of flood-pulsed effects happens in a short period of time, as traced by the rapid decrease of CPM concentrations within two weeks in April 2013.
This study highlights the difficulty to sample and observe such increases in CPM concentration that occur on short time scale, less than 2–3 weeks, in the central estuary following a flood event. In fact, the lack of a continuous daily sampling does not allow to accurately define if the arrival of the largest CPM fractions is sudden or progressive over several tidal cycles or days.
4.2.3 Contribution of CPM to the POC budget
The long residence time of particles in the Gironde Estuary (Jouanneau and Latouche, 1981; Saari et al., 2008) contributes to the degradation of CPM, which is a factor that can also explain the difference of CPM concentrations between the two studied stations.
The upstream CPOC (1.25% of the POC carbon, in total mass) is close to the values reported by Wallace et al. (1995), who found a contribution of the CPOC to the total exported carbon between 1.8 and 3.8% for Appalachian streams. However, comparison of these values with those obtained for the central estuary (PK 52 station) shows that the contribution of the CPOC diminishes by a factor of 10. In fact, there is a clear difference of data between these two estuarine stations, both located in the TMZ and only separated by 22 km. This result fits with the idea that the transfer of CPOC between the two stations can last a long time, but during flood events, this difference could hypothetically disappear due to a short transfer time.
Even in shallow and non-turbid estuaries, where the contribution of plant matter has been demonstrated to be permanent and essential to food sources (Flindt et al., 1997, 1999; Salomonsen et al., 1997, 1999), no CPM and CPOC balances have been conducted.
This study shows, for the first time, the negligible contribution of CPM and CPOC, in comparison to fine material (SPM and POC), to the mass and carbon budget in the highly-turbid Gironde Estuary. Nevertheless, the occurrence of CPM, in addition to its distribution, can be a threat for industries filtering large volumes of estuarine waters.
4.2.4 The need of further investigations of CPM in estuaries
Over the last 30 years, the flow rate of the Gironde decreased significantly (1030 m3 s−1 in the early 1980s to 740 m3 s−1 in late 2000s), causing salinization of the system (David et al., 2005). A gradual upstream displacement of the TMZ is known to occur in the fluvial-estuarine area (Sottolichio et al., 2011); accordingly, the accumulation of CPM would be favoured in these fluvial sections. During high discharge periods, more pronounced flood-pulsed inputs of CPM in the central estuary can then be expected, causing more complex disturbances for human estuarine activities. A better knowledge of the conditions of critical CPM fluxes is now required in order to minimize economic impacts in transitional waters.
Up to now, CPM had been often neglected in estuarine mass balances. The main reasons of this shortcoming are its physical characteristics (size, shape) and its preferential bedload transport in estuaries (Odum et al., 1979) that makes its sampling difficult. This study demonstrates the feasibility of estuarine CPM sampling. The sampling approach presented in this study will facilitate the development of further studies of CPM in large estuarine systems, which play an important role in world economies (Constanza et al., 1997).
Acknowledgments
The authors are especially grateful to Georges Oggian, Hervé Derriennic, and Mariange Cornet for their field support and to the SOGIR (SOMLIT/Blayais) survey for ship availability. This study was financed by EDF R&D.
We thank the two reviewers, Tamara Heartsill Scalley and Maria da Conceiçao Freitas, for their comments and suggestions which have improved our manuscript.