

1 Introduction
The protoliths of metamorphic basic rocks, like amphibolites or eclogites can have several origins, such as basalts, gabbros, marls or pyroclastics. The identification of the origin of basic rocks plays an important role in the reconstruction of the paleoenvironment and paleogeodynamic situation of the studied regions.
The crystalline Edough massif in the eastern Maghrebides also includes outcrops of amphibolite facies metamorphosed basic or mafic rocks. Two of these are interpreted as metamorphosed volcanic or subvolcanic rocks of different paleogeodynamic environments. The third one, amphibolites interlayering with metamorphosed calcareous sediments in the “Cap de Garde”/Annaba, is of unknown petrogenetic origin. Therefore, the purpose of the present study is the petrological and geochemical characterization of this type of metabasites in order to determine their protoliths and their geodynamic setting.
2 Geological background of the Edough massif
The Edough massif, an asymmetric “core complex” (Caby and Hammor, 1992) oriented NE–SW (Fig. 1), is the easternmost crystalline massif of the internal zones of the Maghrebides (Bruguier et al., 2009). The latter represent the southeastern part of the west Mediterranean orogen. The Edough massif has experienced a common geodynamic and metamorphic history with the Alkapeca (Alboran–Kabylia–Peloritani–Calabria) zone (Bouillin, 1986; Michard et al., 2006).
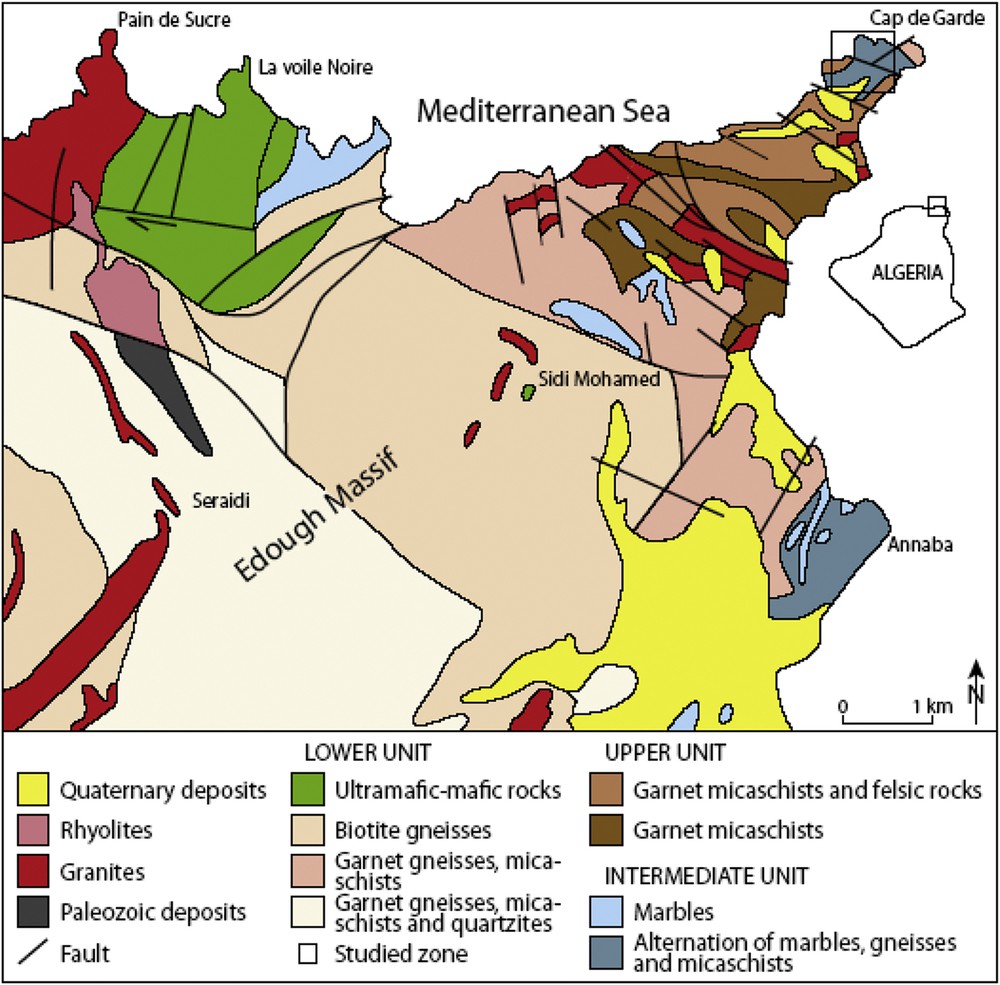
(Color online.) Simplified geological map of the Edough massif modified after the works of Hilly (1962); SONAREM (“Société nationale de la recherche minière”) 1980; Gleizes et al. (1988), Caby and Hammor (1992), Ahmed-Said and Leake (1992, 1997), Hadj Zobir et al. (2007) and references therein.
The metamorphic rocks of the Edough Massif consist of two tectonically superposed units. The first one is the so-called “Unité inférieure” (Lower Unit), which corresponds to a Hercynian (286–308 Ma) crust (Bruguier et al., 2009) composed of weathered biotite gneisses and two mica augen-gneisses. These gneisses have arkosic protoliths (Hadj Zobir, 2012; Hadj Zobir and Mocek, 2012) and contain benches of leptynites and marbles (Ahmed-Said et al., 1993; Gleizes et al., 1988; Hilly, 1962), as well as ultramafic and mafic rocks (Ahmed-Said and Leake, 1993, 1997; Bossière et al., 1976; Hadj Zobir et al., 2007; Hadj Zobir and Oberhänsli, 2013). The second one is known as the “Unité supérieure” (Upper Unit) and consists of several kinds of micaschists (sericitoschists, chloritoschists) with centimetric levels of quartzite. On the basis of the presence of acritarches, an Ordovician–Devonian age has been assigned to this unit (Ilavsky and Snopkova, 1987). These two units are interconnected by the so-called “Unité intermédiaire” (Intermediate Unit) composed of garnet micaschists and kyanite or sillimanite or andalusite bearing micaschists and meter-thick benches of marbles. The Edough Massif underwent polycyclic metamorphism. This is characterized by two major events:
- (i) a high-temperature and middle-pressure event (HT–HP; P = 12–13 kbar, T = 700 °C) corresponding to HP-amphibolitic conditions;
- (ii) a low-pressure–high temperature event, equivalent to an LP-amphibolite facies, at P = 3–4 kbar and T = 650–700 °C (Ahmed-Said et al., 1993; Brunnel et al., 1988; Caby et al., 2001).
The massif underwent a first deformation, characterized by syn-metamorphic folds followed by a second deformation, which generated upright fold axes in a N140° direction followed by younger anticlines in a direction from N50° to N60°.
In the whole area, different types of amphibolite, the so-called metabasites cited in the literature, are occurring. The first occurrence, the “Kef Lakhal” amphibolite pod, is exposed in the eastern part of the massif, in the “Voile noire” Zone. According to Ahmed-Said and Leake (1992, 1997), it is composed of amphibolite lenses with island-arc affinities and of an important amphibolitic body, preserving MORB characteristics. The second kind of metabasite occurs as small veins (up to 80–100 cm) cross-cutting the Sidi Mohamed peridotites of the “Lower Unit”. This metabasite is derived from MORB-like basalt, which was emplaced within a back-arc basin (Hadj Zobir et al., 2007). The third one occurs in the ca. 1000-m-thick metasedimentary “Intermediate Unit” as thin layers or as small pods. These rocks are the topic of the present study. There, the amphibolites occur in the “Cap de Garde” area (Fig. 1). In an open pit of the “Cap de Garde”, marble benches contain thin amphibolites layers and lenses (Fig. 2).
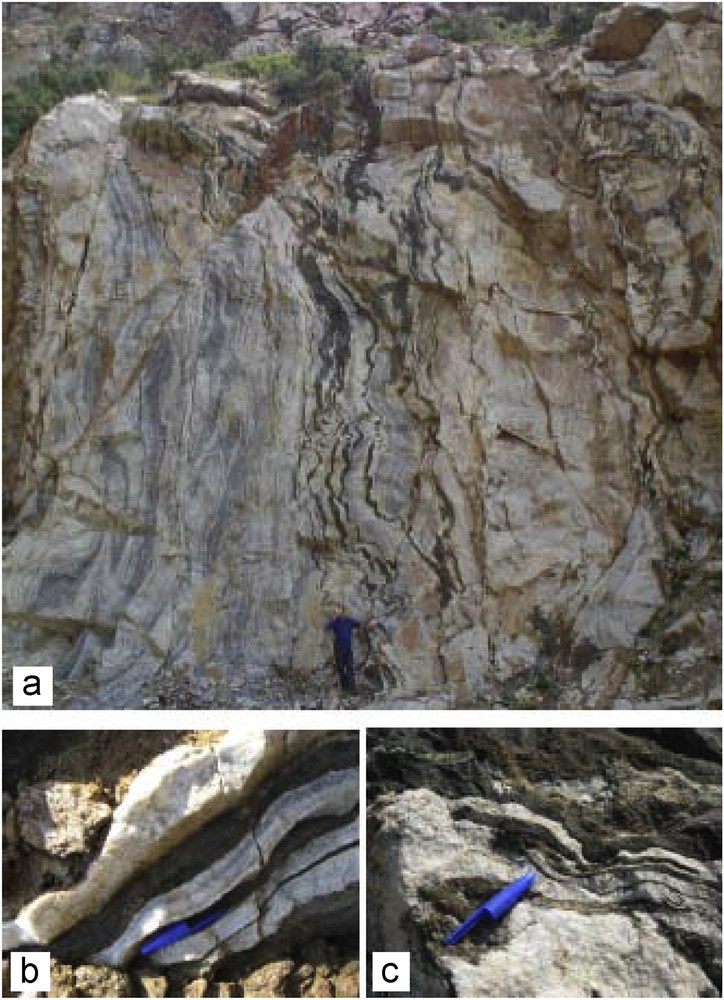
(Color online.) Outcrop photographs: a: amphibolite layers within white marble; b: thin layers of dark amphibolites; c: dark green layers of altered and fresh amphibolite.
3 Analytical methods
After examining thin sections of the samples for their mineralogical composition and alteration products, the samples were crushed, homogenized, and 500 g splits were used for chemical analyses. The compositions of the whole-rock samples, including major, minor and trace elements were determined by wavelength dispersive X-ray fluorescence spectrometry (WD-XRF), inductively coupled plasma-mass spectrometry (ICP–MS) and inductively coupled plasma-atomic emission spectrometry (ICP–AE) at the laboratories of the GeoForschungsZentrum Potsdam (GFZ) and of the Institut für Geowissenschaften (IG), Universität Potsdam, Germany. International and internal reference samples were used for calibration. Analyses for major and minor elements and for some trace elements were conducted on fused glass and pressed powder disks, respectively. Fused beads were prepared by a ratio of 1:6 of sample powder (< 63 μm) and the melting agent FLUXANA FX-X 65-2 (99.98%), containing 66% of di-lithiumtetraborate and 34% of lithiummetaborate. Major, minor and some of trace elements (Ni) were acquired by a Siemens SRS303-AS XRF with a Rh X-ray tube operating under standard running conditions at GFZ laboratory. Measurements of trace elements, including Nb, were performed in the GFZ ICP–MS laboratory, using a VG Elemental Plasma Quad System PQ2 + i. REE were analyzed at the Institut für Geowissenschaften (IG) laboratory, by an ICP–OES (Varian Vista MPX) after separation of major and most trace elements. REE were enriched using the method described by Zuleger and Erzinger (1988). The mineral chemical analyses, including major rock forming minerals, accessories and alteration product minerals were conducted using a fully automated CAMECA SX-100 electron microprobe at GFZ laboratory. The instrument was calibrated with natural mineral standards. Detection limits vary with atomic number and range between 50 and 100 ppm.
4 Results
4.1 Petrography-mineralogy
The “Cap de Garde” amphibolites occur as discontinuous pods (Fig. 2), small lenses and thin layers (millimeter to several centimeters thick), within the marbles on the northeastern part of the Edough metamorphic complex. Deformation and metamorphism have obliterated primary features of the amphibolites protoliths. The amphibolites are parallel to the pre-existing sedimentary layering of the marbles and to the main foliation (Fig. 2a, b). The amphibolites and the marble are repeatedly folded. They are dark green on fresh surfaces and become brown upon weathering (Fig. 2c). Their position in the marbles and the presence of micaschists nearby point to a sedimentary (marls) or volcaniclastic (ashes) origin. The marbles (Fig. 3a) are white to grey in color, which suggests more or less pure layered limestone as protoliths. They are composed of fine to coarse-grained calcite (ca. 0.2–2.0 mm). Grey-colored marbles contain some organic matter. In some layers, the bottom contact shows a deformation-induced dynamic recrystallization of calcite, leading to a drastic grain size reduction (< 0.1 mm, Fig. 3b). In contrast, the upper contact of marble with amphibolites does not show any effect of strong deformation (Fig. 3c). Some amphibolite layers show wavy (sedimentary?) upper contacts.
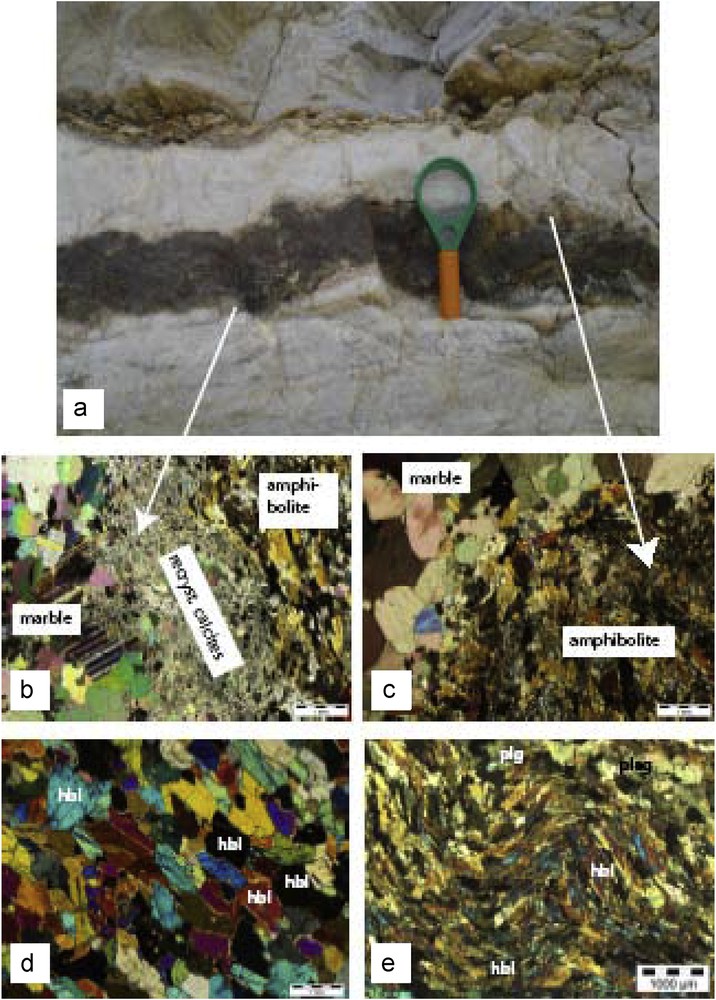
(Color online.) a: amphibolite–marble alternation with a wavy upper contact; b: photomicrograph of fine-grained dynamically recrystallized calcite at the lower contact; c: photomicrograph of the upper contact between marble and amphibolites; d: granoblastic to slightly nematoblasic texture in amphibolite; e: crenulated foliation in amphibolites; hbl: hornblende, plg: plagioclase.
The amphibolites are remarkably uniform in their composition. All samples contain more than 80 vol% of green hornblende, less than 5 vol% of plagioclase and less than 15 vol% of quartz. The rocks are fine to medium grained, with a granoblastic to nematoblastic texture (Fig. 3d). The amphiboles often show crystallographic preferred orientation defining the main foliation of the rock. Some samples show crenulations or display a mylonitic texture with undulose extinction of the main constituents (Fig. 3e). Plagioclase is ubiquitous in all the amphibolites and generally of smaller grain size than the amphiboles. Plagioclase is optically unzoned and subhedral. Quartz is usually present in very low amount and has undulatory extinction and subgrain structures. Samples from the rim of the amphibolites contain minor biotite and phlogopite as secondary phases. In some amphibolites samples, phlogopite can be very abundant, it grows after amphibole and is related to the low-grade alteration. Magnetite, rutile, and some sulfides (pyrite, pyrrothine) occur as accessory minerals. Rutile is very ubiquitous, irregularly distributed and occurs as inclusions in the amphiboles. Opaque oxides are sparsely spread and consist of hematite/magnetite as inclusions in the biotite or phlogopite grains.
4.2 Mineral chemistry
The amphiboles of all samples were analyzed (Table 1). In the classification diagrams of Leake et al. (1997), all analyzed grains are calcic amphiboles. There are two kinds of amphiboles: amphiboles ranging from tschermakite to magnesio-hornblende, and amphiboles ranging from pargasite to edenites (Fig. 4a, b). The AlIV/AlVI ratios (Fig. 4c) point to metamorphic low-pressure calcic amphiboles (Fleet and Barnett, 1978).
Representative electron microprobe analyses of amphiboles from the “Cap de Garde” amphibolites.
| C7A | C7A-1 | C3B | C6-07 | C6-08 | C4B-1 | C4B | CARR | |
| SiO2 | 49.21 | 46.13 | 46.70 | 46.76 | 47.20 | 47.87 | 52.78 | 44.62 |
| TiO2 | 0.18 | 0.30 | 0.25 | 0.21 | 0.20 | 0.33 | 0.08 | 0.46 |
| A12O3 | 8.79 | 12.33 | 11.21 | 12.07 | 13.17 | 10.77 | 6.40 | 14.19 |
| FeO | 14.27 | 14.99 | 14.33 | 9.72 | 9.67 | 9.38 | 8.45 | 9.69 |
| MnO | 0.06 | 0.07 | 0.04 | 0.07 | 0.04 | 0.03 | 0.04 | 0.04 |
| MgO | 13.26 | 11.34 | 12.38 | 14.98 | 14.73 | 15.39 | 17.50 | 14.03 |
| CaO | 12.99 | 12.82 | 12.91 | 12.79 | 12.33 | 12.93 | 12.45 | 12.77 |
| Na2O | 1.02 | 1.40 | 1.40 | 1.53 | 1.59 | 1.95 | 0.90 | 2.33 |
| K2O | 0.64 | 0.56 | 0.79 | 0.40 | 0.46 | 0.36 | 0.18 | 0.53 |
| Cr2O3 | 0.05 | 0.03 | 0.00 | 0.03 | 0.01 | 0.11 | 0.08 | 0.08 |
| Total | 100.46 | 99.98 | 100.01 | 98.55 | 99.40 | 99.11 | 98.83 | 98.72 |
| Si | 7.00 | 6.64 | 6.71 | 6.66 | 6.66 | 6.79 | 7.38 | 6.40 |
| Ti | 0.02 | 0.03 | 0.03 | 0.02 | 0.02 | 0.04 | 0.01 | 0.05 |
| Al(iv) | 1.00 | 1.36 | 1.29 | 1.34 | 1.34 | 1.21 | 0.62 | 1.60 |
| Al(vi) | 0.48 | 0.74 | 0.61 | 0.68 | 0.84 | 0.59 | 0.43 | 0.79 |
| Fe | 1.70 | 1.81 | 1.73 | 1.16 | 1.14 | 1.11 | 0.99 | 1.16 |
| Mn | 0.01 | 0.01 | 0.00 | 0.01 | 0.00 | 0.00 | 0.00 | 0.00 |
| Mg | 2.81 | 2.43 | 2.65 | 3.18 | 3.10 | 3.25 | 3.65 | 3.00 |
| Ca | 1.98 | 1.98 | 1.99 | 1.95 | 1.86 | 1.96 | 1.86 | 1.96 |
| Na | 0.28 | 0.39 | 0.39 | 0.42 | 0.43 | 0.54 | 0.24 | 0.65 |
| K | 0.12 | 0.10 | 0.15 | 0.07 | 0.08 | 0.07 | 0.03 | 0.10 |
| Cr | 0.01 | 0.00 | 0.00 | 0.00 | 0.00 | 0.01 | 0.01 | 0.01 |
| CARR5 | CARR6 | CARR8 | CARR11 | CARR12 | CARR13 | CARR14 | ||
| SiO2 | 46.64 | 46.90 | 44.68 | 47.36 | 46.70 | 48.75 | 46.24 | |
| TiO2 | 0.33 | 0.33 | 0.41 | 0.36 | 0.27 | 0.23 | 0.40 | |
| A12O3 | 12.03 | 11.83 | 13.99 | 10.64 | 12.05 | 9.25 | 12.48 | |
| FeO | 11.97 | 12.11 | 9.63 | 9.56 | 10.84 | 13.09 | 9.53 | |
| MnO | 0.05 | 0.05 | 0.08 | 0.06 | 0.06 | 0.06 | 0.03 | |
| MgO | 13.12 | 13.31 | 14.07 | 15.61 | 14.05 | 13.85 | 14.71 | |
| CaO | 12.70 | 12.66 | 12.75 | 12.77 | 12.75 | 12.93 | 12.85 | |
| Na2O | 1.75 | 1.76 | 2.37 | 2.06 | 1.64 | 1.28 | 2.14 | |
| K2O | 0.54 | 0.57 | 0.54 | 0.30 | 0.47 | 0.56 | 0.44 | |
| Cr2O3 | 0.04 | 0.07 | 0.07 | 0.10 | 0.04 | 0.06 | 0.09 | |
| Total | 99.16 | 99.58 | 98.59 | 98.82 | 98.85 | 100.05 | 98.92 | |
| Si | 6.69 | 6.70 | 6.42 | 6.75 | 6.67 | 6.94 | 6.59 | |
| Ti | 0.04 | 0.04 | 0.04 | 0.04 | 0.03 | 0.02 | 0.04 | |
| Al(iv) | 1.31 | 1.30 | 1.58 | 1.25 | 1.33 | 1.06 | 1.41 | |
| Al(vi) | 0.72 | 0.70 | 0.78 | 0.54 | 0.70 | 0.49 | 0.69 | |
| Fe | 1.44 | 1.45 | 1.16 | 1.14 | 1.30 | 1.56 | 1.14 | |
| Mn | 0.01 | 0.01 | 0.01 | 0.01 | 0.01 | 0.01 | 0.00 | |
| Mg | 2.80 | 2.84 | 3.01 | 3.32 | 2.99 | 2.94 | 3.13 | |
| Ca | 1.95 | 1.94 | 1.96 | 1.95 | 1.95 | 1.97 | 1.96 | |
| Na | 0.49 | 0.49 | 0.66 | 0.57 | 0.45 | 0.35 | 0.59 | |
| K | 0.10 | 0.10 | 0.10 | 0.05 | 0.09 | 0.10 | 0.08 | |
| Cr | 0.00 | 0.01 | 0.01 | 0.01 | 0.00 | 0.01 | 0.01 |

Classification diagrams of the amphiboles: a and b: nomenclature diagrams of Leake et al. (1997); c: Co-variation of AlIV and AlVI pfu in the structure of amphiboles, after Fleet and Barnett (1978); d: classification of plagioclase in the ternary feldspar diagram, most of the samples plot in the oligoclase field.
Due to the rarity of plagioclase in the samples, only two samples were analyzed. The compositions range from oligoclase to andesine (An22 to An39). The analyses are given in Table 2.
Representative electron microprobe analyses of plagioclases from the “Cap de Garde” amphibolites.
| CARR | CARR5 | CARR5 | C4B | C3B | CARR14 | |
| SiO2 | 63.28 | 61.32 | 61.56 | 58.66 | 63.56 | 63.25 |
| TiO2 | 0.01 | 0.01 | 0.02 | 0.01 | 0.02 | 0.02 |
| Al2O3 | 24.51 | 24.80 | 23.88 | 26.18 | 22.50 | 23.17 |
| MgO | 0.00 | 0.00 | 0.01 | 0.01 | 0.01 | 0.01 |
| CaO | 4.21 | 6.15 | 5.69 | 8.10 | 4.67 | 4.81 |
| Mno | 0.00 | 0.00 | 0.00 | 0.05 | 0.03 | 0.01 |
| FeO | 0.10 | 0.11 | 0.11 | 0.12 | 0.10 | 0.03 |
| BaO | 0.01 | 0.00 | 0.03 | 0.00 | 0.02 | 0.00 |
| Na2O | 8.06 | 7.53 | 8.88 | 6.85 | 8.89 | 8.87 |
| K2O | 0.11 | 0.17 | 0.07 | 0.13 | 0.13 | 0.12 |
| Total | 100.29 | 100.08 | 100.25 | 100.10 | 99.93 | 100.28 |
| An | 22.23 | 30.80 | 26.04 | 39.25 | 22.34 | 22.92 |
| Ab | 77.06 | 68.20 | 73.55 | 60.02 | 76.91 | 76.43 |
| Or | 0.71 | 1.00 | 0.40 | 0.73 | 0.75 | 0.65 |
The micas (Table 3), formed by retrograde reactions from amphiboles, are characterized by homogeneous Mg# [= Mg/(Mg + Fe2+)] and consequently Fe# [= Fe2+/(Fe2+ + Mg)], too. Mg# is ranging from 0.72 to 0.76 and Fe # from 0.23 to 0.28. In the AlIV–Fe# classification diagram and in the AlIV–Mg# diagram from Guidotti (1984), all micas plot in the phlogopite field (Fig. 5a). To determine the nature of the micas, the ternary diagram 10TiO2–Fetot + MgO of Nachit et al. (2005) was used (Fig. 5b). This diagram permits to distinguish between unaltered primary magmatic biotite, re-equilibrated and newly formed ones. Most of the mica samples of the “Cap de Garde” amphibolites are metamorphically re-equilibrated or newly formed.
Representative electron microprobe analyses of biotite from the “Cap de Garde” amphibolites.
| CARR | C3B | |||||||
| SiO2 | 38.86 | 38.69 | 38.91 | 38.10 | 39.02 | 39.73 | 40.04 | |
| TiO2 | 0.77 | 0.72 | 0.76 | 0.80 | 1.03 | 1.08 | 1.06 | |
| A12O3 | 16.57 | 18.01 | 17.60 | 17.86 | 15.30 | 14.71 | 14.58 | |
| FeO | 11.72 | 12.52 | 12.39 | 12.58 | 11.96 | 11.91 | 11.34 | |
| MnO | 0.03 | 0.00 | 0.03 | 0.03 | 0.04 | 0.02 | 0.03 | |
| MgO | 18.50 | 17.90 | 17.91 | 17.81 | 18.20 | 18.83 | 18.93 | |
| CaO | 0.00 | 0.01 | 0.02 | 0.01 | 0.04 | 0.02 | 0.03 | |
| Na2O | 0.27 | 0.33 | 0.23 | 0.33 | 0.21 | 0.15 | 0.18 | |
| K2O | 9.94 | 10.05 | 10.06 | 9.97 | 9.92 | 9.97 | 9.84 | |
| Total | 96.65 | 98.22 | 97.91 | 97.48 | 95.72 | 96.41 | 96.03 | |
| Si | 5.50 | 5.41 | 5.45 | 5.39 | 5.59 | 5.63 | 5.66 | |
| Ti | 0.08 | 0.08 | 0.08 | 0.08 | 0.11 | 0.11 | 0.11 | |
| Al(iv) | 2.50 | 2.59 | 2.55 | 2.61 | 2.41 | 2.37 | 2.34 | |
| Al(vi) | 0.27 | 0.38 | 0.36 | 0.37 | 0.17 | 0.08 | 0.09 | |
| Fe | 1.39 | 1.46 | 1.45 | 1.49 | 1.43 | 1.41 | 1.34 | |
| Mn | 0.00 | 0.00 | 0.00 | 0.00 | 0.00 | 0.00 | 0.00 | |
| Mg | 3.90 | 3.73 | 3.74 | 3.76 | 3.88 | 3.98 | 3.99 | |
| Ca | 0.00 | 0.00 | 0.00 | 0.00 | 0.01 | 0.00 | 0.00 | |
| Na | 0.07 | 0.09 | 0.06 | 0.09 | 0.06 | 0.04 | 0.05 | |
| K | 1.79 | 1.79 | 1.80 | 1.80 | 1.81 | 1.80 | 1.78 | |
| C4B | CARR7 | |||||||
| SiO2 | 39.55 | 40.33 | 37.54 | 37.57 | 37.59 | 37.44 | 37.52 | 37.37 |
| TiO2 | 0.84 | 1.04 | 0.38 | 0.41 | 0.46 | 0.47 | 0.44 | 0.47 |
| A12O3 | 14.27 | 15.47 | 20.23 | 20.40 | 20.07 | 20.14 | 20.22 | 19.91 |
| FeO | 11.79 | 12.43 | 10.46 | 10.31 | 10.55 | 10.60 | 10.28 | 10.29 |
| MnO | 0.02 | 0.00 | 0.00 | 0.00 | 0.02 | 0.02 | 0.04 | 0.06 |
| MgO | 17.80 | 19.31 | 18.40 | 18.53 | 18.41 | 18.61 | 18.64 | 18.58 |
| CaO | 0.07 | 0.18 | 0.01 | 0.01 | 0.00 | 0.01 | 0.01 | 0.01 |
| Na2O | 0.15 | 0.18 | 0.29 | 0.29 | 0.25 | 0.28 | 0.28 | 0.28 |
| K2O | 9.23 | 10.01 | 10.18 | 10.11 | 10.16 | 10.23 | 10.13 | 10.26 |
| Total | 93.71 | 98.96 | 97.48 | 97.63 | 97.50 | 97.79 | 97.55 | 97.21 |
| Si | 5.73 | 5.56 | 5.27 | 5.25 | 5.27 | 5.25 | 5.26 | 5.26 |
| Ti | 0.09 | 0.11 | 0.04 | 0.04 | 0.05 | 0.05 | 0.05 | 0.05 |
| Al(iv) | 2.27 | 2.44 | 2.73 | 2.75 | 2.73 | 2.75 | 2.74 | 2.74 |
| Al(vi) | 0.17 | 0.07 | 0.61 | 0.62 | 0.59 | 0.57 | 0.59 | 0.57 |
| Fe | 1.43 | 1.43 | 1.23 | 1.21 | 1.24 | 1.24 | 1.20 | 1.21 |
| Mn | 0.00 | 0.00 | 0.00 | 0.00 | 0.00 | 0.00 | 0.00 | 0.01 |
| Mg | 3.85 | 3.97 | 3.85 | 3.86 | 3.85 | 3.89 | 3.89 | 3.90 |
| Ca | 0.01 | 0.03 | 0.00 | 0.00 | 0.00 | 0.00 | 0.00 | 0.00 |
| Na | 0.04 | 0.05 | 0.08 | 0.08 | 0.07 | 0.08 | 0.08 | 0.08 |
| K | 1.71 | 1.76 | 1.82 | 1.80 | 1.82 | 1.83 | 1.81 | 1.84 |
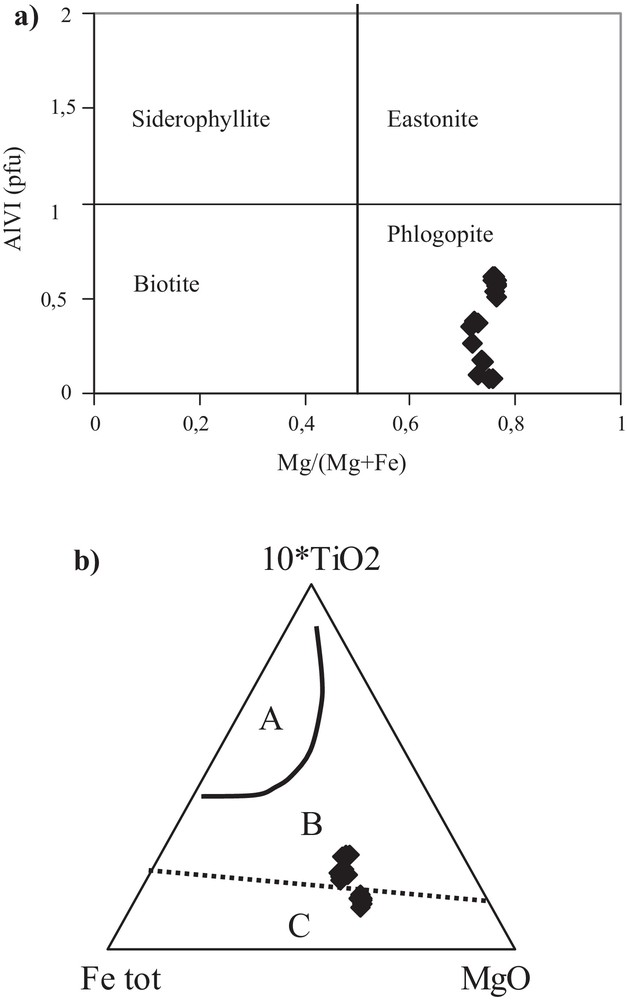
a) Position of the micas within the classification diagram based on their Mg–Fe2+ exchanges: AlVI–Mg# from Guidotti, 1984; b) domain of re-equilibrated and newly formed biotite after Nachit et al. (2005).
4.3 Whole-rock chemistry
Table 4 shows that the whole-rock chemistry of the amphibolites is relatively homogeneous, despite the evidence of alteration in some samples. Field and thin section observations show some slight traces of metasomatic or weathering alteration. All samples show a moderate loss of ignition (LOI) varying from 2.04 wt% to 3.8 wt% (Table 4). The effects of alteration were minimized by careful selection of the freshest samples. The overall coherent variation of major and trace elements suggests that alteration effects were limited. The high content in K2O and MgO in some samples reflects the abundance of biotite or phlogopite.
Whole-rock major and trace element composition of the “Cap de Garde” amphibolites. Major elements are in wt%, other elements are in ppm.
| CARR | C3B | C4B | C6-07 | C7A | CARR5 | CARR6 | |||
| SiO2 | 45.28 | 42.46 | 40.40 | 42.53 | 42.14 | 44.39 | 42.98 | ||
| TiO2 | 2.10 | 2.01 | 2.27 | 2.29 | 2.34 | 2.06 | 2.01 | ||
| Al2O3 | 13.51 | 11.16 | 13.13 | 12.47 | 11.35 | 12.31 | 11.13 | ||
| Fe2O3 | 8.20 | 13.04 | 11.09 | 10.18 | 13.77 | 10.15 | 12.57 | ||
| MnO | 0.03 | 0.05 | 0.04 | 0.05 | 0.05 | 0.04 | 0.04 | ||
| MgO | 10.56 | 11.95 | 11.32 | 13.38 | 11.92 | 10.88 | 11.58 | ||
| CaO | 12.04 | 12.13 | 10.25 | 12.73 | 11.68 | 12.07 | 12.12 | ||
| Na2O | 2.88 | 1.35 | 0.46 | 1.41 | 0.92 | 2.84 | 2.08 | ||
| K2O | 0.39 | 0.65 | 6.03 | 0.82 | 2.50 | 0.37 | 0.50 | ||
| P2O5 | 0.43 | 0.44 | 0.53 | 0.56 | 0.63 | 0.46 | 0.46 | ||
| LOI | 2.86 | 3.78 | 3.80 | 2.20 | 2.45 | 2.45 | 2.91 | ||
| Total | 98.29 | 99.02 | 99.32 | 98.61 | 99.75 | 98.01 | 98.37 | ||
| Rb | 8.95 | 22.84 | 501.29 | 39.50 | 181.85 | 25.73 | 32.67 | ||
| Ba | 45.94 | 27.76 | 673.71 | 105.41 | 261.00 | 273.07 | 263.98 | ||
| Li | 97.88 | 92.33 | 220.81 | 114.38 | 163.33 | 124.04 | 121.27 | ||
| Sr | 263.90 | 126.99 | 84.28 | 355.80 | 696.69 | 179.60 | 111.14 | ||
| Th | 4.59 | 4.45 | 4.91 | 5.15 | 5.36 | 4.91 | 4.84 | ||
| Ta | 2.46 | 2.76 | 2.86 | 2.19 | 3.73 | 2.45 | 2.60 | ||
| Nb | 43.19 | 50.64 | 51.14 | 41.39 | 67.57 | 44.75 | 48.47 | ||
| Zr | 145.13 | 102.58 | 99.19 | 140.47 | 152.98 | 123.67 | 102.39 | ||
| Cr | 376.00 | 322.00 | 309.00 | 351.00 | 272.00 | 331.17 | 304.17 | ||
| Ni | 216.00 | 152.99 | 242.56 | 233.28 | 186.70 | 187.84 | 156.33 | ||
| V | 84.00 | 214.00 | 107.00 | 212.00 | 199.00 | 155.00 | 173.00 | ||
| Ti | 12613 | 12026 | 13602 | 13698 | 14004 | 12331 | 12038 | ||
| Y | 22.37 | 12.01 | 22.70 | 23.81 | 12.50 | 22.23 | 17.06 | ||
| La | 29.78 | 6.97 | 32.57 | 35.50 | 7.99 | 29.17 | 17.76 | ||
| Ce | 57.59 | 14.78 | 64.29 | 69.11 | 17.86 | 59.40 | 37.99 | ||
| Pr | 6.89 | 1.98 | 7.69 | 8.29 | 2.48 | 7.39 | 4.93 | ||
| Nd | 27.91 | 8.72 | 30.40 | 33.28 | 11.41 | 29.55 | 19.96 | ||
| Sm | 6.14 | 2.22 | 6.21 | 7.00 | 2.93 | 6.51 | 4.56 | ||
| Eu | 1.91 | 0.65 | 0.94 | 2.30 | 1.54 | 1.61 | 0.98 | ||
| Gd | 5.81 | 2.36 | 5.90 | 6.46 | 3.12 | 5.95 | 4.23 | ||
| Tb | 0.84 | 0.38 | 0.92 | 0.94 | 0.46 | 0.86 | 0.63 | ||
| Dy | 4.85 | 2.46 | 5.32 | 5.34 | 2.62 | 5.05 | 3.85 | ||
| Ho | 0.92 | 0.50 | 1.02 | 0.98 | 0.52 | 0.91 | 0.71 | ||
| Er | 2.33 | 1.43 | 2.53 | 2.48 | 1.47 | 2.39 | 1.94 | ||
| Tm | 0.31 | 0.21 | 0.31 | 0.32 | 0.20 | 0.30 | 0.25 | ||
| Yb | 1.86 | 1.38 | 1.86 | 1.95 | 1.21 | 1.87 | 1.64 | ||
| Lu | 0.26 | 0.20 | 0.26 | 0.28 | 0.18 | 0.25 | 0.22 | ||
| CARR7 | CARR8 | CARR9 | CARR10 | CARR11 | CARR12 | CARR13 | CARR14 | CARR15 | |
| SiO2 | 41.95 | 43.02 | 42.82 | 43.50 | 43.95 | 43.24 | 42.73 | 43.26 | 43.16 |
| TiO2 | 2.14 | 2.15 | 2.17 | 2.01 | 2.03 | 2.01 | 2.07 | 2.08 | 2.09 |
| Al2O3 | 12.12 | 11.79 | 11.23 | 11.10 | 11.70 | 11.12 | 11.61 | 11.44 | 11.16 |
| Fe2O3 | 11.60 | 11.14 | 12.94 | 12.10 | 11.13 | 12.34 | 11.85 | 11.62 | 12.52 |
| MnO | 0.04 | 0.04 | 0.05 | 0.04 | 0.04 | 0.04 | 0.04 | 0.04 | 0.04 |
| MgO | 11.26 | 12.29 | 11.56 | 11.20 | 11.04 | 11.39 | 11.23 | 11.75 | 11.38 |
| CaO | 8.68 | 12.42 | 11.89 | 12.10 | 12.09 | 12.11 | 10.39 | 12.26 | 12.00 |
| Na2O | 1.63 | 2.11 | 1.86 | 2.80 | 2.82 | 2.44 | 2.22 | 2.45 | 2.33 |
| K2O | 3.19 | 0.59 | 1.43 | 0.35 | 0.36 | 0.43 | 1.77 | 0.47 | 0.89 |
| P2O5 | 0.51 | 0.53 | 0.56 | 0.49 | 0.48 | 0.48 | 0.50 | 0.51 | 0.53 |
| LOI | 2.92 | 2.12 | 2.24 | 2.04 | 2.25 | 2.48 | 2.48 | 2.08 | 2.14 |
| Total | 96.03 | 98.17 | 98.74 | 97.73 | 97.87 | 98.05 | 96.88 | 97.95 | 98.24 |
| Rb | 271.89 | 155.70 | 112.18 | 77.34 | 51.53 | 42.10 | 42.30 | 42.40 | 42.45 |
| Ba | 586.95 | 346.18 | 380.60 | 440.40 | 356.74 | 310.36 | 405.28 | 452.74 | 476.47 |
| Li | 185.51 | 149.94 | 156.77 | 153.48 | 138.76 | 130.01 | 140.11 | 145.15 | 147.68 |
| Sr | 89.79 | 222.80 | 396.00 | 245.65 | 212.62 | 161.88 | 128.59 | 111.95 | 103.62 |
| Th | 5.07 | 5.11 | 5.30 | 5.26 | 5.09 | 4.96 | 5.10 | 5.16 | 5.20 |
| Ta | 2.65 | 2.42 | 3.08 | 2.76 | 2.61 | 2.60 | 2.52 | 2.48 | 2.46 |
| Nb | 48.72 | 45.05 | 56.93 | 51.62 | 48.18 | 48.33 | 47.31 | 46.81 | 46.55 |
| Zr | 100.69 | 120.58 | 127.59 | 114.89 | 119.28 | 110.83 | 106.52 | 104.36 | 103.28 |
| Cr | 297.67 | 324.34 | 279.17 | 282.76 | 306.96 | 305.57 | 295.95 | 291.15 | 288.74 |
| Ni | 201.12 | 217.20 | 173.19 | 166.43 | 177.14 | 166.74 | 163.21 | 161.44 | 160.56 |
| V | 211.00 | 89.00 | 151.00 | 132.00 | 111.00 | 187.00 | 201.00 | 92.00 | 133.00 |
| Ti | 12826 | 12874 | 13027 | 12050 | 12191 | 12044 | 12438 | 12462 | 12538 |
| Y | 22.40 | 23.11 | 17.30 | 19.70 | 20.97 | 19.01 | 20.56 | 21.33 | 21.71 |
| La | 30.56 | 32.02 | 18.27 | 28.55 | 28.86 | 23.16 | 29.56 | 30.29 | 23.41 |
| Ce | 62.75 | 65.15 | 39.53 | 61.20 | 60.30 | 49.59 | 61.97 | 63.18 | 50.36 |
| Pr | 7.79 | 8.09 | 5.18 | 7.89 | 7.64 | 6.41 | 7.84 | 7.99 | 6.54 |
| Nd | 30.80 | 32.24 | 21.31 | 31.20 | 30.38 | 25.58 | 31.00 | 31.72 | 26.25 |
| Sm | 6.55 | 6.95 | 4.91 | 6.89 | 6.70 | 5.72 | 6.72 | 6.92 | 5.90 |
| Eu | 1.13 | 1.81 | 1.43 | 1.32 | 1.47 | 1.15 | 1.23 | 1.56 | 1.37 |
| Gd | 6.00 | 6.28 | 4.61 | 6.10 | 6.03 | 5.16 | 6.05 | 6.19 | 5.36 |
| Tb | 0.90 | 0.91 | 0.67 | 0.88 | 0.87 | 0.76 | 0.89 | 0.89 | 0.78 |
| Dy | 5.28 | 5.29 | 3.93 | 5.24 | 5.14 | 4.54 | 5.26 | 5.26 | 4.59 |
| Ho | 0.96 | 0.94 | 0.71 | 0.91 | 0.91 | 0.81 | 0.94 | 0.93 | 0.81 |
| Er | 2.49 | 2.47 | 1.96 | 2.45 | 2.42 | 2.19 | 2.47 | 2.46 | 2.21 |
| Tm | 0.30 | 0.31 | 0.24 | 0.29 | 0.30 | 0.27 | 0.30 | 0.30 | 0.27 |
| Yb | 1.87 | 1.92 | 1.55 | 1.89 | 1.88 | 1.76 | 1.88 | 1.91 | 1.72 |
| Lu | 0.25 | 0.26 | 0.21 | 0.24 | 0.25 | 0.23 | 0.24 | 0.25 | 0.23 |
The “Cap de Garde” amphibolites have ca. 40 to 45 wt% SiO2, ca. 10.5–13.5 wt% MgO, and are characterized by moderate Fe2O3 (8–13 wt%) and high Al2O3 and TiO2 content (ca. 11–13 wt% and ca. 2.0–2.5 wt%, respectively). The average total alkali (Na2O + K2O) content (3.3 wt%) shows the alkaline nature of these rocks. In addition, high Cr (272–376 ppm) and Ni (153–242 ppm) contents characterize the rocks. The elements with the strongest variations are Li, which ranges from 92 to 221 ppm and Sr, which ranges from 90 to 697 ppm (Table 4).
5 Discussion
5.1 Characterization of the protolith
The chemical composition and texture of metamorphic rocks provide information related to their protolith. Many studies show that ortho- and para-amphibolites inherit chemical characteristics from their parent rocks. In regard of the nature of the protolith, two main types of amphibolites are distinguished: ortho-amphibolites, derived from igneous basic rocks (effusive or intrusive as well as pyroclastic), and para-amphibolites, derived from impure carbonates rocks (e.g., marls). In this study some co-variations diagrams for a chemical distinction of ortho- and para-amphibolites have been used. Incompatible trace elements (Ti, Zr, Nb, Cr, Ni, REE) are least affected by hydrothermal alteration or weathering (Becker et al., 2000; Condie, 1981; Meschede, 1986; Sheraton et al., 1987; Winchester et al., 1980; Wood, 1980), making them suitable for determining protoliths and tectonic settings.
Ortho-amphibolites derived by metamorphism of basic rocks have high MgO, TiO2, FeOtot, Cr, and Ni contents (Leake, 1964) and display a positive X3 (X3 = 7.07 log TiO2 + 1.91 log A12O3 – 3.29 log Fe2O3 + 8.48 log FeO + 2.97 log MnO + 4.81 log MgO + 7.80 log CaO + 3.92 log P2O5 + 0.15 log CO2 – 15.08) value (Shaw and Kudo, 1965). In contrast, para-amphibolites have low Cr, Ni, TiO2 and FeOtot less than 8 wt% (Leake, 1964) contents and show negative X3 values (Shaw and Kudo, 1965). The “Cap de Garde” amphibolites have a positive X3 value, ranging from 2.93 to 5.68, characterizing them as ortho-amphibolites. The diagrams Cr vs. TiO2 and Ni vs. TiO2 (Fig. 6a, b) from Leake (1964) and the diagrams Zr/Ti vs. Ni and Ni vs. TiO2 (Fig. 6c, d) from Winchester et al. (1980) indicate a typical igneous protolith. Miller et al. (1988), based on the modified work of Pearce (1983), suggest to discriminate basalt liquids from gabbro cumulates by their Al2O3/TiO2 ratios. The amphibolites of the “Cap de Garde” are characterized by TiO2 concentrations of > 2 wt% and therefore, plot in the field of basalt liquids (Fig. 7a). The MgO/Fetot diagram of Wood (1978) and Wood et al. (1979) (Fig. 7b) and Zr/Ti vs Nb/Y from Winchester and Floyd (1976) (Fig. 7c), point to low Mg-basalt with alkaline affinity for the protolith of the “Cap de Garde” meta-basic rocks. The amphibolites are characterized by their high Cr/Th (∼ 62) and their low Th/La (∼ 0.2) ratios, which are typical of magmatic sources (Rollinson, 1996).
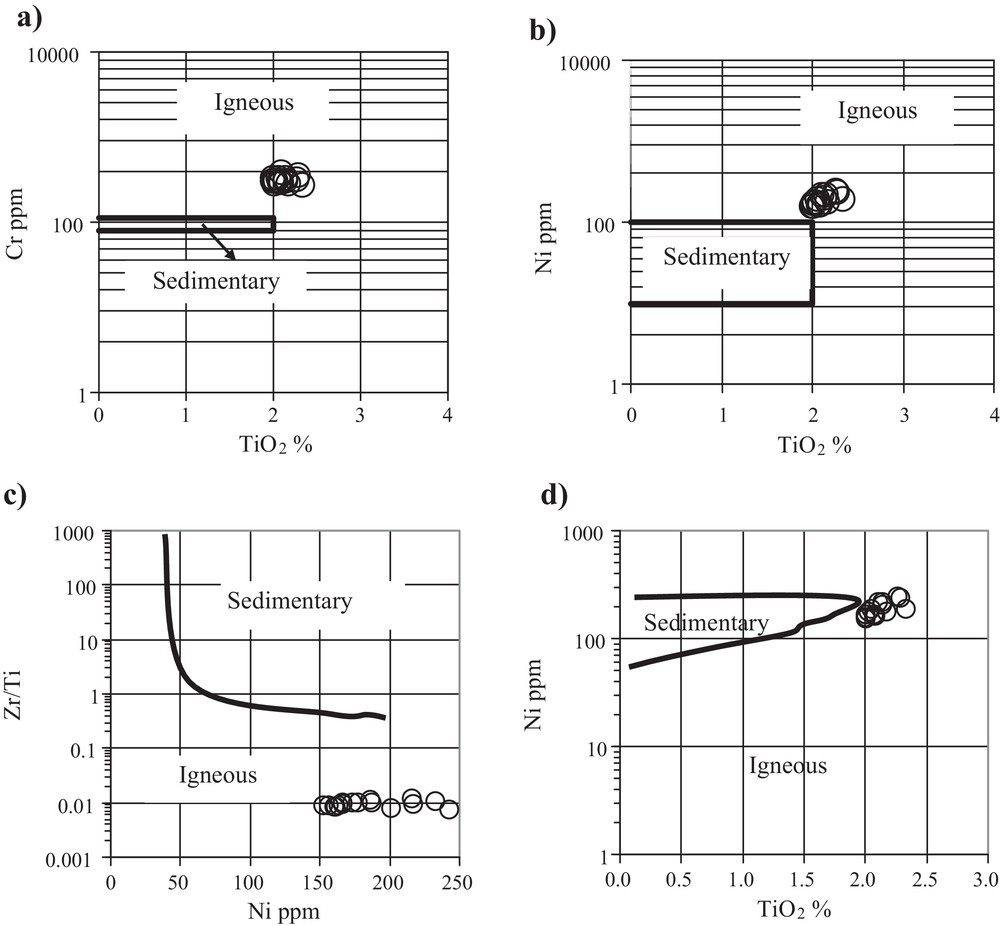
Discrimination diagrams to distinguish ortho-amphibolites from para-amphibolites: a) and b) Cr vs TiO2 and Ni vs. TiO2 after Leake (1964); c) and d) Zr/Ti vs Ni and Ni vs TiO2 after Winchester et al., 1980, indicate a typical igneous protolith for the “Cap de Garde” volcaniclastites.
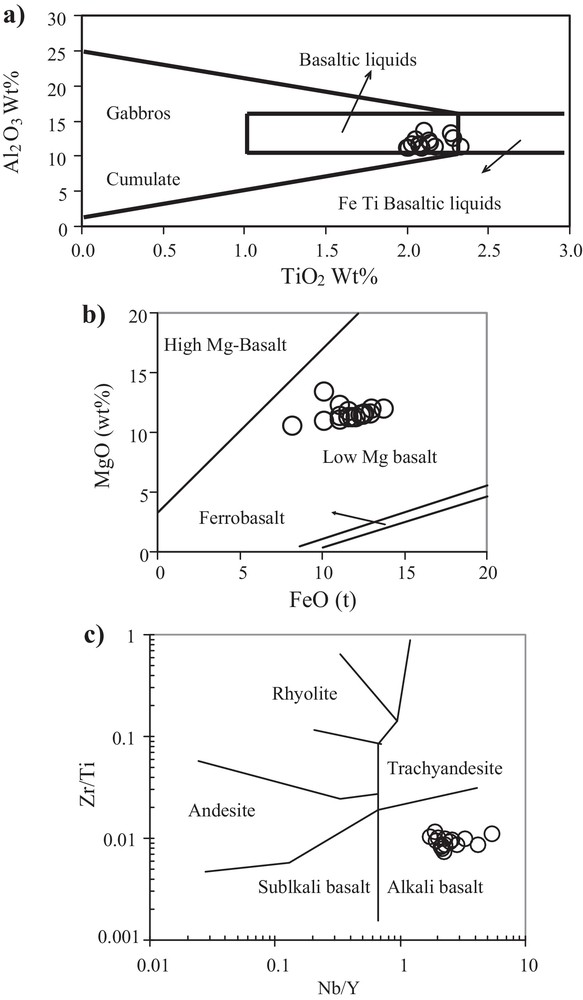
a) Al2O3–TiO2 discrimination diagram for mafic rocks, Pearce (1983), modified after Miller et al., 1988; b) MgO–FeOt classification of Wood et al., 1978, 1979; c) Zr/Ti versus Nb/Y diagram after Winchester and Floyd, 1976.
However, the multiple interlayering of thin marbles and thin amphibolite layers, lenses and pods as a characteristic feature of the “Cap de Garde” amphibolites display sedimentary or volcanoclastic origin. Since the chemical composition reveals a magmatic source, an interpretation as a pyroclastic origin is obvious. The age of the protolith as well of the metamorphic event for the metavolcanic rocks and of the metasediments remains unknown. However, some recent studies suggest a Miocene age for the exhumation of the peridotites of the Edough massif (Bruguier et al., 2009), associated with the formation of diatexites.
5.2 Tectonic setting
In order to compare the igneous protoliths with modern analogues, discrimination diagrams for the geotectonic setting were used. The Ti–Y–Zr diagram after Pearce and Cann (1973) (Fig. 8a), the Nb–Y–Zr diagram after Meschede (1986) (Fig. 8b), and the co-variation diagrams V/Ti after Shervais (1982) (Fig. 8c) and the Ti/Y vs Nb/Y discrimination diagram after Pearce (1982, 1983) (Fig. 8d) show that all the “Cap de Garde” amphibolites concentrate in the field of alkaline, especially within-plate basalts. Representative trace element patterns of the “Cap de Garde” meta-pyroclastics are shown in Fig. 9. The normalization of the large ion lithophile elements (LILE) and the rare earth elements (REE) to the primitive mantle's composition (PRIMA, normalization after Sun and McDonough, 1989) shows that all samples are enriched in light REE (LREE) compared to heavy REE (HREE). The high HREE concentrations and low (Gd/Lu)N ratios, ranging from 1.45 to 3.7, indicate that residual garnet in the source area of the melt is of no importance. Therefore, the melt is suggested to have originated in the garnet free the upper mantle. The lack of a pronounced Eu anomaly indicates that no significant plagioclase fractionation has happened. The high primitive mantle-normalized values of the LILE (Rb, Ba and LREE) and the high La/Yb ratio (5–15) probably indicate a LREE-enriched mantle source, a low degree of mantle melting in the source region and/or assimilation of crustal components or marine sediments (e.g., Mocek, 2001; Nakamura et al., 1989; Ramos and Kay, 1992). Hydrothermal processes as an overprinting agent are possible, too. Moreover, there is clear evidence of an influence of seawater interaction during sedimentation, as indicated by the unusual high Li concentrations, and, to a minor extent, by the high Sr concentrations. The high Li concentration is typical for marine environments (Wedepohl, 1978).
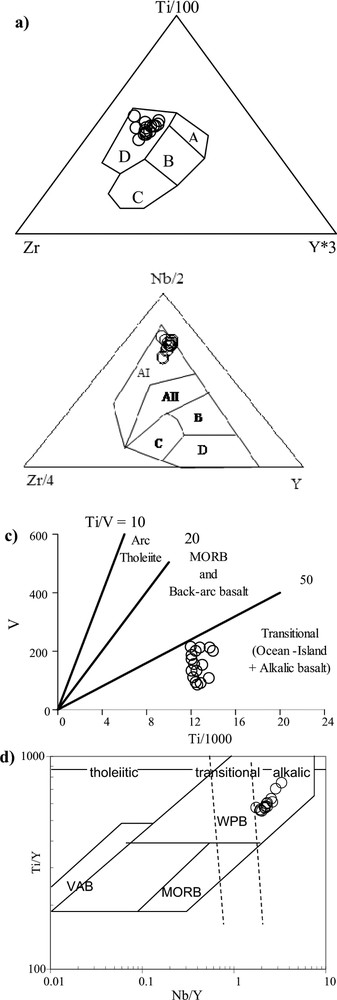
a) Ti–Y–Zr diagram after Pearce and Cann, 1973; b) Nb–Y–Zr diagram after Meschede, 1986; c) co-variation diagrams V/Ti after Shervais, 1982; d) discrimination diagram of tholeiitic, transition, and alkaline within-plate basalts after Pearce (1982, 1983).

Primitive mantle-normalized element diagram of the “Cap de Garde” amphibolites, normalization after Sun and McDonough (1989).
6 Conclusions
The amphibolite layers and lenses of the “Intermediate Unit” of the Edough Massif are interpreted as pre-existing pyroclastic rocks, interbedded within carbonate rocks and near to pelitic protoliths. This suggests subaqueous near-source basaltic ash-fall deposits in a marine basin. The basaltic signature of the meta-pyroclastics points to basic volcanic sources. The comparison of the bulk chemistry with modern analogues indicates within-plate alkali-basaltic activity. The occurrence of numerous amphibolite layers and lenses reveals the occurrence of several volcanic events within a basin, during the sedimentary evolution. The chemical homogeneity of the meta-ashes points to a volcanic source nearby to the place of sedimentation and to relatively quiet water currents.
Acknowledgements
We thank C. Fischer, A. Musiol and B. Fabian from Potsdam University and the GFZ (German Research Center for Geosciences) for their support in sample preparation and analytical laboratories. We also express our appreciation to the reviewers Romain Bousquet (Kiel, Germany) and Ralf Milke (FU Berlin, Germany) for their thoughtful comments. The first author also thanks DAAD and Badji Mokhtar-Annaba University for financial support.