

1 Introduction
It has been recognized from more than one century that the morphology of most major Pyrenean valleys has been largely modified during glacial periods (e.g., Calvet et al., 2011; Penck, 1885; Taillefer, 1969). Four major glacial valleys occupy the northern flank of the chain (see Fig. 1 and Calvet et al., 2011). They are, from west to east, the Ossau, Gave de Pau, Garonne and Ariège valleys. During their maximum extent, glaciers flowing in the Ossau, Gave de Pau and Garonne valleys reached the northern Pyrenean piedmont north of Arudy, Lourdes, and Saint-Bertrand-de-Comminges, respectively (Fig. 1). In this paper, we focus on the morphology of the Gave de Pau and Garonne valleys, which were occupied by the longer glacial tongues on the northern side of the Pyrenees.
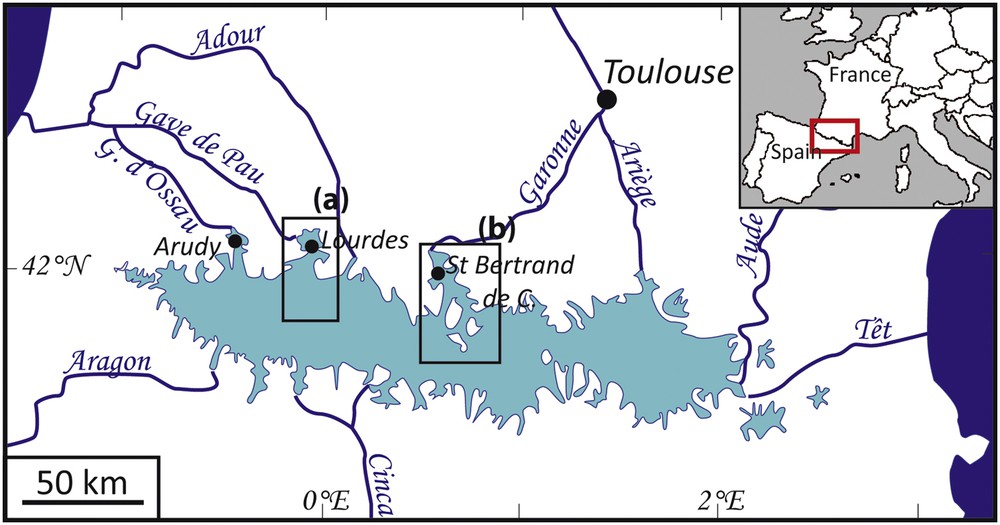
(Color online.) Maximal Würmian extension of Pyrenean glaciers, after Calvet et al. (2011). Study areas correspond to two major glacial valleys of northern Pyrenees: a: the Gave de Pau valley; b: the Garonne valley.
The Gave de Pau and Garonne glacial valleys share some common morphological and geological characteristics. Their head is located in the Axial Zone over 2500 m, and they reach the piedmont area at altitudes close to 400 m. The maximum length of glacial tongues reached ∼ 60 and 80 km in the Gave de Pau and the Garonne valleys, respectively. In both valleys, glacial erosion carved large and deep valleys in the downstream part of the glacial advance, resulting in the appearance of ephemeral lakes following glacial retreat. These lakes have been almost entirely filled by sediments following the end of the glacial period, and only two tiny relict lakes have been preserved from sedimentation, the Lourdes Lake in the Gave de Pau valley, and the Barbazan Lake in the Garonne valley (Figs. 2 and 3). In this paper, we present gravimetrical data that help constrain the geometry of the base of the glacial valleys where hidden by post-glacial sedimentation. These data permit to reconstruct the longitudinal profile of the base of the glacial valley prior to glacial retreat, and give insights into parameters that controlled the intensity of glacial erosion in the downstream part of these valleys.
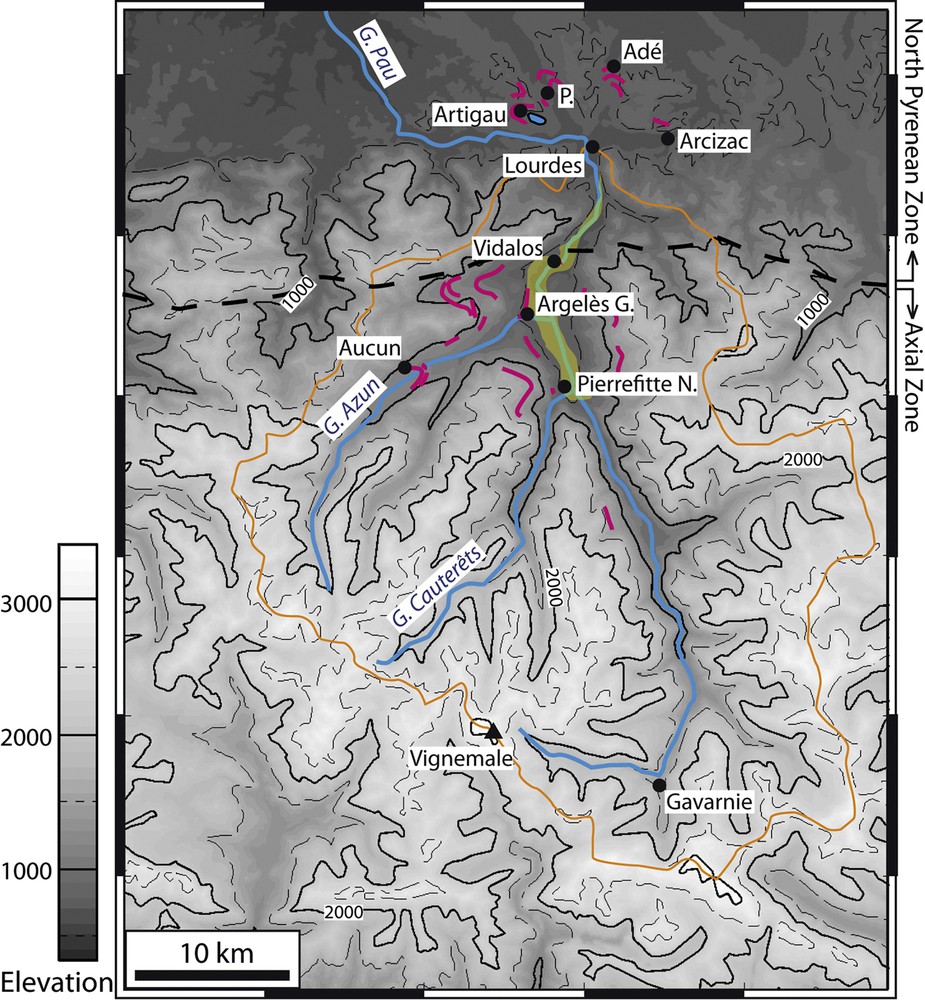
(Color online.) Topographic map of the Gave de Pau valley upstream of Lourdes (from SRTM data). The orange line contours the drainage basin of the river in Lourdes. The dashed black line is the North Pyrenean Fault that separates the Axial Zone from the North Pyrenean Zone. Pink lines mark the position of lateral and terminal moraines reported after 1:50,000 geological maps by Barrère et al. (1980) and Casteras (1970), and the yellow area shows the overdeepened part of the valley between Pierrefitte-Nestalas and Lourdes. P.: Poueyferré.
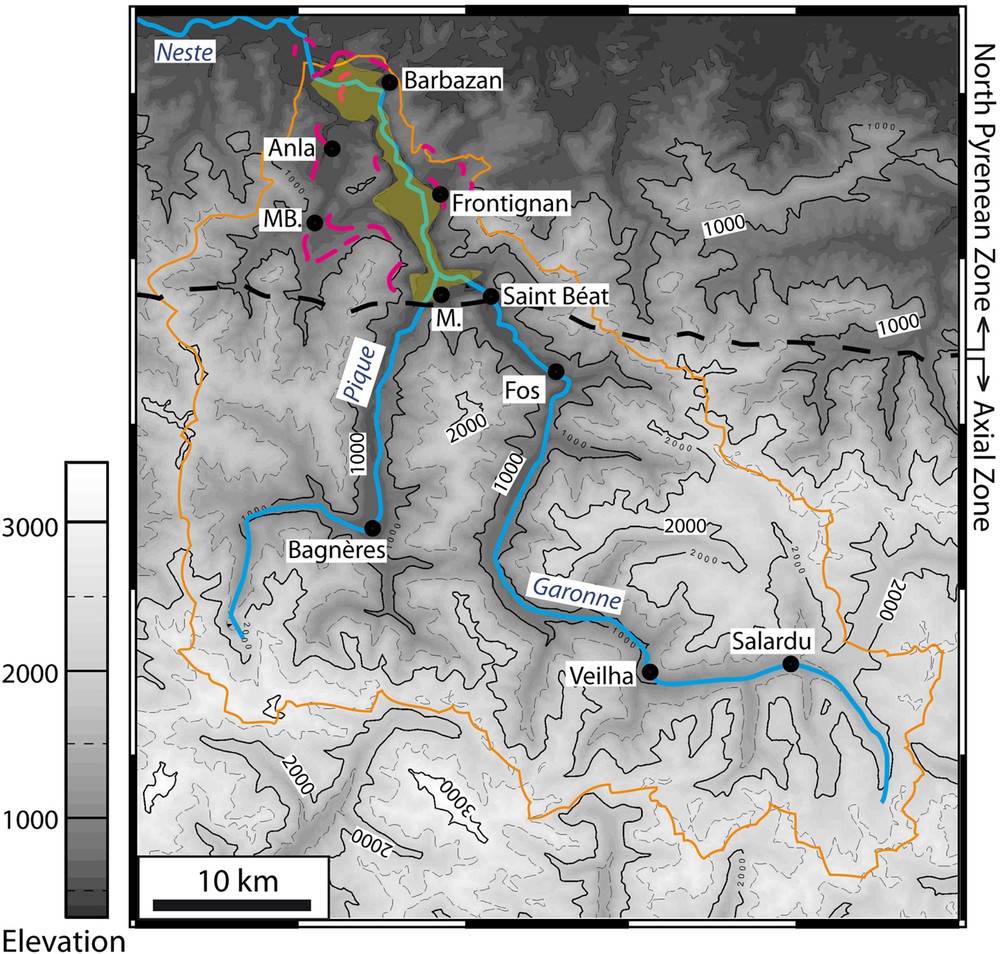
(Color online.) Topographic map of the Garonne valley upstream of the confluence with the Neste River (from SRTM data). The orange line contours the drainage basin of the Garonne River above the confluence. The dashed black line is the North Pyrenean Fault that separates the Axial Zone from the North Pyrenean Zone. Pink lines mark the position of lateral and terminal moraines reported after 1:50,000 geological maps by Barrère et al. (1984) and Paris et al. (1975), and the yellow area shows the overdeepened part of the valley between Saint-Béat and terminal moraines. M.: Marignac; MB.: Mauléon-Barousse.
2 Geomorphologic description of the Gave de Pau and Garonne valleys
2.1 Gave de Pau
The Gave de Pau main stream comes from the Vignemale Peak (3300 m. asl), at the border between France and Spain. The main valley crosses the Pyrenean Axial Zone towards the north, essentially incising Paleozoic sediment with some outcrops of Hercynian metamorphic and plutonic rocks. At Pierrefitte-Nestalas, 38 km downstream from the Gave de Pau source, the main valley meets the Gave de Cauterets tributary river, which increases the drained area from 484 to 663 km2. From this point downwards, the valley enlarges and the present-day river flows in a ∼ 1- to 1.5-km-wide plain corresponding to an overdeepened glacial basin filled by Quaternary sediment (Fig. 2). Five kilometers downstream Pierrefitte-Nestalas, close to Argelès-Gazost, a second major tributary river (Gave d’Azun) joins the main valley. The width of the fluvial plain diminishes 3 km downwards, close to Vidalos, where the valley is deflected along the contact with the North Pyrenean Zone. Between Vidalos and Lourdes, the river flows through the North Pyrenean Zone in a narrow (< 1 km) valley. The Lourdes city is located at the northern physiographic boundary of the Pyrenees. During periods of maximum glacial advances, several diffluent channels diverged from the Lourdes piedmont lobe. Towards the west, one branch followed the Peyrouse valley now occupied by the Gave de Pau River. Other diffluent branches were directed toward the WNW (Artigau terminal moraines beyond the preserved Lourdes relict lake), the NW (Poueyferré), the north (Adé morainic system) and the east (Arcizac). In these five diffluent valleys, the maximum advance of glaciers has been ∼ 5 km downstream from Lourdes.
The total maximum length of the Gave de Pau glacier was ∼ 60 km (Taillefer, 1969). It appears that age of the Maximum Würmian glacial advance in the Gave de Pau, although debated (see Calvet et al., 2011, for discussion), is older than the 21 ± 2 ka Last Glacial Maximum (LGM), as in most of the northern Pyrenees and western Alps (Andrieu et al., 1988; Calvet et al., 2011; Delmas et al., 2011; Montjuvent and Nicoud, 1988). This is suggested by a 38.4 ± 2 ka 14C age obtained in the Biscay peat bog, close to the Poueyferre terminal moraines, by Mardones and Jalut (1983). Although Reille and Andrieu (1995) consider this age questionable, the 22 ± 0.5 ka cal. The BP date that they obtain in glaciolacustrine clays close to the Lourdes Lake confirms that the glacier front was located upstream during the LGM. Calvet et al. (2011) propose that the ice-front marking the LGM (MIS-2) peak corresponds to the Argelès-Gazost moraine system in the Gave de Pau valley, and with the Aucun terminal moraines in the Gave d’Azun tributary, meaning that this tributary glacier was already disconnected from the main trunk glacier at that time.
2.2 Garonne valley
The upper part of the Garonne valley corresponds to the Val d’Aran in Spain. The source of the longer river stream with the larger flow is located above Salardu, close to the Port de la Bonaigua. The Garonne River first flows successively towards the west and the north within the Pyrenean Axial Zone. The river is generally incising basement and sedimentary rocks in Spain. Between Fos and the Saint-Béat “verrou”, the part of the valley covered by Quaternary post-glacial sediment enlarges to modest widths, always smaller than 1 km. Downstream of Saint-Béat, the Garonne River flows to the north in the North Pyrenean Zone. It joins a major tributary (the Pique River), and the valley downstream from the Saint-Béat “verrou” has been overdeepened by the glacier that occupied it. Its morphology presents two large glacial basins (Marignac and Frontignan basins), in which the plain is more than 2 km wide. These basins are separated by segments in which the plain is narrower (< 1 km). The valley enlarges again in the Barbazan Basin, where a tiny relict lake has been preserved.
The total maximum length of the Garonne Glacier reached ∼ 80 km. Terminal moraines closing the Barbazan Basin have been attributed by Stange et al. (2014) to the LGM (MIS-2) advance of the glacier. The maximum glacier advance is located ∼ 3 more kilometers to the north, close to the confluence between the Garonne and Neste Rivers. The comparison of the weathering of deposits associated with both glacial advances suggests that moraines located downstream, close to the Garonne-Neste confluence, are significantly older, possibly marking again a greater glacier tongue during the early periods of the Würm glaciations (MIS-4) than during the LGM. However, the length difference of the trunk glacier between these two periods would be much smaller in the Garonne valley than in the Gave de Pau.
3 Gravity data
We present below gravity data that have been acquired in order to constrain the geometry of the base of the overdeepened parts of the Gave de Pau and Garonne valleys. Gravimetry is an efficient tool to measure this geometry given the significant density contrast existing between rocks in which glaciers carved their valleys and post-glacial unconsolidated sediment (e.g., Rosselli and Raymond, 2003; Vallon, 1999).
3.1 Data acquisition
Gravity data have been acquired using Scintrex CG3 and CG5 gravimeters. For each point, two sets of 60 measurements were registered (acquired at a rate of one per second). The gravimeter automatically analyses the obtained results to calculate a mean value of gravity with the associated standard deviation of measurements. During data acquisition, many corrections are directly calculated by the equipment software such as variations in quartz temperature, tilt of the device, tide corrections. The effect of atmospheric pressure is not considered in this work because its magnitude being ∼ 0.35 μgal/hPa; it does not influence significantly the results obtained here.
Every day, some points were reoccupied in order to remove the instrumental drift using the CG3Toolsoftware (Gabalda et al., 2003). We also occupied absolute gravity benchmarks measured by the French Geographical Institute (IGN), and whose data are available in the International Gravimetric Bureau website. Gravity points were located using relative GPS differential positioning. We systematically installed a permanent GPS base to locate the mobile GPS installed above the car, the distance between the base and the mobile GPS being generally smaller than 10 km. The mobile GPS was also positioned using data from stations pertaining to the GNSS permanent GPS network maintained by the French Geographic Institute (IGN). Difference in elevation between the mobile GPS and the gravimeter was measured using a level. Each GPS point was measured at least during 5 min, which results in a vertical precision of point coordinates better than 10 cm.
We completed the acquired dataset using gravity data available for the two study areas in the International Gravimetric Bureau (BGI). We acquired a total of 64 gravity measurements in the Garonne valley, these data being completed by 44 other measurements available in the BGI databank. In the Gave de Pau valley, 30 BGI data complete 120 new measurements. Data are concentrated along the valleys where we want to determine the depth of the Quaternary–Basement interface (Fig. 4). We looked visually at the coherency between gravity data extracted from the BGI database and the new data we acquired, checking that neighbor points from both networks presented similar gravity values. This verification is possible for most points because the two networks are intertwined (Fig. 4). We kept all the BGI data, except in one point in the Garonne Valley for which the gravity value indicated in the BGI database is very different from those we had measured nearby. We measured a point close to this outlier and checked that the gravity value is 10.7 mgal smaller than that indicated in the BGI database. The position of this outlier is indicated on Fig. 4.
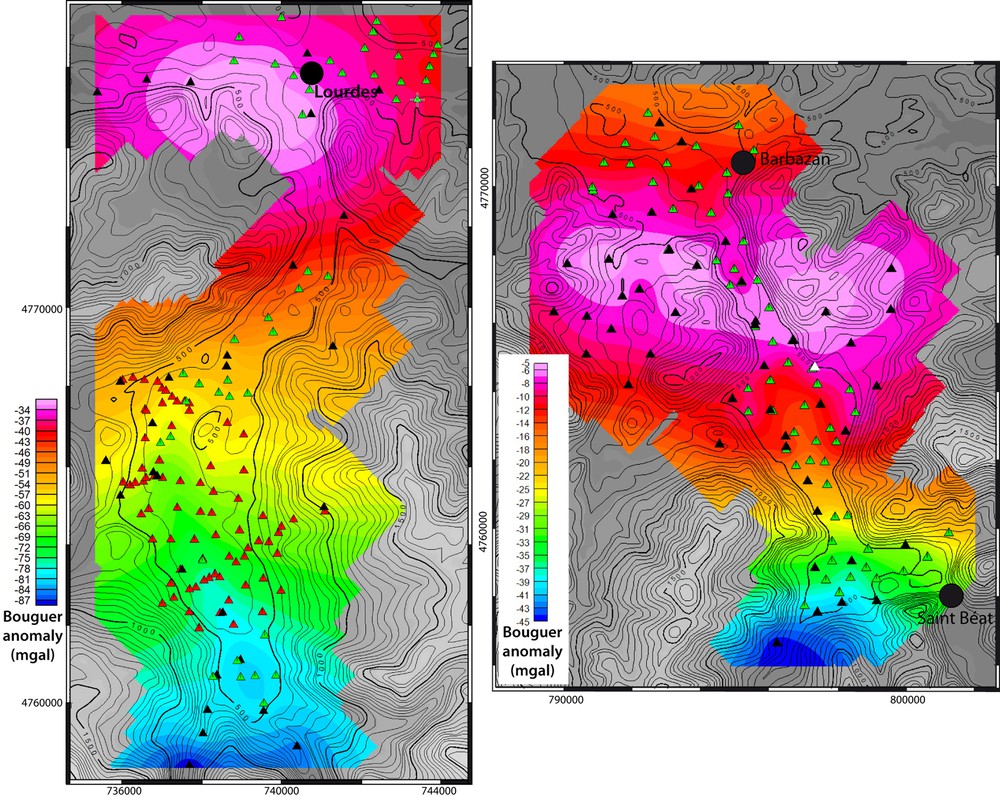
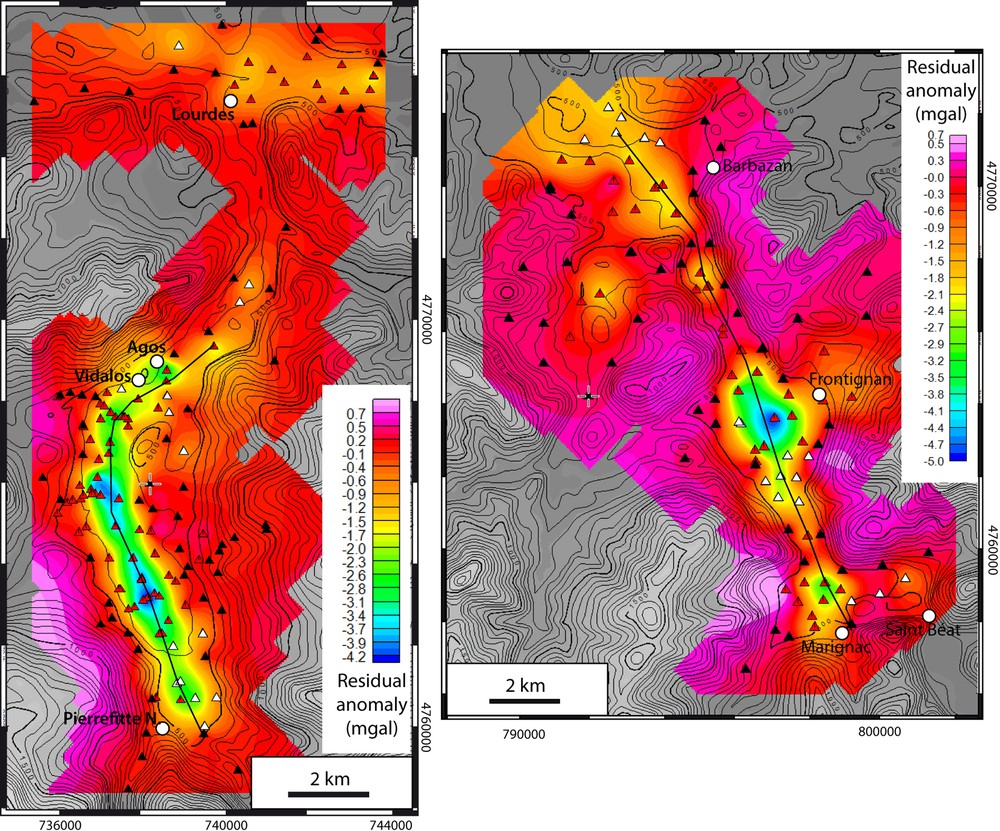
(Color online.) Calculated Bouguer anomalies in the Gave de Pau (left) and Garonne (right) valleys (displayed over the SRTM topography map). Green and red triangles mark gravity measurement points measured using Scintrex CG3 and Scintrex CG5 gravimeters, respectively. Black triangles correspond to gravity data obtained from the International Gravimetric Bureau (BGI) database. The white triangle marks the position of the BGI database outlier (see the text). Bouguer anomalies are negative along the axis of the Pyrenean range, and a relative maximum is located in the North Pyrenean Zone both in the Garonne and Gave de Pau valley.
3.2 Data processing
We used the Geosoft Oasis Montaj software to calculate the Free Air and Complete Bouguer anomalies corresponding to our data. The value used for free air correction is 0.3086 mgal/m. Calculation of the Bouguer anomaly requires estimating the density of basement rocks and taking into account the regional topography for the calculation of terrain corrections. We used the SRTM 3 arc seconds topographic map (pixel ∼ 90 m in longitude and 70 m in latitude). A density value of 2.6 is used for all terrain corrections, corresponding approximately to the average density of sedimentary rocks from the Axial Zone. Terrain corrections are often larger than 10 mgal in these deep and narrow valleys. Bouguer Anomaly maps obtained for the two study areas (Fig. 4) coincide with regional maps presented in Casas et al. (1997).
The 2.6 density value has been estimated using gravity measurements performed at different elevations on both sides of the Gave de Pau valley. Of course, the basement density is not homogeneous, and part of the signal comes from different densities between deep rocks. The sedimentary series of the Axial Zone are rather homogeneous. In the North Pyrenean Zone, in contrast, rocks with contrasted densities (migmatites, Mesozoic calcareous series, Cretaceous Flysch, ophites, and lherzolites) coexist close to the surface, and their geometry is difficult to infer from surface outcrops. Because these rocks are present close to the surface, their juxtaposition influences the short-wavelength gravity signal, and interferes with the signal arising from the thickness of unconsolidated post-glacial series.
In order to extract the part of the gravity resulting from post-glacial valley deposits, we calculated a regional Bouguer Anomaly tendency using only points located on the pre-Quaternary basement, for which the thickness of post-glacial deposits is zero (see black triangle on Fig. 5). We subtract this interpolated Bouguer anomaly map to data registered in points located within glacial valleys, in order to obtain a map of residual gravity anomalies. Residual anomalies obtained for points located above post-glacial deposits are almost always negative (Fig. 5), confirming:
- • that post-glacial sediments are significantly less dense than basement rocks;
- • that heterogeneities in the density of basement rocks have a smaller influence on residual gravity anomalies than the superficial post-glacial sedimentary layer.
(Color online.) Map of residual anomalies in the Gave de Pau (left) and Garonne (right) valleys (displayed over the SRTM topography map). Residual anomalies have been estimated by subtracting the “regional trend” grid obtained using measurement points located on the pre-Quaternary basement (black triangles) to the Bouguer anomaly grid obtained using all data. White and red triangles mark points located on Quaternary sediment. White triangles correspond to points for which the interpolated bedrock anomaly is largely constrained (> 1 mgal) by a single-neighbor bedrock point (see the text). Black lines mark the position of the cross-sections presented on Fig. 7.
Finally, residual anomalies can be converted into a depth of sediment assuming we know the density contrast between the basement and post-glacial sediments.
3.3 Uncertainties
Each step of data processing, from the acquisition of measurements in the field to the calculation of Bouguer anomalies, residual anomalies and thickness maps introduces an additional source of uncertainty. The daily instrumental drift of gravimeters we used was generally smaller than 0.1 mgal, and most of the drift is supposed to be corrected considering point reoccupations performed each day. The major source of uncertainty for the calculation of free air anomalies comes from the estimation of the elevation of the points. A 10-cm uncertainty in the elevation of the measurement point leads to an uncertainty of 0.03 mgal for the free air anomaly calculation. Larger uncertainties arise when estimating Bouguer anomalies, for at least two reasons:
- • the density of basement rocks is not precisely known;
- • the topographic map used for the calculation of terrain corrections is not accurate enough to correct the local relief influence close to measurement points, pixels of SRTM data being ∼ 80 m wide.
We estimated the average basement rock density for calculating Bouguer anomalies following the approach proposed by Nettleton (1939), i.e. we chose the density for which the Bouguer anomaly does not show any correlation with elevation. Considering the dispersion of the calculated Bouguer anomalies for points located on the basement, on the slopes of the Gave de Pau valley, we estimate that the precision of the obtained anomalies is smaller than 0.5 mgal in zones of steep relief, the precision being probably better in flat plains where the effect of local topography on gravity is smaller.
Estimating the precision of the thickness of post-glacial sediment is delicate, because it depends:
- • on the precision of calculated Bouguer anomalies;
- • on the interpolation of bedrock Bouguer anomalies within valleys;
- • on the density contrast between post-glacial sediment and the underlying basement.
If the precision of Bouguer anomalies is ∼ 0.5 mgal, the corresponding uncertainty is approximately ΔH ∼ Δg/(2 πΔρG), where ΔH is the thickness uncertainty resulting from the uncertainty in the Bouguer anomaly estimation (Δg), and Δρ is the density contrast at the base of Quaternary sediment. This uncertainty corresponds to ∼ 25 m for a density contrast of 500 kg/m3 between the superficial sediment and the basement.
The influence of basement rock density heterogeneities is difficult to estimate. As mentioned above, we are sure that the effect of basement rocks on residuals is significantly smaller than the effect of Quaternary sediment, since obtained residual anomalies are always negative in glacial valleys. In order to evaluate how the interpolation of bedrock Bouguer anomalies affect residuals, we used the following approach: we calculated again the interpolation eliminating one of the bedrock points and looked how it modifies the calculated residuals. For 14 points on a total of 90 points located on Quaternary sediment in the Gave de Pau valley, and for 14 on a total of 61 in the Garonne valley, changes in calculated residuals may exceed 1 mgal when one of the bedrock points is not considered in the interpolation. The location of these points is marked by white triangles on Fig. 5. For these points, the calculated residuals largely depend on the gravity measured for a neighbor bedrock point. We also marked with white triangles points located in the northern part of the Garonne network, for which there are no bedrock points nearby to constrain the bedrock Bouguer anomaly interpolated map.
Residual Bouguer anomalies are directly proportional to the density contrast between the superficial sediment and the basement. The density contrast could be estimated if auxiliary data, such as a borehole or seismic profiles would give information on the depth of the pre-Quaternary basement somewhere in the valley. In the Grésivaudan (Isère) valley close to Grenoble, Vallon (1999) proposed a density contrast of 500 kg/m3 between the basement and Quaternary sediment. This value has been confirmed by the basement depth observed in the GBM1 deep borehole (Nicoud et al., 2002). In the Rhone valley, Rosselli and Raymond (2003) benefited from several seismic lines that permitted them to estimate the density contrast between the underlying basement and post-glacial sediment. In both cases, authors evaluated this density contrast between 500 and 600 kg/m3. We decided to use the same values to estimate the depth of the Quaternary infill on Pyrenean valleys, acknowledging that this assumption is a major source of uncertainty.
3.4 Results
Figs. 4 and 5 present maps of Bouguer anomalies and residual anomalies, respectively, for the two studied valleys. Both in the Gave de Pau and Garonne valleys, Bouguer anomalies diminish towards the south, i.e. towards the central part of the Axial Zone, as observed in the regional maps provided by Casas et al. (1997). A relative maximum of the Bouguer anomalies is observed close to Lourdes along the Gave de Pau valley, and at the latitude of Bertren along the Garonne valley. The southward decrease of the Bouguer anomaly and the relative maximum observed in the Northern Pyrenean Zone result from the deeper Moho south of the North Pyrenean Fault, and from the presence of rocks with densities approaching that of the upper mantle in the upper crust of the North Pyrenean Zone (Casas et al., 1997). These rocks correspond to ophites and lherzolites that crop out locally beneath Mesozoic sedimentary series, and their presence in the upper crust is probably the result of extension that occurred in Cretaceous times (Jammes et al., 2009).
Residual anomalies have been estimated comparing the map obtained using data acquired on basement rocks with that obtained using the entire dataset, as explained above, following the method used by Rosselli and Raymond (2003) in the Rhone valley. In the Gave de Pau and Garonne valleys, negative residual anomalies larger than 3 and 4 mgal, respectively, are observed in the widest parts of overdeepened valleys (Fig. 5). These residual anomalies are one order of magnitude larger than the uncertainty of Bouguer anomaly data. They are also, however, significantly smaller than the maximum residual anomalies obtained by Rosselli and Raymond (2003) in the Rhone valley (up to 20 mgal close to Aigle) and those obtained by Vallon (1999) in the Isère valley (∼ 12 mgal in Grenoble). This is not a surprise, the width of Pyrenean overdeepened valleys being always smaller than 2 km, while the width of the Isère valley close to Grenoble and that of the Rhone valley close to Aigle is larger than 4 km and 5 km, respectively.
In the Gave de Pau valley, residual anomalies lower than −3 mgal (i.e., more intense anomalies) are observed between Pierrefitte–Nestalas and the Vidalos verrou. Residual anomalies close to −3 mgal are also present downstream of Vidalos, in the Agos basin. Between Agos and Lourdes, the valley is narrow, and the low density of gravity measurements does not permit to infer residual anomalies resulting from the valley infill. North of Lourdes, gravity anomalies estimated in the different diffluent branches of the glacial valley are generally close to −1 mgal.
The base of Quaternary series is more irregular in the Garonne valley. Two deep basins presenting residual anomalies approaching −4 mgal are located close to Marignac, on the one hand, and Frontignan, on the other hand. North of Barbazan, residual anomalies are higher than −2 mgal (i.e. less intense anomalies).
4 Thickness of Quaternary deposits and morphology of glacial valleys
4.1 Depth of the Quaternary sediment/bedrock interface
VPmg-style inversion (Virtual Prism magnetic and gravity inversion, Fullagar et al., 2000, 2008) has been used to estimate the depth of the Quaternary sediment/bedrock interface from the gridded residual gravity anomalies. An initial 2-layer model (Quaternary sediment and bedrock) discretized into vertical rectangular prisms was considered for geometry inversion. This inversion method preserves the petrophysical property (e.g., density) and modifies the size of each prism along the Z-axis in order to minimize the difference between observed and calculated anomalies (Perrouty et al., 2014). The inversion process stops when either the RMS misfit or the model variation between two consecutive iterations is lower than chosen values, determined as a function of the error on the geophysical dataset. The inversion results in a topographic surface that represents the interface between Quaternary sediment and bedrock at depth.
Series of inversions were run for the Gave de Pau and the Garonne valleys using different assigned density contrasts. Model resolution (prism size) was 50 m along both the X (longitude) and the Y (latitude) axes. Vertical resolution of the prisms and of the discretized topography is 10 m. Bedrock density was assumed to be 2.6. Tests were conducted for sediment density of 2.2, 2.1 and 2.0, corresponding to density contrast of 400, 500 and 600 kg/m3, respectively. Table 1 summarizes the result of each test. The results clearly demonstrate the interdependence between the average calculated thickness and the chosen density contrast.
Summary of inversion results for the Gave de Pau and Garonne valleys. Density contrasts between the Quaternary sediment and bedrock varying from 400 to 600 kg/m3 have been tested.
| Gave de Pau | Garonne | |||||
| Density contrast (kg/m3) | 400 | 500 | 600 | 400 | 500 | 600 |
| Model area (prisms) | 199 a 399 | 263 a 343 | ||||
| Iteration number | 33 | 33 | 25 | 42 | 42 | 33 |
| Final RMS misfit (mGal) | 0.16 | 0.14 | 0.14 | 0.15 | 0.12 | 0.12 |
| Maximum depth (m) | 394 | 324 | 232 | 405a | 405a | 334 |
| Averageb depth (m) | 80 | 65 | 57 | 97 | 77 | 65 |
| Volume sediment (km3) | 3.1 | 2.5 | 2.1 | 5.0 | 4.0 | 3.3 |
a The maximum depth allowed for the inversion has been fixed at 405 m, this depth being reached in the Garonne valley for density contrasts of 400 and 500 kg/m3.
b Depth values around 0 m were not considered for average depth calculation. Average depths have been calculated from thousands of prisms whereas the maximum depth is given by one single prism. Average depths and estimated volumes of sediment are approximately inversely proportional to the density contrast.
Fig. 6 shows the inversion result obtained for a density contrast of 600 kg/m3 between the basement and Quaternary sediment. The studied glacial valleys being relatively narrow, the interpolated residual anomaly is smaller when there is no gravity data in the center of the valley, and the corresponding calculated depth of the sediment/bedrock interface is also smaller. Calculated profiles of the bedrock/sediment interface along the two studied valleys partly reflect the positioning of gravity measurements (Fig. 6), and the real longitudinal profiles of the interface is probably smoother than suggested by these calculations. In the following, we describe the depth of the bedrock, calculated considering a 600 kg/m3 density contrast. Bedrock is ∼ 20% and ∼ 50% deeper considering a density contrast of 500 and 400 kg/m3, respectively (Fig. 7).
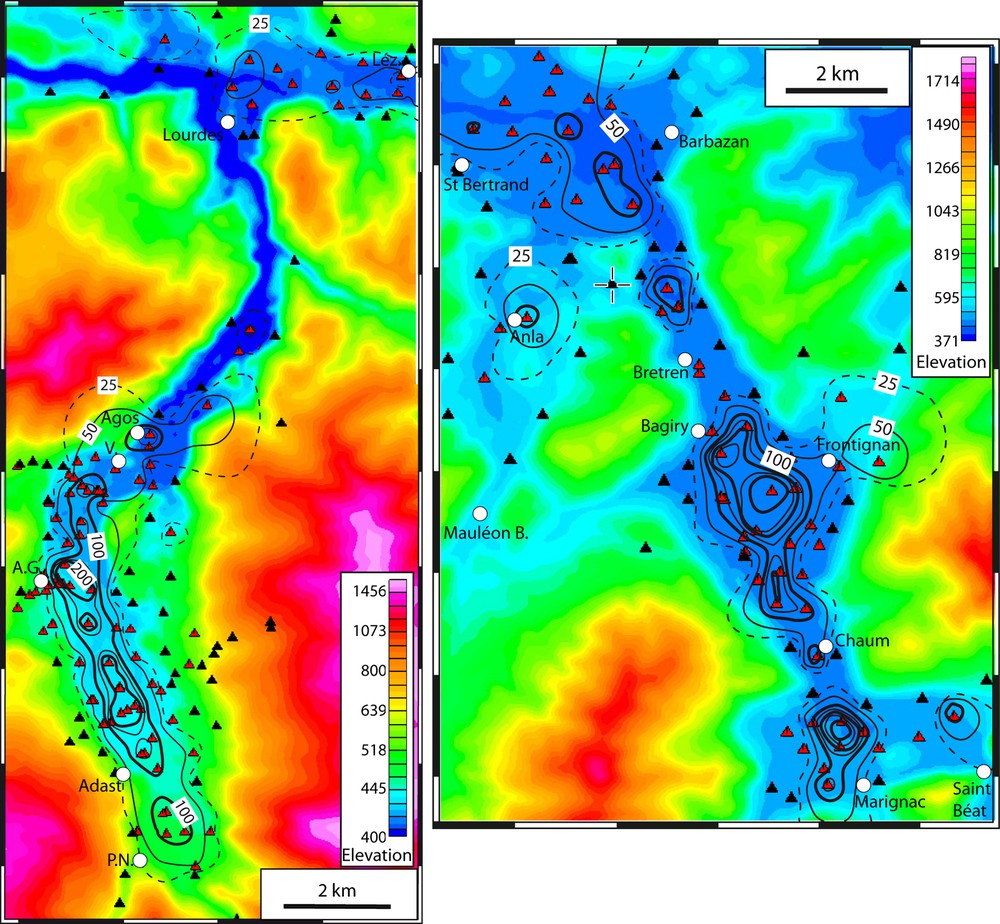
(Color online.) Topographic maps showing the depth of the Quaternary sediment/bedrock interface, calculated supposing a density contrast of 600 kg/m3 in the Gave de Pau (left) and Garonne (right) valleys. Black triangles correspond to gravity data acquired on the bedrock, for which we impose the interface to be located at the surface. See the text for discussion of these values. A.G.: Argelès-Gazost; Léz.: Lézignan; P.N.: Pierrefitte-Nestalas; V.: Vidalos.
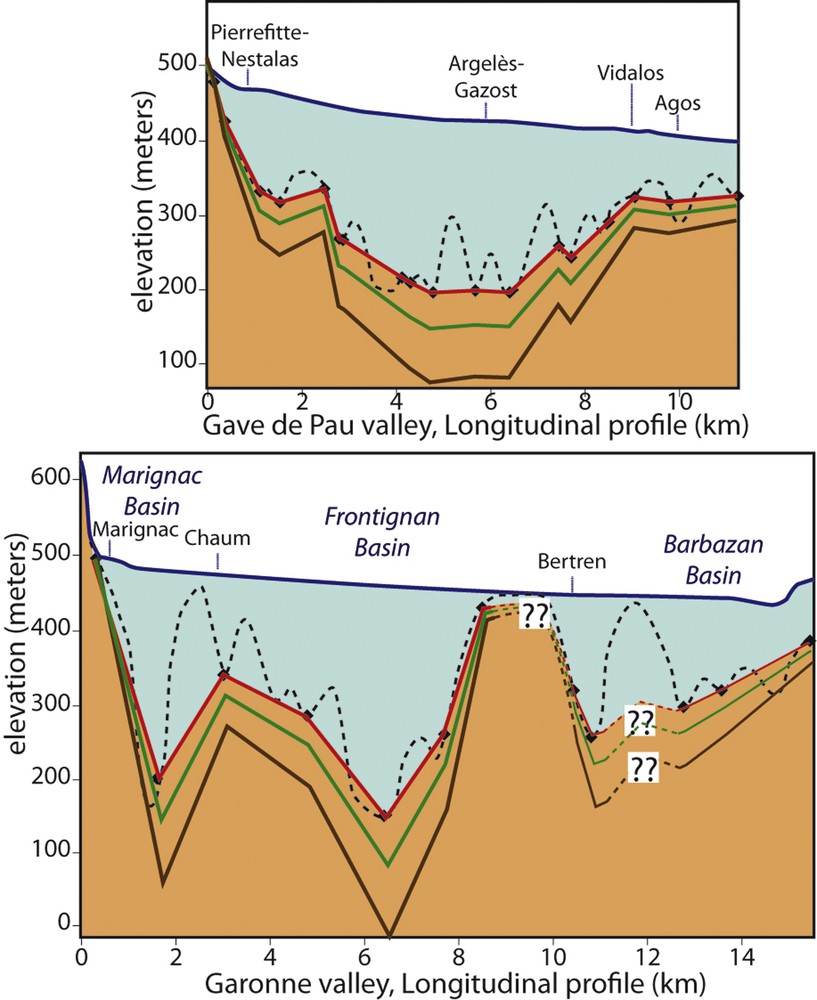
(Color online.) Longitudinal cross-sections of segments of the Gave de Pau and Garonne valleys. The location of the cross-sections is indicated on Fig. 5. Depths have been calculated assuming a density contrast between Quaternary sediment and bedrock of 600 (red line), 500 (green line) and 400 (brown line) kg/m3, respectively. The black diamonds indicate measurements points located along the cross-section. The dotted lines show the raw result of the inversion reported in Figure 6 for a density contrast of 600 kg/m3. This curve shows that where no gravity data is present in the center of valleys, the interpolated thickness of Quaternary sediment is affected by neighbor points located on both sides of valleys, for which the sediment thickness is small or zero.
In the Gave de Pau valley, the data suggest that the sediment/bedrock interface rapidly deepens close to Pierrefitte-Nestalas and the confluence between the Gave de Pau and its major Gave de Cauterets tributary valley. The depth of the interface is ∼ 150 m there (Fig. 7). The depth of the interface increases to ∼ 230 meters between Adast and Argelès-Gazost. North of Argelès, the thickness of Quaternary deposits is ∼ 150 m till Vidalos, where the valley narrows and its depth diminishes. Downstream, in the Agos basin, the valley enlarges and its thickness increases again to values close to 150 m. Between Agos and Lourdes, the Gave de Pau valley is narrow and the network of gravity data is not dense enough to evaluate the thickness of Quaternary sediment. Gravity data north of Lourdes suggest that the thickness of Quaternary sediment is significantly smaller than between Pierrefitte-Nestalas and Vidalos, the residual anomaly being ∼ 1 mgal there. Between Lourdes and Lézignan, the maximum estimated thickness is ∼ 80 meters, most of the valley being filled by less than 50 meters of Quaternary deposits.
The Garonne valley morphology is more heterogeneous than that of the Gave de Pau, as evidenced by the variable width of the valley composed of three successive basins (from south to north, the Marignac, Frontignan, and Barbazan basins). The inversion of gravity data suggests that the maximum depth of the Quaternary sediment/bedrock interface is larger than 300 m both in the Marignac and Frontignan basins (Figs. 6 and 7). It may even approach 500 m if the density contrast between bedrock and sediment is 400 kg/m3! Sediment thickness in the narrow segment of the valley between these two basins is only constrained by one gravity measurement located close to Chaum, suggesting that the depth of the interface is ∼ 130 m. The interface seems to be close to the surface in the second narrow segment of the valley between the Frontignan and Barbazan basins, except near Bertren, where it may locally exceed 150 m. Sediment thickness in the Barbazan basin is smaller than in the two other basins, often less than 100 meters. The sediment thickness in this part of the basin, however, is not accurately constrained because we do not have enough measurement points located on the basement to precisely determine the regional bedrock Bouguer anomaly.
We estimated the volume of Quaternary sediment to 2.1 and 3.3 km3 in the Gave de Pau and Garonne glacial valleys, respectively (Table 1). Recall that the estimation of volumes and thickness are inversely proportional to the density contrast between the sediment and bedrock, and that an auxiliary piece of information arising either from a deep borehole of from seismic data would be necessary to check if the adopted value of 600 kg/m3 is representative of the studied valleys (see above for discussion).
4.2 Discussion: parameters controlling the morphology of glacial valleys
The Gave de Pau and Garonne glacial valleys share some common geomorphological characteristics: the maximum length of their glacial tongues was similar, and the dimension of overdeepened valleys excavated by glacial erosion is comparable (Fig. 8). The overdeepened segment of both valley starts at the confluence between two major glacial valleys, the Garonne and Pique valleys close to Marignac on the one hand, the Gave de Pau and Gave de Cauterets valleys close to Pierrefitte-Nestalas, on the other hand. The depth of the overdeepened parts of the valleys increases suddenly downstream of these confluences, reaching 150 m beneath the present-day river profile close to Pierrefitte, and more than 300 m close to Marignac. In contrast, the thickness of Quaternary sediment filling the downstream parts of the overdeepened valleys, close to terminal moraines (Lourdes and Barbazan basins), is smaller.
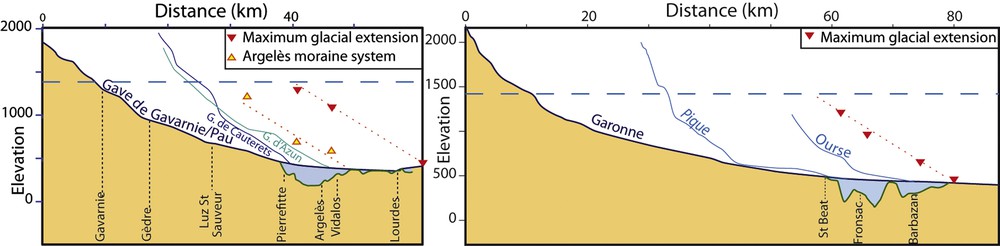
(Color online.) Longitudinal profiles of the Gave de Pau (left) and Garonne (right) valleys and of their main tributary rivers. The Quaternary sediment/bedrock interface is estimated supposing a density contrast of 600 kg/m3 between Quaternary sediment and bedrock. Triangles show the elevation of lateral moraines along the main valley, reported after 1:50,000 BRGM geological maps. The blue dashed line shows the equilibrium line of glaciers during the Würmian maximum, after Calvet (2004).
These observations correspond to predictions of theoretical models of glacial erosion discussed, e.g., by MacGregor et al. (2000) and Anderson et al. (2006). These models simply consider the basic hypothesis that glacial erosion is more efficient when the ice flux flowing through a valley is larger, which occurs downstream of the confluence between two major glacial tongues. This simple hypothesis explains the sudden increase of the Garonne and Gave de Pau valley width and depth in Marignac and Pierrefitte-Nestalas, respectively.
In contrast, such an increase in valley width and depth is observed neither at the Garonne and Ourse valley confluence, nor at Gave de Pau and Gave d’Azun confluence. The average elevation of these two tributary valleys being smaller than that of the Garonne and Gave de Pau valleys above the confluence, glaciers issued from tributary valleys and reaching the confluence probably contributed modest ice fluxes. In fact, the geometry of moraine systems close to Mauléon-Barousse and Anla shows that the main Garonne glacier was flowing upstream in the Ourse valley (Fig. 3), evidencing that the volume of the main glacial tongue flowing in the Garonne valley was smaller beneath the Garonne–Ourse valleys confluence. In the same way, terminal moraines of Aucun in the Gave d’Azun valley show that the valley descending this tributary valley was already disconnected from the main Gave de Pau glacier when the Argelès moraine system emplaced. The present-day Ourse and Gave d’Azun longitudinal profiles both present a knick-point a few kilometers above their confluence with the Garonne and Gave de Pau valleys, respectively (Fig. 8). These knick-points confirm that the two tributary valleys correspond to hanging glacial valleys, which is predicted by theoretical models of glacial erosion when the long-term ice discharge is significantly smaller in the tributary than in the main trunk valley (Anderson et al., 2006; MacGregor et al., 2000).
Theoretical models also explain the modest thickness of post-glacial sediment in the downstream parts of the Garonne and Gave de Pau glacial valleys. Because the ice flux is decreasing downstream, approaching terminal moraines, glacial erosion remained moderate in these parts of the valleys.
We reported on Fig. 8 the elevation of lateral moraines along the main valleys. They mark the elevation of the glacier surface during the last glacial period. In the Gave de Pau Valley, two distinct moraine systems appear separated by a difference in elevation of ∼ 600 m. The highest moraine system may correspond to the glacier advance during the Würmian maximum (MIS-4), while the Argelès moraine system may mark the Last Glacial Maximum (MIS-2, see above). In the Garonne valley, we reported the elevation of the highest lateral moraines. We also reported the equilibrium line elevation estimated by Calvet (2004) for the Würm maximum in this part of the Pyrenees (∼ 1400 meters). Fig. 8 shows that the maximum glacial erosion also occurred close to the place where the main glacial tongue was crossing the equilibrium line at that time, i.e., again, where the ice flux through the valley was maximum.
Data also show that lithology exerts a major control on glacial erosion. The depth of the Quaternary sediment/bedrock interface and the width of the valley are rather constant between Pierrefitte-Nestalas and Vidalos, where the Gave de Pau valley crosses homogeneous Paleozoic sedimentary series pertaining to the Axial Zone. In contrast, the Garonne valley downstream from Saint-Béat is segmented in three large and deep basins (Marignac, Frontignan, and Barbazan basins) separated by narrower segments, reflecting the heterogeneous lithology of the North Pyrenean Zone. The first narrow segment corresponds to migmatite outcrops. Upstream (Marignac basin) and downstream (Frontignan basin), in contrast, the pre-Quaternary bedrock corresponds to soft rocks (metasedimentary series in the Marignac basin, shales in Frontignan) in which glacial erosion enlarged and deepened the Garonne valley. The second narrow segment, downstream Bagiry, coincides with the crossing by the Garonne valley of the Upper Jurassic and Lower Cretaceous calcareous series.
5 Conclusion
As observed, for instance, by Rosselli and Raymond (2003) or Vallon (1999) in Alpine valleys, gravimetry is an efficient tool to estimate the morphology of overdeepened parts of glacial valleys, because of the significant density contrast prevailing between unconsolidated post-glacial sediment and the bedrock. However, it is necessary to estimate the density contrast to evaluate the depth of the sediment/bedrock interface from residual gravity anomalies, the calculated depth being inversely proportional to the density contrast. In the two studied valleys, there is no deep borehole reaching the basement, nor any seismic data that may help us constraining this contrast. Supposing the density contrast is 600 kg/m3, we estimated the volume of Quaternary sediment to ∼ 2.1 km3 and 3.3 km3 in the Gave de Pau and Garonne glacial valleys, respectively. Even though Pyrenean glacial valleys are generally narrower than 2 km, glaciers excavated deep valleys, and the thickness of unconsolidated post-glacial sediment filling these valleys is of several hundred meters. Data show that glacial valleys suddenly widen and deepen at the confluence between major glacial tongues, and that the morphology of these valleys is largely influenced by bedrock lithology, in particular when valleys cross the North Pyrenean Zone.
Acknowledgements
We would like to thank Peter van der Beek and Christel Tiberi for their constructive reviews. We are also thankful to the University of Toulouse and to the BRGM for their logistic and financial support of this project and to the Bureau Gravimétrique International (BGI) for their data.