

1 Introduction
The use of rare earth elements (REEs) in new technologies increased drastically over the last decades (Du and Graedel, 2011; Haxel et al., 2002; Humphries, 2012). As a result, anthropogenic REEs (AREEs) are regularly detected in many polluted river systems of the northern hemisphere (Kulaksiz and Bau, 2013) and they are now also increasingly studied in the southern hemisphere (Merschel et al., 2015). Since the first report on the existence of AREEs in the dissolved loads of rivers (Bau and Dulski, 1996; Tricca et al., 1999), Gd anomalies have been documented through multiple studies. Wastewater treatment plants (WWTP) that receive hospital and domestic effluents are now recognized as the principal sources of Gd in polluted rivers (Bau and Dulski, 1996; Kümmerer and Helmers, 2000; Verplanck et al., 2010). The anthropogenic Gd (Gdant) is not particle-reactive due to the high stability of the Gd-based chemical complex in waters. It will preferentially remain in the effectively dissolved REE pool. More recently, Kulaksiz and Bau (2013) and Klaver et al. (2014) have shown that AREEs can also be detected in the colloidal and particulate fractions of river waters. New candidates for emerging micropollutants are now La and Sm (Kulaksiz and Bau, 2013). Both may originate from the industrial production of catalysts for petroleum refining. However, due to their strategic importance for new technologies, each REE becomes a potential contaminant in water bodies. One might suggest that the composition of the AREE pool is site dependent on and, for a given river system, controlled by the different anthropogenic contributions to the river.
Since 1996, many studies on REE pollution have allowed one to identify anthropogenic sources and to assess the impact of AREEs on the environment (Klaver et al., 2014 and references therein; Kulaksiz and Bau, 2007, 2013 and references therein; Petelet-Giraud et al., 2009). Complementary studies proposed ecotoxicological assessments of a specific REE (Zhang et al., 2010). However, to the best of our knowledge, no study has characterised the dynamics of these AREEs in a given river system during different hydrological stages. Kulaksiz and Bau (2007), and more recently Hissler et al. (2014), quantified the contribution of the WWTP to the river system contamination at the basin scale. They showed that under low flow conditions, more than 95% of the Gd exported from the basin by the dissolved phase comes from the WWTP effluents and can be associated with anthropogenic activities. Moreover, Hissler et al. (2014) also demonstrated, using the REE balance calculation at the basin scale, which for the same low flow conditions Gdant contributes to more than 80% of the total dissolved REEs exported from the basin. Here, we ask about the resilience of the pollution with changing hydrological conditions and the transfer of these contaminants from the riverbed to the more remote and preserved areas of the polluted river basins.
In our study, we focus on the dynamics of AREEs carried by dissolved and suspended particulate loads during a single flood event. First, we identified the REEs that contribute to the anthropogenic pool in both the dissolved and particulate fractions. Next, we coupled the hydrochemical monitoring with a hydrodynamic sediment transport model to present the temporal dynamics of AREEs in the river system and their dispersion in the floodplain during one important flooding event. We also demonstrated that higher-frequency sampling (Berman et al., 2009) and monitoring during more representative hydrological periods appear as prerequisites to improve our knowledge on AREE impacts in river basins.
2 Methodological approach
2.1 The upper Alzette River basin (Luxembourg, Europe)
The Alzette floodplain has a surface of 2.2 km2 and is located in the southwestern part of Luxembourg, at the outlet of a 290-km2 river basin (Fig. 1). At this location, the Alzette River has a mean annual discharge of 1.78 m3·s−1. The area of interest, mainly covered by grassland, is flooded almost every year when the river discharge exceeds 25 m3·s−1. REEs found in the river have different origins and are generally derived from organic matter and soils developed on limestone and marl (Hissler et al., 2014). Moreover, anthropogenic activities have an impact on the REE concentrations of the river. Since 1875, this region has experienced a substantial trace metal pollution due to important urban and industrial developments (Hissler et al., 2008). Contemporary industrial (e.g., surface treatments) and urban (waste incineration, hospital effluents, etc.) activities continue to deteriorate the water quality of the Alzette River.
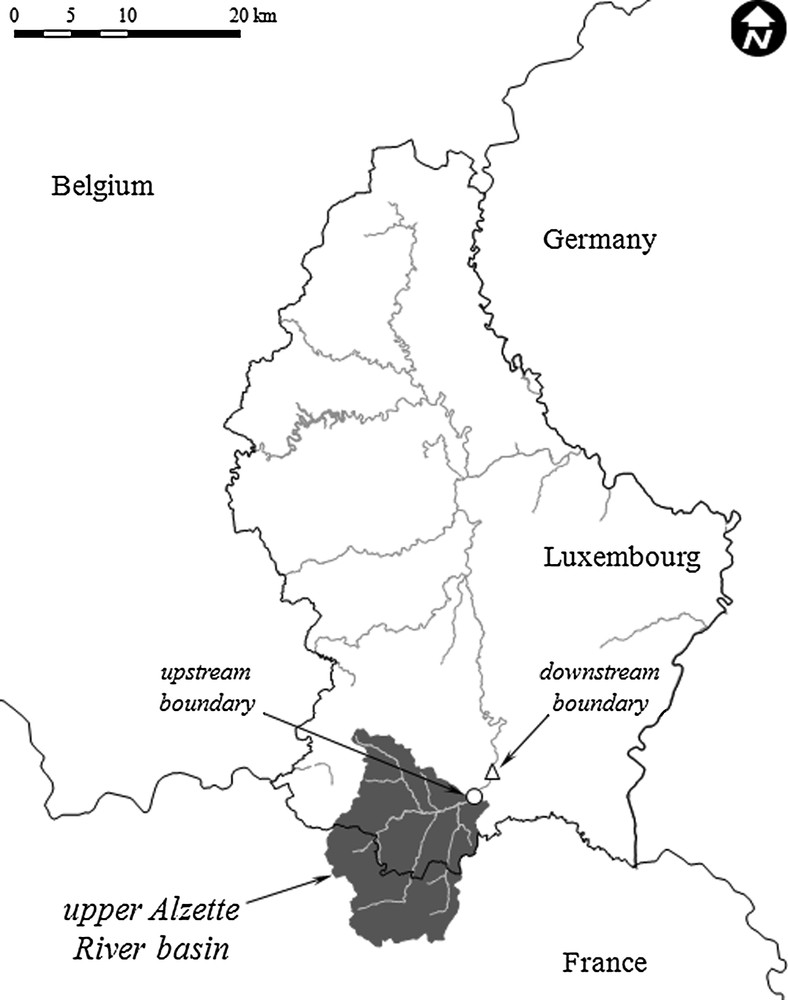
Location of the area of interest, at the outlet of the upper Alzette River basin in Luxembourg, delimited by its upstream and downstream boundaries (Hostache et al., 2014).
The study area encompasses a 4-km river reach and its associated floodplain. Its upstream and downstream boundaries correspond respectively to the outlet of the upper Alzette River basin (Fig. 1) and a site located 4 km downstream from the outlet in the middle of the floodplain area (downstream boundary – Fig. 1). A little creek, which collects urban and industrial effluents, reaches the Alzette River 700 m before the downstream boundary. The discharge of this creek varies from 0.5 to 2.0 m3·s−1 and can be considered as negligible, compared to the Alzette River during high water levels.
2.2 Water sampling, preparation and analysis
The upstream and downstream river boundaries are equipped for monitoring river discharge every 15 min and for sampling hourly stream water at 20 cm below the water surface using ISCO© autosamplers. Urban effluents were also sampled regularly during the flood event. About 60 water samples were collected for the determination of the REE concentration. This corresponds to an average of 10 samples per day at the two boundary locations.
The water samples were filtered using 0.45-μm Teflon filters in order to separate the particulate and the dissolved + colloidal fractions (named dissolved in the following sections). The dissolved fraction was acidified directly after the filtration, using 1% ultrapure HNO3. The filters were dried in a desiccator to estimate the suspended sediment concentration and mineralized using an HF/HNO3/HClO4 acid mixture for a total digestion of the particulate fraction.
REE analyses were directly determined using an ICP–MS (PerkinElmer ELAN DRC-e), without a pre-concentration procedure. Internal standards (ICP certified standard of rhodium 1000 mg/mL in HCl, and ICP certified Plasmacal standard of Rhenium 1000 mg/mL in H2O) were added online with the peristaltic pump. The detection limit for all REEs was always close to 0.7 ng·L−1.
2.3 Estimation of dissolved and particulate REE fluxes
The fluxes of dissolved and particulate REEs were estimated at the upstream and downstream boundaries of the study area. Since, due to technical constraints, discharge was only observed inside the riverbed at the downstream location, we relied on the model to estimate discharge in the floodplain during bank overtopping conditions.
The dissolved REE fluxes were calculated for each hydrological period during a flood event by multiplying every 15 min the river discharge by the average dissolved REE concentration.
The high-frequency acquisition of suspended sediment concentration (SS) allows us to linearly interpolate between two samples in order to recover the SS concentrations at the same frequency as the discharge measurements (15 min). The particulate REE fluxes were calculated for each hydrological period by multiplying every 15 min the river discharge, the SS concentration, and the average particulate REE concentration. The total REE flux for the entire flood event was then obtained by integrating the flux calculated for the different periods.
2.4 Estimation of the AREE contributions
The concentrations of AREEs were adapted from Kulaksiz and Bau (2013) and references therein. The anthropogenic gadolinium (Gdant) is estimated by using the Gd anomaly [Gd/Gd* – equations (1) and (2)]. In principle, neighbouring REEs of Gd are used to quantify the Gd anomaly, but there is still no recognized standard methodology. Most of the studies have used Sm and Tb (Bau and Dulski, 1996; Bau et al., 2006; Klaver et al., 2014; Knappe et al., 2005; Petelet-Giraud et al., 2009; Rabiet et al., 2005; Tricca et al., 1999) or Eu and Tb (Elbaz-Poulichet et al., 2002; Nozaki et al., 2000). More recent studies propose to use in priority light REEs for the calculations: Nd and Sm (Kulaksiz and Bau, 2007) or Nd and Eu (Kulaksiz and Bau, 2013; Merschel et al., 2015). Indeed, the obtained Gd* values seem to be more representative of the background measured in pristine rivers where Gd belongs to the group of light REEs (Kulaksiz and Bau, 2007). Here, we propose to use Nd and Dy [Eq. (1)]. On the one hand, the PAAS-normalized REE patterns of the Alzette River water show for the dissolved phases systematically increasing trends from Nd to Dy (low flow conditions – Fig. 2). On the other hand, Gd reacts as middle REEs with increasing discharge and Eq. (1) is able to significantly quantify the Gd anomaly that could be observed during high flow conditions (Fig. 2c).

Average PAAS-normalized rare earth element (REE) pattern of dissolved and particulate fractions in the water collected at the upstream (a and b) and downstream (c and d) locations and in the urban effluent (e and f) during low (white circles) and high (black circles) flows. Average PAAS-normalized REE pattern of the upper Alzette River bedrocks and soils are also presented: they are divided into two groups according to the two main lithologies that represent the basin (b).
The anthropogenic cerium (Ceant) is derived from the commonly used Ce anomaly [Ce/Ce* – Eqs. (3) and (4)].
| (1) |
| (2) |
| (3) |
| (4) |
2.5 Hydrodynamic sediment transport modelling
A hydrodynamic sediment transport model was recently set up for the Alzette floodplain by Hostache et al. (2014). Its objective is to predict over space and time-distributed sediment fluxes, sediment concentrations, erosion, and deposition.
This model is based on the Telemac hydro-informatic system version 6.2 (Hervouet and Bates, 2000). It couples dynamically Telemac-2D (Lang, 2010) and Sisyphe (Villaret, 2010). Telemac-2D is designed for simulating river flow and tracer dispersion (e.g. dissolved chemical elements), whereas Sisyphe is designed for simulating sediment transport. Telemac-2D is based on the two-dimensional de Saint Venant equations (also called shallow water equations). Sisyphe decomposes sediment transport into bedload and suspended load. Since our study focused on small-size sediment particles, bedload was not considered.
The model decomposes the spatial domain into an unstructured triangular mesh (having 25,086 nodes), each triangle being defined by three nodes. On every node and at every time step Telemac-2D and Sisyphe compute, inter alia, water depth, flow velocity, tracer concentration, sediment erosion/deposition amount and suspended sediment concentration. This is of primary interest, as the model can then estimate sediment deposition amounts and suspended sediment fluxes in the water column at any node of the domain.
In addition, the model offers the possibility to include Lagrangian drifts during simulations. Lagrangian drifts are designed in the Telemac hydro-informatic system for following, at any predefined time step of a simulation, a particle drifting at the same velocity as water flows. As it is reasonable to assume that small-size sediment particles are entrained at the water velocity, Lagrangian drifts allow us to follow suspended sediment particles across the domain during the flood events. As a matter of fact, taking advantage of this last point allows us to estimate when a deposited sediment particle entered in domain.
Using this model, we propose to evaluate and compare the contributions across the floodplain and the river channel to global suspended sediment fluxes. Moreover, we propose to estimate sediment deposits in the floodplain with an estimated time of when the corresponding sediment particles entered the domain.
3 Results and discussions
3.1 Hydrological characteristics of the selected flood event
We selected a 2011 winter flood event lasting from 6 to 9 January as test case. This was the most important flood recorded in the area of interest for the past 20 years (Fig. 3). At the upstream boundary, the discharge reached 45 m3·s−1 inside the riverbed (Fig. 3a). At the downstream boundary the discharge measured inside the riverbed (Qmes) reached only 22 m3·s−1, due to important overtopping (Fig. 3b). We used the hydrodynamic model for completing the hydrograph for the entire section of the floodplain during the event (Qmodel, Hostache et al., 2014). The suspended sediments evolved in similar concentrations at the upstream and downstream boundaries during the sampling campaign. They ranged from 20 to 390 mg·L−1 and reached their maximum earlier than the river discharge. The most important part of the sediment was mobilized and transported during the more dynamic part of the flood, i.e. when flow velocity increased rapidly (Fig. 3).

Variability of Gd (Gd/Gd*) and Ce (Ce/Ce*) anomalies, river discharge (Q) and suspended sediment concentrations (SS) during the studied flood event at the (a) upstream and (b) downstream boundaries of the Alzette River floodplain area. Qmes corresponds to the discharge measured inside the riverbed and Qmodel to the discharge calculated by the hydrodynamic model, which included riverbed and floodplain discharge at the downstream boundary (b). Grey areas divide the flood in periods characterized by different discharge regimes.
The flood event was divided in seven periods according to the temporal evolution of the observed river discharge, flow velocity, and suspended sediment concentrations (Fig. 3).
3.2 REE dynamics during the flood event
Fig. 2 shows the characteristic PAAS-normalized REE patterns that were observed for dissolved and particulate fractions at the three sampling locations during low and high flow conditions. REEs have very similar compositions in the suspended sediments, the dissolved fraction in high flows and the soils developed on marls.
On Fig. 4, the concentrations are divided into light (LREEs), middle (MREEs) and heavy (HREEs) REEs for both the dissolved and the particulate fractions collected in the Alzette River at the two boundaries and in the urban effluent. The evolution of the concentrations presents similarities for the different REE groups of both fractions during the flood event. Moreover, the concentrations of the dissolved and particulate REEs increased according to their atomic mass: LREE > MREE > HREE.
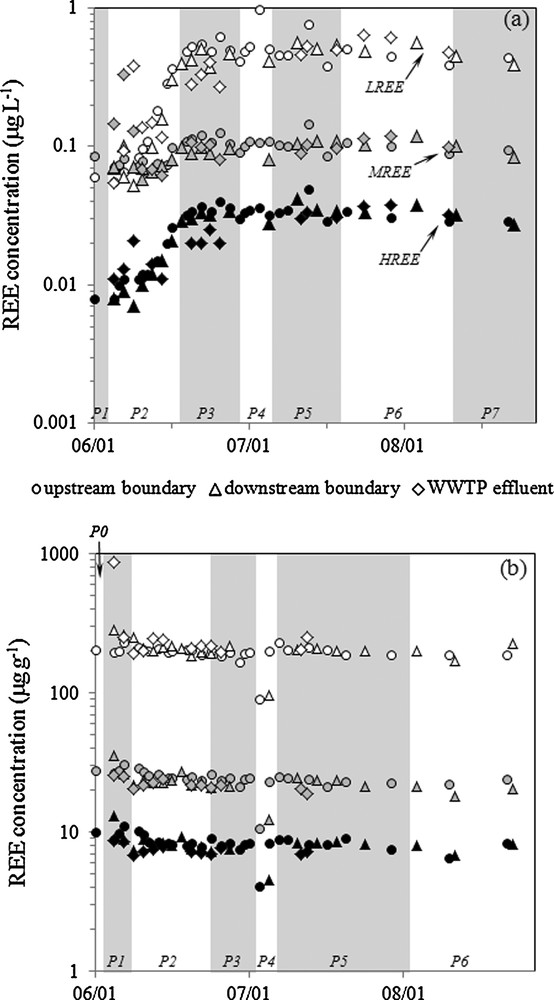
Evolution of the (a) dissolved and (b) particulate rare earth element (REE) concentrations in the Alzette River and the urban effluent during the studied flood event.
The dissolved REE concentrations increased during the first hydrological periods (P1 and P2) and reached a plateau (LREE: 0.5 μg·L−1, MREE: 0.1 μg·L−1, HREE: 0.035 μg·L−1) when the suspended sediment load had reached its maximum (Fig. 3). This illustrates the control by the colloids on the dissolved REE content during high flow conditions. These colloids remained in the water column during the rest of the flood event sampling. In comparison to the two other groups, LREEs are one order of magnitude higher. This may be due to the important role played by the organic-enriched colloids in the dynamic and transport of LREEs, as already highlighted by Hissler et al. (2014) for the upper Alzette River. The contribution of more organic-enriched colloids can be illustrated by the increase of the LaPAAS/YbPAAS ratio that varies from 0.2 at the beginning to an average value of 0.6 during the most important part of the flood (Table 1).
Average Gd and Ce anomalies, LaPAAS/YbPAAS ratio and fluxes of all the REE (FREE) in the dissolved and particulate fractions of the Alzette River water during the different hydrodynamic periods of the studied flood event at the three sampling locations.
| P0 | P1 | P2 | P3 | P4 | P5 | P6 | P7 | ||
| Upstream boundary dissolved | Gd/Gd* | – | 16.3 | 9.7 | 1.6 | 1.5 | 1.5 | 1.7 | 1.6 |
| Ce/Ce* | – | 0.8 | 0.8 | 0.8 | 0.8 | 0.8 | 0.8 | 0.9 | |
| LaPAAS/YbPAAS | – | 0.2 | 0.4 | 0.6 | 0.9 | 0.6 | 0.6 | 0.6 | |
| FREE (g·h−1) | – | 1 | 19 | 96 | 132 | 108 | 54 | 22 | |
| Upstream boundary particulate | Ce/Ce* | – | 1.0 | 1.1 | 1.0 | 1.0 | 1.0 | 1.0 | 1.0 |
| LaPAAS/YbPAAS | – | 0.9 | 1.0 | 1.0 | 1.1 | 1.2 | 1.1 | 1.0 | |
| FREE (g·h−1) | – | 23 | 3006 | 8815 | 5468 | 3273 | 1226 | 304 | |
| Urban effluent dissolved | Gd/Gd* | 41.9 | 28.0 | 5.4 | 3.5 | – | 1.6 | 2.2 | – |
| Ce/Ce* | 0.7 | 0.9 | 0.9 | 0.9 | – | 0.9 | 0.8 | – | |
| LaPAAS/YbPAAS | 0.1 | 0.4 | 0.6 | 0.5 | – | 0.7 | 0.4 | – | |
| Urban effluent particulate | Ce/Ce* | 7.3 | 2.5 | 1.4 | 1.1 | – | 1.6 | – | – |
| LaPAAS/YbPAAS | 1.3 | 1.2 | 1.2 | 1.1 | – | 1.2 | – | – | |
| Downstream boundary dissolved | Gd/Gd* | 17.8 | 18.4 | 2.9 | 2.0 | 1.6 | 1.5 | 1.8 | – |
| Ce/Ce* | 0.8 | 0.8 | 0.9 | 0.9 | 0.9 | 0.9 | 0.9 | – | |
| LaPAAS/YbPAAS | 0.3 | 0.3 | 0.6 | 0.6 | 0.6 | 0.6 | 0.6 | – | |
| FREE (g·h−1) | 1 | 3 | 29 | 91 | 139 | 104 | 32 | – | |
| Downstream boundary particulate | Ce/Ce* | 1.2 | 1.3 | 1.1 | 1.1 | 1.1 | 1.0 | 1.0 | – |
| LaPAAS/YbPAAS | 0.9 | 1.1 | 1.1 | 1.3 | 1.0 | 1.1 | 1.1 | – | |
| FREE (g·h−1) | 72 | 1158 | 2927 | 4745 | 5130 | 1968 | 282 | – |
The concentrations of the particulate REEs present only low variability compared to the hydrological conditions. They show a very stable average value of 200, 25 and 9 μg·g−1 for the LREEs, MREEs and HREEs, respectively, during the entire sampling campaign.
The dissolved LREEs and particulate total REEs concentrations measured at the flood peak (P4) showed significant differences in comparison to the other flood periods. The LaPAAS/YbPAAS ratio of the dissolved LREEs reached its maximum value of 1.6 and the total concentrations of the particulate REEs decreased significantly (Fig. 4a). The colloids and suspended sediments that enter in the floodplain during the flood peak clearly present a different REE composition. This could be attributed to a replacement of clayey suspended sediments by particles more enriched in organic compounds and organic matter fragments (higher LaPAAS/YbPAAS and lower particulate concentrations). This sample might correspond to another component of the basin that is not activated for river discharge below 22 m3 s−1. During the same period, we observed a decrease in the concentration of the particulate fraction at both the upstream and downstream boundaries. The delay between the two observations corresponds to the transfer time of the water from the upstream to the downstream sampling sites in the riverbed. In comparison to the particulate fraction (Fig. 5b), the increase of the dissolved LREE concentration, up to 1 μg·L−1, was not observed at the downstream boundary. We hypothesize that when this new water enters the alluvial area during the overtopping process, it mixes and gets rapidly diluted with older water, which has lower LREE concentrations. This is confirmed by the model results as can be seen on Fig. 5a, where dilution effects are clearly visible.
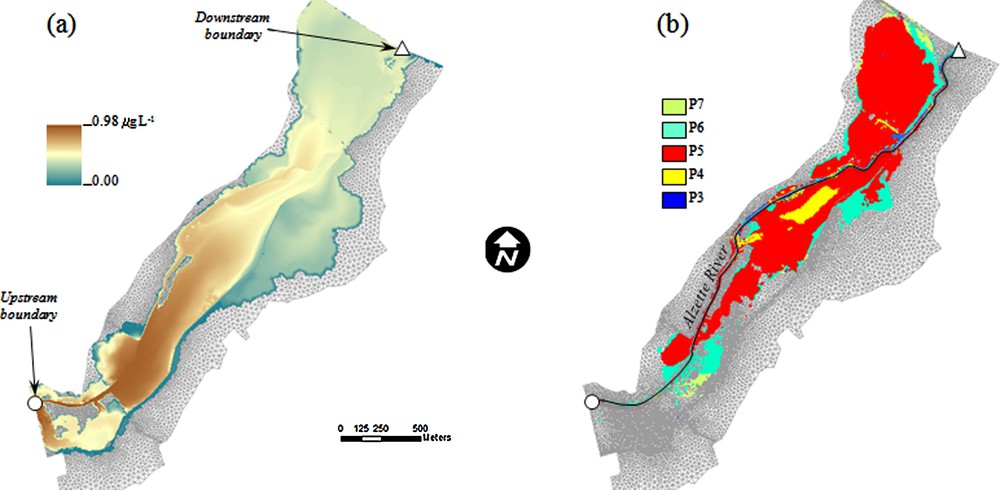
(Colour online.) a: Disperse flood plume of the light rare earth element (LREE) concentrations that entered the floodplain 1 hour after the peak; b: suspended sediment deposition in the floodplain during the different hydrodynamic periods of the studied flood event (Fig. 2). The results were obtained using the hydrodynamic sediment transport model based on a dynamic coupling between Telemac-2D and Sysiphe.
3.3 Composition of the AREE pool
The dissolved MREEs do not vary as much as the LREEs and the HREEs between high and low flows (Fig. 3). Compared to the threshold value that characterizes the MREE concentrations during high flows, the concentrations measured at low discharge are higher than for the two other REE groups. This is related to non-natural enrichment in Gdant (Fig. 3). The Gd anomaly observed for this site is quite high compared to other studies (Klaver et al., 2014; Kulaksiz and Bau, 2013). Its maximum values range from 16 (upstream) to 18 (downstream), with the highest value measured in the urban effluent (42 – Table 1). This is in line with previous investigations made for all the wastewater treatment plants located within the upper Alzette River basin (Hissler et al., 2014). The impact of Gdant is higher during periods 1 and 2 (Fig. 2 – Table 1). During the higher flows and the flood recession, Gdant is significantly diluted in non-polluted waters coming from more natural areas within the basin. However, its anomaly always remained above 1.5 at the upstream and downstream boundaries (Table 1), indicating that Gdant always contributed to more than 25% of the total Gd. This value was determined by Bau et al. (2006) as a minimal limit for the quantification of Gdant in river water. Gd is the only dissolved REEs with an anomaly that may be linked to anthropogenic activity in this basin. From this, we conclude that it constitutes the entire AREE pool of the dissolved fraction within the Alzette River waters.
The higher value for the particulate LREEs (900 μg·g−1) in the urban effluent and at the downstream boundary (Fig. 4) is particularly interesting. This value can be related to the very high positive Ce anomaly observed in the particulate fraction of this effluent (> 7 – Table 1, Fig. 3). The Ce enrichment is transferred to the river and also observed at the downstream boundary from P1 to P2 (Table 1 – Fig. 2). Such a value of Ce/Ce* was not observed during the event in the upper Alzette River basin, where Ce/Ce* remained close to 1.0 at the upstream boundary. Merschel et al. (2015) observed a similar positive Ce anomaly (Ce/Ce* < 2.59). Like Stille et al. (2006) and Steinmann and Stille (2008), they relate this anomaly to oxidative scavenging of Ce onto inorganic Mn and Fe (oxyhydr-) oxides or organic particles. In the case of the Alzette River basin, the Ce enrichment in the particulate fraction can be considered as non-natural and can be attributed to anthropogenic activity. To our knowledge it is the first time that such an anthropogenic Ce (Ceant) has been observed in river waters. Ce is used prolifically in various engineering and biological applications (Humphries, 2012; Xu and Qu, 2014), mainly in combination with oxygen to produce CeO nanoparticles (Conesa, 1995; Garaud et al., 2014). Nevertheless, additional information is required for discussing further the exact origin of this anthropogenic Ce. The observed anomalies represent 86 and 43% of Ceant transported by the suspended load in the urban effluent and in the Alzette River, respectively. No other anthropogenic anomaly was observed on the particulate fraction at the two boundaries. Thus, Ceant is assumed to be the only AREE in the particulate pool of the studied waters.
3.4 Dynamics of the REE fluxes at the upstream boundary
Close to 200 kg of REEs were exported from the upper Alzette River basin to the downstream areas during the investigated flood event. The highest quantity of REEs was transported via the particulate fraction (192 kg), whereas dissolved and colloidal REEs only represented 4 kg. This corresponds to a specific total REE flux of 0.24 kg·d−1·km−2. Eighty percent of these REEs are transported during the highest water stages, from P3 to P5 (Table 1).
The two periods that were significantly impacted by AREEs (P1 and P2 – Fig. 2) corresponded to 5 and 3% of the total REE exportation for dissolved and particulate fractions, respectively. As shown on Fig. 6, the AREE pool was mainly present in the river channel during the first 12 hours and represents no more than 35 and 25% of the total dissolved and particulate REE fluxes during the first hours of the flood. Then, it decreased rapidly and, 12 hours later, this anthropogenic component was completely diluted in more natural components of the basin. During the rest of the flood, AREE contributions stayed below 5% of the total dissolved and particulate REE loads.

Floodplain contribution to total sediment fluxes and antropogenic contribution to dissolved Gd and particulate Ce fluxes.
The specific dissolved and particulate AREE fluxes have been estimated to 1.1 × 10⁻⁴ and 3.8 × 10⁻³ kg·d−1·km−2 during this flood event. This estimation is in accordance with the value acquired during pure low flow conditions in the same basin (Hissler et al., 2014). In comparison, preliminary estimations made for the total AREE load in major contaminated European rivers range from 7.0 × 10⁻⁵ (Kulaksiz and Bau, 2013) to 1.2 × 10⁻³ kg·d−1·km−2 (Klaver et al., 2014) in the Rhine River and 8.0 × 10⁻⁶ kg·d−1·km−2 in the estuary of the Weser River (Kulaksiz and Bau, 2007). Despite of the uncertainties that are inherent to the flux calculations based on such a single sampling, these values are quite close to those obtained for the upper Alzette River basin. The difference observed might be attributed to the dilution of AREE pools in larger river systems.
3.5 Transport and deposition of particulate AREEs in the floodplain
The dynamics of exported dissolved AREEs are very similar from the upstream to the downstream boundaries during all hydrodynamic periods of the flood (Fig. 6 and Table 1). The difference observed at the beginning of the flood in the dissolved and particulate fractions is due to the impact of the effluent, which is flushed out from the urban areas. This behaviour may characterize a conservative behaviour of dissolved REEs for the studied area. It is especially the case for Gdant, which is commonly recognized as particularly non-reactive with sediment particles in river waters (Kulaksiz and Bau, 2007). These new results, based on a coupling of geochemistry and hydrodynamic modelling, strengthened the hypothesis of a long environmental half-life of Gdant in river systems.
Fig. 5b shows the simulated sediment deposits in the floodplain during the flood event. Each colour corresponds to one of the seven hydrodynamic periods that constitute the entire flood (Fig. 2). The hydrodynamic sediment transport model allows us to identify when the deposited sediments probably entered the alluvial system. From this figure, we can relate successive suspended sediment depositions to a REE pollution level in the particulate fraction that entered the floodplain. Periods 1 and 2 are not represented because the simulation did not show any deposits in the floodplain that originated from the Alzette River during these two initial periods. This is also shown on Fig. 6, where the AREE contribution is shown with the contribution to floodplain suspended sediment fluxes (obtained through modelling). During the overtopping period, the AREE contribution is negligible in comparison to the total REE fluxes that are transported within the study area.
4 Conclusion
The impact of anthropogenic activity on the REE cycle is now recognized for river systems in the northern hemisphere. However, the type of REE involved in the contamination may change according to the industrial and urban activities that exist in a given river basin. Like shown elsewhere, we observed a very significant Gd enrichment in the dissolved fraction coming from medical facilities. Moreover, we presented particulate Ce as a new candidate for the AREE pool of river waters.
The environmental management of the AREEs released in river systems requires a higher sampling frequency over longer periods to integrate hydrological changes. Focusing on the flood event scale allows us to describe in detail the dynamics of the anthropogenic pool of REEs during a short period with large hydrological changes. We have shown that AREE contributions are observable at the beginning of the flood and are rapidly diluted in waters coming from more natural components of the basin before the highest discharges are reached. We quantified the AREE fluxes at 5% of the total REEs exported from the basin during the entire flood event.
Coupling an intense geochemical monitoring and hydrodynamic modelling helped to demonstrate that the deposition of AREEs in the alluvial areas is not significant in comparison to the natural pools of REEs during one single flood event. The major part of the particulate AREE pool remains inside the riverbed and is transferred downstream, where it enters a cycle of deposition/remobilization of the bottom riverbed sediments.
Acknowledgements
This study was part of the DISMET project (Advanced Solutions for the Calibration of Heavy Metal Dispersion Contamination Modelling in Floodplains), funded by the National Research Fund (FNR) of the Grand Duchy of Luxembourg in the framework of the CORE research program (Contract No. C09/SR/18). We are grateful to M. Bau for the very constructive and thoughtful reviews and to F. Chabaux for the invitation in this special issue and editorial handling. We want to thank Markus Jonas for his support on the use of the Linux cluster and his help in programming the Monte-Carlo simulation code. We also want to thank Cyrille Tailliez, François Barnich, Jérôme Juilleret, and Johanna Ziebel for their most valuable support in environmental monitoring and sampling analysis.