

1 Introduction
Airborne particulate matter (PM) of both natural and anthropogenic origin can affect air quality and human health (Kampa and Castanas, 2008; Murray et al., 2001; Petit et al., 2015). Among the anthropogenic PM sources, transportation, energy production and manufacturing industries emit large amounts of PM as well as persistent organic pollutants and heavy metal compounds (Cohen et al., 2010; Gieré and Querol, 2010; Gieré et al., 2006; Grobéty et al., 2010; Guéguen et al., 2012a,b,c, 2013; Lahd Geagea et al., 2007, 2008a, b; Négrel et al., 2015; Petit et al., 2015; Widory et al., 2010). In addition, the mining industry contributes significantly to the load of airborne PM in mining districts, especially through processes, such as open-pit mineral extraction and ore processing (Chaulya, 2004; Cohen et al., 2010; Ghose, 2004, 2007; Ghose and Majee, 2000a, b, 2007; Mukai et al., 2001; Widory et al., 2010). The impacts of such PM on environment and health depend, among other factors, on the chemical composition and physical properties of the individual particles (Gieré and Vaughan, 2013).
To monitor and, eventually, to improve air quality through implementation of dust-control policies, the sources of anthropogenic airborne dust must be identified. The isotopic ratios of certain elements (e.g., Pb, Sr, Nd, Zn) as well as major and trace element characteristics of PM can be used as powerful tools for identifying the source of airborne pollutants, such as coal-combustion plants, cement factories, metal smelters, steel plants, and waste incinerators (Grobéty et al., 2010; Guéguen et al., 2012a; Lahd Geagea et al., 2007; Mattielli et al., 2009).
After studies upon the combination of Sr, Nd and Pb isotope systems as tracers of sources in soil forest (Stille et al., 2012), here, the goal of our investigation was to characterize coarse atmospheric PM and assess its sources in the coal-mining district of Quang Ninh Province, northeastern Vietnam. This region is known for its natural beauty (e.g., Halong Bay, a United Nations World Heritage Site), but also for extensive coal mining. The mining activities lead to considerable PM loads, which are further increased by particulate emissions from several other pollution sources; in order to characterize the different sources of atmospheric particulates, we have analyzed a set of representative samples with respect to their Pb, Sr, and Nd isotopic composition and their bulk major and trace element content.
2 Material and methods
2.1 Sampling sites
The study was conducted in Quang Ninh, a province in northeastern Vietnam (Fig. 1) that hosts vast reserves (∼ 7.2 Gt) of high-quality anthracite. Of the overall coal production in Vietnam (11.3 Mt in the year 2000; USGS, 2000), production in Quang Ninh accounts for 85–95% and has increased significantly over past decades, with an estimated annual production of over 75 Mt by 2030 (HoangTrungHai, 2012; TranXuanHoa, 2010). Coal-fired power plants produce 56.4% of Vietnam's total electricity and will consume 171 Mt of coal by 2030 (Martens et al., 2011; NguyenTanDung, 2011; TranXuanHoa, 2010). The coal from Quang Ninh has a relatively high energy content and contains low amounts of ash and sulfur, but the mining activities have considerable impacts on the local environment (e.g., coal mine drainage, air pollution) and human health (Hoàng-Hòa et al., 2011, 2012; Martinez et al., 2013).

A. Overview map of Vietnam showing the location of Quang Ninh Province in the Northeast. B. Map of Quang Ninh Province showing the three areas Dong Trieu, Cam Pha, and Van Don (dark grey), where airborne particulate matter (PM) was sampled. C. Schematic map of the Cam Pha coal-mining area indicating the open-pit coal mines and the sampling sites. CS = Coc Sau mine.
This study focuses on the coal-mining town of Cam Pha (Fig. 1) and its surroundings, where various sources of air pollution exist, including: several open-pits; coal-processing facilities; thermal power plants; a major harbor for coal export; waste-rock dumps; a cement factory; and road, train and ship traffic.
The PM samples were collected at three different locations: station 1 (ST1) was established on the roof of a private house (10 m above ground; 14 m above sea level), which is located at a distance of 20 m from a main road (# TL334) on Van Don island, ∼ 10 km to the east of Cam Pha. Station 4 (ST4) was installed on the roof of a private house in the town of Cam Pha (14 m above ground; 20 m above sea level), ∼ 2 km from the nearest open-pit coal mine, the Coc Sau mine (Fig. 1C). Station 5 (ST5) was installed in the village of Dong Trieu, at the curbside of the main access road to Cam Pha (∼ 100 km to the west, Fig. 1B). ST5 was set up to obtain a PM sample representative of the local traffic emissions.
To characterize potential sources of airborne PM, we also collected samples of geological and industrial materials. These include coal from the Coc Sau open-pit mine (sample S16) and sandstone (sample C601), which represents a prominent type of host rock of the Coc Sau coal. All coal deposits in the Cam Pha area are hosted by the Triassic Hòn Gai formation, which consists mainly of sandstone, conglomerates, siltstone and shale, and which is up to 2400 m thick. During the large-scale mining operations, these sedimentary host rocks are trucked to waste-rock dumps (Fig. 1C), where samples C605 and S9 were collected. We further characterized a sample of the local Carboniferous to Permian limestone, which represents a dominant lithologic unit in Quang Ninh Province. This limestone is also mined extensively and transported by truck and conveyor belts from the quarries to the local cement-manufacturing plant (Cam Pha Cement Jsc.; Fig. 1C), where it is used as major raw material. A sample of the cement produced in this factory was collected and analyzed. We further sampled fly ash from one of the thermal power stations located next to the coal-processing facilities in Cam Pha (Fig. 1C), where 2.5 Mt of raw coal are washed and cleaned annually (USGS, 2000). Moreover, a soil sample (S7) was collected from a rice-field located between ST4 and the Coc Sau open-pit mine (Fig. 1C).
To evaluate a possible traffic contribution to the PM samples, we collected diesel soot, which was scraped off the exhaust pipes of various mobile sources:
- • a large mining truck used for coal transportation in the Coc Sau mine (horizontal exhaust pipe near one of the wheels);
- • two locomotive engines (samples DS01, DS02) of coal-transporting trains circulating inside and outside of the mining district (vertically arranged exhaust pipe on locomotives);
- • two passenger cars (samples DS03, DS04) in Cam Pha;
- • a ship (sample DS05; vertical chimney) from the coal-shipping Cua Ong harbor (Fig. 1C).
2.2 Sampling of airborne PM
Airborne PM was collected with a Sigma-2 passive sampler. This device, implemented by the German Meteorological Service, is primarily used for routine air quality measurements in German health and recreation resorts, which are licensed by state regulation based on specific air quality standards (VDI_3787, 2008). The Sigma-2 sampler with its specially designed wind-free interior allows particles to be deposited almost exclusively according to the sedimentation principle. Moreover, it largely avoids the collection of particles suspended in rain droplets (wet deposition), thus allowing for sampling of mainly dry deposition (VDI_2119, 2013). After deposition on a transparent adhesive collection plate, which is exposed for an appropriate time in the interior of the sampler, individual coarse particulates in the size range of 2.5–80 μm are analyzed by automated optical microscopy. Apart from this operational application, the Sigma-2 technique is also used for various air quality studies (e.g., Schleicher et al., 2011, 2012; Yu et al., 2011). The Sigma-2 sampler is a cost-effective device, which does not require a power supply and thus, can be installed in a wide range of environments. In a recent study, the Sigma-2 sampler has been used successfully with a new acceptor substrate (VDI_2119, 2013), a dish that is suitable for the needs of trace element and isotope analysis (Guéguen et al., 2012b, 2012c).
Our study comprised two PM sampling campaigns (September 13 to October 25, 2010; December 5-26, 2011). At ST1 and ST4, we collected two sets of Sigma-2 samples: day samples, collected during a 12-h period from 7 am to 7 pm; and night samples, collected from 7 pm to 7 am, both accumulating PM over a period of up to three weeks.
The geochemical and isotopic data for all samples (Tables S1, S2, S3) as well as details of the analytical methods are given as Supplementary Information (available online).
3 Results
3.1 Mass deposition rates (MDRs)
The MDRs of individual elements (Table S1) were used to calculate the total MDRs. The latter are minimum values, because not all elements have been analyzed (e.g., Si is missing for technical reasons). For the comparison of total MDRs, however, only those elements present in all samples were summed up.
The total MDRs (Fig. 2) show that during the dry season ST4, located near the Coc Sau coal mine (Fig. 1C), exhibits values that are seven to nine times (day) and fifteen to sixteen times (night) higher than those measured at ST1, which we consider to be representative of the atmospheric baseline conditions in this region. The data also document that the total MDR at ST5 (curbside of a busy street) is high (7.2 mg·m−2·d−1), considerably higher than the values measured at ST1.
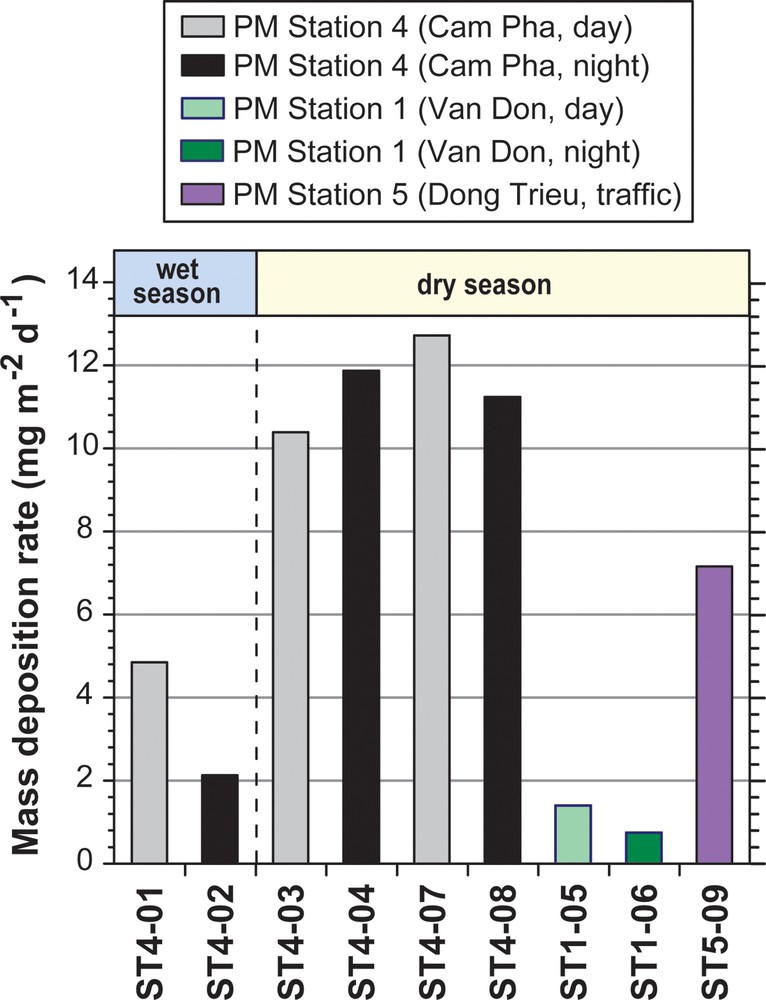
(Color online.) Total mass deposition rates (in mg·m−2·d−1) for particulate matter at the Van Don (ST1), Cam Pha (ST4), and Dong Trieu (ST5) sampling stations. Mass deposition rates were calculated from the following elements: Mg, Al, Ca, V, Cr, Cu, Mn, Fe, Co, Ni, Cu, Zn, As, Rb, Sr, Y, Zr, Mo, Cd, Sn, Sb, Cs, Ba, La, REE, Pb, U, and Th. Data from Table S1. Samples ST4-01 and ST4-02 were collected during the wet season.
3.2 Major and trace element distributions
3.2.1 Ternary diagrams
Concentration data in ppm or ppb are available only for samples of potentially important PM source materials, but not for the actual PM samples. We therefore use ternary diagrams for the comparison of concentration data for PM (given in ng·m−2·d−1, Table S1) with those for the source materials (Table S2). Ternary diagrams have been used previously to successfully identify specific emission sources through the relative enrichments among the three considered elements (Guéguen et al., 2012a,b,c; Moreno et al., 2008).
The concentrations of Ca are much higher in cement and limestone than in any other potential source material (Table S2). Aluminum concentrations are the highest in fly ash, and diesel soot is the richest in Fe. In the FeCaAl triangle (Fig. 3A), all PM samples together define a trend between fly ash and coal on one side, and limestone and cement on the other side. The PM samples from ST4 plot relatively close to the Al corner, near fly ash and coal. The PM samples from ST1, however, plot close to the Dong Trieu traffic sample as well as limestone and cement.

(Color online.) Relative element enrichments in the studied samples, shown in the ternary diagrams (A) FeCaAl, (B) PbSrNd, (C) PbSbZn, and (D) ZnCoCr.
The Sr concentration is low in coal, sandstone, rice-field soil and sediment dumps, but high in limestone and cement. Diesel soot contains < 27 ppm Sr, and its Pb contents range from 5 ppm (passenger car) to 1400 ppm (locomotive). Fly ash, rice-field soil and sediment dumps are relatively rich in Pb compared to coal, sandstone, cement and limestone. The Nd contents are relatively high in fly ash and sandstone, and even higher in rice-field soil and sediment dumps, but low in diesel soot (≤ 8 ppm). In the PbSrNd triangle (Fig. 3B), sandstone, coal and fly ash plot together with rice-field soil and sediment dumps in the Nd corner, whereas limestone and cement plot close to the Sr corner. Diesel soot shows a distinct trend from the Pb corner to the coal-dominated Nd corner. The PM samples are aligned subparallel to the diesel trend, but are slightly more enriched in Sr. The PM samples from Cam Pha are close to coal, soil and sediment dumps, whereas those from ST5 and ST1 are close to car diesel.
The Pb-rich locomotive-diesel soot is also Sb-rich (up to 16 ppm); the other diesel-soot samples are poorer in Sb (≤ 4 ppm). The other potential source materials contain up to 8 ppm Sb. Zinc concentrations are highest in diesel soot (230–4033 ppm). In the PbSbZn triangle (Fig. 3C), the PM samples from ST1 plot closer to the car, truck and ship-diesel soot (close to the Zn corner) than the samples from ST4, which plot in the vicinity of the coal-derived fly ash. Two of the Cam Pha samples (ST4-03, ST4-04) plot in the Pb-dominant part of the triangle, towards the Pb-rich soot from one of the locomotive engines (DS02).
Chromium and cobalt are important trace elements in fly ash, but they are significantly less abundant in coal (Table S2). Diesel soot has comparatively low Co concentrations, but its Cr contents are high. Strongly enriched in Cr compared to coal and limestone are the rice-field soil and the sediment dumps. This observation also holds for Co and Zn, although to a lesser extent. In the ZnCoCr triangle (Fig. 3D), the PM samples from ST5 and ST1 plot close to truck-diesel soot, whereas those from ST4 plot further away from diesel towards coal and fly ash.
3.2.2 Rare earth element (REE) enrichments
Comparison of REE concentrations in the PM samples with those in the upper continental crust (UCC; Taylor and McLennan, 1995) allows for identification of relative REE enrichments and/or depletions in the samples. To compare the REE data for PM (ng·m−2·d−1) and UCC (ppm) we use enrichment factors (EF), defined as:
Neodymium is used for comparison, because the Sm/Nd ratios of our PM samples are only slightly higher than those of UCC, i.e. not significantly fractionated compared to UCC (Fig. S1A). The EFUCC can be used as fingerprints and may help in identifying contributions to the PM composition from different sources.
All PM samples show rather similar light-REE (LREE) distribution patterns with relatively small ranges in EFUCC (Fig. S1A). The EFUCC for the heavy REE (HREE) exhibit larger ranges, with a maximum for Gd (EFUCC: 1.19–1.34). Most of the HREE, however, are depleted compared to UCC.
Fig. S1B–F permits the comparison of the REE distribution patterns of potential dust sources with those of the PM samples. The LREE distribution patterns of the PM samples do not show much similarity with those of limestone, cement, rice-field soil, and sediment dumps (Fig. S1D–F). However, the LREE patterns are very similar to those of coal, fly ash, and sandstone, as well as those of diesel soot, which also shows a similar positive Sm anomaly (EFUCC: 1.04–1.15). The EFUCC of HREE for the PM samples decrease when increasing the atomic number, and the strong Gd anomalies are similar to those observed for diesel soot (EFUCC: 1.17–1.25). Nevertheless, the HREE distribution patterns of coal and fly ash also show some similarities with those of the PM samples, e.g. a Gd enrichment (EFUCC: 1.2). However, the heaviest REE of the PM samples are similar to diesel soot, i.e. less depleted and much less fractionated than those of coal. On the other hand, one recognizes for the HREE of all PM samples small positive Dy and Er anomalies (Fig. S1A), which are not characteristic of diesel soot (Fig. S1B, C), but rather prominent in limestone and cement (Fig. S1D).
3.3 Comparison of Pb, Sr and Nd Isotopic Compositions
Fig. 4 allows a comparison of the Pb isotope ratios of the PM samples with those of potential dust sources. The highest 206Pb/204Pb and 206Pb/207Pb values are observed for the limestone (Table S3), with ratios that are characteristic of this type of rock, with generally high U/Pb ratios (0.44). Similarly, the sandstone from the Coc Sau mine shows much higher Pb isotopic compositions than the PM samples. Limestone, sandstone, and coal display the range of the geological Pb isotopic compositions in the region, defining the A–B array in Fig. 4A. Fig. 4B (detail of Fig. 4A) shows that fly ash and coal from the Coc Sau mine are very similar in their Pb isotopic compositions, which is expected, since the power plant combusts Coc Sau coal. The diesel-soot samples exhibit rather large variations in Pb isotope ratios (e.g., 206Pb/207Pb: 1.136–1.164) and define the C–D array, whose slope is slightly steeper than the A–B slope. In the 208Pb/204Pb vs. 206Pb/207Pb diagram (Fig. 4C, D), all PM and diesel-soot samples appear to plot on a similar array (B–D) as in Fig. 4B. However, the positions of the limestone and the cement are distinct, plotting off the array toward higher 206Pb/207Pb values.
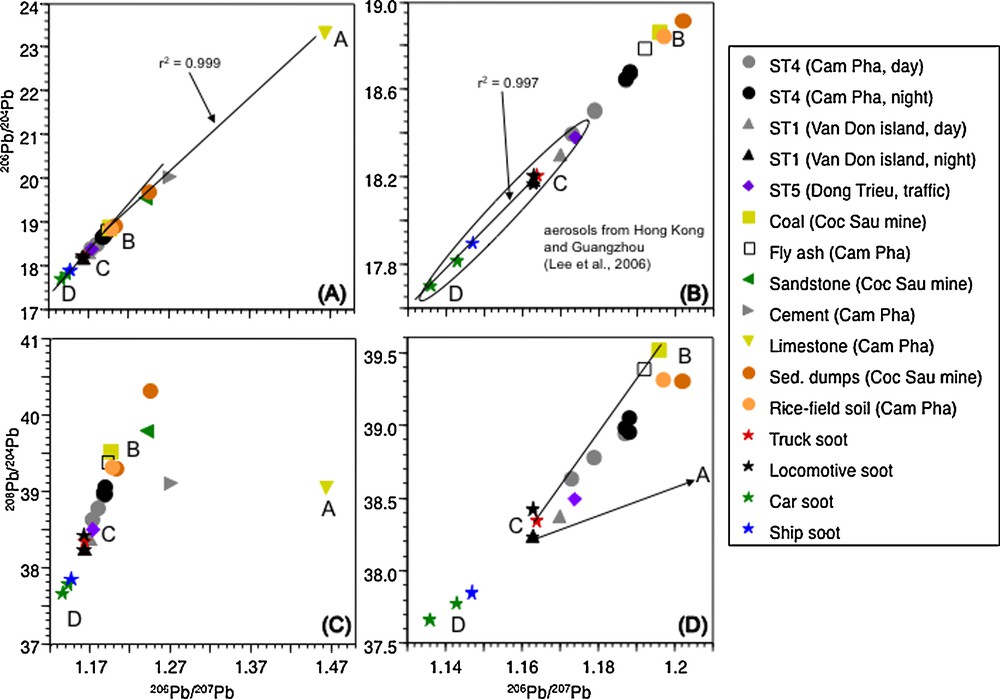
A. Plot of 206Pb/204Pb vs. 206Pb/207Pb for the PM samples, for geological and industrial materials, and for diesel soot. Mixing array A–B is defined by coal and limestone. B. Detail of (A), also showing a “mixing array” defined by diesel soot as well as a field (ellipse) that represents the isotopic ratios measured for aerosols from Hong Kong and Guangzhou, China (data from Lee et al. (2006). C. Plot of 208Pb/204Pb vs. 206Pb/207Pb for the samples studied here. D. Detail of (C), also showing the three components (triangle) controlling the Pb isotopic compositions of the PM samples: A = limestone; B = coal; C = truck soot. Masquer
A. Plot of 206Pb/204Pb vs. 206Pb/207Pb for the PM samples, for geological and industrial materials, and for diesel soot. Mixing array A–B is defined by coal and limestone. B. Detail of (A), also showing a “mixing array” defined by diesel soot as ... Lire la suite
In the 87Sr/86Sr vs. Rb/Sr diagram (Fig. 5A), the diesel-soot samples define a clear array. The PM samples plot on this diesel trend or on its extension toward higher 87Sr/86Sr and Rb/Sr values. Coal and fly ash plot on the upper end of this correlation, whereas limestone and cement plot on the lower end. The limestone has an 87Sr/86Sr of 0.70777, which corresponds to the Sr isotopic composition of Early Permian seawater, in agreement with the age of the limestone in the Cam Pha area (Korte et al., 2006). In the Sr isotope-mixing diagram (Fig. 5B), the data do not define a single mixing line, as the diesel samples belong to two distinct populations, one for car soot with comparatively low Sr contents, the second for the other soot samples with high Sr concentrations (Table S2).
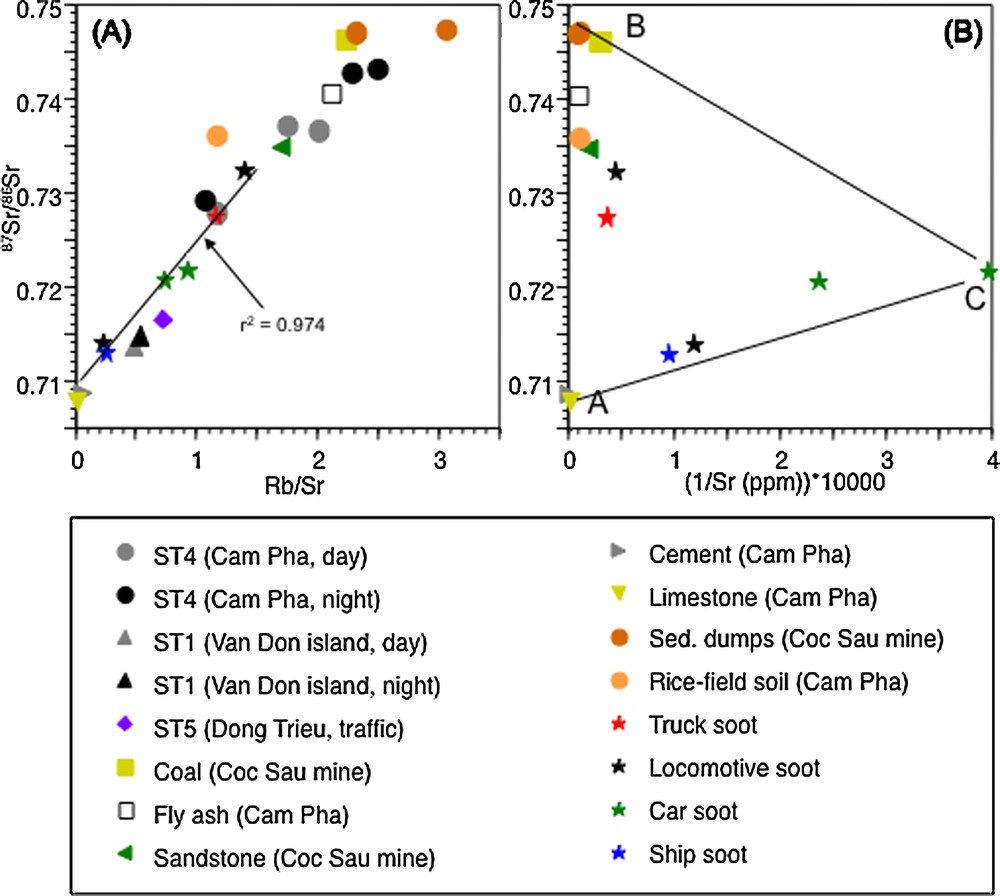
(Color online.) (A) Plot of 87Sr/86Sr vs. Rb/Sr for the PM samples, for geological and industrial materials, and for diesel soot, also showing a “mixing array” defined by diesel soot. (B) Plot of 87Sr/86Sr vs. 1/Sr × 10,000 (ppm).
In Fig. 6A, the sediment samples show rather large variations in 143Nd/144Nd: the values range from 0.51213 for limestone to 0.51184 and 0.51181 for coal and one of the sediment dumps (Table S3). The 143Nd/144Nd values are higher for diesel soot from cars than from truck, locomotives and ship. The PM samples plot in two different areas: close to coal and fly ash (ST4 day and night) and near limestone and cement (ST1, ST5).
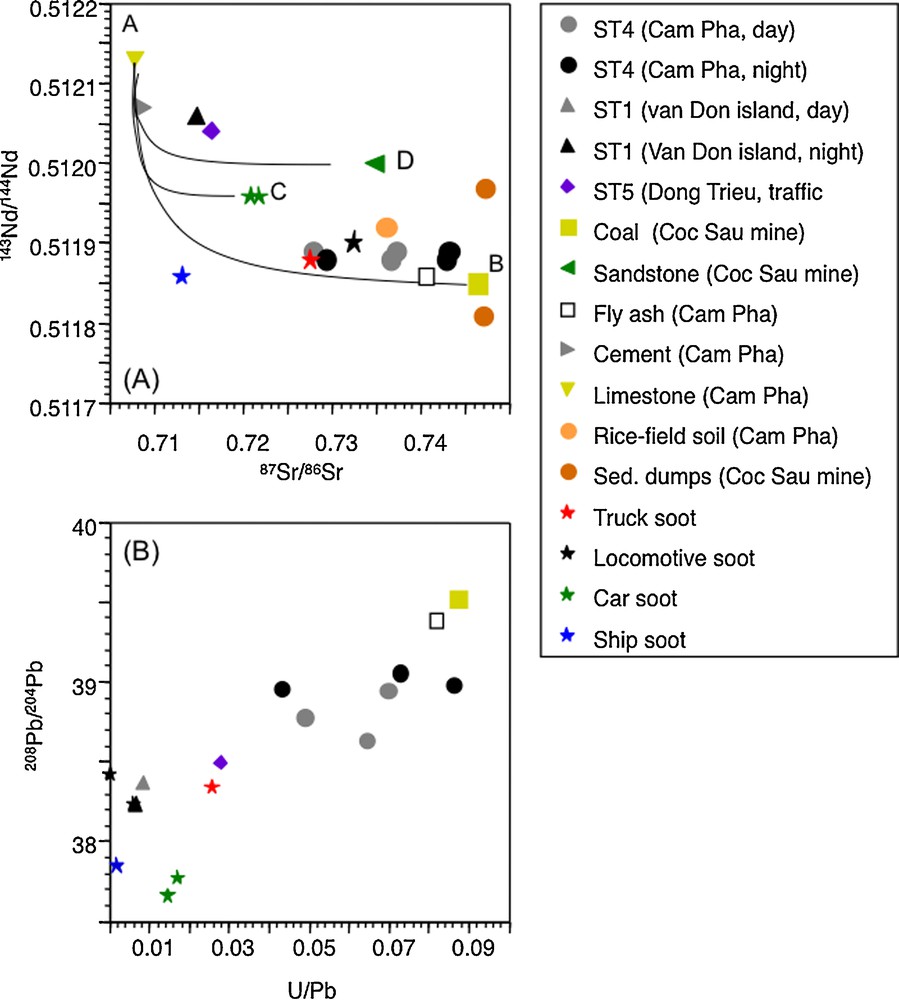
(Color online.) (A) Plot of 143Nd/144Nd vs. 87Sr/86Sr for the PM samples, for geological and industrial materials, and for diesel soot, also showing mixing curves between the limestone end-member (A) and the end-members coal (B), car soot (C), and sandstone (D). B. Plot of 208Pb/204Pb vs. U/Pb for the PM samples, and for coal, fly ash and diesel soot. Limestone, cement, sandstone, rice-field soil, and sediment dumps are not shown because of much higher U/Pb ratios (> 0.13).
4 Discussion
4.1 MDR's
The total MDR values in the mining area are very high (Fig. 2), even though the data are presented in elemental form rather than in their more probable sulfate, oxide or silicate form. For example, during the dry season, MDRs at ST4 are more than three times higher than those measured in the industrial harbors of Strasbourg (France) and Kehl (Germany; Guéguen et al., 2012a). Similarly, the MDRs at ST5 are twice the values determined for high-traffic environments in the cities of Strasbourg, Kehl, and Freiburg (Germany). In Cam Pha, the first set of day and night samples (ST4-01, ST4-02), collected during the wet season (April–September), shows comparatively low MDRs. The other two sets of day and night samples from ST4 (ST4-03, 4-04, 4-07, 4-08) were collected during the dry season and show much higher MDRs, which reflects the monsoon-controlled climatic change from wet to dry season during the 2010 sampling campaign (Fig. 2). A similar seasonal effect has also been described in Hanoi (Hien et al., 2002, 2004).
4.2 Characteristics of potential dust sources
4.2.1 Geological and industrial materials
Coal and fly ash have rather similar Pb, Sr, and Nd isotopic compositions (Figs. 4–6) and exhibit similar trace element characteristics (Fig. 3). This result is not surprising, since the power plant uses the Coc Sau coal for energy production. Likewise, the elemental as well as the Sr and Nd isotopic characteristics of limestone and cement are similar, which again is not surprising, because the cement plant uses the regional limestone as raw material; only the Pb isotopic compositions of limestone and cement are considerably different. Because of these similarities, we use mainly the terms of coal and limestone in the PM source discussion (See 4.3), where they play an important role because of their significantly different Pb, Sr and Nd isotopic compositions.
In the 206Pb/204Pb vs. 206Pb/207Pb diagrams (Fig. 4A, B), both the sediment dumps and the rice-field soil plot close to the coal end-member of the A–B mixing line, suggesting that their Pb isotopic composition is controlled predominantly by Pb from the Coc Sau coal. However, they probably also contain some Pb derived from limestone and diesel soot, as indicated by their position in the ABC triangle (Fig. 4C, D). Similar conclusions can be drawn from the co-variations between 87Sr/86Sr and Rb/Sr (Fig. 5) and 143Nd/144Nd and 87Sr/86Sr (Fig. 6A), as well as from the relationships displayed in the FeCaAl, PbSbZn, and ZnCoCr diagrams (Fig. 3).
4.2.2 Diesel soot
To assess soot as a potential PM source, it is important to know whether the isotopic signatures of the samples are primary or, perhaps, modified due to contamination by dust particles accumulated in the exhaust pipes of the mobile sources. The very well-defined array C–D (Fig. 4B) of the diesel-soot samples combined with the position of the coal end-member (B) suggests that coal-derived Pb contributed to the Pb isotopic composition of soot, especially locomotive and truck soot (highest 206Pb/207Pb). The relationships between 208Pb/204Pb and U/Pb (Fig. 6B), however, exclude such a simple mixing scenario where car and ship soot represent an uncontaminated end-member (D), but rather indicate that the soot samples belong to two different populations. This suggestion is also supported by Fig. 4D (detail of Fig. 4 C), where the truck and locomotive data appear as separate groups with significantly higher 208Pb/204Pb and 206Pb/207Pb values than those observed for car and ship soot. Car soot has the lowest Pb contents (5–7 ppm, Table S2) and isotopic compositions (Table S3). Much higher Pb concentrations than in car soot, or coal and limestone, are found in truck (36 ppm), ship (86 ppm) and locomotive soot (156 and 1400 ppm). Thus, the Pb isotope ratios and comparatively high Pb concentrations suggest that the isotope ratios of locomotive and truck soot cannot be the result of a simple two-component mixing between Pb derived from car soot (D) and coal (B).
The Sr isotopes of the diesel-soot samples confirm this result and clearly reveal contributions from both coal and limestone, as indicated by the tight soot array between these two rock types (Fig. 5A). Soot from truck and locomotive DS01 have high 87Sr/86Sr ratios (Table S3), and thus plot closest to the coal composition, whereas soot from locomotive DS02 and the ship plot close to limestone. The Sr isotope-mixing diagram (Fig. 5B) emphasizes that two diesel-soot populations exist, as indicated by the position of the data points in the triangle ABC. Here, limestone represents component (A) with lowest 87Sr/86Sr, high Sr and low Rb contents (Table S2). Coal represents component (B) with high 87Sr/86Sr and comparatively high Sr and Rb concentrations. Component (C) is represented by car soot with intermediate Sr isotopic compositions and low contents of Sr (lower than truck, locomotive or ship soot) and Rb. Soot samples from locomotive DS02 and the ship plot along A–C and therefore either they are uncontaminated, i.e. reflecting the primary diesel composition, or their original compositions are similar to that of car soot and then have been contaminated by limestone-derived Sr. In the latter case, A–C would be a mixing line defined by the end-members limestone and car soot. Soot of locomotive DS01 and truck with the more radiogenic Sr isotopic compositions, however, contain important amounts of coal-derived Sr. The mixing line defined by 87Sr/86Sr and Rb/Sr of the soot samples (Fig. 5A), which emphasizes the importance of coal and limestone contributions, has an intercept with the 87Sr/86Sr axis at 0.7092. This value is slightly higher than that of limestone, but close to present-day seawater (0.7091; Hodell et al., 1991). Thus, low Sr isotopic compositions might also be caused by sea spray deposition, especially in the case of the soot collected from the ship's chimney.
4.3 Origin of the PM
Fig. 3 indicates that at least three principal sources contributed to the chemical composition of the PM: diesel soot, coal (fly ash), and limestone (cement). The importance of the limestone contribution is especially well visible in the FeCaAl triangle, where all PM samples describe a trend between limestone and coal, with PM from ST1 and ST5 situated closer to limestone and the Cam Pha PM closer to coal (Fig. 3A). The impact of diesel soot is not visible in this diagram, but becomes evident in the other concentration triangles, where the PM samples from Cam Pha always plot closer to coal, those from ST1 and ST5 closer to diesel soot. The REE patterns confirm the above observations: the PM patterns seem to be mainly influenced by diesel soot and coal (fly ash), but limestone-dust contributions (cf. positive Gd and Dy anomalies in Fig. S1A, D) cannot be ruled out. The latter are even confirmed by the Pb, Sr and Nd isotopic signatures (Fig. 4, Fig. S1).
In Fig. 4B, all PM data plot between coal and diesel soot, which thus are the principal dust sources. The data suggest, however, that all PM samples also contain some limestone-derived Pb (high 206Pb/207Pb), because their compositions plot within the ABC triangle (Fig. 4D), to the right of the B–C line, which connects the diesel soot and coal end-members. Similar information is provided by the Pb-mixing diagram (Fig. 6B) and, as discussed above, the FeCaAl triangle (Fig. 3A) and the REE patterns (Fig. S1).
The PM samples from ST1 have the lowest Pb isotope ratios, nearly identical to those of truck and locomotive soot. They are the less influenced ones – or not at all – by coal-derived Pb, Sr and Nd (cf. Figs. 5A, 6A). They also lie within a field (ellipse in Fig. 4B) defined by aerosols from Hong Kong and Guangzhou, China (Lee et al., 2006). The Pb isotopic composition of PM from ST1 is similar to that of PM from ST5, collected at the curbside of a high-traffic road (Fig. 4), and thus, is clearly strongly influenced by traffic-derived Pb. In Fig. 5A, the PM samples from ST1 and ST5 plot relatively close to limestone, but also into the range defined by diesel-Sr isotopic compositions. Thus, similar to the Pb data, the Sr isotopic compositions of the ST1 and ST5 samples can simply be explained by diesel, possibly with some limestone-derived Sr.
The PM samples from ST4 collected during the night plot close to the coal (fly ash) end-member (Fig. 4) and, therefore, are strongly affected by dust from coal (and sediment dumps); the PM samples collected during the day, on the other hand, have lower Pb isotopic compositions, plot closer to diesel soot and, thus, carry a stronger traffic-Pb signature than the corresponding night samples. During the night, it is assumed that the wind blows from the land to the sea (typical local land-sea breeze system), i.e. from the Coc Sau mine towards ST4 (Fig. 1C), which is consistent with the stronger coal signature observed for the night samples. During the day, the wind blows from the sea towards ST4, which results in a signal that is influenced more strongly by diesel soot originating from the busy coastal road (Fig. 1C). A similar trend is seen in the Sr and Nd isotope diagrams: the PM samples from ST4 collected during the day show lower Sr isotopic ratios and thus a more traffic-derived Sr than the corresponding night samples (Fig. 5A). The 87Sr/86Sr vs. Rb/Sr relationships further emphasize that the PM samples from Cam Pha collected during the day also carry a stronger limestone-derived Sr signature than the corresponding night samples.
Additional information on the origins of the studied PM is provided by Fig. 6A: assuming that limestone (A) and coal (B) are the principal dust sources, we calculated the mixing curve A–B by using the Sr and Nd isotopic compositions and corresponding concentrations of the two end-members. The PM from ST4 plots slightly above, but parallel to, the mixing curve and close to the coal end-member, confirming that it was mainly coal that contributed to the Sr and Nd isotopic compositions of the PM. In contrast, the ST1 and ST5 samples plot off the A–B mixing curve and, thus, rather exclude the presence of coal-derived Sr and Nd. Alternatively, neither mixing curve A–C (between limestone and car soot) nor curve A–D (between limestone and sandstone) explain the isotopic characteristics of these samples in a satisfactory way. At this point, it has to be remembered that ST1 and ST5 represent two extremely different types of sampling sites. The Van Don Island site is located 10 km away from coal and cement production sites and, thus, is considered to represent the atmospheric baseline conditions, as also confirmed by low dust MDRs (Fig. 2). The Dong Trieu sample has also been collected far away from the studied mining area (100 km W), but at the curbside of a very busy road with comparatively high MDRs (Fig. 2), and thus represents a different traffic situation: here, traffic emissions include not only trace metals contained in diesel and gasoline soot, but also particles derived from tire, brake and road-surface abrasion as well as corrosion particles. Therefore the contents of all analyzed metals are substantially higher in ST5 than in ST1 dusts (Table S1). The fact that the ST1 and ST5 samples are isotopically very similar suggests that further away from the coal mining area traffic-derived Pb, Sr and Nd mainly define the atmospheric baseline composition.
5 Conclusions
The data presented here confirm that only the combination of the 87Sr/86Sr and 143Nd/144Nd isotope ratios with those of the Pb isotope system allows for a clear distinction between the contributions from the different anthropogenic and natural sources.
Some of the diesel-soot samples collected directly from the exhaust pipes of a truck and two locomotives used for coal transport in the area of the Coc Sau mine also contain coal dust particles, as indicated by isotope and trace element data. Diesel soot of car and ship exhausts appear to be much less overprinted. The soot from the ship chimney, however, probably contains a contribution from sea spray deposition.
The PM samples from the Cam Pha mining area are dominated by coal and fly ash, and by truck and locomotive-diesel soot. They are isotopically and chemically distinct from PM collected at the Van Don Island site, which exhibits the lowest MDRs and which we consider to represent the baseline isotopic composition. The PM from Van Don Island, however, exhibits isotopic compositions and some trace element signatures that are similar to those of PM collected at ST5, a high-traffic site with substantially higher MDRs. The isotopic similarity between the ST1 and ST5 samples suggests that traffic emissions characterize the atmospheric baseline for the PM composition in the studied area.
Acknowledgements
This study has been supported financially by REALISE (Réseau Alsace de laboratoires en ingénierie et sciences pour l’environnement, France) and by a Ph.D. student grant from the Vietnamese Government (to Thi Bich Hoàng-Hòa).
Vous devez vous connecter pour continuer.
S'authentifier