

1 Introduction
Comprehension of water movement in soils is of primary importance, in particular to understand how the contaminants are transported from the sub-surface, through the soils, to surface water and groundwater reservoirs. This understanding is a key point to help decision makers adjust their choices when managing water-quality problems, especially those related to agricultural pressures. Numerous approach have been studied to assess and quantify preferential flow in soils (for laboratory and field techniques used to evaluate preferential flow in soil, see Ladouche et al., 2001; Viville et al., 2006, and the review by Allaire et al., 2009, and for water flow and tracer transport model applications used at different scales, see the review by Köhne et al., 2009a,b). The use of natural tracers, and in particular δD and δ18O values for the water molecule (Négrel and Petelet-Giraud, 2010), has the main advantage of allowing us to distinguish between old and new water and of permitting fast and high-resolution studies (Allaire et al., 2009). This application is based on the typical winter–summer cyclic H and O isotopic variations of precipitations under continental climate (Gat and Dansgaard, 1972). As this isotopic signal potentially propagates into the upper parts of the soil, the output signal of soil water to these cyclic variations could be used to trace water movements. Stable isotopic compositions (δD and δ18O values for the water molecule) have been successfully used to document preferential flow of soil water in previous studies (Gazis and Feng, 2004; Lindstrom and Rohde, 1992; McGuire et al., 2002; Mueller et al., 2014; Stewart and McDonnell, 1991). Investigations on stable isotopic compositions (δD and δ18O values for the water molecule) of soil water can be proceeded either on water collected within the soil profile or pore waters from sediment cores (i.e. Landon et al., 1999; Stumpp and Hendry, 2012). Only few studies compare the use of stable isotopes tracers depending on soil water sampling techniques, whereas abundant literature has been addressed to these techniques—for devices/methods and flow regime of water and pore water source collected by these methods, see Weihermüller et al. (2007) and Allaire et al. (2009). For example, there are numerous studies that illustrate how soil water samplers bias different water flow paths and flow mechanisms (Giesler et al., 1996; Haines et al., 1982; Hansen and Harris, 1975; Litaor, 1988; Ranger et al., 1993). Furthermore, these studies provide evidence of water residence time and water source in terms of pore structure given that they examine soil solution sampling techniques.
In this study, we propose to compare stable isotopic compositions of soil water monitored by two sampling techniques commonly used in agronomy: ceramic porous cups and drainage. Both techniques tend to collect different water compartments of the soil. Comparing isoproturon concentrations in soil water collected by the two methods in the experimental field “La Justice”, located near Mirecourt (NE France), Perrin-Ganier et al. (1996) demonstrated that the drainage technique collects water moving rapidly through the soil along preferential pathways, whereas porous cups technique samples water infiltrating slowly in the soil profile. To go further in this approach on the experimental field “La Justice”, the objectives of the present study are to discuss these results with a more direct tracer of water (i.e. H and O isotopic composition of the water molecule) and to investigate the possibilities to constrain the residence time of soil water. In this study, we analysed the temporal variations of the H and O isotopic compositions of soil water collected both by porous cups and drainage during two periods: October 2001 to June 2002 and December 2003 to May 2004 in the experimental field “La Justice”. We compare this dataset with the seasonal fluctuation of the H isotopic composition of rainwater sampled on a daily basis between October 2003 and September 2004.
2 Material and methods
2.1 Field description and sampling methods
2.1.1 Experimental field “La Justice”
The experimental field “La Justice” (7.5 ha) located near Mirecourt (NE France), is studied by the “Institut national de la recherche agronomique” (INRA, France). This experimental field is located in an area dominated by agricultural land use at the altitude of 289 m. It is composed of a loamy-clay brown soil whose physicochemical characteristics are described in detail, depending on sampling depth, in Perrin-Ganier et al. (1996). For sampling depths up to 120 cm, the mean physicochemical characteristics are: clay content = 34%, fine silt content = 31%, coarse silt content = 16%, fine sand content = 13%, coarse sand content = 6%, pH = 6.7, C = 0.9%.
The slope of the experimental field does not exceed 3°. Soil water was sampled at 90 cm depth after each rainy period, by two different techniques simultaneously: drainage samplers collecting gravitationally soil water (drainages 1 to 3, Fig. 1) and porous ceramic cup samplers (PCS1, PCS2 and PCS3, Fig. 1). Nevertheless, the synchronism of the sampling techniques could not always be respected. Drainage samplers collect water by gravity and the amount of water sampled is measured by a flow meter and is reported as m3/ha/d. Soil water collected by drain corresponds to the mixing of all the water integrated between two sampling dates. The rhythm of sampling followed the local pluviometry and varied between 3 (sampling the 19/01/04) and 16 days (sampling made on 11/03/04) for the two sampling periods studied. Ceramic porous cups are 90 mm long, 63 mm diameter, and 6 mm thickness extended by a PCV tube. Sampling by porous cups is based on vacuum aspiration of 0.7 bar depression in order to collect 1 l of soil water after 48 h. Thus soil water collected by porous cups corresponds to water integrated during 48 hours after a main rainfall event. Soil water was sampled for two periods, from October 2001 to June 2002 (first sampling period) and from December 2003 to May 2004 (second sampling period). Between June and September, the soil moisture was too low (evapotranspiration rates exceeded infiltration) to enable the sampling of soil water by porous cups and drains. After sampling, soil water was filtered through a 0.20-μm nylon Millipore membrane and stored at 4 °C until isotopic analysis.
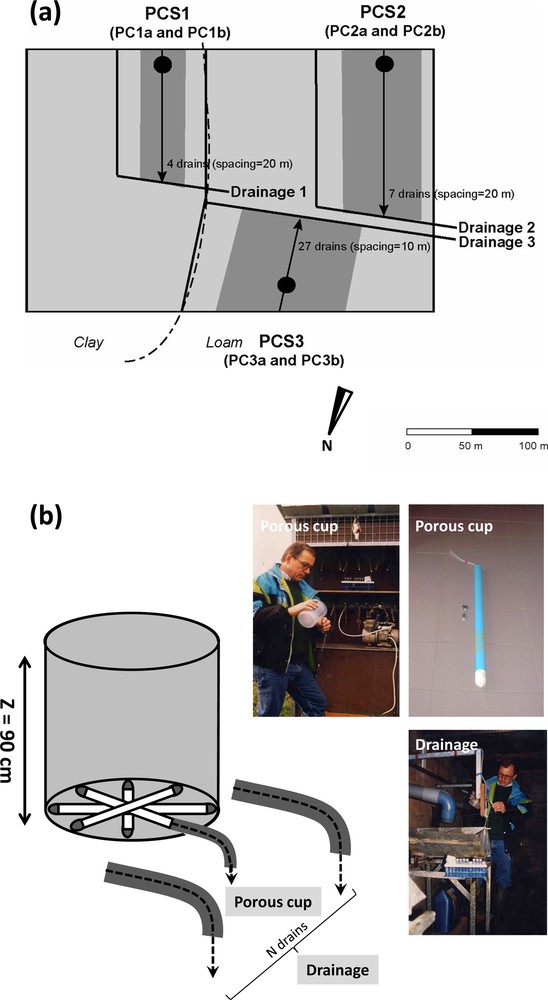
(Colour online.) Sampling sites on the experimental field “La Justice”, map (a) and cross-section (b). Soil water collected by drainage (drainages 1, 2, and 3) and by porous cups (PCS1, PCS2 and PCS3). Areas in dark grey correspond to the different areas submitted to drainage 1, 2 and 3, respectively 0.7, 1.9 and 2.0 ha.
2.1.2 Meteorological weather station
The site is equipped with a meteorological weather station from the “Réseau France Agro-Clim”. It monitors, on a daily basis, the total amount of precipitation (P) and the mean temperature. Potential evapotranspiration (ETPp value) is calculated, on a daily basis, using the Penman method (Penman, 1948). Rainwater was collected every day with a non-evaporative rainfall collector. Thus samples integrate all the rainfall events occurring per day. Rainwater was filtered through a 0.20-μm nylon Millipore membrane and stored at 4 °C until isotopic analysis.
2.2 δD and δ18O analysis
2.2.1 Oxygen
Oxygen isotopic compositions of water were determined using the standard CO2 equilibration method modified from Epstein and Mayeda (1953). One millilitre of water is equilibrated at 700 mbar with a known quantity of CO2 in a 10-ml vial sealed by a silicon-teflon septum. An aliquot of the equilibrated CO2 is purified and analysed for O isotopic composition on a modified VG 602D dual-inlet mass spectrometer.
2.2.2 Deuterium
For H isotopic composition analyses, we used the continuous flow chromium reduction technique described by Morrison et al. (2001). A GV-Isoprime mass spectrometer is coupled with an elemental analyser EA3000, fitted with a liquid autosampler. 0.3 μl of water was injected into a heated septum housing (140 °C) using an automated microliter syringe. The resulting water vapour is flushed by a constant flow of ultra-high purity helium (130 ml/min) via a stainless steel probe extending 15 cm into a quartz chromium reactor tube maintained at 1050 °C. The water injected into the reactor is reduced by Cr, resulting in the quantitative conversion to hydrogen gas. H2 generated in the Cr reactor is carried by a He stream flow through a packed column (1.5 m, 5 Å molecular sieve) in an oven at 60 °C and then into the source of the IRMS. Peaks for H2 at m/z = 2 and HD at m/z = 3 were integrated and corrected for
Isotopic ratios of both oxygen and deuterium are given as per mil (‰) related to reference material V-SMOW (Vienna Standard Mean Ocean Water):
| (1) |
3 Results
3.1 Rainwater
Isotopic data and volumes for individual rainfall events are presented in Table 1. Twenty-six samples were analysed for both δD and δ18O values. On the standard δD vs. δ18O diagram (Fig. 2), all water samples lie globally on a trend closed to the local meteoric water lines (LMWL) described for Châlons-en-Champagne (around 150 km west of Mirecourt) by Dever et al. (1990) (δD = 8.1 × δ18O + 9.5‰) and described for the Strengbach catchment (around 100 km east of Mirecourt) by Ladouche (1997) (δD = 8.3 × δ18O + 11.3‰). Furthermore, the regression line calculated for our data set (δD = 8.1 × δ18O + 5.4‰) displays a slope in agreement with values documented for local meteoric water lines (Dever et al., 1990; Ladouche, 1997). Due to the limited number of δ18O values available (34 values), the calculated “deuterium excess” cannot lead to a better understanding of the air mass origin or of the local seasonal variation in the isotopic composition of precipitation. Nevertheless, our data set suggests that no water has undergone significant isotope fractionation due to evaporative process. Thus in this study, only δD values were interpreted and δ18O values can be subsequently calculated with the LMWL equation line. Monthly weighted averages values were calculated using the formula given by Yurtsever and Gat (1981):
| (2) |
δD and δ18O values in rainwater, precipitation amount and air temperature at Mirecourt between October 2003 and October 2004.
| Sampling date | δD (‰) | δ18O (‰) | Amount of precipitation (mm) | Mean temperature (°C) | Sampling date | δD (‰) | δ18O (‰) | Amount of precipitation (mm) | Temperature (°C) |
| 22/10/03 | −141 | −19.3 | 0.25 | – | 06/05/04 | −68 | – | 3.60 | 8.2 |
| 23/10/03 | −95 | – | 17.90 | – | 31/05/04 | −8 | −1.1 | 1.40 | 15.6 |
| 24/10/03 | −78 | −12.3 | 2.50 | – | 03/06/04 | −53 | −7.2 | 12.40 | 14.0 |
| 25/10/03 | −129 | −18.6 | 4.30 | – | 04/06/04 | −43 | – | 4.50 | 12.9 |
| 26/10/03 | −96 | −14.1 | 13.50 | – | 08/06/04 | −21 | −3.5 | 3.50 | 20.3 |
| 31/10/03 | −108 | −15.1 | 0.60 | – | 11/06/04 | −29 | – | 12.30 | 17.9 |
| 01/11/03 | −78 | −11.3 | 6.90 | 8.0 | 12/06/04 | −42 | – | 11.10 | 14.0 |
| 02/11/03 | −94 | −13.2 | 5.00 | 7.7 | 15/06/04 | −24 | – | 2.00 | 18.7 |
| 03/11/03 | −119 | −16.1 | 24.60 | 10.4 | 23/06/04 | −28 | – | 4.00 | 19.1 |
| 04/11/03 | −53 | −7.9 | 0.35 | 7.5 | 24/06/04 | −40 | – | 2.50 | 15.5 |
| 05/11/03 | −27 | – | 4.30 | 5.8 | 03/07/04 | −13 | −2.5 | 1.30 | 15.1 |
| 06/11/03 | −33 | – | 2.00 | 3.2 | 06/07/04 | −34 | – | 9.70 | 18.6 |
| 12/11/03 | −68 | – | 0.50 | 5.4 | 07/07/04 | −19 | – | 2.40 | 17.5 |
| 15/11/03 | −64 | −10.0 | 7.30 | 6.7 | 09/07/04 | −16 | −2.8 | 15.30 | 14.1 |
| 19/11/03 | −72 | – | 14.40 | 8.0 | 10/07/04 | −16 | – | 4.30 | 13.1 |
| 21/11/03 | −40 | – | 0.90 | 6.2 | 13/07/04 | −48 | – | 4.70 | 12.9 |
| 26/11/03 | −77 | – | 1.90 | 8.3 | 15/07/04 | −40 | – | 5.40 | 18.2 |
| 28/11/03 | −103 | – | 1.00 | 3.8 | 21/07/04 | −21 | – | 20.10 | 20.5 |
| 29/11/03 | −149 | – | 11.60 | 1.1 | 22/07/04 | −44 | – | 5.40 | 22.8 |
| 30/11/03 | −48 | – | 6.60 | 6.7 | 23/07/04 | −26 | – | 1.50 | 20.7 |
| 16/12/03 | −23 | – | 3.00 | 1.1 | 26/07/04 | −35 | – | 17.50 | 15.2 |
| 22/12/03 | −47 | – | 8.70 | 1.1 | 05/08/04 | −20 | – | 1.60 | 21.1 |
| 23/12/03 | −74 | – | 3.40 | 0.0 | 11/08/04 | −23 | – | 8.30 | 20.7 |
| 24/12/03 | −42 | – | 0.50 | −1.5 | 12/08/04 | −40 | – | 10.40 | 16.9 |
| 26/12/03 | −80 | – | 0.50 | 2.4 | 14/08/04 | −47 | – | 8.30 | 16.1 |
| 27/12/03 | −66 | – | 3.50 | 5.4 | 18/08/04 | −33 | – | 17.10 | 20.7 |
| 30/12/03 | −128 | – | 3.80 | 0.1 | 21/08/04 | −32 | – | 34.30 | 13.6 |
| 04/01/04 | −74 | −10.6 | 6.50a | −6.3 | 24/08/04 | −58 | – | 15.70 | 17.9 |
| 11/01/04 | −24 | – | 5.20 | 9.3 | 25/08/04 | −15 | – | 3.50 | 14.4 |
| 12/01/04 | −36 | – | 14.70 | 7.5 | 28/08/04 | −30 | – | 8.70 | 16.2 |
| 14/01/04 | −103 | – | 21.60 | 5.6 | 31/08/04 | −31 | – | 6.10 | 13.5 |
| 15/01/04 | −50 | – | 29.30 | 3.1 | 14/09/04 | −17 | −3.3 | 22.00 | 15.5 |
| 16/01/04 | −79 | – | 8.30 | 4.3 | 16/09/04 | −24 | – | 6.30 | 10.6 |
| 17/01/04 | −51 | – | 1.00 | 3.2 | 22/09/04 | 5 | – | 1.00 | 12.5 |
| 18/01/04 | −109 | – | 16.30 | 1.3 | 25/09/04 | −17 | −3.1 | 6.00 | 10.4 |
| 19/01/04 | −57 | – | 8.70 | −0.9 | 28/09/04 | −24 | – | 1.90 | 14.0 |
| 20/01/04 | −79 | – | 20.40a | 2.8 | 01/10/04 | −12 | – | 0.70 | 14.6 |
| 22/01/04 | −61 | – | 1.70 | −2.1 | 07/10/04 | −34 | – | 9.50 | 11.9 |
| 23/01/04 | −120 | – | 0.25 | −0.2 | 08/10/04 | −37 | – | 6.80 | 10.4 |
| 29/01/04 | −118 | – | 0.25a | −1.3 | 09/10/04 | −33 | – | 3.40 | 10.0 |
| 30/01/04 | −78 | – | 5.00 | −2.2 | 10/10/04 | −46 | – | 29.00 | 9.2 |
| 31/01/04 | −25 | – | 1.00 | 5.8 | 11/10/04 | −48 | – | 8.90 | 9.7 |
| 09/02/04 | −29 | – | 4.00a | 0.4 | 12/10/04 | −50 | −7.8 | 13.80 | 10.2 |
| 11/02/04 | −21 | – | 8.00 | 1.8 | 14/10/04 | −47 | −7.4 | 4.00 | 10.6 |
| 13/02/04 | −19 | – | 3.50 | 3.2 | 15/10/04 | −32 | – | 3.50 | 7.6 |
| 14/02/04 | −61 | – | 2.60 | 3.5 | 16/10/04 | −72 | −11.1 | 6.80 | 6.70 |
| 24/02/04 | −30 | – | 8.60 | −0.6 | 17/10/04 | −59 | −9.4 | 6.30 | 7.70 |
| 26/02/04 | −70 | – | 0.40a | −1.2 | 19/10/04 | −54 | −8.8 | 10.10 | 9.40 |
| 10/03/04 | −48 | −7.1 | 0.50a | −1.4 | 21/10/05 | −46 | – | 4.00 | 15.10 |
| 12/03/04 | −66 | – | 2.90a | 3.4 | 26/10/05 | −46 | – | 7.00 | 16.40 |
| 15/03/04 | −60 | – | 8.00 | 9.6 | 27/10/05 | −72 | – | 2.00 | 15.20 |
| 21/03/04 | −24 | – | 3.90 | 9.1 | 28/10/05 | −71 | – | 8.50 | 17.00 |
| 23/03/04 | −13 | – | 9.30 | 3.8 | 31/10/05 | −88 | – | 27.50 | 16.30 |
| 25/03/04 | −54 | – | 4.90 | 2.5 | 02/11/05 | −77 | – | 1.00 | 9.30 |
| 04/04/04 | −41 | −6.0 | 4.00 | 9.9 | 03/11/05 | −82 | – | 2.00 | 14.90 |
| 06/04/04 | −32 | – | 11.60 | 5.4 | 04/11/05 | −66 | – | 0.50 | 12.70 |
| 07/04/04 | −30 | – | 10.20 | 4.6 | 05/11/05 | −63 | – | 15.50 | 7.90 |
| 08/04/04 | −34 | – | 1.50 | 4.7 | 07/11/05 | −39 | – | 1.00 | 6.00 |
| 20/04/04 | −55 | – | 4.70 | 9.6 | 11/11/05 | −120 | – | 1.00 | 5.30 |
| 22/04/04 | −28 | – | 0.90 | 14.1 | 15/11/05 | −65 | – | 0.50 | 3.90 |
| 01/05/04 | −24 | −3.4 | 0.90 | 10.0 | 19/11/05 | −39 | – | 8.50a | −2.10 |
| 03/05/04 | −59 | – | 2.90 | 12.4 | 22/11/05 | −21 | – | 1.00 | 0.30 |
| 04/05/04 | −44 | – | 1.30 | 11.4 | 29/11/05 | −85 | – | 8.50 | 1.80 |
| 05/05/04 | −28 | – | 2.40 | 8.9 |
a Snow sample.

δD versus δ18O values of rainwater collected at Mirecourt and of soil water collected by drainage and by porous cups on the experimental field “La Justice”. The area in grey corresponds to δD values predicted for samples with initially δD = −52‰ and submitted to evaporation fractionation process (theoretical slopes from Gat and Gonfiantini, 1981).
WA = monthly weighted average
V = volume of rainfall from single event (mm3)
δ = isotopic value for rainwater sampled on a daily basis
δD values for rainwater sampled on a daily basis are quite erratic, varying between −149‰ and 5‰. However, monthly weighted average rainfall data show more organised variations. Spring and summer precipitations are between −40 and −20‰ (the higher values correspond to September 2004 with δD = −18‰), whereas winter precipitations are around −100‰ to −80‰ (the lower value was observed in October 2003 with δD = −95‰). Such a succession is typical of continental climate (Gat and Dansgaard, 1972). The maximum difference observed between the monthly weighted average δD value in winter and in summer is ≈ 75‰. This annual range is comparable to the annual range monitored for rainwater 150 km west of Mirecourt, at Châlons-en-Champagne (≈ 85‰), by Dever et al. (1990) over six years (1982–1988). The annual weighted average value of rainwater is δD = −52‰ (value calculated for precipitation between October 2003 and October 2004). This average value is more depleted than the annual weighted average value calculated over six years at Châlons-en-Champagne (δD = −45‰ for the period 1982–1988). These differences can possibly be attributed to interannual variations for a given station. According to Rozanski et al. (1993), such annual fluctuations can be up to ± 17‰ for δD. Similar inter-annual variations were also observed over 6 years by Dever et al. (1990). Another possible effect is the continentality of Mirecourt, situated about 150 km east of Châlons-en-Champagne.
3.2 Soil water
Data corresponding to soil water are presented in Table 2 for the first sampling period (October 2001 to May 2002) and Table 3 for the second sampling period (December 2003 to April 2004). The theoretical slopes of the “evaporation lines” observed in the literature are between 3 and 6 (Gat and Gonfiantini, 1981). In Fig. 2, the area in grey corresponds to δD values predicted for meteoric water with an initial δD value of −52‰ and submitted to evaporation. Soil water samples collected by the two methods for the first period are distributed along the LMWL (Fig. 2). Thus, soil water collected at 90-cm depth was not significantly affected by the evaporation processes during infiltration, except maybe for the sample collected by porous cups at the location PCS2 on 20 March 2002.
δD and δ18O values of soil water collected by drainage (drainages 1, 2, and 3) and porous cups (PC1a, PC1b, PC2a, PC2b, PC3a and PC3b) during the first period (October 2001 to June 2002).
| Sampling date | Drainage 1 | Drainage 2 | Drainage 3 | PC1a | PC1b | PC2a | PC2b | PC3a | PC3b | ||
| δD (‰) | δ18O (‰) | δD (‰) | δD (‰) | δD (‰) | δD (‰) | δD (‰) | δD (‰) | δ18O (‰) | δ18O (‰) | δD (‰) | |
| 09/10/01 | −39 | −5.5 | −38 | −43 | −48 | −48 | −38 | −42 | −5.6 | −44 | −45 |
| 16/10/01 | −37 | −5.5 | −37 | −41 | – | – | – | – | – | – | – |
| 23/10/01 | – | – | – | – | −46 | −45 | −41 | −39 | −5.9 | −45 | −44 |
| 09/11/01 | – | – | – | – | −48 | −47 | −41 | −42 | – | −42 | −42 |
| 10/11/01 | −35 | – | −35 | −36 | – | – | – | – | – | – | – |
| 13/11/01 | −37 | – | −38 | −40 | – | – | – | – | – | – | – |
| 14/11/01 | −49 | – | −53 | – | – | – | – | – | – | – | – |
| 16/11/01 | −39 | – | – | – | – | – | – | – | – | – | – |
| 17/11/01 | – | – | – | −42 | −47 | −46 | −40 | −40 | −5.5 | −42 | −44 |
| 20/11/01 | – | – | −44 | −43 | −47 | – | −40 | −40 | – | −44 | −45 |
| 22/11/01 | −45 | – | – | – | – | – | – | – | – | – | – |
| 23/11/01 | – | – | – | – | −45 | −46 | −40 | −40 | −5.8 | −43 | −44 |
| 28/11/01 | −36 | – | −37 | −39 | – | – | – | – | – | – | – |
| 01/12/01 | −37 | – | −38 | −39 | – | – | – | – | – | – | – |
| 03/12/01 | −38 | −5.5 | −38 | −38 | −41 | −42 | −39 | −40 | −6.1 | −39 | −41 |
| 06/12/01 | −39 | – | −39 | −41 | – | – | – | – | – | – | – |
| 11/12/01 | −41 | – | −41 | −43 | – | – | – | – | – | – | – |
| 31/12/01 | −50 | −5.9 | −48 | −49 | – | – | – | – | – | – | – |
| 05/01/02 | −48 | – | −45 | −47 | – | – | – | – | – | – | – |
| 22/01/02 | −56 | – | −62 | −54 | – | – | – | – | – | – | – |
| 25/01/02 | – | – | – | – | −45 | −46 | −42 | −44 | −6.1 | −44 | −44 |
| 26/01/02 | −50 | −7.0 | −49 | −46 | – | – | – | – | – | – | – |
| 29/01/02 | −47 | – | −47 | −46 | – | – | – | – | – | – | – |
| 31/01/02 | −48 | – | −46 | −45 | – | – | – | – | – | – | – |
| 05/02/02 | −47 | −6.2 | −45 | −46 | – | – | – | – | – | – | – |
| 11/02/02 | −45 | – | – | −44 | – | – | −40 | −41 | – | −44 | −44 |
| 14/02/02 | −43 | – | −43 | −42 | – | – | – | – | – | – | – |
| 15/02/02 | – | – | – | – | – | – | – | – | – | – | – |
| 19/02/02 | −43 | – | −41 | −42 | – | – | – | – | – | – | – |
| 21/02/02 | −57 | −7.6 | −41 | −52 | – | – | – | – | – | – | – |
| 25/02/02 | – | – | – | – | −45 | −46 | −40 | −42 | −6.3 | −45 | −45 |
| 26/02/02 | −48 | −6.9 | −59 | −46 | – | – | – | – | – | – | – |
| 28/02/02 | −44 | – | −47 | −45 | – | – | – | – | – | – | – |
| 06/03/02 | −46 | – | −42 | −46 | – | – | – | – | – | – | – |
| 09/03/02 | −45 | – | −45 | −46 | – | – | – | – | – | – | – |
| 12/03/02 | – | – | −46 | −46 | −46 | −44 | −41 | −41 | – | −44 | −45 |
| 20/03/02 | −42 | −5.5 | −42 | −43 | – | – | – | – | – | – | – |
| 26/03/02 | −42 | – | −44 | −43 | −45 | −43 | −40 | −41 | −5.9 | −41 | −44 |
| 29/03/02 | – | – | −51 | −43 | – | – | – | – | – | – | – |
| 08/04/02 | – | – | – | – | −46 | −44 | −41 | −41 | – | −43 | −44 |
| 11/04/02 | – | – | – | −51 | – | – | – | – | – | – | – |
| 22/04/02 | – | – | – | – | −47 | −46 | −42 | −42 | −6.2 | −44 | −44 |
| 06/05/02 | – | – | – | – | −46 | −45 | −42 | – | – | −44 | −46 |
| 23/05/02 | – | – | −44 | – | – | – | −36 | −36 | –4.5 | −36 | −39 |
δD of soil water collected by drainage (drainages 1, 2, and 3), precipitation integrated for the time period of sampling by drainage and porous cups (PC1a, PC1b, PC2a, PC2b, PC3a and PC3b) during the second period (December 2003 to May 2004). Precipitation δD integrated for the sampling time period by drainage.
| Sampling date | Drainage 1 | Drainage 2 | Drainage 3 | Precipitation integrated | PC1a | PC1b | PC2a | PC3a | PC3b | |
| δD (‰) | δD (‰) | δD (‰) | Time period (day) | δD (‰) | δD (‰) | δD (‰) | δD (‰) | δD (‰) | δD (‰) | |
| 15/12/03 | – | −49 | – | – | – | – | – | – | – | – |
| 16/12/03 | – | – | – | – | – | – | – | −48 | – | – |
| 29/12/03 | −51 | −60 | −47 | 13 | −58 | – | – | – | – | – |
| 12/01/04 | – | −62 | – | 14 | −54 | −49 | −47 | −48 | – | – |
| 16/01/04 | −62 | −63 | −62 | 4 | −73 | – | – | – | – | – |
| 19/01/04 | −67 | −68 | −66 | 3 | −89 | – | – | – | – | – |
| 26/01/04 | – | −67 | – | 7 | −78 | – | – | – | – | – |
| 27/01/04 | – | – | – | – | – | −50 | −52 | −51 | −52 | −50 |
| 02/02/04 | – | −68 | – | 7 | −71 | – | – | – | – | – |
| 09/02/04 | −61 | −57 | −55 | 7 | −29 | – | – | – | – | – |
| 11/02/04 | – | – | – | – | – | −49 | −51 | −51 | −49 | −49 |
| 16/02/04 | – | −57 | – | 5 | −28 | – | – | – | – | – |
| 24/02/04 | −56 | −55 | −52 | 8 | −30 | – | – | – | – | – |
| 08/03/04 | – | – | – | – | – | – | – | −52 | – | – |
| 11/03/04 | −51 | – | −52 | 16 | −32 | – | – | – | – | – |
| 22/03/04 | – | – | – | – | – | −49 | −50 | −52 | −49 | −50 |
| 16/04/04 | – | – | – | – | – | – | – | – | −50 | −50 |
| 19/04/04 | – | – | – | – | – | −50 | −51 | −52 | −49 | −49 |
3.2.1 Porous cups water
Three sampling locations (PCS1, PCS2 and PCS3, Fig. 1) were investigated for soil water sampled by porous cup. For each sampling location, the results from two porous cups are discussed. Ceramic of porous cups has been proved not to induce any isotopic fractionation during the sampling (Landon et al., 1999). Differences of δD values for water collected by the two porous cups investigated at the same sampling location are not significant (< 1‰) when compared to differences between the average δD values (1–6‰) calculated for the three sampling locations (PCS1, PCS2 and PCS3) during the same period (Tables 2 and 3). Thus, these disparities among the three sampling locations cannot be attributed to the sampling technique only. They may result from spatial variability related to soil texture that possibly induce differences in residence time of water in soils or water contents. Actually, high clay content in soils leads to higher porosity and a relatively low permeability. This low permeability inhibits water movement and tends to stabilize water in the soil. In contrast, loamy soils are more permeable. According to field observations, these disparities of soil texture do exist in the experimental field “La Justice” (Fig. 1). Nevertheless, no clear systematic relationship between δD values and soil texture is demonstrated for the three locations on the experimental field “La Justice” and the differences between the three porous cups sampling locations are not stable year to year.
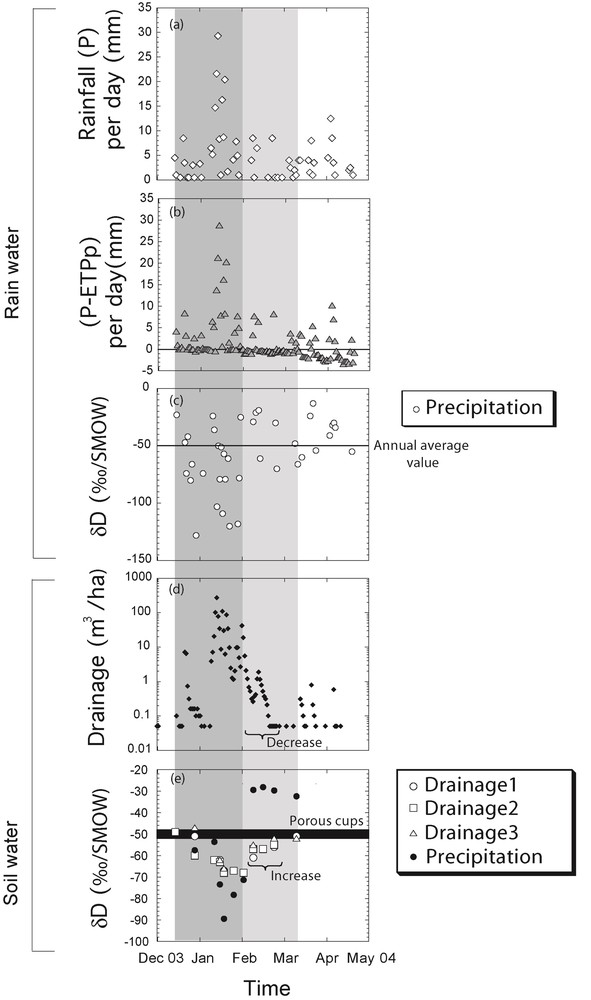
Soil water collected by the porous cups showed little isotopic variation for δD values (Figs. 3b and 4e) over a period of 6 months. For the first sampling period (October 2001 to May 2002, Fig. 3b), soil water samples collected at the three sampling locations did not show any significant variations for δD values (< 10‰, Fig. 3b). Over this sampling period, the mean δD values for each porous cups water were −46‰, −45‰, −40‰, −41‰, −43‰ and −44‰, respectively for PC1a, PC1b, PC2a, PC2b, PC3a and PC3b. During the second sampling period (December 2003 to April 2004), soil water collected by porous cups also showed limited δD variations (< 5‰, Fig. 4e), without any clear systematics. Average values of soil water for the sampling period #B were −49‰, −50‰, −51‰, −50‰, and −50‰, respectively, for PC1a, PC1b, PC2a, PC3a and PC3b. These values are significantly lower (≈ 7‰) than those measured for the first sampling period (October 2001 to May 2002, Fig. 3b). In January 2004 (Fig. 4e), a slight decrease in the δD values is observed. This could suggest that soil water collected by porous-cups partly mixed with mobile water during the time period from mid-December 2003 to mid-March 2004 (in light grey in Fig. 4), during which important drainage by soils took place (Fig. 4c). The 5‰ decrease observed for δD values suggests that at most 25% of the water collected by porous cups is recharged with mobile water during the time period mid-December 2003 to mid-March 2004 (calculations considering δD = −70‰ for rainwater inputs during this time period).

δD variations of soil water collected by drainage technique (a) and by porous cup technique (b) during the sampling period October 2001 to June 2002.

Precipitation amount (P) and Precipitation amount minus potential evapotranspiration calculated using Penman method (P-ETPp) in mm measured per month at Mirecourt (a). δD monthly weighted average values of precipitations sampled at Mirecourt (b). Flow in m3/ha/d drained by drainage 2 (c). δD of soil water collected by drainage (d) and by porous cups during sampling period December 2003 to May 2004 (e). The area in grey corresponds to the period of maximum soil water replenishment (time interval #2). Masquer
Precipitation amount (P) and Precipitation amount minus potential evapotranspiration calculated using Penman method (P-ETPp) in mm measured per month at Mirecourt (a). δD monthly weighted average values of precipitations sampled at Mirecourt (b). Flow in m3/ha/d drained ... Lire la suite
3.2.2 Drainage water
For each sampling location equipped with porous cup samplers, soil water sampled by drainage samplers has been investigated (drainages 1, 2, and 3, Fig. 1). For most of the sampling date, the range for δD values measured for the three sampling locations are lower than 5‰ (Tables 2 and 3). The range for δD values reached up to 16‰ for the samples collected on 21 February 2002 (Table 3). As for porous cup samplers, disparities of δD values observed among the three sampling locations for drainage samplers are expected to be rather related to local disparities on the experimental field “La Justice” than sampling uncertainties.
Compared to porous cups technique, soil water sampled by drainage showed stronger winter–summer cyclic isotopic variations for the two sampling periods studied (Figs. 3a and 4d). The most depleted values are observed in January for the first sampling period (δD = −62‰ for drainage 2, Fig. 3a) and in February for the second sampling period (δD = −68‰ for drainage 2, Fig. 4d). The highest values are measured for water collected in November for the first sampling period (δD = −35‰ for drainage 1 and drainage 2, Fig. 3a) and in December for the second sampling period (δD = −49‰ for drainage 2, Fig. 4d). The range for δD values for soil water collected by drainage is ≈ 25‰, which is significantly lower than the range observed for monthly weighted average δD values for precipitations (≈ 80‰). We calculated the annual weighted averages δD values for soil water collected by drains applying the following formula:
| (3) |
WA = annual weighted average value
F = draining or flux of water evacuated by the drain for the time period of sampling (m3/ha/time)
δ = isotopic value of soil water collected by the drain.
Annual weighted values calculated for the first sampling period are −46‰, −46‰, and −45‰, respectively for drainages 1, 2, and 3. Annual weighted values calculated for the second sampling period are −63‰, −65‰ and −62‰, respectively for drainages 1, 2, and 3. Thus annual weighted values calculated for soil water collected by drainage are globally the same for the three sampling location (drainages 1, 2, and 3, Fig. 1) in the experimental field.
4 Discussion
4.1 Time monitoring
Information about rainwater (precipitation amount P, P-ETPp and δD values) and soil water (draining flow and δD values for water collected by drains and porous cups) was monitored for the same time period, between October 2003 and October 2004 (Tables 1 and 2, Fig. 4). For this data set, three time periods are discussed in Fig. 4. During time period #1, between October 2003 and mid-December 2003 (in white on Fig. 4), even if monthly P-ETPp values (called also efficient precipitation amount) were positive and high (26 to 90 mm), the draining flow of the experimental field “La Justice” was less than 0.1 m3/ha/d, probably because the soil was not saturated and all input of water was absorbed and recharged soil water supplies. The δD values for soil water collected by drainage and porous cups were about the same (−49 and −48‰, respectively). During time period #2, mid-December 2003 to mid-March 2004 (in light grey on Fig. 4), P-ETPp values became really important (up to 150 mm for January 2004) and the draining flow measured increased up to 270 m3/ha/d. The amount of water collected by drains per day was directly correlated with the daily precipitation amount (Fig. 5). The best correlation between the amount of precipitation (in mm per day, which can be converted into m3/ha/d, by multiplying values by 10) with drainage flow (in m3/ha/d) can be obtained for the amount of precipitation water summed for the last five days. This could be due to rapid water movements in the soil system and quick response of drains to the main changes of the precipitation input (amount and δD values). δD values of soil water collected by drainage dropped down to −68‰, whereas porous cup water remains globally unchanged (between −52 and −47‰). During time period #3, between mid-March 2004 and October 2004 (in white on Fig. 4), the volume drained was less than 1 m3/ha/d, which is consistent with the low soil moisture due to negative P-ETPp values. Thus water replenishment in soils is probably limited because water flow collected by drains is negligible and soil water does not integrate direct atmospheric input anymore. After 19 April 2004, soil moisture was too low to allow water sampling.
Precipitation amount (a) and (P-ETPp) values (b) measured per day at Mirecourt. δD values of daily precipitations (c). Flow in m3/ha/d drained by drainage 2 (d). δD of soil water collected by drainage and weighted average δD value of precipitation, integrated for each drainage-sampling period (e). Areas in grey correspond to the period when the soil response delay is immediate (dark grey) and is between two and three weeks (light grey).
In the light of the daily precipitation data acquired, between mid-December 2003 and January 2004 (in dark grey on Fig. 5), precipitations (P) were less than 10 mm and the draining flow was less than 10 m3/ha/d; δD values for precipitations were between −20 and −130‰. δD values for soil water collected by drainage were decreasing (−49 to −60‰ for drainage 2) compared to the latter period. Between January and February 2004 (in dark grey on Fig. 5), the volume drained increased drastically (1 to 1000 m3/ha/d), following the daily precipitation increase (up to 30 mm). Daily δD values for precipitation were between −20 to −120‰, with a weighted average value of −70‰ that likely generated the decrease of δD values for soil water collected by drainage (−62 to −68‰). After February 2004 (in light grey on Fig. 5), δD values for soil water collected by drainage increased (−68 to −51‰), probably as a response to higher δD values of precipitation (−10 to −70‰, with a weighted average value of −40‰) than during the latter period.
4.2 Insight into soil water residence time
According to the two sampling period studied (Figs. 3 and 4), seasonal variations observed for drainage samplers (δD ≈ 25‰) are larger than those observed for porous cup samplers (δD ≈ 5‰) and suggest that the proportion of mobile water collected by drainage technique is more important. δD values for soil water samples from porous cups after the summer (−47 to −49‰) are much higher than monthly weighted average δD values for precipitation of the last three months (−83 to −65‰, from October to December 2003). Thus soil water sampled from porous cups does not integrate significant amount of water from recent precipitation events (occurring less than three months), and should correspond to water already present in the soil matrix during the summer. The first water samples collected by porous cups have δD values rather invariant and imply that there is a permanent stock of water in soils even in summer when sampling by porous cups is not possible. The average δD value of soil water sampled by porous cups, calculated for the three sampling locations in 2003–2004, is −50‰. This value is close to the annual weighted average value calculated for rainwater (−52‰) in 2003–2004, but significantly different from the average δD values of soil water collected by porous cups in 2001–2002 (−45‰). One explanation could be that δD values of permanent stock of water in soil vary year by year, depending on weather conditions. Alternatively this difference could be due to interannual variations of the average value of rainwater for a given station, as discussed before.
The water collected by drainage shows marked seasonal variations, but the range recorded for samples (≈ 25‰) is smaller than the typical range for daily precipitations (≈ 100‰). These results are in good agreement with those of Wenner et al. (1991), who determined that drainwaters, sampled over three months in a clay-loam Piedmont soil, had δ18O values intermediate between rainwater and soil water from porous cups. Thus water sampled by drainage does not correspond directly to new rainwater, but certainly to several precipitation events integrated during a certain time and/or to the mixing between percolating rainfall with water already present in the soil matrix. Considering the later hypothesis, the volume of water already present in the soils should be large enough to buffer the variability of daily precipitation events. Preferential flow paths—cracks, vertical continuous soil pores (Di Pietro et al., 2003)—could possibly promote mixing of rapid rainwater infiltration with water already present in the soil matrix. Thus stable isotope data acquired further support the fact that soil water collected by drainage and porous cup samplers do not have the same signification, as evidenced by other studies using similar soil water sampling techniques (Giesler et al., 1996; Haines et al., 1982; Hansen and Harris, 1975; Litaor, 1988; Ranger et al., 1993).
To go further, based on daily precipitation data (Fig. 5a–c), we calculated the weighted average δD values for precipitation for each sampling period of drains (Fig. 5e). Between mid-December 2003 and February 2004 (Fig. 5), soils reach a kind of saturation level and δD values of soil water from drains vary quickly in response to rainwater variations. During this period, precipitation displays dramatic changes in isotopic composition (see weighted average δD values in Fig. 5e): globally decreasing between 29 December 2003 (−58‰) and 19 January 2004 (−89‰), and then increasing (−78‰ the 26/01/04). In response, soil water collected by drains display variations for δD values in less than three weeks (between 19 January and 9 February 2004) (Fig. 5e). We can hardly give an estimation of the residence time as we have no constrain on the amount of water present in the soil. But we can provide a proportion of the rain which is immediately drained assuming a simplified system with a reservoir of water already present in the soil matrix progressively evolving from −49‰ (15 December 2003) to −68‰ (2 February 2003) from mid-December 2003 to early February 2004 and input of water from precipitation with a weighted average value of −70‰ (calculated for mid-December 2003 to early February 2004). This means that soil water should integrate up to 90% of recent rainwater (less than two months). During the “decrease” of the draining flow (between 9 and 24 February 2004, Fig. 5d), as the isotopic composition of precipitation changed drastically (−71‰ the 02/02/04 to −29‰ the 09/02/04, Fig. 5e), soil water collected by drainage had an isotopic signature (−61 to −52‰, Fig. 5e) lower than those of both new rainwater (−32 to −28‰) and soil water collected by porous cups (−52 to −48‰, Fig. 4e). Thus the amplitude and pattern of δD values observed for soil water collected by drainage can be explained neither by new rainwater nor by water already present in the soil matrix. Thus the residence time is probably more than two weeks (between 9 and 24 February 2004). It is the time necessary for soil water collected by drainage to reach a value compatible with water present in the soil matrix and rainwater contribution. The residence time of soil water collected by drainage appears to be highly variable depending on the time period studied. These variations are certainly a link with the degree of saturation in water of soils. In this study, we considered that all rainwater was flowing in the drains (calculation of weighted average values), but in reality there is probably a preferential percolation of particular rain events, making the residence time of soil water more complicated to estimate. Nevertheless this study gives, at least, a broad idea of the residence times of soil water collected by drainage samplers. It is difficult to compare the residence time of soil water observed in this study to those documented in the literature. Firstly because soil water is sampled with different techniques (drainage or porous cups) and, as previously discussed, soil waters collected are not equivalent. Furthermore, because the residence time of water in soils depends on the sampling depth and on the specificity of each watershed studied (nature of the soil, mean slope, land-use), the residence times estimated in this study for loamy-clay soil in an agricultural area are nevertheless in the range of those documented in the literature, i.e. 12 days to 9.5 months (DeWalle et al., 1997; Lindstrom and Rohde, 1992; McGuire et al., 2002; Stewart and McDonnell, 1991).
5 Conclusion
δD values of daily precipitation were monitored during one year (October 2003 to October 2004) and displayed typical winter–summer cyclic compositional isotopic variations. A discussion on the propagation of this isotopic signal into upper parts of the soil zone clearly demonstrates that soil water samples collected by the two sampling techniques studied (porous cups and drainage) are not equivalent. According to the stable isotope data acquired, soil water samples collected by drainage correspond mainly to quick infiltration along preferential flow paths (short residence times), whereas soil water samples collected by porous cups correspond to longer residence time. This study highlights the difficulties to document the residence time of soil water, at least quantitatively. Nevertheless, stable isotopic tools can give a broad estimate of soil water residence time. Thus stable isotope characterization could be useful to provide additional information to “classical” soil water monitoring. This could be of particular interest to follow the mobilisation of solutes accumulated in the unsaturated zone during precipitations events. Understanding these processes is crucial for environmental studies, especially for studies that evaluate the effectiveness of agricultural pressure reduction programs to preserve/restore the chemical status of natural water ecosystems.
Acknowledgements
We greatly thank the analytical assistance of C. Guilmette. We thank D. Foissy (INRA) for collecting river water near Mirecourt during nearly one year. We particularly thank Louis Echampard (INRA) for meteorological data collecting and daily rainwater sampling, Lionel Caudy (INRA) and Gilles Rouyer (INRA) for soil water sampling, Damien Foissy (INRA) for data base management, Claude Bazard (INRA) for cropping system data base management. This research was supported by a PhD-engineer grant (BDI) from the Région Lorraine and the “Centre national de la recherche scientifique” (CNRS). This study is part of a multidisciplinary research program on the Moselle River (ZAM).