

1 Introduction
Soil constitutes an important reservoir of organic carbon in the biosphere. The atmospheric C compartment is estimated at 750 Gt, which is considerably lower than the soil C compartment. The latter is estimated, at a depth of 1 m, to 2500 Gt (Lal, 2004), of which 62% (1550 Gt) is organic (SOC) and 38% (950 Gt) is inorganic (SIC). In the top 30 cm, it is estimated at about 684 to 724 GtC (Powlson et al., 2011). In terms of land management, soil organic carbon (SOC) dynamics raise two major issues: one is a global – climate change and changes in land use and their effect on greenhouse gases (Gitz and Ciais, 2003) – and the other is local and relates to soil fertility strictly associated with food security. Globally, the challenge is to maintain or even increase the amount of carbon stored in soil and vegetation (Robert and Saugier, 2003). Indeed, element stock in soils, including carbon (C), are constantly changing with the effect of a range of natural and anthropogenic factors such as climate, hydrology, geology, vegetation, biological activity, local impacts of land use, and changes in agriculture or silviculture (Brossard and López-Hernández, 2005; Follain et al., 2007). Considering all of these factors is generally impossible. Redistribution of elements such as carbon brought about by these processes has a significant impact on soil C stocks by changing their distribution locally. In the literature, different estimates of decrease in soil organic C stocks have been reported, resulting from cultivation of natural agroecosystems (either grassland or natural vegetation) in a wide range of climatic conditions and different years following land use conversion (Fujisaki et al., 2015). For example, according to Martinez-Mena et al. (2008), carbon stocks in agricultural soils can fall by 30 to 50% of their initial level after 50 to 100 years of cultivation, while Manlay et al. (2004) reported a decrease of 50% after 15 years of cultivation in the West African savannah ecosystem. The annual net loss coefficient under rainfed cultivation compared to the initial ecosystem is around 4.7% in sandy soils and 2% in clay soils (Pieri, 1989; Serpantié et al., 2004). The available data suggest that C in continuously cultivated topsoil is more sensitive to land use change.
In dry tropical environments, soils have low C contents (Jones et al., 2013) due to limited availability of water, which restricts plant productivity, which in turn is the main source of SOC. From long-term data on tillage and cropping system experiments in Chad, Pieri (1989) reported SOC annual losses of 1.2 and 0.5 gC·kg−1·yr−1 with cereal cropping and 2 and 4 years of fallow. The extreme semiarid climatic conditions make this ecosystem fragile, and therefore soils are particularly prone to degradation during the implementation of more intensive land management practices, overgrazing and frequent fires. In the semiarid Sahelian region, the dynamics of SOC and water are keys to sustainable land management aimed at maintaining fertility, stability and soil productivity (Pieri, 1989). Soils have low organic C contents, 4.3 g·kg−1 in 0–40 cm (Manlay, 2000) and stocks to 1 m deep represent 20 to 30 MgC·ha−1 (Jones et al., 2013), part of which, a few MgC·ha−1, are lost annually. However, on a local scale, C stocks are poorly known, despite the various issues they represent in terms of maintaining soil properties, food security, greenhouse gas emissions, and decision support.
Agriculture in the northeast Lake Chad landscape is developed on polders created on marshland initially developed in inter-dunes. These polders are an ancient arm of Lake Chad, resulting from the regression of lake waters due to the climate variability that prevailed during the Holocene and the recent decades in the Sahel region (Schuster et al., 2009). Hydro-agricultural schemes have been put in place to keep agriculture safe from floods and to store and distribute irrigation water. Taking into account climate variability, they represent an interesting agro-economic alternative for Sahelian farmers, allowing them to develop food security or secure annual revenues. In this context, soils are subject to intensive exploitation of three harvests per year, the rotation is based on cereal (maize/wheat) and market gardening (fenugreek/bean/tomatoes). There are different levels of intensification and practices that could be achieved in rainfed agriculture; irrigated agriculture during the dry season and all technical strategies must be included in a hydro-agricultural project adapted to the needs and capabilities of local societies. This agricultural intensification constitutes one of the possible answers to farmers’ adaptation to climate variability in the region. For over 60 years, polders were subject to intensive exploitation without organic stock management, organic input or any other technical concern for their conservation. According to previous observations (Pias and Guichard, 1960; Pias and Sabatier, 1965), after more than ten years of intensive cultivation (three harvests per year, crop residues being exported out of the polder), the organic matter content decreased from 100–130 to 60–70 g·kg−1 in the surface horizon (0–0.2 m); those losses represent an annual loss coefficient of organic matter content equivalent to those observed in sandy soils (4.7%·y−1) and clayey soils (2%·y−1) (Pieri, 1989; Serpantié et al., 2004).
In semiarid regions, lowland soils are strategic for agriculture providing food security. One question is to know if the SOC changed during time, as the system is based on irrigation on Fluvisols. The present study aims for the first time to estimate soil C stocks in these polders. The approach emphasizes an inventory of one polder's chronosequence (synchronic approach). In this study, we aim to assess the SOC stocks in polders over a period of 65 years of cultivation and to compare them to a reference marsh soil.
2 Materials and methods
2.1 Study area
Lake Chad is an endorheic basin partitioned in two sub-basins. The study is located in its southern part, which is the actual hydrologic basin of the lake and receives water from the perennial Chari and Logone rivers (Olivry et al., 1996). The studied area is located on the northeastern shore of Lake Chad in the Bol area, northwest of the Sahelian zone of Chad between 12° 20′ and 14° 20′ north latitude and 13° and 15° 20′ east longitude (supplementary data, Fig. S1). The inter-dune depressions are occupied by a Holocene, 10- to 15-m-thick, lacustrine deposit (Labdé series) (Dieleman and De Ridder, 1963; Pias, 1970; Schuster et al., 2009). The nature of the sediments is variable, but in general the texture is clayey to silty–clayey; the sequence from the base to the top is formed by a grey–green clay–silt deposit, more than 3 m in thickness; a 3-m-thick grey to grey–blue clay layer, a 1- to 4-m-thick clayey deposit, whose clays present a polyhedral structure, with carbonate accumulation in the upper part of the deposit; the later deposits are comprised of a sequence of clays and organic matter-enriched clays in the upper last meter, with variable silt contents.
The climate is classified as semiarid to arid Sahelian (BSh, hot steppe, Köppen-Geiger climate classification, Peel et al., 2007) characterized by the alternation of a long dry season and one short rainy season concentrated in three months, from July to September. The average annual temperature is high, 28 °C, mean annual precipitation is between 550 and 200 mm. Potential evapotranspiration (PET) is 2284 mm·yr−1 (average for period 1960–1977), so the P/PET ratio is between 0.09 and 0.2, and characterizes this arid environment sensitive to climatic hazards. This PET was measured on a polder by the Thornthwaite device (Olivry et al., 1996).
Five soil sites were selected for this study depending on their age after “polderisation”:
- • a marsh on recent sediments (t0) on an adjacent part of the t10 polder to determine the soil C as a reference;
- • a 10-year-old polder (t10);
- • a 60-year-old polder (t60);
- • a 62-year-old polder (t62);
- • a 65-year-old polder (t65).
The sampling temporal discontinuity from 10 to 60 years is due to a long period with no new formation of polder surfaces. The choice of the polders was made during a field survey. Non-polderised areas (t0) are covered with Phragmites sp., Typha australis, Cyperus papyrus, Polygonum sp. vegetation. In polder borders, as well as in abandoned crops fields, a scattered shrub vegetation of balanites and acacias is being established. After shoreline exposure, the initial lacustrine sediment was marked by a surface-drying process. Hydromorphy was marked at depth (permanent water table), and sometimes, when drainage conditions and irrigation were unfavourable, soils presented sodic, saline efflorescence, and saline to alkaline features (Cheverry, 1966; Droubi et al., 1976). These are “immature”, slightly developed, alluvial and hydromorphic soils [Commission de Pédologie et Cartographie des Sols (CPCS), 1967]. They are classified as Fluvisol and Gleysol according to WRB (FAO, 2006) or Fluviosol and Salisol according to the French Pedological Referential [Association française pour l’étude du sol (AFES), 2008]. The polders studied are subject to the same monoculture of cereals (maize, wheat) and gardening (tomato, onion, bean, and fenugreek). The main inter-dune topographic profile is simple, with a gentle slope of 1–2%. Heterogeneity in soil surface properties can arise mainly from the time of cultivation of each polder and the pedoclimatic context, which accelerates this process.
The characteristics of the studied soil profiles are shown in supplementary data, Table S1. In order to compare the sampled sites and to save time, the synchronous method (Marco et al., 2010) has been adopted; polder ages can be considered as representative of a succession of polderisations over time on the same plot; it seems that these polders have the same climatic characteristics and a similar soil type, and have experienced the same management over time.
2.2 Soil sampling
Soil sampling was carried out according to a chronosequence of the polder's age. Samples were taken with an auger by increments of 10 cm to 1 m in depth; composite samples of each soil horizon (0–0.1, 0.1–0.2…, 0.9–1.0 m) of each soil profile were prepared. Each composite sample was obtained from five to seven random repetitions, depending on the situation and local constraint on sampling (flooding irrigation), over a radius of 20 m2: t0 in three soil profiles; t10 in two toposequences with 16 soil profiles; t60 in four soil profiles; t62 in four soil profiles; and t65 in 10 soil profiles in two toposequences. The same measurements as for bulk density (BD) were performed on these layers with two replicates. Undisturbed samples for BD were measured using a cylinder of 498.9 cm3; their weight was taken in situ, and water contents were determined in a sub-sample in the laboratory; when the upper layers (0–0.5 m) were too dry to use the cylinder method, BD was measured using the volumetric method (derived from the sand method); after excavation (10 × 10 × 10 cm at minimum), the hole volume is measured with water in a polyethylene bag, the mass of excavated soil was measured and a sub-sample was taken for water content determination (105 °C). The objective was the SOC stock measures and comparisons related to soil constitution; water content was expressed in reference to the soil mass after dehydration at 105 °C, so in reference to a constant quantity of soil solid phase. Initially, we expected an impact of clay content on bulk density, but there was no relation (result not presented).
In total, 36 soils profiles were taken. Each of them was morphologically described in situ and supplemented in the laboratory (supplementary data, Table S1). Samples were taken at the beginning of the dry season, after rainy season crop production.
2.3 Physical and chemical analysis
Physicochemical analyses were carried out on air-dried and sieved samples (2 mm). The following analyses were carried out: particle size determination, pH determination using the electrometric method (NF ISO 10390), electrical conductivity (NF ISO 11625), exchangeable base cations and cation exchange capacity. Carbon and nitrogen were determined on fine ground sub-samples.
Particle size fractions were obtained after removal of organic matter with hydrogen peroxide (H2O2) and dispersion in sodium pyrophosphate (Na4P2O7) and sedimentation (Stokes law method with the Robinson pipette) (Pétard, 1993). The total carbonate content (CaCO3) represents soil inorganic carbon (SIC) and was determined by the volume of gas released by a known test sample from the reaction of hydrochloric acid carried out using a calcimeter Bernard (ISO 10693, 1998). SOC was calculated by the difference between total C and SIC:
| (1) |
Total carbon and nitrogen concentrations were determined by dry oxidation on a Fisons EA 1108 CHN device with pure helium gas at 870 °C as a carrier (ISO 10694, 1995; ISO 13878, 1998).
Soil pH and electrical conductivity (EC) at 25 °C were determined using a soil suspension with a soil/water ratio of 1:2.5.
The values of cation exchange capacity and of the extraction of the exchangeable base cations were determined at the soil's pH by exchange with a solution of hexamine cobalt [Co(NH3)6]Cl3 (Ciesielski et al., 1997; Orsini and Remy, 1976).
2.4 Estimation of soil carbon stocks
BD values and C contents were used to calculate C stocks, the soils do not contain coarse elements. Soil carbon stocks for a fixed depth (Sfixe dep) are the amount of C in a determined layer of soil per surface unit expressed in megagrams per hectare (MgC·ha−1). They were calculated according to the conventional method by volume layers (0–0.1, 0.1–0.2, 0.2–0.3…, 0.9–1.0 m) as being the product of the C concentration (g·kg−1), BD (Mg·m−3) and the thickness of the layer e (cm), using the following formula:
| (2) |
That method of calculation may bias interpretations when BD variations resulting from effects of tillage or clay comportment are significant. The corrected stock, not to a volume of soil, but for the equivalent soil mass (equivalent mass) (Chapuis Lardy et al., 2002; Ellert and Bettany, 1995; Ellert et al., 2007; Poeplau et al., 2011) is defined as follows:
- • the cumulated equivalent soil mass Msoil (MgC·ha−1) depends on the BD and the thickness (e) of the corresponding layer according to the following equation
| (3) |
In all sampled polders, land use time varies from one polder to another. The t0 lowest cumulated equivalent soil mass for a given depth was selected as a reference mass (Mt0);
- • the soil mass excess (Msoil − Mt0) was calculated for all polders (t10, t60, t62 and t65), and corrected SOC stocks (Scorr) based on constant soil mass (Mt0) versus equivalent depths are determined for each site using the following equation:
| (4) |
Finally, relative changes in SOC stock due to time were calculated by the difference between the stock of soils t10, t60, t62 and t65 and the stock of the reference t0, and then expressed as a percentage of the t0 stock reference:
| (5) |
The annual variation rate was calculated by dividing the difference between the sites stocks t10, t60, t62 and t65 and SOC stock at time t0 by the time since last cultivation (tn).
| (6) |
2.5 Processing and analysis of the data
Statistical analyses were carried out using RStudio® 3.2.0 software© (2015). Analyses of carbon stock data in polders with different cultivation ages, mainly from the 0–0.3 m layer to the 0–1 m layer, were used to investigate their vertical and spatial variability. A variance analysis (ANOVA one way, package “Agricolae”) was used to compare the mean carbon stocks between the time and the uncultivated site. Multiple comparisons of significantly different means obtained by ANOVA were tested with Tukey HSD to determine the significant differences. Box plots were used to illustrate the variability of stocks between polders, and bar charts were used for descriptive statistics, mainly medium and standard errors. A regression analysis was carried out to investigate the relationship between some physicochemical parameters and SOC stocks.
3 Results
3.1 Main morphological and physicochemical characteristics of soil sites studied
3.1.1 Morphological characteristics
The main soil characteristics are reported in supplementary data, Table S1. Soils are clayey–silty in the upper part and clayey in deeper horizons. In some places, we observed organic material, clayey–peaty horizons, where organic matter was not as well decomposed. Their colour varies from dark grey (2.5Y 3/1 or 4/1 2.5Y) to grey (2.5Y 3/1), respectively. The presence of a shallow water table was noted, ranging from 0.3 to 0.7 m in depth. Soils were marked either by hydromorphy or sometimes by salt features on the surface (t65). The surface structure was polyhedral subangular, moderately developed with shrinkage cracks, and sometimes massive. Coarse materials are negligible or absent.
3.1.2 Physicochemical characteristics
As far as pH is concerned, the site t0 changed from net alkaline condition, pH values of 7.7–8.1 in the surface layers to 0.2 m in depth, while in t10, the soil had a slightly alkaline pH of 6.9 ± 0.23 in the 0–0.1 m layer and 5.9 ± 0.33 to 6.2 ± 0.38 at all depths. Other soils, t60, t62 and t65 had an alkaline pH value.
The electrical conductivity (EC) reflects a low level of salinity, from 0.2 to 1.2 ± 0.33 dS·m−1 in t0, t10 and t62, and an average degree of 2.3 ± 1.00 to 3.5 ± 1.07 dS·m−1 in t60 and t65.
Soil organic carbon (SOC) contents were variable in the soils; their gradient decreased with depth, except for t0, where there was a SOC accumulation at greater depths, representing the peat·horizons. This heterogeneity explains two sedimentation phases as identified by clay contents. The highest rate of SOC was an average of 31.78 ± 1.6 g·kg−1 in t10 for the first 0.3 m of soil. The SIC contents varied in the profiles and showed a high content of 15.39 ± 3.25 to 11.40 ± 5.93 g·kg−1 in the layer at 0–0.4 m in t65. In all other polders, the SIC contents were low and were always less than 10% of total C. The C/N ratios were comprised between 10 ± 1.29 and 12 ± 1.84, suggesting the presence of reactive and readily biodegradable OM.
CEC and the sum of exchangeable base cations (S) were higher in surface horizons (supplementary data, Table S1). In t0, t10 and t65, respectively, the values were 70.3, 48.9 ± 4.2, and 47.2 ± 3.3 cmol(+) kg−1 as well as 74.4, 77.8 ± 2.3, and 102 ± 10.3 cmol(+) kg−1. The CEC in t62 followed the same trend and conversely in t60 with a high CEC, ± 72 cmol(+) kg−1, in depth. However, in t60 and t62, S decreased non-significantly with depth, with no significant differences. The soils are dominated by exchangeable calcium and exchangeable sodium, and magnesium presented similar contents; exchangeable potassium levels remained low in all analysed horizons compared to the other base cations.
3.1.3 Soil bulk densities
The mean BD of all soils was 0.88 ± 0.01 Mg·m−3. Bulk densities in t0 marsh were lower than t10, t60, t62 and t65 (Table 1), although this difference was not significant in some horizons. Our ANOVA results showed that the mean BD was not significantly different according to the polder's age: 0.81 ± 0.10 to 0.90 ± 0.09 Mg·m−3 and 0.84 ± 0.09 to 0.98 ± 0.14 in t10 and t65, against 0.61 ± 0.01 to 0.84 ± 0.03 Mg·m−3 in t0. However, there was a significant trend between t0 and t60. This could be explained either by the effect of ploughing ready for crops, maturation (i.e. loss of water, structure formation) of the sediment, or transformation in the soil layer and their combined effects.
Soils bulk density (Mg·m−3) in different polders (mean ± standard error), tx (polder age), n (number of sampled soil profiles).
| Layer (m) |
(t0) (n = 3) |
Mamdi (t10) (n = 16) |
Bérim (t60) (n = 4) |
Tchingam (t62) (n = 3) |
Guini (t65) (n = 10) |
| 0–0.1 | 0.84 ± 03a | 0.87 ± 0.12a | 0.90 ± 0.05a,b | 1.09 ± 0.11b | 0.87 ± 0.10a |
| 0.1–0.2 | 0.82 ± 0.05a | 0.86 ± 0.14a | 1.01 ± 0.08a | 0.98 ± 0.04a | 0.96 ± 0.12a |
| 0.2–0.3 | 0.79 ± 0.11a | 0.90 ± 0.09a,b | 1.05 ± 0.05b | 0.82 ± 0.00a | 0.98 ± 0.14a,b |
| 0.3–0.4 | 0.78 ± 0.03a | 0.88 ± 0.11a | 1.07 ± 0.15b | 0.82 ± 0.05a | 0.94 ± 0.14a,b |
| 0.4–0.5 | 0.72 ± 0.12a | 0.93 ± 0.12a,b | 1.07 ± 0.17b | 0.78 ± 0.03a,b | 0.93 ± 0.10a,b |
| 0.5–0.6 | 0.68 ± 0.13a | 0.85 ± 0.11a,b | 0.95 ± 0.11b | 0.86 ± 0.03a,b | 0.87 ± 0.11a,b |
| 0.6–0.7 | 0.68 ± 0.12a | 0.82 ± 0.12a | 1.07 ± 0.17b | 0.81 ± 0.00a | 0.84 ± 0.09a |
| 0.7–0.8 | 0.69 ± 0.07a | 0.89 ± 0.10b | 0.95 ± 0.10b | 0.83 ± 0.00a,b | 0.91 ± 0.05b |
| 0.8–0.9 | 0.62 ± 0.02a | 0.85 ± 0.11a,b | 1.07 ± 0.15c | 0.91 ± 0.06a,c | 0.90 ± 0.17b,c |
| 0.9–1.0 | 0.61 ± 0.01a | 0.81 ± 0.10a,c | 1.03 ± 0.07b | 0.81 ± 0.00a,b | 0.87 ± 0.17b,c |
3.2 Vertical and lateral variability of organic and inorganic soil carbon stocks
The results show that the distribution of SOC and SIC stocks varied both within the same soil profile and in terms of different age polders (Fig. 1). The stock rates of SOC were high in the first 0.3 m and gradually decreased with depth. As far as the amount of SIC stocks is concerned, we did not observe any significant vertical variability within soil profiles t0, t10 and t60, as well as any spatial variability where SIC stocks are negligible and represent less than 0.5% of SOC stocks (Fig. 2). In contrast, in t62 and t65 SIC stocks represented around 5% of SOC stocks, in which there was a significant difference between the SIC stocks in surface horizons (0–0.3 m) and deeper horizons. The vertical and spatial variability of SIC stock presented a trend that was increasingly accentuated in the older polders, particularly in the surface horizons of t62 and t65.
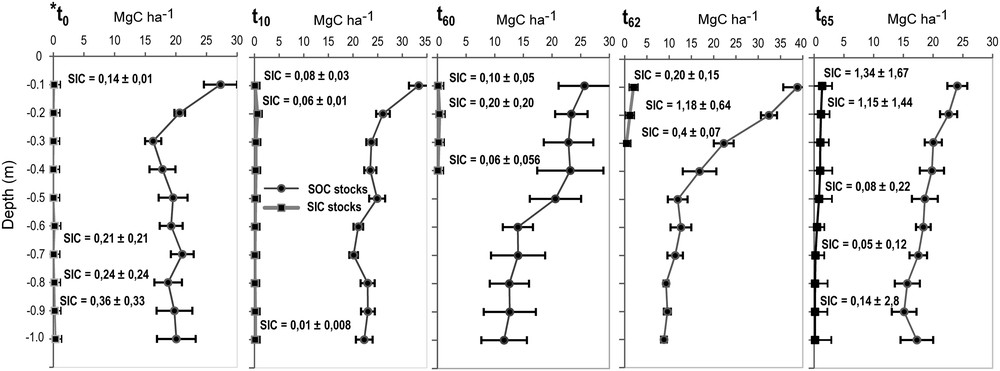
Average soil organic carbon (SOC) and soil inorganic carbon (SIC) stocks followed by the standard error in soil profiles (0–1 m) from the studied polders. *t0 (reference, marsh). t10, t60, t62 and t65 (polder age).
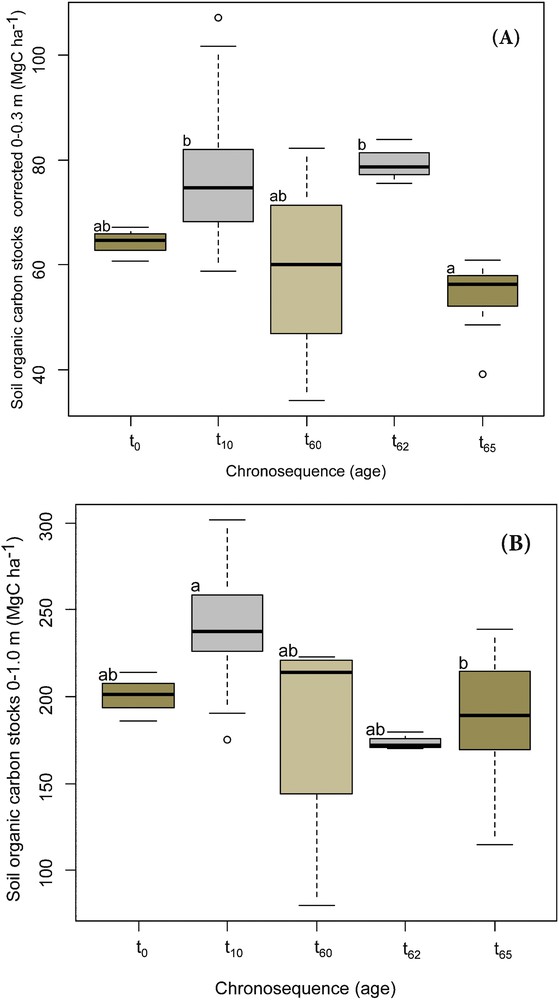
Box plots of changes in corrected soil organic carbon (SOC) stock layers 0–0.3 m (A) and 0–1 m (B) in the polders according to the chronosequence. Between the five sites, there are significant differences, indicated by letters a, b (P < 0.05, ANOVA).
3.3 Organic and inorganic soil carbon stocks
The SOC stocks were corrected (Scorr) for 2450 Mg·ha−1 (0–0.3 m) of equivalent soil mass (Figs. 1 and 2). The Scorr of the “young” polder (t10) were significantly (P < 0.05) higher than those of “old” polders (t65). There was no significant difference between Scorr in t0, t60 and t62, and between t0 and t10. In t0, t60 and t65, the Scorr varied around a mean value of 54–64 MgC·ha−1, whereas t62 presented a higher Scorr (79 MgC·ha−1) than others.
This trend was not observed for SOC stocks in the 0–1 m layer (Fig. 2) where the stocks in t10 (241 MgC·ha−1) were significantly (P < 0.05) higher than in t65 (189 MgC·ha−1). However, they were not different to others; t0, t60, and t62, at a threshold of 0.05, which means that stocks varied from 174 to 200 MgC·ha−1. We also noted that cumulated SOC stocks in the 0–1 m layer were higher than those in the 0–0.3 m layer.
3.4 Relationship between the SOC stock and soil properties
The regression results (Table 2) between the SOC stock and the physicochemical soil properties showed significant relationships with some parameters. In the top layers (0–0.3 m), SOC stock relationships with clay + fine silt, CEC and pH and EC were highly significant (P < 0.0001) with correlation coefficients ranging from 0.54 for SOCs vs. clay + fine silt, to 0.7 for the SOCs vs. CEC.
Relationship between the SOC stock and soil properties in 0–0.3 m and 0.3–1.0 m layers.
| Variables | Layer 0–0.3 m | R 2 | P | n |
| Clay + fine silt (g·kgsoil−1) | 0.54 | 0.0039 | 13 | |
| CEC (Cmol+·kg−1) | 0.7 | 0.000*** | 31 | |
| pH (H2O) | 0.68 | 0.000*** | 96 | |
| EC (dS·m−1) | 0.61 | 0.000*** | 96 | |
| Variables | Layer 0.3–1.0 m | R 2 | P | n |
| Clay + fine silt (g·kgsoil−1) | 0.14 | 0.15 | 16 | |
| CEC (Cmol+·kg−1) | 0.6 | 0.0081 | 10 | |
| pH (H2O) | 0.77 | 0.000*** | 221 | |
| EC (dS·m−1) | 0.75 | 0.000*** | 221 |
However, in deep horizons, especially, the 0.3–1.0 m layer, clay + fine silt·had a limited effect on SOC stock with a correlation coefficient R2 = 0.14, P = 0.15. CEC, pH and EC had the same effects as in the 0–0.3 m layer. No significant correlation with exchangeable calcium was noted, although there was a positive correlation with exchangeable sodium. These statistical results show that outside of pedoclimatic factors, carbon accumulation in these lowland soils could be influenced by their physicochemical properties.
4 Discussion
Stock variability seems to be a bit disorganized considering the polders’ age (Fig. 2). This could be explained by the hydric regime of fluctuating waterlogging level from 0.3 to 0.7 m maintaining an anoxic environment below this depth, limiting the action of microflora, as revealed by the presence of peat and/or clayey–peaty horizons. So, below the deepest part of the water table's influence, we can consider that carbon stocks can be explained by inherited organic matter (Table 1). Cheverry et al. (1972) detailed the organic matter/clay relationships in these soils. They showed that the youngest organic sedimentation produced clayey–peaty horizons. Organic matter, based on the study of thin sections, was inherited from the sedimentation of vegetal residues provided by lacustrine floating vegetation, as observed in the central part of the lake.
Part of the variability could be due to the BD methods employed. In fact, for the 0–0.3 m layer, on which the evapotranspiration phenomenon is intense, the same method was employed (“water” volumetric method), and stocks were compared taking into account the mass of soil solid phase as invariant (using the values of the water content of samples dehydrated at 105 °C). There was no relation between the mass content of the clay fraction and the bulk density (result not presented).
SIC stocks are negligible and vary significantly (P = 0.03) from 1 for t0 to 6 MgC·ha−1 for t65. The highest inorganic stocks correspond to the oldest polder (Fig. 2). The low rate of inorganic stocks could be attributed to the mass accumulation rate of CaCO3. Einsele et al. (2001) found a 20 g·m−2 yr−1 rate of CaCO3 accumulation in sediments rich in clay in the northern region of Lake Chad. The vertical and spatial variability of SIC stocks can be explained if we assume a localised evaporation of a concentrated soil solution containing dissolved salts. Such solutions come from the capillary rise of the water table or, in some areas, from irrigation water. These effects are not exclusive, and we have to consider them simultaneously with irrigation dynamics determined by cultivation choices. Further investigation is needed at the polder's level in order to understand the dynamics of variability.
In the semiarid and arid Sahelian context, the conversion of alluvial lowlands into cultivated polders caused both vertical and lateral variability of SOC and SICS stocks. The literature on this subject is poorly documented and it is difficult to make comparisons with similar African environments. We have compiled existing data for similar soils (Table 3). All Gleysols present lower SOC stock values compared to the polders in this study and the estimation carried out using Cheverry's data (Cheverry, 1974; Cheverry and Fromaget, 1970). Thionic Fluvisols can present elevated values, but these are inherited from previous mangrove ecosystems. So, the studied polders present the highest concentrations of soil carbon observed in continental conditions. Another comparison could be made with Andosols from the eastern part of the continent, where locally they could present elevated stocks (± 150 MgC·ha−1) (Jones et al., 2013).
Organic carbon stocks (MgC·ha−2) in African alluvial soils from Senegal, Cameroon and Chad polders.
| Soil unit | Location | Soil occupation/land use | SOC (MgC·ha−2) | Country | |
| 0–0.3 (m) |
0–1.0 (m) |
||||
| Gleyic Cambisol | Kamobeul-Bolog | Rice | 28 | 34 | Senegal |
| Dystric Gleysol | Mobeul area | Rice | 36 | 65 | |
| Dystric Gleysol | Oussoye-Nianbalan | Grass fallow, formerly under rice | 19 | 34 | |
| Dystric Fluvisol | SW of Oussoye | Rice; short grassland | 142 | 301 | |
| Thionic Fluvisol | SW of Oussoye | Rice (old mangrove area) | 18 | 52 | |
| Thionic Fluvisol | SW of Oussoye | Formerly under rice | 45 | 194 | |
| Thionic Fluvisol | E of Nianbalan | Not used/managed | 7 | 22 | |
| Thionic Fluvisol | Niassa valley, NE of Bafikane | Rice and Eleocharis spp. | 26 | 62 | |
| Thionic Fluvisol | Medina Exp. Polder | Hydromorphic vegetation | 80 | 268 | |
| Thionic Fluvisol | Niassa valley, N of Bafikane | Young mangrove | 137 | 257 | |
| Thionic Fluvisol | Kamobeul area | Bare with some mangrove spp. | 102 | 262 | |
| Gleyic Cambisol | Guinea savanna | Under cultivation | 19.14 | aCameroon | |
| Dystric Fluvisol | W of Cameroon, Bamenda | Under cultivation | 39.6 | ||
| Dystric Fluvisol | NW of Cameroon, Nigerian border | Under cultivation | 33.99 | ||
| Gleysol | NE of Lake Chad, Polder | Wheat, maize | 238 | 471.5 | bChad |
| Gleysol | NE of Lake Chad, Polder | Wheat, maize | 94 | 313.7 | |
| Gleysol (t0) | NE of Lake Chad, Polder | Uncultivated | 64.2 | 200.4 | |
| Gleysol (t10) | NE of Lake Chad, Polder | Under cultivation, wheat, maize | 77.1 | 241.0 | |
| Gleysol (t60) | NE of Lake Chad, Polder | Under cultivation, wheat, maize | 59.1 | 182.8 | Study area |
| Gleysol (t62) | NE of Lake Chad, Polder | Under cultivation, wheat, maize | 79.4 | 173.9 | |
| Gleysol (t65) | NE of Lake Chad, Polder | Under cultivation, wheat, maize | 56.8 | 189.0 |
Considering the age of the polders, relative variations in SOC stock were around 21% from 10 to 65 years of cultivation, with annual average losses of −0.17 MgC·ha−1·yr−1. The results are consistent with similar studies on changes in C stocks following land use change such as those by Manlay et al. (2004) and Woomer et al. (2004) in the West African Sahel savannah and Hernanz et al. (2002) and Martinez-Mena et al. (2008) in the Mediterranean semiarid environment. These authors point to a decrease in quantity of SOC of 50% from 15 to 55 years of cultivation, leading to a loss ranging from −0.20 to −7.5 MgC·ha−1·yr−1. This last result is similar to that obtained by Woomer (1993) in the dry savannah in southern Africa (−0.15 MgC·ha−1·yr−1) and lower than that obtained by Manlay et al. (2004) in the Sahelian West African savannah (−0.48 MgC·ha−1·yr−1).
Indeed, after 55 years of cultivation, from t10 to t65, differences in SOC and SIC stocks are significant in the 0–30 and 0–100 cm layers (Fig. 2). These significant differences are not observed in t0, t60 and t62 sites. This could be due to initial variability in carbon due to peaty and clay-peaty layers, as illustrated by the average SOC corrected stock (Scorr) for 2450 t·ha−1 equivalent soil mass within 30 cm in uncultivated sites t0 (64 Mg C·ha−1) lower than t10. Another possible factor is differentiated management in each polder. Obame et al. (2014) demonstrated a potential ability of small lakes in the Sahelian region to store organic carbon, so if we consider that irrigation uses the lake's natural surface water, we must consider the importance of the detrital input from the shore or the catchments, which are also used for agro-pastoral purposes.
Compared to other soil types traditionally cultivated in the region, our results presented higher values than those reported by Manlay et al. (2004) in 1- to 9-year-old fallow in the Sahelian West African savannah (37.2 MgC·ha−1), by Woomer (1993) in the dry savannah of Zimbabwe in southern Africa (25.3 to 27.8 MgC·ha−1), and by Tiessen et al. (1998) for the semiarid savannah and dry forest (50 MgC·ha−1). In soils under forest in Mediterranean semiarid environments in southern Spain, Martinez-Mena et al. (2008) reported a stock of 14 MgC·ha−1. In the t65 polder, the value of Scorr is 53 MgC·ha−1, which was much higher than the stock (17 MgC·ha−1) obtained by Woomer et al. (2004) in the Sahel savannah after 35 years of crop cultivation. The t65 stock is greater than the initial stocks observed in different semiarid African and Mediterranean contexts.
As far as SOC stocks of 0–100 cm are concerned, there was also a significant difference between t0 (241 MgC·ha−1) and t65 (189 MgC·ha−1). These 0–1 m stock values were also higher than those found under similar climatic conditions in West Africa (Table 3).
Classically, losses in SOC stocks are significant due to intensified land use. This leads to a deterioration of the physicochemical properties of the soil and to their C-storage potential (Leprun et al., 2009; de Ridder and van Keulen, 1990). In the context of our study, losses in SOC stocks depend on:
- • low crop residue usually burned or exported out of cultivated plots to feed livestock during the dry season;
- • the mineralization of organic matter by soil microflora, favoured by water and temperature conditions prevailing in irrigated areas.
The absence of a relationship between particle size and subsurface stocks (> 0.3 m) showed only the expression of the accumulation of organic matter, independently of the nature of the mineral sediment in the lake and marshes (Table 3). The close levels of organic stocks observed in the 0–0.3 m soil layers (Fig. 2), marsh (t0) or t10, t60, t62 and t65 show that the abundance of fine particles (clay + fine silt), CEC, pH (supplementary data, Table S1) have a significant positive correlation with stocks in this layer (Table 3). Particle size and cation exchange capacity relationships to the C stock must be related to the nature of clays. In previous works, dominant clays were described as beidellite associated with a minimal proportion of kaolinite (Cheverry, 1974; Tardy et al., 1974). In this work, we consider clay minerals as stable; due to the changes that occurred, it is necessary to consider possible changes in nature or properties (Cornu et al., 2012). Smectites present a peculiar affinity to organic matter, but further characterization by particle size fractionation of organic matter is needed to conclude for these polders; this approach could be associated with non-destructive analytical spectroscopic methods (Derenne and Nguyen Tu, 2014). These results are consistent with those found by Feller et al. (1991) in tilled soil horizons in West African savannahs. Overall, there is a positive interaction between soil properties and SOM. This interaction does not necessarily explain C-storage. However, it could play a dual role in facilitating the protection of SOM or not, according to the water regime. More studies are needed in order to understand the interaction with soluble salts. The predominance of Ca2+ among the exchangeable base cations and high CECs are observed throughout the chronosequence (supplementary data, Table S1). These results confirm those found by Cheverry (1965, 1966, 1974), who conducted a study on the pedological characterization of these polder soils. A positive correlation was observed with exchangeable sodium. These soils, at their present evolution stage, do not show a formal sodic character. The ionic solution composition and the absorbed cations influence the level and intensity of flocculation and dispersion of clays. Classically, the high Ca2+ content strengthens the links in organic–clay molecules providing resistance to dispersion and structural stability, and thus protection of organic soil reserves. This was not observed in this study (Table 2); conversely, the relationship with sodium indicates a possible effect on organic matter stabilization. To better access this effect, an appropriate methodological approach is required for these soils, like the Vis-NIRS approach (Oliveira et al., 2013).
5 Conclusion
In a Sahelian context, no data has been systematically collected nor is currently available for a precise assessment of the soil carbon status in lowland soils, even according to land use. The organic matter in these polder soils is inherited from the sedimentation of vegetal residues provided by lacustrine floating vegetation. The results obtained show that a large part of this organic soil phase is conserved during time, even after cultivation of these soils.
The originality of the work is the pioneering assessment of these polders stocks and their heterogeneity. All previous studies on these soils dealt with dynamics of water and salts. High values of carbon stocks even after 60 years of cultivation are measured. The SOC stocks in the 0–1 m layer are concerned; there was a significant difference between t0 (241 MgC·ha−1) and t65 (189 MgC·ha−1). These 0–1 m stock values were also higher than those found in a similar pedoclimatic context in West Africa. SIC stocks, mass accumulation of CaCO3, are negligible and vary from 1 for t0 to 6 MgC·ha−1 for t65. Considering the age of the polders, relative variations in SOC stock were around 21% from 10 to 65 years of cultivation, with annual average losses of −0.17 MgC·ha−1·yr−1.
A regional approach could be used to better estimate carbon budgets and stocks in an environment that is particularly quick to respond to small global and local changes.
Finally, we must insist on the current requirement to apply “conservation” management to these soils, which implies, de facto, a need for sustainable development of land resources.
Funding
FACAD.
Acknowledgements
Financial and logistical support was provided by Programme d’appui à la recherche en réseau en Afrique (PARRAF; Ministry of Foreign Affairs – MAEDI & IRD, France), the Islamic Development Bank, the University of N’Djamena, Chad. This research is associated with the “Carbon Soil Africa” network http://www.reseau-carbone-sol-afrique.org/. Joanna Gozlan revised the English.