

1 Introduction
The stratospheric ozone layer exists in a delicate balance between production and destruction. The exact balance can be changed via changes in UV radiation, changes in temperature, or changes in gases that react with ozone. The Montreal Protocol on Substances that Deplete the Ozone Layer regulates substances that alter that balance allowing excess ozone destruction. As production of these substances decrease with time, the ozone layer should start to increase, and there is some evidence that healing of the stratospheric ozone layer has begun (Solomon et al., 2016). However, as noted in Harris et al. (2015) and Steinbrecht et al. (2017), although statistically significant positive trends have been noted in the upper stratosphere, recent trends are not statistically significant below 35 km. Uncertainties are to some extent due to the process of combining data sets, as well as uncertainties in the drift estimates of the various ozone observing systems, but poorly characterized geophysical variability also contributes. Reasonably well understood contributors of variability are the 11-year solar cycle, dynamical variability due to the quasi-biennial oscillation, and trends in ODSs (Stolarski et al., 2006). Additionally, nitrous oxide (N2O) changes may impact the future evolution of stratospheric ozone. N2O is both a greenhouse gas and an ODS with natural and anthropogenic sources. Ravishankara et al. (2009) showed that, in the absence of any control, N2O will become the dominant ozone-depleting substance as ODSs controlled by the Montreal Protocol decline and that reducing N2O emissions enhance the rate of recovery of the ozone hole and reduce anthropogenic forcing of climate.
The increase in anthropogenically emitted greenhouse gases is also expected to impact stratospheric ozone; largely via increases in CO2 the stratosphere will cool, thereby reducing the rate of ozone loss and has been termed “super-recovery” (Chipperfield et al., 2017). The decrease in ODS production mandated by the Montreal Protocol has resulted in a cessation of the decline of the ozone layer; it stopped in approximately 2000 (WMO, 2007). Steinbrecht et al. (2017) noted that small increases in global ozone are now expected given the current decline in ODS concentrations, however, it is currently difficult to separate from geophysical variability related to temperature, circulation and UV flux variability. Additionally, one must consider how variability in stratospheric water and aerosols play a role in ozone variability.
2 Stratospheric water vapor
2.1 Control of stratospheric water vapor
The primary factors that contribute to the control of stratospheric water vapor concentrations are freeze-drying at the tropical tropopause (Brewer, 1949) and production via methane oxidation (LeTexier et al., 1988). Other processes that can alter stratospheric water vapor are polar dehydration and transport of air from troposphere to stratosphere that bypasses the tropical cold trap (one example being convection that overshoots the tropopause). Antarctic polar dehydration plays a role in hemispheric asymmetries in stratospheric water vapor at high latitudes (Rosenlof et al., 1997), but as noted in Douglass and Stanford (1982), results in a relatively small sink of stratospheric water vapor (∼ 2% of the total burden). In the current atmosphere, it has been well demonstrated that most of the annual and interannual variability in the entry value of stratospheric water vapor is directly related to variability in tropical tropopause or cold point temperature (Mote et al., 1996; Randel et al., 2004). Therefore, to understand the long-term evolution of stratospheric water vapor, one needs to understand the drivers of tropical cold point trends and variability. Trends in methane emissions can also produce long-term trends in stratospheric water vapor but have been relatively small over the observed record (Myhre et al., 2007). The contribution due to transport of air bypassing the tropical cold trap is not well quantified, but it may contribute during extreme events (Avery et al., 2017).
2.2 Related changes to ozone
Kirk-Davidoff et al. (1999) noted that climate change could impact stratospheric ozone through changes in water vapor. The scenario envisioned in that study was that tropical tropopause temperatures would increase in response to greenhouse gas increases, thereby allowing more water vapor to enter the stratosphere. They noted that the threshold temperature for halogen activation allowing heterogeneous ozone-depleting reactions on polar stratospheric cloud (PSC) particles was a function of water vapor concentration; as water increases, that threshold temperature increases, and ozone-depleting reactions can continue later into the spring season. An increase in water vapor could then lead to enhance ozone depletion during polar winter/spring in conjunction with enhanced frequency of polar stratospheric clouds (PSCs), in particular in the Arctic. Vogel et al. (2011) used a chemistry transport model to assess the impact of changes in water vapor on Arctic ozone. They found, for a 2004/2005 winter case, that a water vapor increase of 10% (+0.58 ppmv) yielded an increased in total ozone loss of 5.9DU, which is ∼ 10% of the nominal January through March ozone decrease using a reference ozone column of 60 DU (see Fig. 1). Considering future reduced chlorine loadings, the impact decreases; their run with 1980 chlorine levels yielded a 3.4 DU difference between a reference run and an increased H2O run.
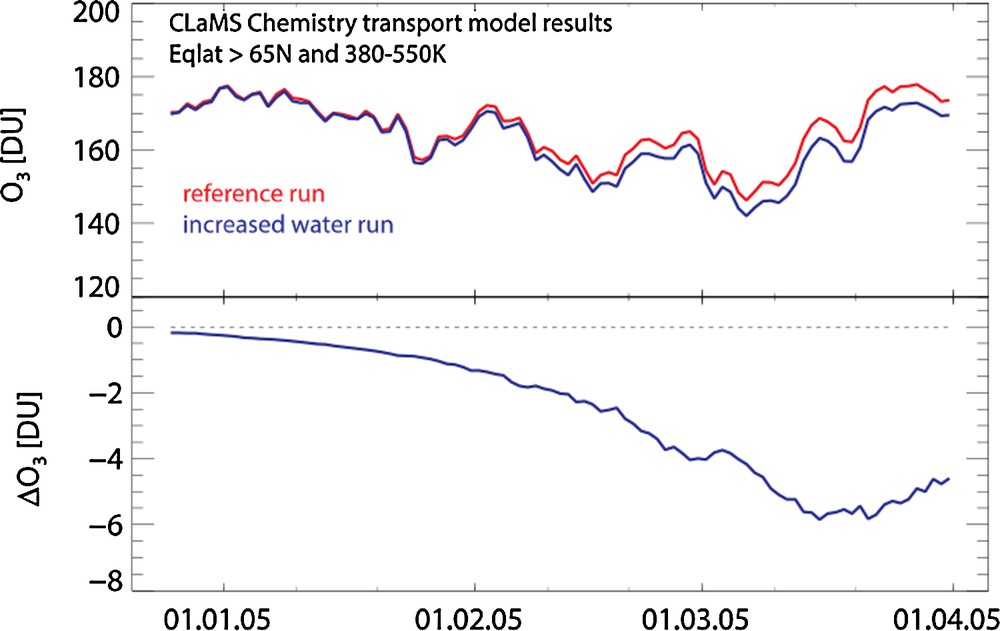
Modified version of figure 6 from Vogel et al. (2011). Top panel: time series of column ozone (in Dobson units) for a reference run (red) and a run with increased H2O (blue) from a chemistry transport model run for the NH polar region. Bottom panel: difference between the reference and increased H2O runs.
Dvortsov and Solomon (2001) explored the impact of water vapor trends on mid-latitude ozone using a 2D model. They discuss two processes related to H2O amount that play a role in ozone chemistry, changes in HOx concentrations and changes in temperature. An increase in H2O will decrease stratospheric temperature as well as increase the amount of odd hydrogen. The temperature response was also detailed in Forster and Shine (2002) and is shown in Fig. 2. As modeled in Forster and Shine (2002), the uniform increase in stratospheric water vapor produces cooling throughout the stratosphere, with largest values in the polar lower stratosphere, which, as discussed in Vogel et al. (2011) enhances polar stratospheric cloud (PSC) induced ozone loss. Increasing water vapor can change O3 multiple ways as discussed in Dvortsov and Solomon (2001), and the net effect varies with location, altitude and season. Considering all factors, they concluded that a 1%/year increase in water vapor as modeled over the 1980–2000 period intensified ozone column loss. If it continued, it would delay ozone recovery in the future; the estimate for that delay is approximately 10 years.
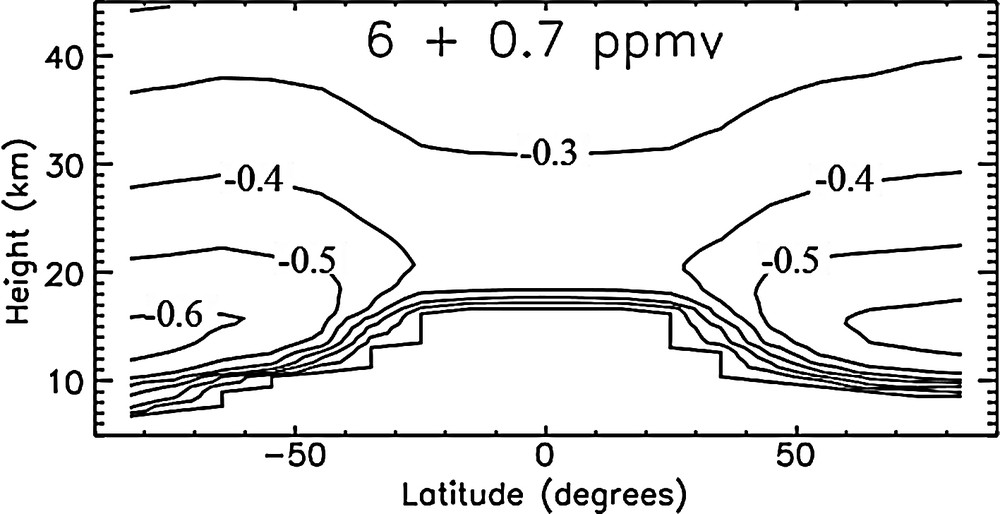
Adapted from figure 2 from Forster and Shine (2002). The annually averaged fixed dynamical heating stratospheric temperature change (in K) calculated by the Malkmus narrow band model as a function of latitude for a 0.7 ppmv increase in stratospheric water vapor using a 6 ppmv background value; the contour interval is 0.1 K.
Changes in stratospheric water vapor can also change aspects of the atmospheric circulation, which can have possible feedbacks on O3. Using idealized model runs, Maycock et al. (2013) showed that doubling stratospheric water vapor changes the position of the eddy driven jets, and, in fact, a doubling of water vapor tended to move the jets poleward. This impact was shown to be due to lower stratospheric water vapor changes, and there are associated changes in the strength of the stratospheric mean meridional circulation. They found a ∼ 10% increase in the 70 hPa upward mass flux for the doubled water case. This could also alter upwelling of species relevant to ozone chemistry, although such details are not discussed.
2.3 Observed changes in stratospheric H2O
Many studies have examined trends in stratospheric water because of its importance in climate. Kley et al. (2000) examined trends from multiple instrument records, finding increases in stratospheric water vapor covering multiple decades. These were also elucidated in Rosenlof et al. (2001); Fig. 3, taken from that paper, shows positive trends calculated from 4 remote sounding instruments. Trend analysis has continued with new measurements; one such example is analysis of the frost point balloon record taken at Boulder, CO (40N); this is the longest continuous data record that exists for stratospheric water vapor. The time period from 1980–2010 was analyzed in Hurst et al. (2011). They used a break point analysis to look at the time series; this resulted in 4 time periods with different trends. Overall, they found increases between 1980 and 2000 and between 2006 and 2010. Decreases were found from 2000–2005. For the entire time period (1980–2010), the overall increase was on the order of 1 ppmv; the decrease from 2000 to 2005 was 0.35 ppmv. They discuss mechanisms for changes, noting that the vertical profile of trends gives additional information. They found times where trends were stronger at higher altitudes (1990–2000 and 2006–2010), indicating a contribution from something that strengthens with altitude; oxidation of methane is a likely candidate. At other periods, the trends decrease in magnitude with altitude (1980–1989), indicating a change in the tropical source that propagates to higher latitudes. They also note (as did Rohs et al., 2006) that increases in methane account for less than 30% of the observed water vapor increases. The decrease between 2000 and 2005 was noted in Randel et al. (2006) and Rosenlof and Reid (2008) and has been attributed to a decrease in tropical tropopause temperatures, although the reasons for the temperature change are still not fully understood but may be related to the evolution of sea surface temperatures from a strong El Niño to a strong La Niña event in conjunction with a 2000 shift in the phase of the Quasi-Biennial Oscillation (QBO) (Brinkop et al., 2016). In 2011–2012, there was another drop in stratospheric water vapor (Urban et al., 2014), but it did not persist and appears related to QBO temperature oscillations. Fig. 4a shows an updated time series of lower stratospheric de-seasonalized water vapor from satellite and balloon measurements. The water vapor values plotted are de-seasonalized by subtracting the time series average mean for each month from the full time series. There is consistency between instruments as well as between tropical and mid-latitude measurements, indicating a related source of variability.

Figure 6b from Rosenlof et al. (2001). Vertical profiles of the estimated linear trends for balloon, shuttle and satellite instruments with variable latitude sampling. Data were binned by N2O, which gives an approximate vertical axis, the approximate pressure is given on the right axis. A CH4:N2O relationship from the MklV instrument was used to convert CH4 binned HALOE trends to the N2O axis. Trends are shown with a solid line; 1 sigma uncertainties are given by horizontal bars.

a: 82 hPa de-seasonalized water vapor (annual cycle removed) for frost point balloon data at Boulder, Co (40N, black diamonds) and Hilo, Hi (19.7N, red diamonds), 15N–15S HALOE (blue line), and 15N–15S MLS (green line). The HALOE and MLS satellite data shown are monthly averages; b: the 15N–15S 82 hPa MLS trace from Fig. 4a (black line) and the 50 hPa Singapore winds, an index of the QBO (red line).
Looking in more detail at Fig. 4a, one sees that interannual variability is fairly large. In Fig. 4b, tropical satellite water vapor at 82 hPa is shown along with the 50 hPa QBO winds lagged by three months. The correlation coefficient of those two traces is 0.60, indicating that the QBO is a significant driver of stratospheric H2O variability. The magnitude of the oscillations associated with the QBO are on the order of 0.5 ppmv, and changes in entry value water vapor in the tropics can be transported to all latitudes. This is similar to the perturbations explored in Vogel et al. (2011) with regards to Arctic ozone. These could potentially introduce interannual variations on column ozone on the order of 10%.
2.4 Drivers of change for stratospheric H2O
Water vapor input into the stratosphere is primarily a function of the temperature at the tropical tropopause. This was first postulated by Brewer (1949) and provided the first evidence of the existence of the Brewer–Dobson circulation. The temperature/water vapor relationship is demonstrated in Fig. 5, showing the variations are well correlated (> 0.8 using a two-month lag for temperature). Fig. 6 shows the correlations are also high (0.72) only considering interannual variations. Although tropical tropopause temperatures are the primary consideration, the other significant source of water vapor in the stratosphere is oxidation of CH4 (LeTexier et al., 1988). Myhre et al. (2007) show that trends in CH4 over the period 1979–2000 could have increased water by 0.1 ppmv in the lower stratosphere and by 0.4 ppmv near the stratopause. The oxidation of H2 is a related source of stratospheric water vapor. Tromp et al. (2003), examining the potential of a shift to hydrogen fuel cell economy, assumed a quadrupling of surface H2 concentrations in a model run, and found changes to stratospheric water and temperature that did impact ozone values. Their four-fold increase in surface H2 yielded changes in column ozone in the polar regions of 5 to 8%.

Figure 11 from Rosenlof and Reid (2011). 10°N–10°S water vapor mixing ratio from the HALOE satellite instrument at the tropical hygropause (black solid, scale on left) and NCEP/NCAR reanalysis zonal average tropopause temperatures (grey dashed, scale on right). The correlation maximizes with a two-month shift, with water vapor lagging.
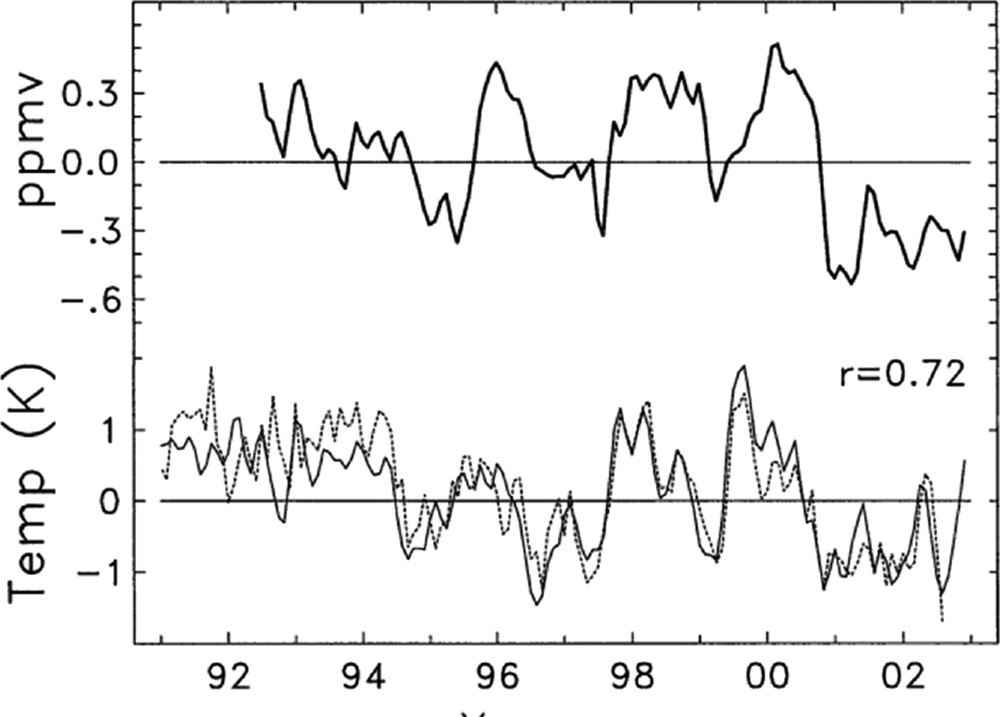
Figure 13 from Randel et al. (2004). (top) Time series of de-seasonalized HALOE H2O at 82 hPa over 20N–20S. (bottom) De-seasonalized anomalies in radiosonde cold point tropopause temperature, averaged from all stations over 10N–10S (solid line), together with anomalies in ERA-40 100-hPa temperatures (dashed line). The r = 0.72 correlation refers to the water vapor and radiosonde temperature time series.
Another possible source of trends in stratospheric H2O would be changes to the amount of water that enters the stratosphere in condensed form, effectively bypassing the tropical tropopause temperature control. There is some observational evidence that this occurs, both via in situ measurements (Corti et al., 2008; Khaykin et al., 2009) and from space borne LIDAR measurements (Avery et al., 2017). It has also been identified in model simulations (Dessler et al., 2016; Holloway and Neelin, 2007). Dessler et al. (2016) find that not only does water vapor in future climate scenario runs increase due to changes in tropopause temperature, but also due to increases in the ice contribution to stratospheric water vapor in 100-year climate simulations. Avery et al. (2017) found evidence for this process occurring during a strong El Niño event; although there was an increase in tropical tropopause temperatures, it was not sufficiently large that they could reproduce observed values of stratospheric water vapor simply through trajectory calculations driven by observed temperatures.
3 Stratospheric aerosols
3.1 Sources of stratospheric aerosols
Aerosols particles are typically found in a distinct layer in the lower stratosphere, between about 15 and 25 kilometers above Earth's surface. This is commonly referred to as the Junge Layer (Junge et al., 1961). These particulates are composed primarily of sulfuric acid/water solution droplets. Large volcanic eruptions can result in sulfur compounds reaching the upper troposphere and stratosphere, where they form aerosols that greatly increase the amount of aerosol in the stratosphere. This volcanic contribution can overwhelm non-volcanic sources at times, making attribution of changes in stratospheric aerosols amounts difficult (Kremser et al., 2016). Other sources, described in detail in Kremser et al., 2016 are carbonyl sulfide (OCS) acting as a significant source of stratospheric sulfur non-sulfate components in stratospheric aerosol such as black carbon and organics.
3.2 Relation to changes to O3
As with H2O, aerosols can affect ozone through heterogeneous chemical reactions and through modifications of the large-scale circulation and temperature. The eruption of Mt. Pinatubo in 1991 provided much evidence for how aerosols in the presence of halogens perturb the ozone layer. This eruption occurred when there was good satellite coverage of both ozone and chemical species that affect ozone, and high-quality models that had been developed for examining the ozone hole issue. The excess of aerosols in the stratosphere altered the atmospheric heat balance, ozone chemistry, and the circulation strength (McCormick et al., 1995). Aerosols formed from injected SO2 increase the planetary albedo, alter the temperature and dynamics of the stratosphere, and allow heterogeneous reactions that destroy ozone to occur. The net effect is a surface cooling and a reduction in stratospheric ozone. Satellite ozone measurements confirmed that ozone destruction occurred as seen in Fig. 7. Angell (1997) used ground based total ozone data and estimated decreases in the ozone column after the Pinatubo eruption ranging from 2% in the tropics to 6% in NH mid-latitudes with a global average decrease of 1.9%. Following the 1983 El Chichón eruptions ozone column decreases were smaller, largely in the 2–3% range, and following the Agung eruption in 1963, the anomalies noted were not statistically significant. The lack of a significant response is not a surprise following the Agung eruption, in that stratospheric chlorine amounts were low in 1963 (Hegglin et al., 2015).
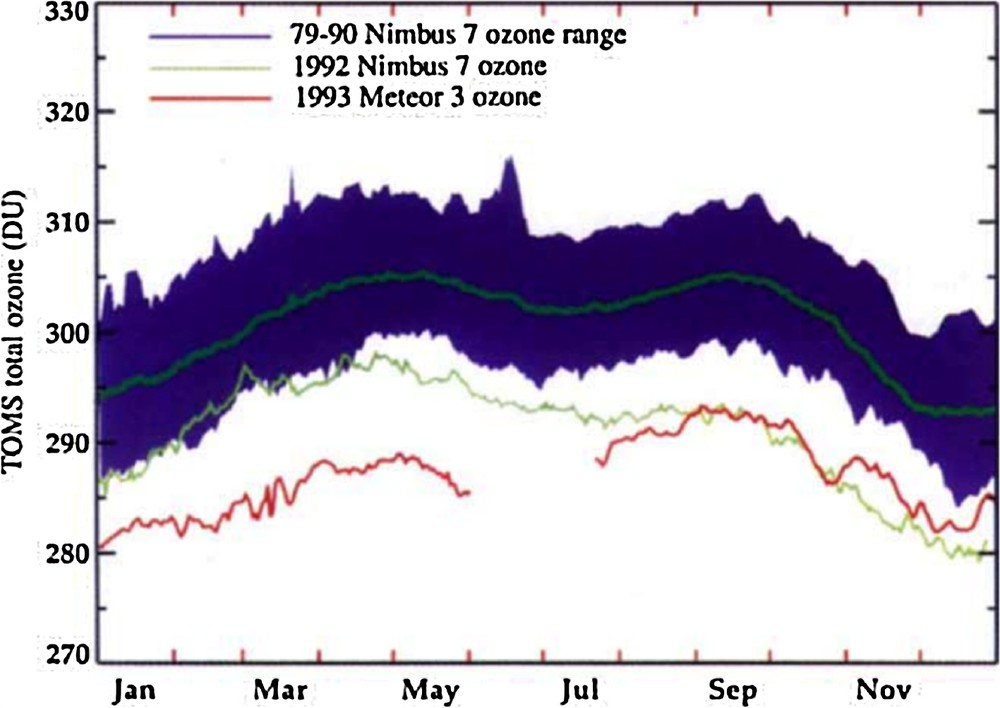
Figure 4 from McCormick et al. (1995). Global mean ozone in Dobson Units (DU) from the Total Ozone Mapping Spectrometer (TOMS) instrument (for a 65N–65s mean). The dark green line is the average total ozone for this period. The shading gives the range of global total ozone for the 1979–1990 period. The light green line is 1992 values, the red line is 1993. Post Pinatubo, global total ozone was depleted by 10–20 DU for more than two years after the eruption.
Polar ozone chemistry is also impacted by changes in stratospheric aerosols. The most severe ozone loss occurs in the unique meteorological conditions experienced in the Antarctic spring (Solomon et al., 1986) and that heterogeneous chemical loss can be enhanced by volcanic aerosols trapped in the polar vortex (Hofmann and Oltmans, 1993; Solomon, 1999). In a modeling study, Ivy et al. (2017) demonstrated that chemical ozone depletion due to volcanic aerosols from the eruption of the Chilean volcano Calbuco in April 2015 was instrumental in creating the record-sized ozone hole in October 2015. Stratospheric aerosol variability will contribute to variability in stratospheric ozone when there is sufficient chlorine present.
3.3 Observed changes in stratospheric aerosol
The stratospheric aerosol layer was first reported on in 1961 (Junge et al., 1961), and the aerosols were assumed to be composed of sulfuric acid droplets. A more recent in situ aircraft study (Murphy et al., 2014) using an instrument that measures composition, found that in the lower stratosphere when unperturbed by a major volcanic eruption, most particles are either relatively pure sulfuric acid, sulfuric acid with material from ablated meteoroids or mixed organic-sulfate particles that originated in the troposphere; clearly sulfuric acid is a key component. To a large extent, our data-based knowledge of the climatic and chemical impacts of stratospheric aerosols comes from measurements following the cataclysmic eruption of Mt. Pinatubo in 1991. Recent work has also suggested that organics contribute significantly to the upper troposphere/lower stratosphere aerosol mass budget. Organic aerosols and black carbon may have increased significantly due to anthropogenic sources since preindustrial times. A modeling study (Yu et al., 2016) suggests that organic material in the lower stratosphere makes up to 40% of the non-volcanic background aerosol optical depth at present time and has increased in time as has the non-volcanic sulfate component.
Recent modeling work also suggests that aerosols produced during the Asian summer monsoon season and subsequently transported into the global upper troposphere and stratosphere make a significant contribution to the overall background aerosol budget. Hofmann et al. (2009) examined data from aerosol backscatter LIDARs covering for the late 1990s and 2000s, and found a small increase that they attributed to increases in anthropogenic emissions. Neely et al. (2013) further analyzed that period using a sophisticated aerosol/climate model, and concluded that the trends noted by Hofmann et al. (2009) were due to the impact of several moderate volcanic eruptions. There have been several studies recently examining increases in stratospheric aerosol due to anthropogenic activity, largely related to understanding the origins of the Asian Tropopause Aerosol Layer, a layer from 13–18 km that exists in association with the Asian monsoon upper level anticyclone (Neely et al., 2014; Thomason and Vernier, 2013; Vernier et al., 2011), and is hypothesized to be primarily of anthropogenic origin. In a modeling study, Yu et al. (2017) hypothesize that the ATAL contributes 15% of the non-volcanic Northern Hemisphere aerosol in present day, hence it is a significant potential growing source of stratospheric aerosols. Yu et al. (2017) also conclude that the ATAL contribution is of a similar magnitude to that from small volcanic eruptions over the period from 2000 to 2015.
To model historical ozone, an accurate representation is needed for global stratospheric aerosols (Mills et al., 2016). Volcanic eruptions perturb the stratospheric aerosol layer. In particular, eruptions in the tropics are significant because the resulting stratospheric aerosols can move into both hemispheres impacting the radiative balance globally. Fig. 8 shows a time series of global aerosol loading estimated from a chemistry-climate model using the Community Aerosol and Radiation Model for Atmospheres (CARMA), a sectional aerosol microphysics model, (Toon et al., 1988; Yu et al., 2015). Large volcanic eruptions with material that reach the stratosphere, such as El Chichón in 1982 and Pinatubo in 1991, produced order of magnitude increases in stratospheric aerosol optical depth. Smaller eruptions also impact the background aerosol; as noted in Neely et al. (2013), a series of moderate eruptions in the 2000s resulted in an apparent trend in AOD over that decade. Solomon et al. (2011) suggested that this increase in aerosols produced a negative radiative forcing thereby reducing the amount of global warming that would have occurred over that period by ∼ 25%. Variability and trends in stratospheric aerosol affect both ozone amounts and climate.

Global stratospheric aerosol optical depth calculated using Community Aerosol and Radiation Model for Atmospheres (CARMA) based on SO2 inputs from Mills et al. (2016).
3.4 Drivers of change for stratospheric aerosol
Explosive volcanoes that input sulfur dioxide into the stratosphere will make the largest perturbations to stratospheric aerosol. It is not possible to predict when such eruptions will occur; Rougier et al. (2017) estimated a return period for eruptions with a Volcanic Explosivity Index (VEI) of 5 to be 14 years and a VEI = 6 of 110 years. For reference, Agung and El Chichón were VEI = 5 eruptions, and Pinatubo was a VEI = 6 eruption. Eruptions with VEI = 7 or greater have return periods of thousands of years; the most recent VEI = 7 eruption was that of Mt. Tambora in 1815, leading to the so-called “Year Without a Summer” in 1816. It has been recently recognized that small to moderate sized volcanic eruptions are also climatically significant (Mills et al., 2017 and references therein), and clustering of eruptions could lead to apparent trends. Whether eruptions produce ozone loss depends on the halogen loading (Klobas et al., 2017).
Another potential source of change in stratospheric aerosol amount is increases in anthropogenic emissions of sulfur and organic compounds. Yu et al. (2016) estimated increases in the non-volcanic global stratospheric AOD of 77% since 1850. A second possible future source is related to a proposed method of climate engineering that adds to the stratospheric aerosol burden to increase planetary albedo, thereby reflecting more solar radiation and reducing surface warming (Crutzen, 2006). Modeling studies have shown that such solar radiation management (SRM) techniques can impact stratospheric ozone levels (Tilmes et al., 2009). Increases in stratospheric aerosol will also alter the dynamics and radiative balance of the stratosphere (Richter et al., 2017).
4 Conclusion
Because of the controls placed on ozone-depleting substances due to the Montreal Protocol and its subsequent amendments, the rapid ozone depletion seen over the last part of the 20th century has largely ceased, but a statistically significant increase in observed ozone has not been robustly shown at all levels in the stratosphere (Steinbrecht et al., 2017). This is due to both uncertainties in merging multiple records to obtain long-term time series, and to the presence of geophysical variability. Water vapor and aerosol concentrations in the stratosphere contribute to that geophysical variability, and unknowns in exactly how water vapor and aerosol will evolve in the future contribute to uncertainty in ozone projections. As halogen loading in the stratosphere decreases, the sign of the impact of aerosols on ozone can change; higher levels of aerosols reduce ozone when halogen levels are high but increase ozone when halogen levels are low and NOx chemistry dominates. Changes in water alter the potential for polar stratospheric cloud formation, possibly decreasing ozone when water increases. Water increases will also increase HOx, thereby producing ozone decreases. But temperature decreases in the stratosphere due to water increases could increase ozone. Thoroughly evaluating causes for ozone changes requires knowing the evolution of both water vapor and ozone; Naik et al. (2017), in a modeling study examining the influence of volcanic aerosols on stratospheric ozone in a changing climate, concluded that there are “substantial uncertainties in stratospheric ozone projections and expected recovery dates induced by volcanic aerosol perturbations”. Water vapor changes in a future climate are also uncertain. The Chemistry-Climate Model Validation (CCMVal) intercomparison project (Eyring et al., 2010) found large differences in the stratospheric water vapor distributions for both past and future climates; although, overall, climate models tend to predict an increase with climate change, the magnitude is quite uncertain. To some extent, one can think of the perturbations on stratospheric ozone due to changes in water vapor and aerosols to be a source of noise in trend calculations. However, as halogens continue to decrease, they will likely become a significant cause of interannual variability and will need careful consideration for ozone trend attribution. Consequently, it is important that measurements of both stratospheric water vapor and aerosols continue into the future.
Acknowledgements
This work was funded by NOAA base and climate funding.