

 CC-BY 4.0
1. Introduction
Carbonatites and alkaline magmatic rocks are known to be the most REE enriched igneous rocks [Nelson et al. 1988; Woolley and Kempe 1989] and are associated with the most important REE deposits [Chakhmouradian and Zaitsev 2012; Smith et al. 2016; Verplanck et al. 2016]. These rocks are also enriched in volatile species such as halogens—fluorine and chlorine (F and Cl)—[Aiuppa et al. 2009; Jago and Gittins 1991; Jones et al. 2013; Kynicky et al. 2019; Metrich and Rutherford 1992; Webster et al. 2018], and also phosphorous [Ablay et al. 1998; Jones et al. 2013; Mattsson et al. 2013; Woolley and Kempe 1989]. These elements can reach more than 1 weight % (wt%) in alkaline silicate magmatic rocks [Ablay et al. 1998; Aiuppa et al. 2009; Baudouin et al. 2016; Mangler et al. 2014; Mattsson et al. 2013; Webster et al. 2018]. F, Cl and P concentrations are also high in carbonatites [Jones et al. 2013; Woolley and Kempe 1989], especially in the natrocarbonatites—the alkali-rich carbonatite lavas from the Ol Doinyo Lengai volcano in Tanzania—in which concentrations can reach more than 4, 3 and 1 wt% respectively [Dawson 1962; Keller and Zaitsev 2012]. These elements are also found in minerals present in carbonatites and alkaline magmatic rocks and constitute major components of important REE mineral phases [Verplanck et al. 2016]. In fact, the REE are mostly contained in fluoro-carbonates such as bastnaesite and synchisite, or in phosphates such as monazite and apatite [Smith et al. 2016; Verplanck et al. 2016]. The REE mineralisation is frequently described as resulting from late- to post-magmatic processes involving fluid circulation, which are often characterised as F-, Cl- and P-rich [Gysi and Williams-Jones 2015; Smith et al. 2016; Verplanck et al. 2016; Williams-Jones et al. 2012]. These elements play an important role in the concentration, redistribution and deposition processes of REE [Jia and Liu 2020; Louvel et al. 2015; Migdisov et al. 2016; Williams-Jones et al. 2012]. Nonetheless, primary monazite or bastnaesite crystals have also been recognised and defined as magmatic phases in carbonatites [Castor 2008; Feng et al. 2020; Mariano and Mariano 2012; Néron et al. 2018; Verplanck et al. 2016; Wall and Mariano 1996]. The REE mineralisation can therefore originate from both magmatic or hydrothermal processes, and the boundary between the two mechanisms remains unclear [Anenburg et al. 2020; Chakhmouradian and Zaitsev 2012; Verplanck et al. 2016].
Salt-rich melts (including F-, Cl-, P- and S-rich melts) formed at the magmatic stage have been directly demonstrated by the study of natrocarbonatites enriched in F, Cl, P and SO3 [Dawson 1962; Keller and Zaitsev 2012; Mangler et al. 2014; Potter et al. 2017]. Melt inclusion studies have also highlighted the existence of salt melts coexisting with silicate melts [Feng et al. 2020; Frezzotti 2001; Panina 2005; Panina and Motorina 2008], and especially F-, Cl- and P-rich immiscible alkaline silicate and carbonate melts [Berkesi et al. 2020; Guzmics et al. 2019]. Such occurrences, combined with the fact that the most important REE-minerals in carbonatites correspond to fluoro-carbonates and phosphates, raise the question as to whether there is a link between F, Cl and P and the behaviour of REE in conjugate carbonate and silicate melts.
Here we focus on the immiscibility processes between carbonate and silicate melts. This is motivated by the strong association of carbonatites and alkaline silicate rocks observed in the field [Kjarsgaard and Hamilton 1988; Mitchell 2005; Woolley and Kjarsgaard 2008], by melt inclusion studies of conjugate carbonate and silicate melts, as mentioned above [Baudouin et al. 2018; Berkesi et al. 2020; Guzmics et al. 2012, 2019; Mitchell 2009], and also by experimental investigations simulating the immiscibility between carbonate and silicate melts [Brooker 1998; Brooker and Kjarsgaard 2011; Hamilton et al. 1989; Lee and Wyllie 1994; Martin et al. 2012, 2013; Massuyeau et al. 2015; Nabyl et al. 2020; Veksler et al. 1998, 2012]. Experimental studies on trace element partitioning between carbonate and silicate melts [Hamilton et al. 1989; Martin et al. 2013; Nabyl et al. 2020; Veksler et al. 1998, 2012] have shown that carbonate melt immiscible with silicate melt can either be strongly depleted or, on the contrary, enriched in REE. This large variation has been linked by Nabyl et al. [2020] to the silicate melt composition and structure. Nabyl et al. [2020] have proposed a modelling of carbonatite REE enrichment along the alkaline magma differentiation course which is exclusively based on the silicate melt composition. This model allows the REE composition of a carbonate melt immiscible with a silicate melt to be calculated from parameters relative to the silicate melt composition: the silica content (SiO2), the alumina saturation index (Al2O3/(CaO + Na2O + K2O)) and the alkali/alkaline-earth cation ratio [(Na2O + K2O)/(CaO + MgO); Nabyl et al. 2020]. Using this model, Nabyl et al. [2020] have shown that REE-rich carbonate melts can be immiscible with highly differentiated and polymerised alkaline silicate melts of phonolitic/phonotrachytic type, and hence that the degree of silicate melt differentiation plays a key role in the conjugate carbonate melt REE enrichment. The parameterisation of the model has been performed in experimental studies mentioned above [Hamilton et al. 1989; Martin et al. 2013; Nabyl et al. 2020; Veksler et al. 1998, 2012]. However, this model does not take into account the role of F, Cl and P in carbonate melt REE enrichments.
In the pure salt melt (pure fluoride/ chloride/phosphate) and silicate melt systems [Chebotarev et al. 2019; Veksler et al. 2005, 2012], experimental studies have broadly shown that REE have a strong affinity for salt melts, with the enrichment varying by two orders of magnitude [Veksler et al. 2012]. Kynicky et al. [2019] and Feng et al. [2020] have also proposed that carbonate melt salt components (F- and P-rich carbonate melts respectively) can significantly favour REE enrichment. Besides, these elements are critical in the silicate melt structure. Fluorine has been shown to be highly soluble in silicate melts [Dingwell 1986], creating potential complexes with major elements such as Ca, Na, Si and Al [Baasner et al. 2014; Schaller et al. 1992], or with REE [Ponader and Brown 1989], and as being involved in the silicate melt polymerisation as well as depolymerisation [Ponader and Brown 1989], in addition to affecting its viscosity [Baasner et al. 2013a,b]. Baasner et al. [2014] have also shown that F can create bonds with network-modifying cations such as Ca and Na in peralkaline silicate melts, whereas it creates complexes with network-building cations such as Si and Al in peraluminous melts. Chlorine has also been described as having an effect on silicate melt viscosity [Baasner et al. 2013b,a]. Several studies have also characterised P as playing a role in the silicate melt structure [Mysen 1998; Mysen et al. 1981; Toplis and Dingwell 1996], forming complexes with Ca, Mg, Na and Al [Mysen 1998; Mysen et al. 1981], and increasing the viscosity of peralkaline silicate melts [Toplis and Dingwell 1996]. Altogether, this suggests that F, Cl and P can have an effect on the structure of alkaline silicate melt coexisting with carbonate melt, hence influence the REE behaviour between both melts. However, the current experimental database does not allow us to determine the impact of these elements on the REE partitioning between carbonate and silicate melts.
The aim of this study is to test the Nabyl et al. [2020] model in F-, Cl- and P-rich environments and to characterise the role of these elements in the REE partitioning between carbonate and alkaline silicate melts. We present high temperature–high pressure experiments simulating the immiscibility between carbonate and alkaline silicate melts of evolved nephelinite–phonolite type, in F-, Cl- and P-rich systems. The experiments were performed at 850–1050 °C and 0.8 GPa. We show that F, Cl and P do not play a direct role in carbonate melt REE enrichment, and that REE partitioning in F-, Cl- and P-rich systems can be predicted using the Nabyl et al. [2020] model.
2. Methodology
2.1. Experimental strategy
Four compositions were synthesized (Table 1) with a base composition of a phonolite–carbonatite mixture in a ratio of 50:50 for the major elements (including Si, Ti, Al, Fe, Mn, Mg, Ca, Na, K, P, Ba, Sr, F and Cl). The selected mixture composition corresponds to the immiscible carbonate melt and silicate melt of phonolitic composition from experiment T19_01 of Nabyl et al. [2020]. This base composition (composition PhCbn1, see Table 1; named “non-doped” in the following text) contains small amounts of F, Cl and P (F ∼ 1 wt%; Cl ∼ 0.3 wt%; P2O5 ∼ 0.7 wt%; Table 1). In order to characterise and isolate a possible volatile effect on the REE partitioning, three compositions were doped with ca. 5 wt% of P2O5 (composition PhCbn2, Table 1), F (composition PhCbn3, Table 1) and Cl (composition PhCbn4, Table 1) respectively. All four starting materials also contain 0.1 wt% of 𝛴REE-Y-Sc and other trace elements (see Table 1).
Starting material compositions
| PhCbn 1 | PhCbn 2 | PhCbn 3 | PhCbn 4 | |
|---|---|---|---|---|
| Major elements in wt% | ||||
| SiO2 | 25.47 | 24.32 | 24.37 | 24.01 |
| TiO2 | 0.34 | 0.32 | 0.32 | 0.31 |
| Cr2O3 | 0.01 | 0.01 | 0.01 | 0.01 |
| Al2O3 | 9.47 | 9.36 | 8.95 | 8.88 |
| Fe2O3 | 3.88 | 3.67 | 3.7 | 3.52 |
| MnO | 0.31 | 0.29 | 0.29 | 0.28 |
| MgO | 1.06 | 1 | 0.98 | 0.97 |
| CaO | 14.88 | 14.16 | 14.25 | 13.65 |
| Na2O | 12.19 | 11.51 | 11.5 | 11.07 |
| K2O | 4.01 | 3.95 | 3.7 | 3.54 |
| P2O5 | 0.76 | 5.13 | 0.76 | 0.71 |
| SrO | 0.77 | 0.7 | 0.68 | 0.66 |
| BaO | 0.56 | 0.54 | 0.54 | 0.54 |
| F | 1.12 | 1.03 | 5.83∗ | 1.03 |
| Cl | 0.34 | 0.34 | 0.28 | 4.72∗ |
| S | 0.06 | 0.06 | 0.06 | 0.05 |
| LOI | 24.77 | 23.72 | 23.78 | 26.07 |
| Total | 100 | 100 | 100 | 100 |
| Trace elements in μg/g (ppm) | ||||
| Ba | 5340 | 5080 | 5370 | 5410 |
| Sr | 7000 | 6450 | 6380 | 6120 |
| Hf | 23.4 | 22.5 | 17.9 | 24.4 |
| Zr | 407 | 379 | 371 | 377 |
| Nb | 197 | 198 | 185 | 163.5 |
| Ta | 12.4 | 9.7 | 4.4 | 6 |
| La | 52.5 | 50.9 | 49.8 | 48.9 |
| Ce | 61 | 59.6 | 60.4 | 56.6 |
| Pr | 51 | 51.4 | 49.4 | 47.2 |
| Nd | 53.6 | 53.6 | 51 | 50.2 |
| Sm | 56.1 | 55.8 | 54.3 | 50.1 |
| Eu | 55 | 55.7 | 53.9 | 52.5 |
| Gd | 61.5 | 55.3 | 56.6 | 55.4 |
| Tb | 52.4 | 50.7 | 52.1 | 50.1 |
| Dy | 57.3 | 56.8 | 56.5 | 56.7 |
| Ho | 52.6 | 53.3 | 54.2 | 52.5 |
| Er | 57.7 | 57.2 | 58.8 | 58.5 |
| Yb | 54.9 | 55.3 | 56 | 54.6 |
| Lu | 49.9 | 49.7 | 49.9 | 48.3 |
| Y | 67.4 | 67.7 | 64.9 | 63.5 |
| Sc | 64 | 58 | 56 | 60 |
| Cr | 140 | 120 | 120 | 120 |
Major elements (wt%) and trace elements (μg/g, ppm) were analysed by ICP-MS analysis on powders (ALS Global); ∗: concentrations calculated on a normalised basis. Experimental conditions and run products. P: total pressure; T: temperature; SL: silicate liquid; CL: carbonate liquid; CPx: clinopyroxene (diopside–hedenbergite–wollastonite solution); Nph: nepheline; Gnt: garnet (andradite); Ap: apatite; Fe-Spl: iron-spinel (magnetite–titanomagnetite solid solution); Spl: spinel; Afs: alkali feldspar; Cal: calcite; Fl: fluorite; Fst: feldspathoid; “CL2”: second carbonate liquid phase; V: vapour phase.
Most experiments were performed at 850 °C and 0.8 GPa [similar to experiment T19_01 in Nabyl et al. 2020]. Additional experiments were also performed at a higher temperature (1050 °C). Moreover, different amounts of water (0, 3 or 6 wt%) were added to the starting material to test its effect on each chemical system.
2.2. Starting compositions
The four starting compositions (Table 1) were prepared by mixing synthetic powders (SiO2, TiO2, Al2O3, AlPO4, AlF3, AlCl3, FeO, FeS, MnCO3, CaCO3, Na2CO3, K2CO3, BaCO3, SrCO3 and Cr2O3) and natural dolomite (CaMg(CO3)2). For the three ±F-, Cl- and P-doped compositions (PhCbn2, PhCbn3 and PhCbn4 respectively, Table 1), additional AlF3, AlCl3 and AlPO4 powders were used to reach the respective F, Cl and P concentrations needed (Table 1). The starting compositions are CO2-rich, with bulk concentrations of ca. 24 wt%. REE and other trace elements were also added to the four compositions in the form of oxides, fluorides or pure elements (La2O3, CeO2, Pr6O11, Nd2O3, Sm2O3, Eu2O3, GdF3, Tb, Dy2O3, HoF3, Er2O3, Yb2O3, Lu, Y2O3, Sc2O3, Nb2O5, Ta2O5, ZrO2 and HfO2).
The synthetic powders were maintained in a dry oven at 120 °C, except for the strong hydrophilic Na2CO3 and K2CO3 powders which were preserved in an oven at 200 °C. Moreover, the AlF3, AlCl3 and AlPO4 powders were also strongly hydrophilic at atmospheric conditions and could not be preserved at temperatures higher than 50 °C. Those powders and both the PhCbn3 and PhCbn4 compositions (Table 1) were thus manipulated using a Captair Pyramid 2200 ANM-XLS at controlled atmosphere under Argon gas to avoid any atmospheric water contamination, and maintained in a vacuum bell jar. For each composition, the powders were first mixed by hand in an agate mortar (30 min) and then in an automatic grinder with an agate mortar and ball mill (at least two times for 15 min).
2.3. Piston-cylinder experiments
We synthesized 20 experimental charges at 0.8 GPa, 850 and 1050 °C using an end-loaded piston-cylinder apparatus (Table 2). The starting materials were packed into Au capsules (diameter of 2.5–2.9 mm) for low temperature experiments (850 °C) and Au80Pd20 capsules for higher temperature ones (1050 °C). For experiments performed at 850 °C and 0.8 GPa and for almost all the starting materials, four capsules were synthesized: one capsule containing only the starting material, two capsules containing 3 and 6 wt% of water respectively (Table 2), and one capsule with additional graphite (+1 wt%, see Table 2). Water and graphite were added in order to test their effect on carbonate and silicate melt compositions.
The capsules were introduced into an alumina tube with a powder composed of 50% AlSiMag (mixture of Al, Si and Mg)–50% haematite, and closed at the top and bottom with MgO-plugs. The fO2 for the experiments was estimated at between FMQ and FMQ+2, due to the presence of the haematite powder which creates an oxidised environment (i.e. H2-poor). Graphite-bearing experiments were more reduced, likely in the range FMQ−2 [Stagno and Frost 2010]. The whole assemblage was packed into a 3∕4-inch piston-cylinder assembly, composed of graphite, pyrex and talc. Two steel-plugs surrounded by pyrophyllite were placed at the top and bottom of the assembly to maintain the assemblage in place; the thermocouple (B-type, Pt94Rh6–Pt70Rh30) was introduced in the top of the assemblage. For the experiments conducted at 850 °C (Table 2), the samples were first taken up to 975 °C for two hours to ensure bulk composition melting and homogenisation, then the final temperature (850 °C) was reached within a few minutes (cooling rate of 10 °C per minute). Each experiment was quenched by switching off the heat source at isobaric conditions. Uncertainties for the temperature and the pressure are considered to be ±12 °C and ±0.1 GPa respectively [Dasgupta et al. 2004; Sifré et al. 2014].
2.4. Analytical methods
Polished sections were prepared from the experimental charges, and observed using a Merlin Compact Zeiss electron microscope (voltage 15 kV), equipped with a micro-analyser system EDS (Bruker-QUANTAX-XFlash6, resolution 129 eV) at the ISTO laboratory, in order to determine the phases and their textures. Carbonate and silicate melt sections were then analysed with a Cameca SXFive electron microprobe equipped with 5 WDS detectors (ISTO, France) at 15 kV and 6 nA. Analyses were performed with a large beam size (from 10 to 70 μm) to avoid any Na-loss and to average carbonate melt compositions. The standards used for the calibration were albite, apatite, orthose, andradite, topaz, vanadinite, MgO, Al2O3, Fe2O3, MnTiO3, BaSO4, and SrCO3. The counting time was 10 s for all the elements, except for Ba (20 s), Sr and Nb (30 s) and S (60 s). Higher counting times were also needed for F, Cl and P to ensure representative analyses (30 s for Cl, 60 s for F, and 60 or 120 s for P).
Trace elements were analysed using two different LA-ICP-MS (Laser Ablation Inductively Coupled Plasma Mass Spectrometry) devices: the Agilent 7500 CS Quadrupole ICP-MS of the LMV laboratory (Clermont-Ferrand, France; He: 550 mL/min; Ar: 850 mL/min; N2: 2 mL/min) and the Agilent 7900 Quadrupole ICP-MS of the ISTO laboratory (Orléans, France; He: 350 mL/min; Ar: 930 mL/min). Both mass spectrometers are coupled to a 193 nm excimer laser ablation system (Resonetics), with He flushing the ablation cell. Carbonate and silicate melt analyses were performed with a frequency of 2 Hz, an ablation energy of 1.5–3 mJ and a beam size of 14 to 60 μm in diameter, depending on both melt/crystal-free areas. Carbonate and silicate melts from several samples were analysed with both spectrometers to ensure similar trace element concentrations were obtained and that no bias was induced by using the two different machines. The following isotopes were analysed: 43Ca, 44Ca, 29Si, 139La, 140Ce, 141Pr, 146Nd, 147Sm, 153Eu, 157Gd, 159Tb, 163Dy, 165Ho, 166Er, 172Yb, 175Lu, 89Y, 45Sc, 49Ti, 53Cr, 55Mn, 88Sr, 137Ba, 93Nb, 181Ta, 90Zr, 178Hf, 197Au and 105Pd to verify any potential contamination by the capsule during the experiment.
Data reduction and trace element concentrations were carried out using the GLITTER4.4 software [Van Achterbergh et al. 2001] for both the carbonate and silicate melts. The elements were quantified using the NIST 610 standard glass [Pearce et al. 1997] and other standards were used to check the analysis validity [NIST 612 and BCR-2G natural basaltic glass; Pearce et al. 1997; Rocholl 1998; Jochum et al. 2016]. The standards were analysed at the same beam size, frequency and energy ablation as the samples to verify the efficiency of the analysis. The Ca was used as the internal standard, its concentration having first been determined by electron microprobe analyses in both the carbonate and the silicate phases.
Experimental conditions and run products
| Experiment | Starting material | Added volatile | P (GPa) | T (°C) | Duration (h) | Capsule material | Added water (wt%) | Added graphite (wt%) | Phases |
|---|---|---|---|---|---|---|---|---|---|
| PCPC1_01 | PhCbn1 | — | 0.8 | 850 | 50 | Au | — | — | SL + CL + CPx + Nph + Gnt + Spl + Fe-Spl + V (+“CL2”) |
| PCPC1_02 | PhCbn1 | — | 0.8 | 850 | 50 | Au | 3 | — | SL + CL + CPx + Nph + Gnt + Fe-Spl + V (+“CL2”) |
| PCPC1_03 | PhCbn1 | — | 0.8 | 850 | 50 | Au | 6 | — | SL + CL + Fe-Spl + V |
| PCPC1_04 | PhCbn1 | — | 0.8 | 850 | 50 | Au | — | 1 | CL + Cpx + Nph + Gnt + Afs |
| PCPC2_01 | PhCbn1 | — | 0.8 | 1050 | 28 | Au80Pd20 | — | — | SL + CL + Nph |
| PCPC3_01 | PhCbn2 | P | 0.8 | 850 | 67.5 | Au | — | — | SL + CL + Nph + Ap + Spl + Fe-Spl |
| PCPC3_02 | PhCbn2 | P | 0.8 | 850 | 67.5 | Au | 3 | — | SL + CL + Ap + Spl + Fe-Spl |
| PCPC3_03 | PhCbn2 | P | 0.8 | 850 | 67.5 | Au | 6 | — | SL + CL + Ap + Fe-Spl |
| PCPC3_04 | PhCbn2 | P | 0.8 | 850 | 67.5 | Au | — | 1 | CL + Cpx + Nph + Gnt + Ap + Fe-Spl + Afs |
| PCPC4_01 | PhCbn3 | F | 0.8 | 850 | 88.5 | Au | — | — | SL + CL + Fl + Cal + Fe-Spl |
| PCPC4_02 | PhCbn3 | F | 0.8 | 850 | 88.5 | Au | 3 | — | SL + CL + Fl + Cal + Fe-Spl |
| PCPC4_03 | PhCbn3 | F | 0.8 | 850 | 88.5 | Au | 6 | — | SL + CL + Fl + Cal + Fe-Spl |
| PCPC4_04 | PhCbn3 | F | 0.8 | 850 | 88.5 | Au | — | 1 | CL + Fl + Cpx + Nph + Gnt + Fl + Spl + Fe-Spl + Afs + Fst |
| PCPC5_02 | PhCbn4 | Cl | 0.8 | 850 | 88.5 | Au | 3 | — | SL + CL + CPx + Gnt + Ap + Cal + V |
| PCPC5_03 | PhCbn4 | Cl | 0.8 | 850 | 88.5 | Au | 6 | — | SL + CL + CPx + Gnt + Ap + V |
| PCPC5_04 | PhCbn4 | Cl | 0.8 | 850 | 88.5 | Au | — | 1 | CL + Cpx + Nph + Gnt + Ap + Cal + Afs + Fst |
| PCPC6_01 | PhCbn3 | F | 0.8 | 1050 | 23.5 | Au80Pd20 | — | — | SL + CL |
| PCPC6_02 | PhCbn4 | Cl | 0.8 | 1050 | 23.5 | Au80Pd20 | — | — | SL + CL |
| PCPC6_03 | PhCbn2 | P | 0.8 | 1050 | 23.5 | Au80Pd20 | — | — | SL + CL + Ap |
P: total pressure; T: temperature; SL: silicate liquid; CL: carbonate liquid; CPx: clinopyroxene (diopside–hedenbergite–wollastonite solution); Nph: nepheline; Gnt: garnet (andradite); Ap: apatite; Fe-Spl: iron-spinel (magnetite–titanomagnetite solid solution); Spl: spinel; Afs: alkali feldspar; Cal: calcite; Fl: fluorite; Fst: feldspathoid; “CL2”: second carbonate liquid phase; V: vapour phase.
3. Results
3.1. Carbonate and silicate melt textures
Nineteen samples were synthesized at 0.8 GPa and 850 and 1050 °C. For the sake of clarity, each chemical system is represented with a different colour in all the figures: black for the non-doped system, red for the P-rich system, green for the Cl-rich system and blue for the F-rich system.
For all starting materials (±F, Cl and P), all run products have an alkaline silicate liquid conjugated with a carbonate liquid, apart from those produced at 850 °C with graphite (samples noticed “…_04”, see Table 2) which have only a carbonate melt coexisting with a few silicate crystals. The silicate liquids quenched into homogeneous glass in all the samples (Figures 1 and 2). The coexisting carbonate melts show typical textures of quenched crystallised dendritic blebs in almost all the systems (non-doped system, P- and Cl-rich system; Figures 1 and 2), the exception being the F-rich system where they have a near-glassy texture (Figures 1c, 2e and f). In the Cl-rich system (Figures 1d and 2g), carbonate blebs display a porous texture. For almost all the samples, the clear contact between both liquids, the homogeneous chemical compositions and the size of the carbonate melts (up to 200 μm) indicate that equilibrium has been attained between both liquids at given P–T conditions, and this attests to the fact that immiscibility is not related to quench processes [Brooker and Kjarsgaard 2011]. In two samples from the non-doped system that were synthesized at 850 °C (PCPC1_01 and PCPC1_02, Figures 2a and b; Table 2), a second distinct carbonate liquid phase is observed (noted “CL2”, in Figure 2b), characterised by carbonate blebs of <15 to 50 μm. This phase will be treated separately in the following section of the results.
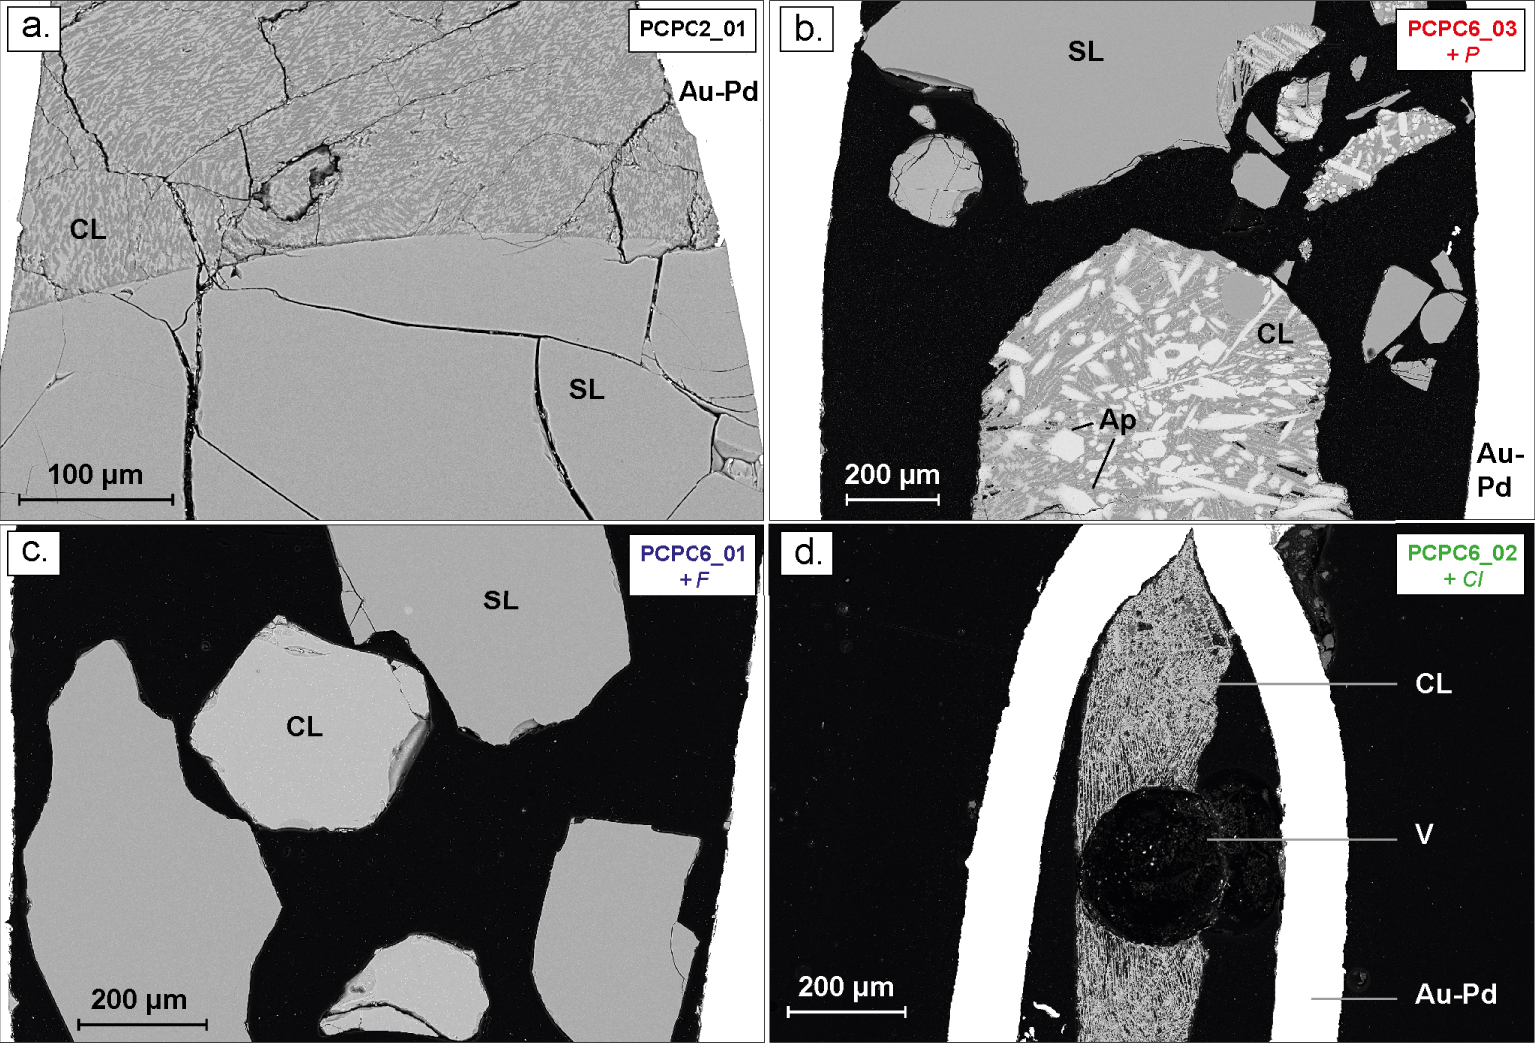
BSE images of typical experimental carbonate and silicate liquid immiscibility at 1050 °C and 0.8 GPa, in the non-doped system in black (a), in the P-rich system in red (b); in the F-rich system in blue (c) and in the Cl-rich system in green (d). SL: silicate liquid; CL: carbonate liquid; Ap: apatite; V: fluid phase; Au-Pd: gold–palladium capsule.
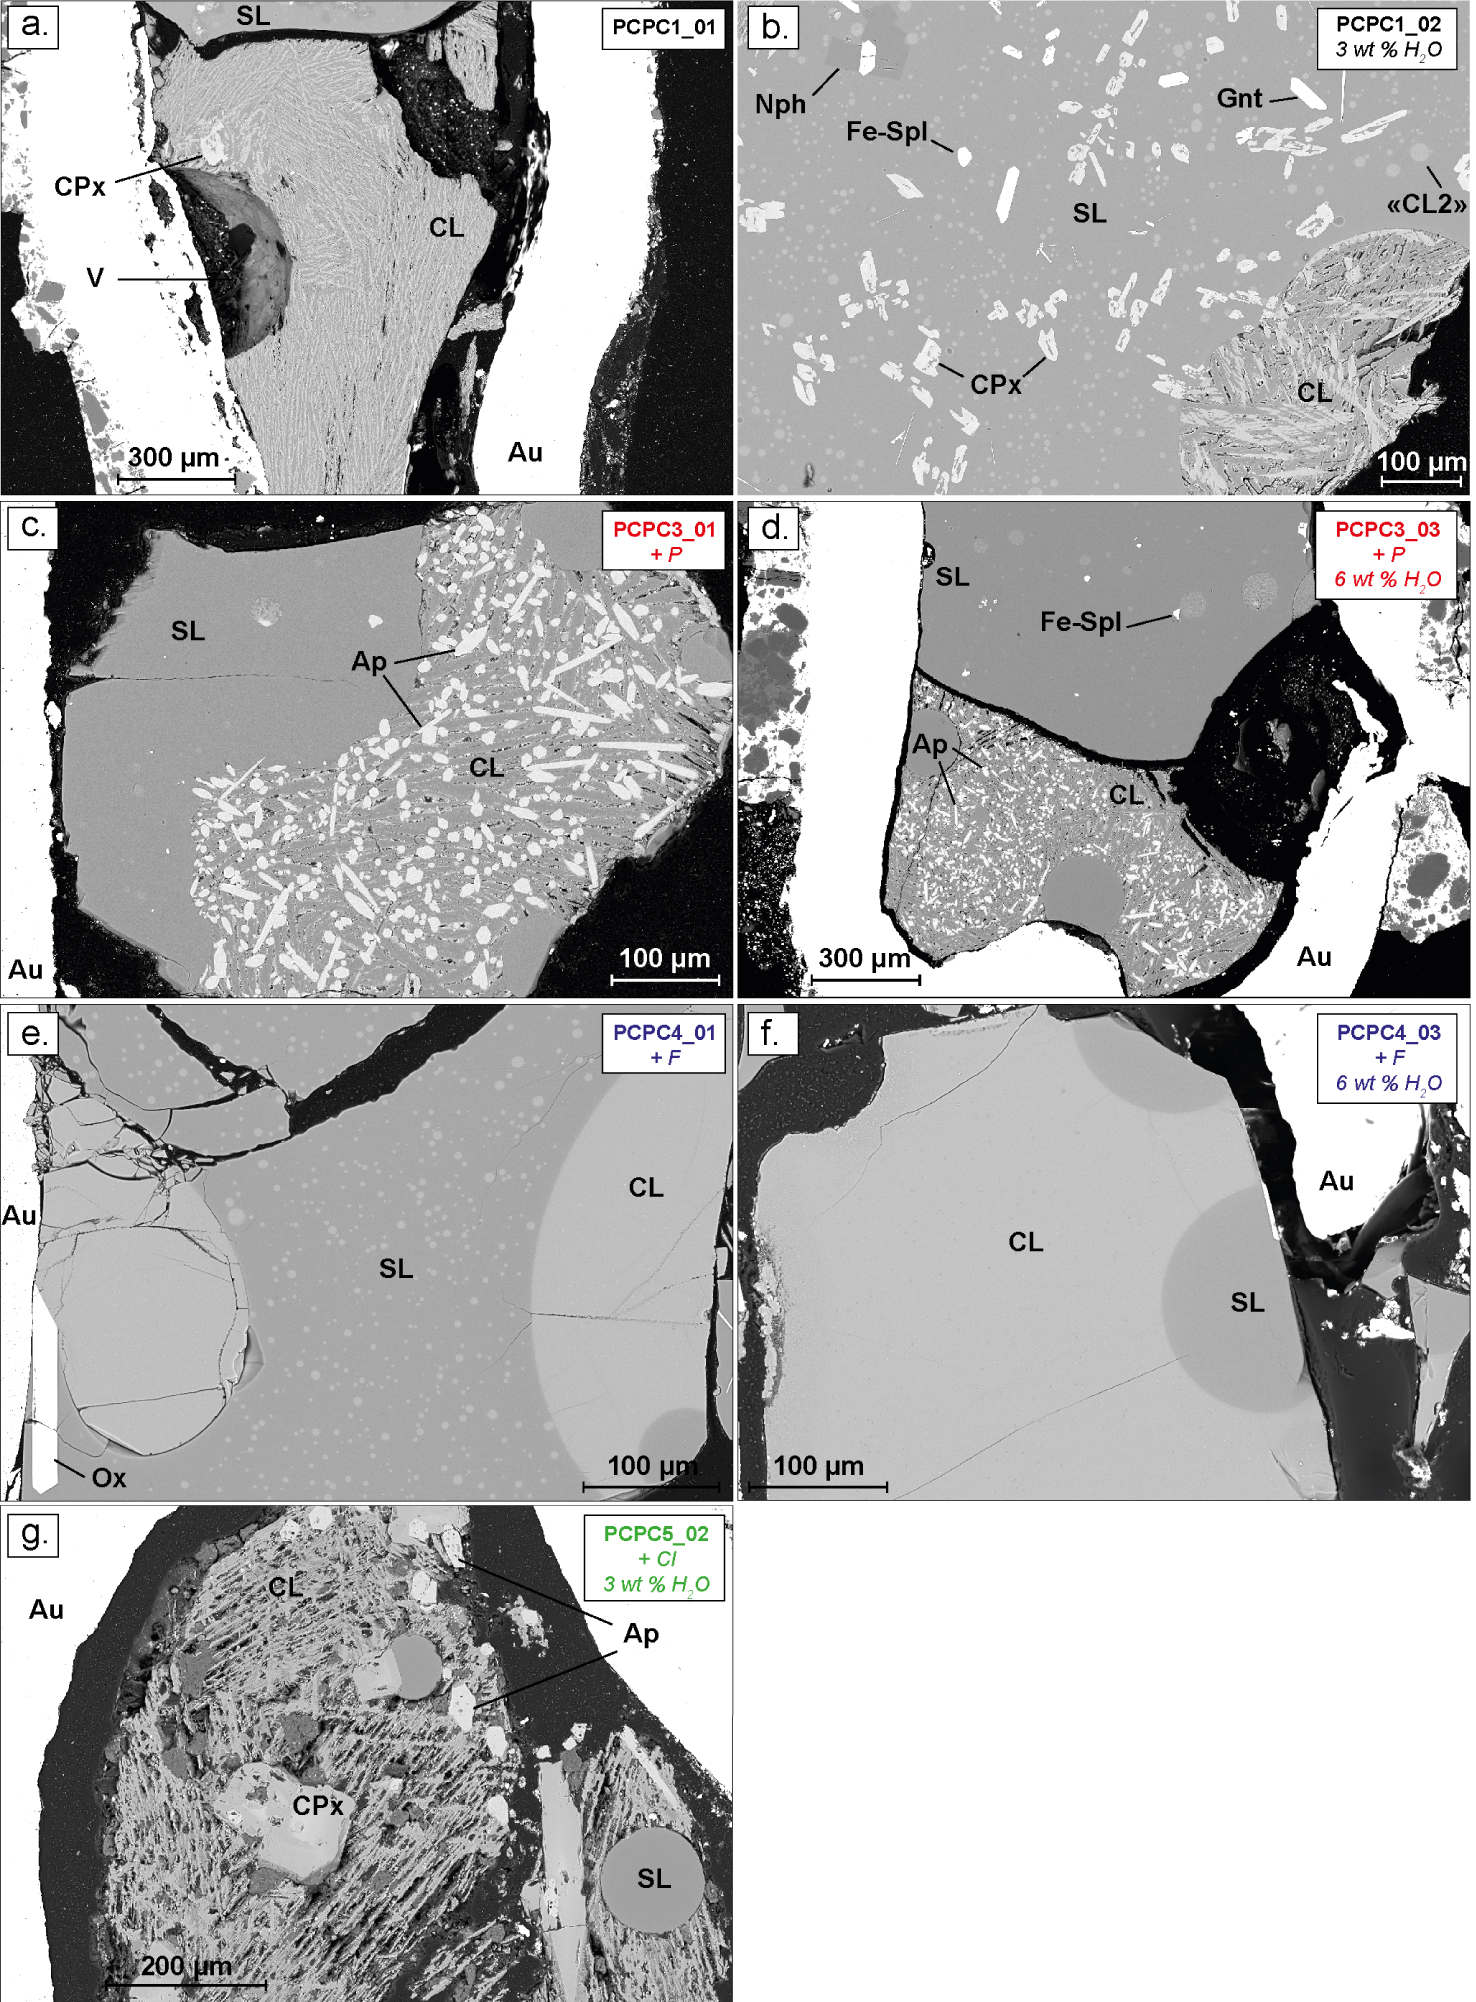
BSE images of typical experimental carbonate and silicate liquid immiscibility at 850 °C and 0.8 GPa, in the non-doped system in black (a and b), in the P-rich system in red (c and d); in the F-rich system in blue (e and f) and in the Cl-rich system in green (g). SL: silicate liquid; CL: carbonate liquid; CPx: clinopyroxene; Nph: nepheline; Gnt: garnet; Ap: apatite; Fe-Spl: ferrospinel; Ox: Fe-Ti oxide; “CL2”: second carbonate liquid phase; V: fluid phase; Au: gold capsule.
In some samples (Table 2), bubbles are observed (Figure 1d; Figures 2d and f) and attest to the presence of a fluid phase coexisting with both liquids. Moreover, at 0.8 GPa and 1050 °C carbonate melts contain a large amount of apatite crystals in the P-rich sample (Figure 1b), while no apatite are observed in the F- and Cl-rich systems (Figures 1c and d respectively). At the lower temperature (850 °C), all charges contain crystals (Figure 2 and Table 2). Clinopyroxene is mainly present in non-doped samples (Figures 2a and b) and in Cl-rich samples (in green, Figure 2g). Apatite is also present in significant proportions in the carbonate melt zones of P-rich samples (Figures 2c and d; Table 2), and a few apatite crystals are also observed in the Cl-rich samples (Figure 2g, Table 2). Other phases are also observed, such as nepheline, garnet, spinel, alkali feldspar, feldspathoid, calcite and fluorite (Table 2, see Figure 2). The chemical composition of all minerals is not discussed here as this study is mainly focused on the effect of F, Cl and P on REE partitioning between the carbonate and alkaline silicate melts.
3.2. Chemical composition of the melts
The major element concentrations of the conjugate silicate and carbonate melts are presented in Table 3.
At 0.8 GPa and 1050 °C for all four chemical systems, the silicate melts present a composition of alkaline nephelinite type, with the SiO2 content varying slightly from 42.9 ± 0.2 wt% (sample PCPC6_02 in the Cl-rich system, Table 3) to 46.3 ± 0.6 wt% (sample PCPC6_03 in the P-rich system, Table 3), and alkali contents (Na2O + K2O) from 15.1 ± 0.8 wt% (sample PCPC6_02 in the Cl-rich system, Table 3) to 17.8 ± 0.6 wt% (sample PCPC6_01 in the non-doped system, Table 3). Figure 3 presents ternary diagrams in the Hamilton projection—i.e. in the (Na2O + K2O)–(SiO2 + TiO2 + Al2O3)–(CaO + MgO + FeO) space—which is widely used to represent the miscibility gap between carbonate and silicate melts [Freestone and Hamilton 1980; Kjarsgaard and Hamilton 1988]. The silicate melts in the P- and F-rich systems are slightly richer in silica and alkali elements compared to those in the non-doped and Cl-rich systems (Figure 3a, see Table 3). The conjugate carbonate melt compositions vary in the four chemical systems from 10.1 ± 1.6 to 17.1 ± 0.7 wt% Na2O (samples PCPC6_02 and PCPC6_03 respectively, Table 3) and from 29.4 ± 0.9 to 34.3 ± 1.2 wt% CaO (samples PCPC6_03 and PCPC2_01, respectively, Table 3). The carbonate melts of the Cl-rich system are poorer in Na2O content compared to the others, and thus closer to the (CaO + MgO + FeO) pole (Figure 3a).
The F, Cl and P2O5 silicate melt concentrations at 1050 °C for all the systems are relatively high, reaching almost 4, 1.3 and 1 wt% in the F-, Cl- and P-rich systems respectively (Table 3). In the carbonate melts, F and P2O5 concentrations are much higher in the F- and P-rich systems: F reaches 11.8 ± 0.7 wt% in the F-rich system (sample PCPC6_01, Table 3), and the carbonate melt in the P-rich system contains 9.5 ± 0.9 wt% P2O5 (sample PCPC6_03, Table 3). However, in the Cl-rich system for the carbonate melt the Cl concentration remains low (0.9 ± 0.3 wt%, sample PCPC6_02, Table 3).
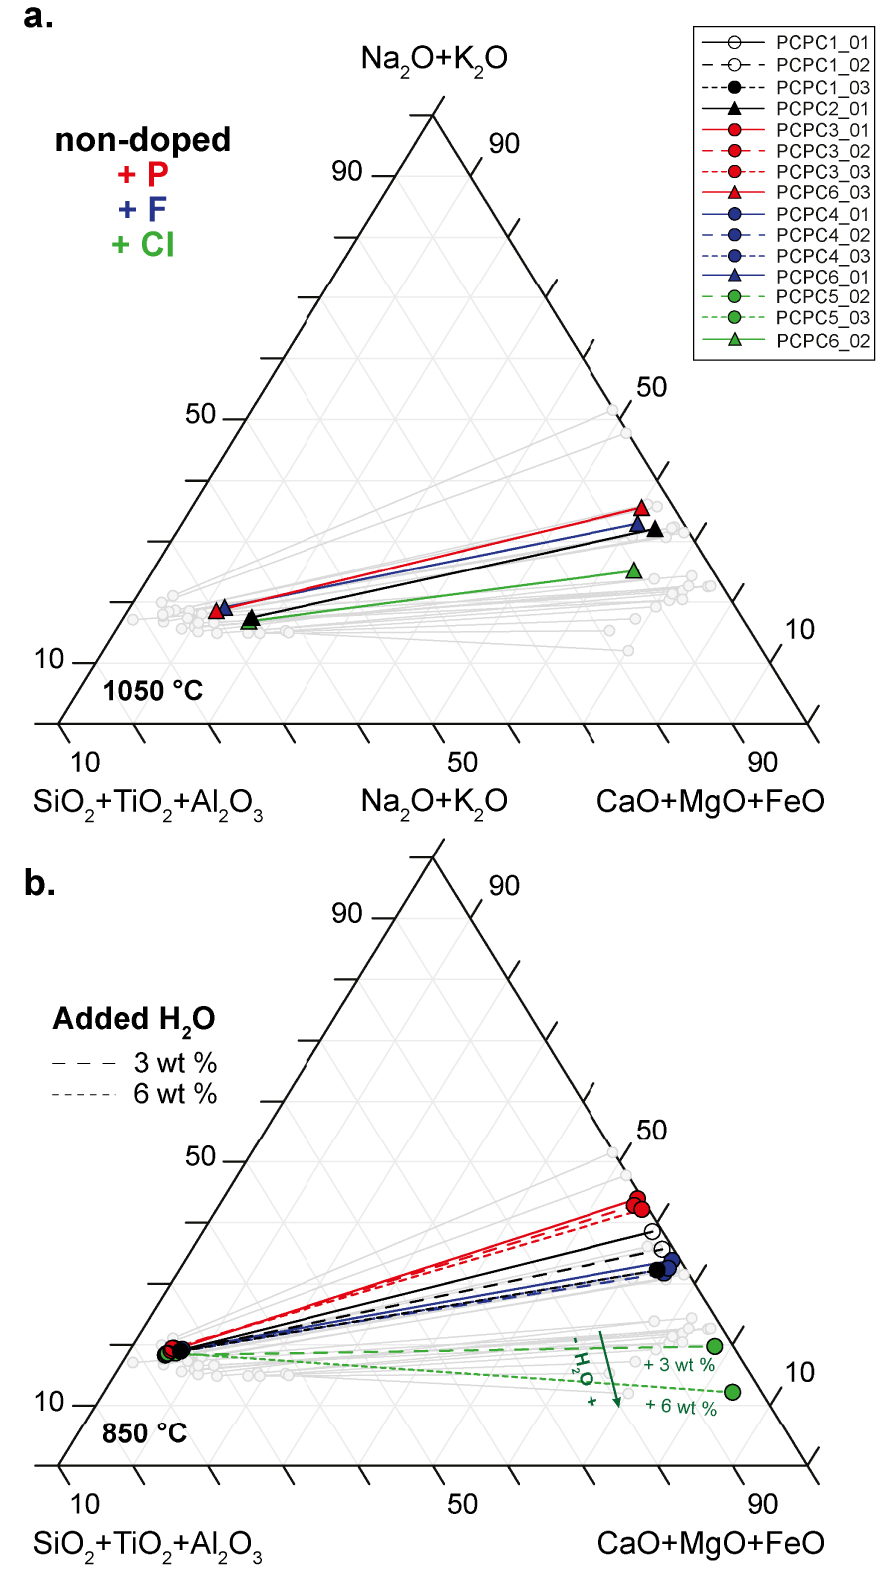
Hamilton projection of experimental immiscible silicate and carbonate liquids in the non-doped system and in P-, F- and Cl-rich systems at 0.8 GPa and 1050 °C (a) and 850 °C (b). Each line relates a pair of immiscible silicate and carbonate liquids in equilibrium at given P–T condition. Samples synthesized at both temperatures in the non-doped system (black), and in the systems doped in P (red), F (blue) and Cl (green) are represented, as well as hydrated samples (dashed line, 3 wt% of H2O; dotted lines: 6 wt% of H2O). The green arrow in (b) indicates the increase of sample H2O contents in the Cl-rich systems (green). Carbonate and silicate melts of nephelinite–phonolite composition from Nabyl et al. [2020] are shown in grey. Empty symbols correspond to samples suspected to not be in equilibrium (PCPC1_01 and PCPC1_02). Masquer
Hamilton projection of experimental immiscible silicate and carbonate liquids in the non-doped system and in P-, F- and Cl-rich systems at 0.8 GPa and 1050 °C (a) and 850 °C (b). Each line relates a pair of immiscible silicate and carbonate liquids in ... Lire la suite
At the lower temperature (850 °C, Figure 3b and Table 2), partial crystallisation changes the silicate melt composition from evolved nephelinite to phonolite type, i.e. from 45.8 ± 0.9 to 53.7 ± 0.8 wt% SiO2 (samples PCPC5_03 and PCPC4_01 respectively, Table 3) and 16.2 ± 0.6 to 18.0 ± 0.5 wt% Na2O + K2O (samples PCPC5_03 and PCPC3_03 respectively, Table 3). For all four chemical systems, the miscibility gap between the carbonate and silicate melts is enlarged as temperature decreases from 1050 to 850 °C (Figures 3a and b), with silicate melts getting closer to the (SiO2 + TiO2 + Al2O3) pole and carbonate melts getting closer to the (CaO + MgO + FeO) pole. Silicate melts present similar compositions for all the chemical systems (Figure 3b; Table 3) and for samples ± hydrated (dashed and dotted lines, 3 and 6 wt% of H2O respectively, Figure 3b). In contrast, the conjugate carbonate melts vary significantly in the four chemical systems. Carbonate melts are broadly richer in CaO with concentrations varying from 31.0 ± 1.4 to 36.8 ± 5.1 wt% (samples PCPC1_03 and PCPC5_03 respectively, see Table 3), except for the P-rich system, which shows lower CaO concentrations, between 24.4 ± 1.8 and 25.4 ± 2.8 wt% (samples PCPC3_01 and PCPC3_02, Table 3). Carbonate melts are also slightly richer in Na2O in the non-doped system and in the F- and P-rich systems, with concentrations varying from 14.7 ± 0.7 to 20.6 ± 0.7 wt% (samples PCPC1_01 and PCPC3_03 respectively, Table 3). On the contrary, the Na2O contents are lower in the Cl-rich system (<11 wt%, see Table 3). In fact, carbonate melts become much richer in CaO (35.1 ± 5.6 and 36.8 ± 5.1 wt% of CaO, samples PCPC5_02 and PCPC5_03 in the Table 3) and poorer in Na2O (8.2 ± 3.5 and 4.8 ± 2.3 wt% of Na2O, Table 3) and K2O (1.2 ± 0.7 and 0.8 ± 0.2, Table 3) with increasing bulk water content (from 3 to 6 wt%; see the green arrow in Figure 3b). The carbonate melts thus slightly deviate from the (Na2O + K2O) pole and evolve towards the (CaO + MgO + FeO) pole (Figure 3b). This water effect that was predominant in the Cl-rich system is not observed in the non-doped system or the P- and F-rich systems (Figure 3b).
Major element compositions of silicate and carbonate liquids (wt%) analysed by EMPA
| PCPC1_01 | PCPC1_02 | PCPC1_03 | PCPC1_04 | PCPC2_01 | PCPC3_01 | PCPC3_02 | ||||||||
|---|---|---|---|---|---|---|---|---|---|---|---|---|---|---|
| P (Gpa) | 0,8 | 0,8 | 0,8 | 0,8 | 0,8 | 0,8 | 0,8 | |||||||
| T (°C) | 850 | 850 | 850 | 850 | 1050 | 850 | 850 | |||||||
| Starting material | PhCbn1 | PhCbn1 | PhCbn1 | PhCbn1 | PhCbn1 | PhCbn2 | PhCbn2 | |||||||
| Silicate liquid | ||||||||||||||
| N | 8 | s.d. | 7 | s.d. | 5 | s.d. | 11 | s.d. | 8 | s.d. | 8 | s.d. | ||
| SiO2 | 53.08 | 0.91 | 52.55 | 1.40 | 48.81 | 0.48 | — | — | 43.78 | 0.65 | 51.18 | 0.53 | 49.80 | 0.36 |
| TiO2 | 0.38 | 0.10 | bdl | — | 0.40 | 0.08 | — | — | 0.52 | 0.09 | 0.44 | 0.08 | 0.51 | 0.05 |
| Al2O3 | 19.35 | 0.59 | 19.83 | 0.34 | 18.46 | 0.25 | — | — | 16.74 | 1.02 | 19.14 | 0.50 | 19.07 | 0.14 |
| FeO | 4.03 | 0.34 | 3.65 | 0.16 | 4.09 | 0.17 | — | — | 6.02 | 0.46 | 4.08 | 0.19 | 4.07 | 0.26 |
| MnO | bdl | — | bdl | — | bdl | — | — | — | 0.40 | 0.07 | bdl | — | bdl | — |
| MgO | 0.20 | 0.03 | 0.26 | 0.02 | 0.48 | 0.05 | — | — | 1.15 | 0.08 | 0.34 | 0.03 | 0.38 | 0.03 |
| CaO | 0.93 | 0.15 | 1.06 | 0.05 | 1.72 | 0.03 | — | — | 8.78 | 0.60 | 0.83 | 0.05 | 0.83 | 0.02 |
| Na2O | 11.16 | 0.12 | 11.07 | 0.48 | 11.56 | 0.31 | — | — | 11.87 | 0.53 | 11.68 | 0.23 | 11.57 | 0.22 |
| K2O | 6.60 | 0.20 | 6.47 | 0.39 | 5.69 | 0.27 | — | — | 4.38 | 0.29 | 6.15 | 0.16 | 6.39 | 0.15 |
| P2O5 | bdl | — | bdl | — | bdl | — | — | — | 0.30 | 0.06 | 0.20 | 0.03 | bdl | — |
| BaO | bdl | — | 0.15 | 0.01 | 0.20 | 0.01 | — | — | 0.37 | 0.03 | 0.14 | 0.01 | 0.15 | 0.02 |
| SrO | bdl | — | bdl | — | bdl | — | — | — | 0.44 | 0.05 | bdl | — | bdl | — |
| SO2 | bdl | — | bdl | — | bdl | — | — | — | bdl | — | bdl | — | bdl | — |
| F | 0.41 | 0.09 | 0.39 | 0.07 | 0.32 | 0.06 | — | — | 0.55 | 0.11 | 0.41 | 0.07 | 0.37 | 0.08 |
| Cl | 0.07 | 0.01 | 0.07 | 0.01 | 0.07 | 0.01 | — | — | 0.06 | 0.01 | 0.08 | 0.01 | 0.08 | 0.01 |
| Total | 96.21 | — | 95.51 | — | 91.80 | — | — | — | 95.37 | — | 94.68 | — | 93.23 | — |
| Na2O + K2O | 17.76 | 0.32 | 17.54 | 0.87 | 17.26 | 0.58 | — | — | 16.25 | 0.82 | 17.83 | 0.38 | 17.96 | 0.37 |
| ASI [Al2O3/(CaO + Na2O + K2O)] | 0.71 | — | 0.73 | — | 0.65 | — | — | — | 0.42 | — | 0.70 | — | 0.69 | — |
| NBO/T | 0.25 | — | 0.24 | — | 0.32 | — | — | — | 0.75 | — | 0.27 | — | 0.28 | — |
| (Na2O + K2O)/(CaO + MgO) | 11.54 | — | 9.79 | — | 5.80 | — | — | — | 1.29 | — | 10.91 | — | 10.44 | — |
| AI [Al2O3 − (Na2O + K2O)] | −0.04 | — | -0.04 | — | −0.05 | — | — | — | −0.05 | — | −0.05 | — | −0.05 | — |
| Carbonate liquid | ||||||||||||||
| N | 6 | s.d. | 8 | s.d. | 8 | s.d. | 8 | s.d. | 9 | s.d. | 6 | s.d. | 6 | s.d. |
| SiO2 | 0.51 | 0.13 | 0.79 | 0.21 | 1.75 | 0.35 | 0.22 | 0.07 | 2.16 | 0.46 | 0.33 | 0.17 | 0.87 | 0.50 |
| TiO2 | bdl | — | bdl | — | bdl | — | bdl | — | bdl | — | bdl | — | bdl | — |
| Al2O3 | bdl | — | bdl | — | 0.28 | 0.12 | bdl | — | 0.28 | 0.07 | bdl | — | bdl | — |
| FeO | 0.41 | 0.09 | 0.37 | 0.10 | 0.62 | 0.09 | 1.19 | 0.21 | 0.98 | 0.16 | 2.04 | 1.06 | 1.94 | 0.34 |
| MnO | 0.51 | 0.14 | 0.40 | 0.08 | 0.50 | 0.15 | bdl | — | 0.38 | 0.06 | 0.66 | 0.05 | 0.60 | 0.14 |
| MgO | 1.61 | 0.22 | 1.70 | 0.17 | 1.96 | 0.18 | 1.07 | 0.07 | 1.57 | 0.09 | 3.00 | 0.84 | 2.58 | 0.71 |
| CaO | 30.94 | 1.59 | 31.25 | 2.33 | 30.99 | 1.42 | 31.58 | 0.51 | 34.34 | 1.18 | 24.43 | 1.82 | 24.95 | 1.37 |
| Na2O | 18.52 | 1.70 | 16.51 | 1.65 | 14.72 | 0.72 | 18.62 | 0.79 | 15.67 | 0.52 | 20.49 | 1.25 | 19.51 | 0.89 |
| K2O | 2.55 | 0.21 | 2.33 | 0.22 | 2.14 | 0.24 | 3.22 | 0.18 | 2.89 | 0.22 | 2.79 | 0.16 | 3.13 | 0.12 |
| P2O5 | 1.92 | 0.24 | 1.82 | 0.16 | 1.86 | 0.17 | 1.94 | 0.12 | 2.75 | 0.26 | 1.69 | 0.06 | 2.17 | 0.41 |
| BaO | 1.16 | 0.14 | 1.24 | 0.07 | 1.30 | 0.10 | 1.01 | 0.07 | 0.99 | 0.07 | 2.01 | 0.85 | 1.46 | 0.56 |
| SrO | 1.66 | 0.15 | 1.69 | 0.20 | 1.65 | 0.09 | 1.76 | 0.13 | 1.56 | 0.14 | 1.96 | 0.30 | 1.68 | 0.29 |
| SO2 | 0.28 | 0.05 | 0.33 | 0.12 | 0.28 | 0.04 | 0.10 | 0.01 | 0.13 | 0.03 | 0.36 | 0.10 | 0.34 | 0.07 |
| F | 2.91 | 0.13 | 2.95 | 0.32 | 2.28 | 0.25 | 3.15 | 0.23 | 2.07 | 0.22 | 2.99 | 1.34 | 2.38 | 0.43 |
| Cl | 0.15 | 0.04 | 0.12 | 0.02 | 0.05 | 0.01 | 0.56 | 0.06 | 0.31 | 0.01 | 0.41 | 0.26 | 0.20 | 0.10 |
| Total | 63.12 | — | 61.51 | — | 60.37 | — | 64.43 | — | 66.08 | — | 63.15 | — | 61.79 | — |
| Na2O + K2O | 21.07 | 1.91 | 18.84 | 1.86 | 16.86 | 0.96 | 21.84 | 0.97 | 18.56 | 0.75 | 23.28 | 1.41 | 22.64 | 1.00 |
| PCPC3_03 | PCPC3_04 | PCPC4_01 | PCPC4_02 | PCPC4_03 | PCPC4_04 | |||||||||
| P (Gpa) | 0.8 | 0.8 | 0.8 | 0.8 | 0.8 | 0.8 | ||||||||
| T (°C) | 850 | 850 | 850 | 850 | 850 | 850 | ||||||||
| Starting material | PhCbn2 | PhCbn2 | PhCbn3 | PhCbn3 | PhCbn3 | PhCbn3 | ||||||||
| Silicate liquid | ||||||||||||||
| N | 8 | s.d. | 6 | s.d. | 11 | s.d. | 8 | s.d. | ||||||
| SiO2 | 50.15 | 0.57 | — | — | 53.67 | 0.81 | 47.83 | 0.68 | 50.36 | 0.26 | — | — | ||
| TiO2 | 0.41 | 0.09 | — | — | 0.40 | 0.05 | 0.41 | 0.06 | 0.37 | 0.10 | — | — | ||
| Al2O3 | 19.33 | 0.35 | — | — | 19.10 | 0.46 | 18.03 | 0.34 | 19.16 | 0.37 | — | — | ||
| FeO | 4.08 | 0.35 | — | — | 4.32 | 0.31 | 4.36 | 0.21 | 4.04 | 0.27 | — | — | ||
| MnO | bdl | — | — | — | bdl | — | bdl | — | 0.28 | 0.04 | — | — | ||
| MgO | 0.33 | 0.03 | — | — | 0.26 | 0.05 | 0.34 | 0.02 | 0.26 | 0.02 | — | — | ||
| CaO | 0.81 | 0.04 | — | — | 0.81 | 0.08 | 1.56 | 0.06 | 1.12 | 0.05 | — | — | ||
| Na2O | 11.88 | 0.13 | — | — | 10.99 | 0.10 | 11.63 | 0.11 | 11.42 | 0.21 | — | — | ||
| K2O | 6.15 | 0.35 | — | — | 6.08 | 0.08 | 5.61 | 0.21 | 5.81 | 0.13 | — | — | ||
| P2O5 | 0.21 | 0.04 | — | — | bdl | — | bdl | — | bdl | — | — | — | ||
| BaO | 0.16 | 0.03 | — | — | 0.14 | 0.01 | 0.17 | 0.04 | 0.14 | 0.01 | — | — | ||
| SrO | bdl | — | — | — | bdl | — | bdl | — | bdl | — | — | — | ||
| SO2 | bdl | — | — | — | bdl | — | bdl | — | bdl | — | — | — | ||
| F | 0.37 | 0.06 | — | — | 1.38 | 0.12 | 1.84 | 0.11 | 1.66 | 0.08 | — | — | ||
| Cl | 0.08 | 0.02 | — | — | 0.07 | 0.01 | 0.10 | 0.01 | 0.09 | 0.02 | — | — | ||
| Total | 93.96 | — | — | — | 97.21 | — | 91.88 | — | 94.71 | — | — | — | ||
| Na2O + K2O | 18.03 | 0.49 | — | — | 17.07 | 0.18 | 17.24 | 0.32 | 17.23 | 0.34 | — | — | ||
| ASI [Al2O3/(CaO + Na2O + K2O)] | 0.70 | — | — | — | 0.73 | — | 0.64 | — | 0.71 | — | — | — | ||
| NBO/T | 0.28 | — | — | — | 0.24 | — | 0.33 | — | 0.26 | — | — | — | ||
| (Na2O + K2O)/(CaO + MgO) | 11.45 | — | — | — | 11.65 | — | 6.82 | — | 9.36 | — | — | — | ||
| AI [Al2O3-(Na2O + K2O)] | −0.05 | — | — | — | −0.04 | — | −0.05 | — | −0.04 | — | — | — | ||
| Carbonate liquid | ||||||||||||||
| N | 7 | s.d. | 4 | s.d. | 9 | s.d. | 11 | s.d. | 10 | s.d. | 9 | s.d. | ||
| SiO2 | 0.51 | 0.25 | 0.33 | 0.05 | 0.47 | 0.09 | 1.54 | 0.25 | 0.98 | 0.38 | 0.25 | 0.06 | ||
| TiO2 | bdl | — | 0.29 | 0.08 | bdl | — | bdl | — | bdl | — | bdl | — | ||
| Al2O3 | bdl | — | bdl | — | 0.15 | 0.01 | 0.31 | 0.07 | 0.28 | 0.08 | bdl | — | ||
| FeO | 2.57 | 0.70 | 3.34 | 0.17 | 0.36 | 0.09 | 0.40 | 0.06 | 0.40 | 0.09 | 2.79 | 0.51 | ||
| MnO | 0.70 | 0.15 | 0.70 | 0.06 | 0.58 | 0.15 | 0.52 | 0.10 | 0.48 | 0.10 | 0.44 | 0.12 | ||
| MgO | 2.89 | 0.74 | 2.18 | 0.23 | 2.88 | 0.29 | 2.39 | 0.06 | 2.53 | 0.12 | 2.14 | 0.19 | ||
| CaO | 25.43 | 2.82 | 25.44 | 0.83 | 34.27 | 0.32 | 34.65 | 0.37 | 33.92 | 0.83 | 30.59 | 1.68 | ||
| Na2O | 20.62 | 0.74 | 20.95 | 1.04 | 17.46 | 0.29 | 16.03 | 0.35 | 16.22 | 1.16 | 20.49 | 0.77 | ||
| K2O | 2.22 | 0.75 | 3.45 | 0.19 | 1.95 | 0.11 | 2.17 | 0.10 | 2.10 | 0.11 | 2.44 | 0.18 | ||
| P2O5 | 2.99 | 0.78 | 2.76 | 0.89 | 1.81 | 0.14 | 1.96 | 0.11 | 1.92 | 0.19 | 1.83 | 0.28 | ||
| BaO | 1.54 | 0.35 | 1.46 | 0.19 | 1.13 | 0.06 | 1.01 | 0.03 | 0.98 | 0.06 | 0.50 | 0.10 | ||
| SrO | 1.65 | 0.22 | 1.75 | 0.14 | 1.93 | 0.10 | 1.85 | 0.12 | 2.19 | 0.21 | 1.21 | 0.12 | ||
| SO2 | 0.31 | 0.04 | 0.31 | 0.09 | 0.25 | 0.03 | 0.30 | 0.04 | 0.38 | 0.16 | 0.17 | 0.04 | ||
| F | 2.54 | 0.63 | 3.57 | 0.40 | 10.92 | 0.33 | 11.46 | 0.24 | 10.70 | 0.24 | 11.35 | 0.97 | ||
| Cl | 0.37 | 0.14 | 0.74 | 0.08 | 0.53 | 0.02 | 0.46 | 0.03 | 0.55 | 0.01 | 0.35 | 0.15 | ||
| Total | 64.34 | — | 67.26 | — | 74.67 | — | 75.03 | — | 73.63 | — | 74.54 | — | ||
| Na2O + K2O | 22.83 | 1.49 | 24.40 | 1.23 | 19.42 | 0.40 | 18.20 | 0.45 | 18.32 | 1.27 | 22.93 | 0.95 | ||
| PCPC5_02 | PCPC5_03 | PCPC5_04 | PCPC6_01 | PCPC6_02 | PCPC6_03 | |||||||||
| P (Gpa) | 0.8 | 0.8 | 0.8 | 0.8 | 0.8 | 0.8 | ||||||||
| T (°C) | 850 | 850 | 850 | 1050 | 1050 | 850 | ||||||||
| Starting material | PhCbn5 | PhCbn6 | PhCbn7 | PhCbn3 | PhCbn4 | PhCbn2 | ||||||||
| Silicate liquid | ||||||||||||||
| N | 7 | s.d. | 18 | s.d. | 17 | s.d. | 3 | s.d. | 6 | s.d. | ||||
| SiO2 | 50.07 | 0.45 | 45.79 | 0.86 | — | — | 45.98 | 0.47 | 42.92 | 0.22 | 46.32 | 0.60 | ||
| TiO2 | 0.30 | — | bdl | — | — | — | 0.52 | 0.10 | 0.42 | 0.03 | 0.48 | 0.10 | ||
| Al2O3 | 20.54 | 0.32 | 19.54 | 0.28 | — | — | 17.00 | 0.28 | 16.34 | 0.34 | 18.50 | 0.25 | ||
| FeO | 2.40 | 0.25 | 2.48 | 0.19 | — | — | 6.12 | 0.34 | 5.34 | 0.24 | 5.69 | 0.19 | ||
| MnO | bdl | — | bdl | — | — | — | 0.32 | 0.05 | bdl | — | bdl | — | ||
| MgO | 0.34 | 0.02 | 0.45 | 0.04 | — | — | 0.66 | 0.04 | 1.02 | 0.03 | 0.77 | 0.03 | ||
| CaO | 2.08 | 0.05 | 2.64 | 0.04 | — | — | 4.99 | 0.30 | 9.00 | 0.19 | 4.64 | 0.17 | ||
| Na2O | 11.65 | 0.20 | 11.18 | 0.41 | — | — | 12.51 | 0.39 | 11.40 | 0.23 | 12.78 | 0.26 | ||
| K2O | 5.28 | 0.14 | 5.02 | 0.19 | — | — | 5.26 | 0.19 | 3.75 | 0.06 | 4.62 | 0.23 | ||
| P2O5 | bdl | — | bdl | — | — | — | 0.15 | 0.05 | 0.37 | 0.05 | 0.95 | 0.11 | ||
| BaO | 0.17 | 0.02 | 0.25 | 0.04 | — | — | 0.30 | 0.05 | 0.34 | 0.05 | 0.29 | 0.05 | ||
| SrO | bdl | — | bdl | — | — | — | 0.31 | 0.06 | 0.52 | 0.04 | bdl | — | ||
| SO2 | bdl | — | bdl | — | — | — | bdl | — | bdl | — | bdl | — | ||
| F | 0.43 | 0.07 | 1.00 | 0.07 | — | — | 3.85 | 0.83 | 0.73 | 0.03 | 0.56 | 0.07 | ||
| Cl | 0.77 | 0.01 | 0.83 | 0.02 | — | — | 0.09 | 0.01 | 1.29 | 0.02 | 0.11 | 0.02 | ||
| Total | 94.03 | — | 89.18 | — | — | — | 98.07 | — | 93.44 | — | 95.69 | — | ||
| Na2O + K2O | 16.94 | 0.34 | 16.21 | 0.59 | — | — | 17.78 | 0.58 | 15.15 | 0.28 | 17.40 | 0.49 | ||
| ASI [Al2O3/(CaO + Na2O + K2O)] | 0.72 | — | 0.68 | — | — | — | 0.48 | — | 0.42 | — | 0.54 | — | ||
| NBO/T | 0.23 | — | 0.28 | — | — | — | 0.59 | — | 0.73 | — | 0.52 | — | ||
| (Na2O + K2O)/(CaO + MgO) | 5.37 | — | 4.01 | — | — | — | 2.45 | — | 1.20 | — | 2.51 | — | ||
| AI [Al2O3-(Na2O + K2O)] | −0.03 | — | −0.03 | — | — | — | −0.06 | — | −0.04 | — | −0.05 | — | ||
| Carbonate liquid | ||||||||||||||
| N | 7 | s.d. | 16 | s.d. | 11 | s.d. | 16 | s.d. | 6 | s.d. | 7 | s.d. | ||
| SiO2 | 1.02 | 0.36 | 1.49 | 0.68 | 0.18 | 0.04 | 2.87 | 0.68 | 4.51 | 0.54 | 1.97 | 0.46 | ||
| TiO2 | — | — | bdl | — | bdl | — | 0.18 | 0.01 | bdl | — | bdl | — | ||
| Al2O3 | bdl | — | 0.30 | 0.19 | bdl | — | 0.60 | 0.19 | 0.87 | 0.22 | 0.38 | 0.11 | ||
| FeO | 0.32 | 0.07 | 0.43 | 0.17 | 1.89 | 0.27 | 1.25 | 0.23 | 1.49 | 0.24 | 1.78 | 0.14 | ||
| MnO | 0.51 | 0.13 | 0.58 | 0.16 | 0.42 | 0.09 | 0.41 | 0.06 | 0.50 | 0.07 | 0.44 | 0.07 | ||
| MgO | 1.70 | 0.30 | 1.86 | 0.48 | 0.89 | 0.11 | 2.10 | 0.10 | 1.73 | 0.26 | 2.09 | 0.24 | ||
| CaO | 35.10 | 5.62 | 36.82 | 5.11 | 29.35 | 1.89 | 33.10 | 0.73 | 29.94 | 1.95 | 29.37 | 0.94 | ||
| Na2O | 8.18 | 3.53 | 4.84 | 2.34 | 15.94 | 1.46 | 16.66 | 0.33 | 10.09 | 1.56 | 17.14 | 0.68 | ||
| K2O | 1.19 | 0.67 | 0.82 | 0.21 | 3.95 | 0.33 | 3.01 | 0.19 | 2.92 | 0.20 | 2.49 | 0.12 | ||
| P2O5 | 1.53 | 0.40 | 1.48 | 0.44 | 1.49 | 0.13 | 1.75 | 0.20 | 1.98 | 1.03 | 9.47 | 0.95 | ||
| BaO | 1.53 | 0.25 | 1.60 | 0.12 | 0.82 | 0.10 | 1.04 | 0.03 | 0.96 | 0.10 | 1.23 | 0.19 | ||
| SrO | 2.22 | 0.22 | 2.17 | 0.27 | 1.43 | 0.14 | 1.59 | 0.13 | 1.54 | 0.15 | 1.60 | 0.19 | ||
| SO2 | 0.25 | 0.08 | 0.38 | 0.25 | 0.27 | 0.03 | 0.25 | 0.02 | 0.26 | 0.03 | 0.37 | 0.09 | ||
| F | 3.52 | 0.80 | 5.63 | 0.75 | — | — | 11.79 | 0.67 | 3.62 | 0.76 | 2.34 | 0.27 | ||
| Cl | 0.73 | 0.25 | 0.59 | 0.30 | 3.23 | 2.59 | 0.51 | 0.03 | 0.91 | 0.33 | 0.48 | 0.14 | ||
| Total | 57.80 | — | 59.00 | — | 59.85 | — | 77.10 | — | 61.33 | — | 71.16 | — | ||
| Na2O + K2O | 9.37 | 4.20 | 5.66 | 2.55 | 19.89 | 1.78 | 19.67 | 0.52 | 13.02 | 1.75 | 19.63 | 0.80 | ||
N: number of analysis; bdl: below detection limit; s.d.: standard deviation; ASI: alumina saturation index; AI: alkaline index; NBO/T: non-bridging oxygen per tetrahedrally coordinated cation. The ASI, NBO/T, alkali/alkaline-earth ratio and NBO/T are in molar fractions; Italics: samples in which equilibrium between carbonate and silicate liquids is assumed not to have been attained.
A second carbonate liquid phase is observed in two samples from the non-doped system that were synthesized at 850 °C (PCPC1_01 and PCPC1_02, Table 2; see Figure 3b, empty black circles). In comparison to the main carbonate melts (Table 3), this second carbonate liquid is rare, presents higher CaO concentrations and higher totals during the EMPA analyses (see Supplementary Table 1). The occurrence of this second carbonate phase suggests that the equilibrium was not achieved in these two samples. When plotted in the chemical diagrams (see results and discussion sections, empty black circles in figures), the corresponding data points are outliers. For the sake of clarity, these two samples are included in the diagrams, but are not discussed further here.
The F, Cl and P2O5 silicate melt concentrations at 850 °C for all the systems are lower than those at 1050 °C. In the non-doped system (see Table 2), the silicate melts contain relatively small amounts of F (0.3–0.4 wt%), Cl (0.07 wt%), and P2O5 is below the detection limit (samples PCPC1, Table 3). The concentrations are slightly higher in F, Cl or P doped systems (Table 2), varying from 1.4 to 1.8 wt% for F in the F-rich system (samples PCPC4, Table 3), 0.6 to 0.8 wt% for the Cl in the Cl-rich system (samples PCPC5, Table 3) and only around 0.2 wt% for the P2O5 in the P-rich system (samples PCPC3, Table 3). Carbonate melts are also more enriched in those elements at the higher temperature, although P2O5 and Cl carbonate melt concentrations remain low in the P- and Cl-doped systems respectively (see samples PCPC3 and PCPC5_05, Table 3).
Trace element concentrations—including the REE—of both silicate and carbonate melts are presented in Table 4. At 1050 °C, the silicate melts contain 18.2 ± 0.5 to 35.9 ± 0.7 ppm of La as representative of other LREE (light REE), and 32.1 ± 0.9 to 50.3 ± 0.7 ppm of Lu, as representative of other HREE (high REE; Table 4), whereas REE concentrations in the carbonate melts are higher and vary from 87.6 ± 2.8 to 108.1 ± 5.6 for La and 50.0 ± 2.3 to 74.9 ± 2.7 ppm for Lu (Table 4). The silicate melt REE concentrations are lower at 850 °C, varying from 1.8 ± 0.0 to 8.4 ± 0.1 ppm of La, and from 3.9 ± 0.0 to 17.87 ± 3.1 ppm of Lu (Table 4). At this temperature, carbonate melt REE concentrations are generally much higher than at 1050 °C, varying from 77.7 ± 5.4 to 140.5 ± 9.8 ppm and 51.6 ± 3.3 to 116.2 ± 5.2 for La and Lu respectively (Table 4). In the Cl-rich system, the middle REE and high REE (MREE and HREE) concentrations decrease slightly in the carbonate melts with increasing water content (67.0 ± 1.9 to 34.8 ± 5.0 ppm of Gd and 34.0 ± 1.3 to 13.0 ± 1.9 ppm of Lu, samples PCPC5_02 to PCPC5_03, from 3 to 6 wt% of water; Table 4), whereas no significant variation in concentration is observed in the silicate melts (Table 4). This behaviour is not observed in other chemical systems.
3.3. REE partitioning between carbonate and silicate liquids
Trace element partitioning is defined using the Nernst partition coefficient D which corresponds to the mass concentration ratio in ppm of the element x in the carbonate liquid (CL) and the silicate liquid (SL;
Figure 4 presents REE partition coefficients for the four chemical systems investigated. For all samples and for all experimental conditions, REE partition coefficients vary greatly, by almost two orders of magnitude. The large

REE partition coefficients (DCL∕SL) between carbonate and silicate liquids (CL and SL), in the non-doped system in black, the P-rich system in red, the F-rich system in blue and the Cl-rich system in green. Samples synthesized at 850 °C (circles) and at 1050 °C (triangles) are shown in all chemical systems, as well as hydrated samples (dashed line, 3 wt% of H2O; dotted lines: 6 wt% of H2O). Empty symbols correspond to samples suspected to not be in equilibrium (PCPC1_01 and PCPC1_02). Masquer
REE partition coefficients (DCL∕SL) between carbonate and silicate liquids (CL and SL), in the non-doped system in black, the P-rich system in red, the F-rich system in blue and the Cl-rich system in green. Samples synthesized at 850 °C (circles) ... Lire la suite
No clear effect of water on REE partitioning is identified in the non-doped system and the P- and F-rich systems (Figure 4 and Table 5). In the Cl-rich system, the REE partition coefficients decrease with the addition of water (3 and 6 wt% of water, samples PCPC5_02 and PCPC5_03, Table 2), from 21.3 ± 1.6 to 14.8 ± 2.0 for
Trace element concentrations of silicate and carbonate liquids (ppm) measured by LA-ICP-MS
| PCPC1_01∗ | PCPC1_02∗ | PCPC1_03∗ | PCPC1_04∗ | PCPC2_01∗ | PCPC3_01∗ | |||||||
|---|---|---|---|---|---|---|---|---|---|---|---|---|
| P (Gpa) | 0.8 | 0.8 | 0.8 | 0.8 | 0.8 | |||||||
| T (°C) | 850 | 850 | 850 | 1050 | 850 | |||||||
| Starting material | PhCbn1 | PhCbn1 | PhCbn1 | PhCbn1 | PhCbn2 | |||||||
| Silicate liquid | ||||||||||||
| N | 7 | s.d. | 7 | s.d. | 6 | s.d. | 9 | s.d. | 7 | s.d. | ||
| Sc | 15.17 | 3.54 | 34.96 | 9.76 | 21.84 | 2.90 | — | — | 82.89 | 4.24 | 39.25 | 1.95 |
| Ti | 1722.11 | 126.26 | 2282.59 | 426.48 | 862.60 | 52.74 | — | — | 2239.38 | 98.18 | 1867.08 | 114.38 |
| Cr | bdl | — | 6.07 | 1.61 | 1.66 | 0.32 | — | — | 105.21 | 5.28 | 3.56 | 1.88 |
| Mn | 903.56 | 56.98 | 1249.54 | 445.68 | 472.90 | 29.53 | — | — | 2159.03 | 70.74 | 537.31 | 17.23 |
| Sr | 450.72 | 16.06 | 730.14 | 95.67 | 397.74 | 2.44 | — | — | 2572.65 | 43.23 | 378.68 | 4.86 |
| Zr | 580.26 | 43.20 | 755.17 | 128.74 | 279.51 | 16.76 | — | — | 523.19 | 31.47 | 464.28 | 12.99 |
| Nb | 208.32 | 14.51 | 295.54 | 58.84 | 86.68 | 5.53 | — | — | 176.48 | 6.98 | 180.16 | 10.04 |
| Ba | 777.66 | 22.57 | 1171.89 | 201.80 | 622.28 | 8.40 | — | — | 2544.81 | 100.89 | 709.05 | 15.87 |
| La | 6.68 | 1.08 | 10.92 | 2.21 | 2.97 | 0.31 | — | — | 33.60 | 1.38 | 2.10 | 0.10 |
| Ce | 11.66 | 1.69 | 19.87 | 4.01 | 4.90 | 0.60 | — | — | 41.67 | 2.20 | 2.85 | 0.15 |
| Pr | 8.18 | 1.28 | 13.96 | 2.75 | 3.54 | 0.44 | — | — | 34.81 | 1.66 | 2.37 | 0.15 |
| Nd | 8.50 | 1.30 | 14.35 | 2.69 | 3.60 | 0.44 | — | — | 36.38 | 1.61 | 2.38 | 0.15 |
| Sm | 10.90 | 1.90 | 18.12 | 3.35 | 4.10 | 0.56 | — | — | 42.00 | 2.30 | 2.87 | 0.16 |
| Eu | 13.11 | 2.09 | 22.11 | 3.77 | 4.85 | 0.70 | — | — | 52.00 | 4.21 | 3.57 | 0.23 |
| Gd | 13.41 | 2.50 | 19.50 | 3.55 | 4.44 | 0.71 | — | — | 36.74 | 1.61 | 2.99 | 0.09 |
| Tb | 16.47 | 3.23 | 23.05 | 4.18 | 5.47 | 0.87 | — | — | 39.11 | 1.82 | 3.92 | 0.35 |
| Dy | 19.24 | 2.62 | 30.66 | 5.85 | 6.04 | 1.08 | — | — | 47.94 | 2.80 | 5.26 | 0.49 |
| Y | 23.46 | 3.38 | 35.93 | 7.17 | 6.88 | 1.16 | — | — | 52.38 | 2.92 | 6.78 | 0.64 |
| Ho | 21.41 | 3.29 | 33.41 | 6.63 | 6.65 | 1.27 | — | — | 51.99 | 3.21 | 6.16 | 0.61 |
| Er | 22.16 | 3.61 | 35.07 | 6.85 | 6.59 | 1.27 | — | — | 47.54 | 2.70 | 6.78 | 0.71 |
| Yb | 32.06 | 3.89 | 48.50 | 9.54 | 9.11 | 1.72 | — | — | 58.23 | 4.26 | 10.90 | 1.08 |
| Lu | 29.42 | 4.06 | 45.02 | 9.25 | 8.90 | 1.61 | — | — | 52.45 | 4.03 | 11.02 | 1.12 |
| Hf | 42.35 | 18.44 | 42.85 | 14.25 | 15.37 | 1.18 | — | — | 23.17 | 2.78 | 15.84 | 1.02 |
| Ta | 15.29 | 1.89 | 15.59 | 4.41 | 5.16 | 0.72 | — | — | 13.42 | 1.17 | 8.95 | 2.80 |
| Carbonate liquid | ||||||||||||
| N | 7 | s.d. | 8 | s.d. | 8 | s.d. | 8 | s.d. | 9 | s.d. | 6 | s.d. |
| Sc | 16.55 | 5.58 | 25.72 | 8.22 | 36.68 | 3.68 | 5.91 | 0.22 | 22.82 | 1.82 | 67.67 | 9.06 |
| Ti | 417.75 | 71.91 | 435.16 | 69.26 | 635.91 | 66.01 | 409.73 | 19.12 | 512.03 | 37.31 | 524.79 | 162.22 |
| Cr | — | 0.60 | 4.82 | 0.85 | 9.57 | 1.03 | 3.46 | 0.34 | 36.49 | 1.65 | 4.00 | 2.08 |
| Mn | 2856.29 | 336.42 | 3187.73 | 618.01 | 3047.76 | 286.54 | 1976.40 | 64.70 | 2164.52 | 82.90 | 4819.84 | 598.04 |
| Sr | 10765.74 | 186.60 | 11208.43 | 521.58 | 10494.11 | 272.33 | 10980.47 | 308.52 | 10543.97 | 151.78 | 9573.38 | 166.70 |
| Zr | 12.66 | 3.19 | 13.89 | 2.12 | 29.88 | 4.17 | 29.38 | 1.71 | 22.59 | 5.48 | 17.15 | 12.49 |
| Nb | 123.19 | 8.08 | 115.54 | 9.70 | 119.03 | 10.82 | 145.17 | 8.26 | 96.08 | 5.11 | 87.58 | 24.27 |
| Ba | 8306.41 | 374.70 | 8108.73 | 627.56 | 8532.66 | 584.38 | 6905.15 | 377.24 | 7382.78 | 327.68 | 8069.63 | 581.14 |
| La | 91.07 | 1.98 | 116.82 | 6.49 | 87.67 | 3.65 | 90.47 | 4.53 | 72.46 | 2.86 | 78.08 | 7.79 |
| Ce | 93.48 | 2.08 | 122.93 | 8.30 | 89.68 | 3.12 | 96.01 | 4.06 | 70.92 | 3.68 | 77.12 | 7.43 |
| Pr | 76.58 | 2.16 | 106.25 | 5.08 | 76.86 | 2.96 | 74.04 | 2.62 | 58.55 | 2.79 | 62.00 | 6.58 |
| Nd | 78.65 | 2.30 | 105.17 | 5.24 | 77.34 | 2.47 | 75.45 | 2.26 | 59.56 | 2.77 | 62.59 | 5.46 |
| Sm | 75.31 | 2.60 | 104.14 | 5.49 | 71.88 | 2.43 | 75.98 | 2.65 | 59.58 | 4.04 | 58.47 | 10.20 |
| Eu | 79.58 | 3.70 | 113.03 | 5.70 | 75.24 | 2.78 | 76.19 | 1.88 | 67.33 | 6.10 | 68.66 | 11.71 |
| Gd | 76.86 | 3.68 | 97.65 | 3.41 | 70.44 | 2.80 | 69.95 | 1.78 | 49.04 | 2.51 | 56.22 | 10.39 |
| Tb | 67.96 | 4.73 | 92.25 | 7.70 | 71.14 | 3.45 | 61.83 | 1.41 | 45.09 | 2.29 | 61.10 | 11.06 |
| Dy | 70.10 | 4.78 | 103.01 | 10.52 | 68.82 | 2.97 | 63.68 | 1.63 | 50.73 | 3.25 | 75.93 | 16.02 |
| Y | 76.37 | 4.96 | 113.69 | 10.32 | 74.80 | 4.51 | 72.33 | 2.32 | 57.64 | 3.96 | 88.99 | 18.30 |
| Ho | 70.32 | 5.51 | 102.89 | 10.96 | 68.12 | 3.74 | 62.39 | 1.70 | 51.94 | 3.89 | 75.80 | 14.71 |
| Er | 59.78 | 4.72 | 89.49 | 11.25 | 59.12 | 3.44 | 53.15 | 1.53 | 43.34 | 3.14 | 77.41 | 13.70 |
| Yb | 59.02 | 5.90 | 90.03 | 14.80 | 58.81 | 3.93 | 46.64 | 1.18 | 42.16 | 3.92 | 86.84 | 19.02 |
| Lu | 50.68 | 5.59 | 78.83 | 13.92 | 51.55 | 3.33 | 37.47 | 1.06 | 36.27 | 3.45 | 80.26 | 17.71 |
| Hf | 0.52 | 0.20 | 0.48 | 0.09 | 1.08 | 0.14 | 0.61 | 0.06 | 0.64 | 0.11 | 0.48 | 0.39 |
| Ta | 1.29 | 0.13 | 1.08 | 0.26 | 1.73 | 0.23 | 2.57 | 0.42 | 2.77 | 0.44 | 0.68 | 0.29 |
| PCPC3_02∗ | PCPC3_03∗ | PCPC4_01∗ | PCPC4_02∗ | PCPC4_03∗ | PCPC4_04∗ | |||||||
| P (Gpa) | 0.8 | 0.8 | 0.8 | 0.8 | 0.8 | |||||||
| T (°C) | 850 | 850 | 850 | 850 | 850 | |||||||
| Starting material | PhCbn2 | PhCbn2 | PhCbn3 | PhCbn3 | PhCbn3 | |||||||
| Silicate liquid | ||||||||||||
| N | 7 | s.d. | 6 | s.d. | 10 | s.d. | 7 | s.d. | 7 | s.d. | ||
| Sc | 39.91 | 1.22 | 34.95 | 0.65 | 50.18 | 5.94 | 41.81 | 1.33 | 35.83 | 1.34 | — | — |
| Ti | 1760.76 | 70.24 | 1757.33 | 62.49 | 1748.28 | 167.15 | 1833.56 | 25.31 | 1797.32 | 24.89 | — | — |
| Cr | 3.40 | 0.51 | 2.24 | 0.51 | 5.87 | 4.27 | 2.91 | 0.21 | 2.66 | 0.60 | — | — |
| Mn | 558.63 | 15.79 | 513.90 | 7.26 | 808.71 | 98.81 | 957.86 | 21.90 | 770.69 | 14.67 | — | — |
| Sr | 374.99 | 4.69 | 362.90 | 2.65 | 402.67 | 23.67 | 659.56 | 22.10 | 514.72 | 17.37 | — | — |
| Zr | 453.15 | 13.88 | 452.70 | 21.67 | 540.17 | 42.31 | 486.15 | 11.39 | 483.61 | 5.61 | — | — |
| Nb | 167.10 | 6.54 | 208.97 | 3.42 | 162.48 | 111.38 | 185.76 | 36.18 | 119.17 | 7.10 | — | — |
| Ba | 714.74 | 14.37 | 681.30 | 4.34 | 591.25 | 42.20 | 867.69 | 25.01 | 638.31 | 9.81 | — | — |
| La | 1.98 | 0.02 | 1.80 | 0.05 | 2.99 | 0.38 | 4.16 | 0.11 | 2.84 | 0.10 | — | — |
| Ce | 2.69 | 0.05 | 2.41 | 0.09 | 5.12 | 0.56 | 7.38 | 0.21 | 4.89 | 0.29 | — | — |
| Pr | 2.16 | 0.02 | 1.97 | 0.07 | 4.43 | 0.63 | 5.22 | 0.18 | 3.73 | 0.19 | — | — |
| Nd | 2.18 | 0.03 | 1.99 | 0.05 | 4.86 | 0.60 | 5.76 | 0.16 | 3.99 | 0.22 | — | — |
| Sm | 2.61 | 0.08 | 2.43 | 0.06 | 6.50 | 0.84 | 7.42 | 0.28 | 5.10 | 0.35 | — | — |
| Eu | 3.13 | 0.08 | 3.01 | 0.14 | 7.51 | 1.34 | 6.97 | 0.15 | 5.43 | 0.28 | — | — |
| Gd | 2.96 | 0.09 | 2.79 | 0.14 | 7.36 | 0.99 | 8.64 | 0.54 | 5.88 | 0.47 | — | — |
| Tb | 3.43 | 0.11 | 3.33 | 0.19 | 8.65 | 1.36 | 8.16 | 0.44 | 5.58 | 0.39 | — | — |
| Dy | 4.86 | 0.18 | 4.46 | 0.22 | 11.54 | 1.53 | 10.55 | 0.35 | 7.89 | 0.50 | — | — |
| Y | 6.12 | 0.24 | 5.63 | 0.34 | 11.18 | 1.50 | 10.71 | 0.37 | 7.83 | 0.42 | — | — |
| Ho | 5.63 | 0.25 | 5.17 | 0.35 | 12.28 | 1.77 | 10.79 | 0.48 | 8.35 | 0.55 | — | — |
| Er | 6.32 | 0.27 | 5.68 | 0.42 | 13.57 | 1.79 | 11.61 | 0.51 | 9.01 | 0.59 | — | — |
| Yb | 10.16 | 0.52 | 9.25 | 0.76 | 19.66 | 2.54 | 16.43 | 0.66 | 13.11 | 0.92 | — | — |
| Lu | 10.11 | 0.48 | 9.15 | 0.69 | 17.87 | 3.07 | 13.94 | 0.54 | 11.07 | 0.71 | — | — |
| Hf | 20.77 | 3.60 | 18.89 | 0.66 | 14.49 | 1.50 | 27.54 | 4.84 | 28.19 | 1.77 | — | — |
| Ta | 10.89 | 2.03 | 11.80 | 0.62 | 4.89 | 3.69 | 22.92 | 6.98 | 9.06 | 4.48 | — | — |
| Carbonate liquid | ||||||||||||
| N | 6 | s.d. | 7 | s.d. | 5 | s.d. | 11 | s.d. | 6 | s.d. | 5 | s.d. |
| Sc | 73.11 | 11.04 | 79.57 | 10.03 | 88.83 | 3.83 | 75.85 | 3.24 | 72.39 | 2.74 | 82.41 | 2.03 |
| Ti | 520.20 | 164.35 | 947.61 | 137.79 | 475.87 | 30.90 | 729.92 | 60.19 | 674.37 | 16.28 | 1002.95 | 40.94 |
| Cr | 8.65 | 2.55 | 5.82 | 0.06 | 2.44 | 0.69 | 7.12 | 1.29 | 5.99 | 1.37 | 5.83 | 1.13 |
| Mn | 5113.86 | 470.08 | 4822.68 | 496.32 | 4107.32 | 273.08 | 3301.18 | 196.25 | 3389.16 | 80.25 | 3615.10 | 25.16 |
| Sr | 9528.76 | 617.79 | 10292.20 | 513.75 | 13647.83 | 164.16 | 12793.00 | 533.91 | 13799.87 | 463.88 | 9027.72 | 125.16 |
| Zr | 7.69 | 1.33 | 28.71 | 8.40 | 9.08 | 1.73 | 26.99 | 7.01 | 18.93 | 3.35 | 173.69 | 33.16 |
| Nb | 92.84 | 22.37 | 180.84 | 31.09 | 44.97 | 4.73 | 153.34 | 23.82 | 84.49 | 8.25 | 228.43 | 9.65 |
| Ba | 7819.33 | 1186.38 | 9474.97 | 646.82 | 8228.87 | 120.45 | 7843.84 | 342.81 | 7263.80 | 123.90 | 4263.01 | 81.33 |
| La | 77.67 | 5.41 | 83.11 | 10.93 | 128.67 | 4.97 | 110.32 | 7.00 | 109.17 | 3.15 | 103.41 | 2.06 |
| Ce | 78.80 | 4.66 | 80.27 | 13.66 | 143.52 | 5.61 | 118.43 | 8.38 | 114.60 | 3.09 | 111.10 | 2.37 |
| Pr | 62.89 | 4.31 | 63.51 | 10.11 | 129.00 | 6.05 | 99.80 | 5.61 | 97.82 | 2.30 | 91.90 | 1.30 |
| Nd | 62.80 | 2.42 | 63.22 | 9.21 | 129.24 | 4.66 | 102.55 | 5.95 | 95.36 | 3.17 | 94.32 | 1.63 |
| Sm | 61.74 | 2.41 | 62.71 | 11.02 | 131.42 | 5.42 | 106.40 | 7.04 | 98.00 | 5.48 | 91.60 | 1.68 |
| Eu | 64.14 | 3.02 | 69.32 | 12.07 | 139.11 | 7.44 | 95.41 | 4.07 | 95.56 | 2.75 | 106.80 | 1.87 |
| Gd | 65.22 | 8.07 | 64.83 | 10.61 | 156.76 | 16.55 | 116.71 | 11.75 | 100.35 | 5.81 | 105.18 | 1.88 |
| Tb | 58.92 | 3.79 | 62.08 | 13.19 | 132.83 | 11.91 | 90.71 | 5.50 | 82.88 | 3.88 | 84.93 | 1.79 |
| Dy | 73.55 | 4.50 | 74.34 | 15.22 | 148.93 | 6.75 | 102.40 | 5.93 | 97.33 | 4.23 | 96.41 | 2.05 |
| Y | 86.94 | 6.30 | 89.67 | 18.97 | 164.07 | 8.28 | 117.38 | 8.64 | 115.00 | 4.72 | 106.62 | 3.30 |
| Ho | 74.60 | 4.72 | 76.56 | 17.44 | 148.44 | 7.26 | 99.67 | 6.93 | 98.73 | 3.94 | 93.68 | 1.71 |
| Er | 76.80 | 5.96 | 74.88 | 15.38 | 134.91 | 5.56 | 91.03 | 4.64 | 88.10 | 3.78 | 86.27 | 1.54 |
| Yb | 85.98 | 7.47 | 87.28 | 19.17 | 143.49 | 5.25 | 96.00 | 6.00 | 92.84 | 3.86 | 92.06 | 1.71 |
| Lu | 77.40 | 6.02 | 79.99 | 17.27 | 116.18 | 5.21 | 78.27 | 4.53 | 75.25 | 2.97 | 74.34 | 1.52 |
| Hf | 0.27 | 0.07 | 0.70 | 0.26 | 0.21 | 0.04 | 0.90 | 0.23 | 0.76 | 0.24 | 4.56 | 1.00 |
| Ta | 0.55 | 0.25 | 1.72 | 0.34 | 0.29 | 0.34 | 3.44 | 1.12 | 1.35 | 0.56 | 1.69 | 0.16 |
| PCPC5_02*# | PCPC5_03∗ | PCPC5_04∗ | PCPC6_01∗ | PCPC6_02∗ | PCPC6_03# | |||||||
| P (Gpa) | 0.8 | 0.8 | 0.8 | 0.8 | 0.8 | |||||||
| T (°C) | 850 | 850 | 1050 | 1050 | 1050 | |||||||
| Starting material | PhCbn4 | PhCbn4 | PhCbn3 | PhCbn3 | PhCbn2 | |||||||
| Silicate liquid | ||||||||||||
| N | 3 | s.d. | 6 | s.d. | 6 | s.d. | 6 | s.d. | 6 | s.d. | ||
| Sc | 6.05 | 0.20 | 5.77 | 0.14 | — | — | 66.59 | 3.94 | 74.22 | 1.07 | 88.83 | 1.42 |
| Ti | 612.58 | 13.30 | 527.99 | 5.43 | — | — | 2402.61 | 154.04 | 2361.75 | 35.60 | 2868.19 | 71.36 |
| Cr | bdl | — | 1.83 | 0.26 | — | — | 98.02 | 4.99 | 66.76 | 1.03 | 107.96 | 7.94 |
| Mn | 639.17 | 38.43 | 910.95 | 7.22 | — | — | 1770.07 | 66.64 | 1863.55 | 24.96 | 2023.31 | 26.64 |
| Sr | 974.34 | 19.03 | 1211.86 | 14.66 | — | — | 1825.38 | 37.09 | 3296.04 | 48.13 | 2484.08 | 19.47 |
| Zr | 310.69 | 8.11 | 284.47 | 3.79 | — | — | 517.10 | 33.40 | 468.16 | 7.35 | 662.16 | 26.19 |
| Nb | 116.31 | 1.80 | 115.81 | 1.13 | — | — | 233.27 | 10.97 | 239.08 | 1.87 | 207.30 | 6.47 |
| Ba | 1095.46 | 8.07 | 1696.68 | 25.25 | — | — | 2033.84 | 61.31 | 2442.04 | 42.44 | 2623.17 | 31.88 |
| La | 6.60 | 0.14 | 8.37 | 0.11 | — | — | 18.21 | 0.48 | 35.92 | 0.66 | 23.13 | 1.32 |
| Ce | 15.09 | 0.31 | 15.99 | 0.21 | — | — | 23.70 | 0.37 | 46.62 | 0.77 | 28.81 | 1.44 |
| Pr | 6.33 | 0.02 | 7.77 | 0.08 | — | — | 20.08 | 0.35 | 36.54 | 0.72 | 23.44 | 1.30 |
| Nd | 6.41 | 0.03 | 7.08 | 0.08 | — | — | 20.94 | 0.42 | 37.34 | 0.55 | 23.94 | 1.14 |
| Sm | 5.98 | 0.26 | 6.32 | 0.18 | — | — | 22.86 | 0.37 | 40.86 | 0.87 | 28.88 | 0.98 |
| Eu | 5.80 | 0.19 | 5.10 | 0.05 | — | — | 25.18 | 0.40 | 42.14 | 0.93 | 31.18 | 1.32 |
| Gd | 5.01 | 0.05 | 4.42 | 0.09 | — | — | 31.75 | 0.74 | 45.63 | 0.95 | 31.76 | 1.77 |
| Tb | 3.99 | 0.12 | 4.01 | 0.04 | — | — | 25.62 | 0.36 | 43.41 | 0.67 | 29.91 | 1.28 |
| Dy | 4.74 | 0.06 | 4.01 | 0.05 | — | — | 29.94 | 0.61 | 46.50 | 0.89 | 37.06 | 1.02 |
| Y | 5.49 | 0.18 | 5.02 | 0.07 | — | — | 31.02 | 0.71 | 51.43 | 0.76 | 42.40 | 1.36 |
| Ho | 4.37 | 0.22 | 3.80 | 0.03 | — | — | 31.57 | 0.71 | 49.84 | 0.76 | 39.05 | 1.39 |
| Er | 4.07 | 0.22 | 3.49 | 0.03 | — | — | 29.83 | 0.75 | 43.62 | 0.66 | 39.36 | 1.25 |
| Yb | 5.16 | 0.12 | 4.21 | 0.05 | — | — | 36.48 | 0.94 | 52.56 | 1.12 | 50.36 | 0.94 |
| Lu | 4.79 | 0.16 | 3.90 | 0.05 | — | — | 32.12 | 0.87 | 50.31 | 0.68 | 45.94 | 1.04 |
| Hf | 12.26 | 0.65 | 10.04 | 0.12 | — | — | 36.48 | 1.49 | 15.90 | 0.27 | 31.21 | 1.12 |
| Ta | 7.64 | 0.25 | 8.86 | 0.18 | — | — | 1.73 | 0.09 | 14.07 | 0.23 | 6.37 | 1.10 |
| Carbonate liquid | ||||||||||||
| N | 7 | s.d. | 8 | s.d. | 8 | s.d. | 7 | s.d. | 11 | s.d. | 6 | s.d. |
| Sc | 6.54 | 1.00 | 4.86 | 1.03 | 9.98 | 0.42 | 53.15 | 0.62 | 36.92 | 1.98 | 64.64 | 7.37 |
| Ti | 328.34 | 63.91 | 265.10 | 52.93 | 448.59 | 26.27 | 841.60 | 21.28 | 1033.07 | 100.60 | 1193.03 | 124.36 |
| Cr | — | 2.80 | 14.53 | 3.77 | 7.88 | 0.54 | 69.66 | 2.12 | 94.58 | 12.42 | 100.91 | 15.54 |
| Mn | 3690.77 | 532.50 | 4723.97 | 458.62 | 2943.49 | 77.26 | 2743.15 | 10.07 | 2853.87 | 140.87 | 4062.84 | 308.27 |
| Sr | 16991.89 | 1297.96 | 15848.10 | 915.96 | 10373.42 | 135.30 | 11368.69 | 66.30 | 11250.34 | 278.61 | 13607.86 | 562.29 |
| Zr | 10.28 | 2.59 | 8.24 | 2.64 | 29.31 | 1.62 | 46.92 | 2.45 | 51.76 | 7.86 | 57.89 | 6.78 |
| Nb | 132.66 | 28.73 | 129.93 | 28.67 | 188.87 | 6.85 | 175.58 | 2.36 | 201.28 | 17.62 | 180.34 | 10.51 |
| Ba | 10845.25 | 1728.56 | 11756.56 | 1482.52 | 6453.81 | 136.46 | 7706.21 | 52.41 | 6960.76 | 441.99 | 10612.55 | 1058.95 |
| La | 140.48 | 9.79 | 123.54 | 16.44 | 86.77 | 1.75 | 103.32 | 1.14 | 87.61 | 2.83 | 108.09 | 5.60 |
| Ce | 109.18 | 5.91 | 98.47 | 15.28 | 87.22 | 1.52 | 106.09 | 1.30 | 93.18 | 3.99 | 109.41 | 6.24 |
| Pr | 102.18 | 5.17 | 90.71 | 10.68 | 68.96 | 0.89 | 88.55 | 0.92 | 74.01 | 1.74 | 87.87 | 6.57 |
| Nd | 93.26 | 4.04 | 75.43 | 9.52 | 68.67 | 1.16 | 85.81 | 1.25 | 71.65 | 1.60 | 85.18 | 5.29 |
| Sm | 74.46 | 7.05 | 54.76 | 7.35 | 63.84 | 0.94 | 81.48 | 0.96 | 70.41 | 2.21 | 89.29 | 4.43 |
| Eu | 67.40 | 4.29 | 40.70 | 5.99 | 66.39 | 0.85 | 85.87 | 1.03 | 68.30 | 1.83 | 91.13 | 6.05 |
| Gd | 58.29 | 3.35 | 34.76 | 5.02 | 61.28 | 0.77 | 106.95 | 1.29 | 73.71 | 1.66 | 90.98 | 2.21 |
| Tb | 38.98 | 2.92 | 27.20 | 3.59 | 52.04 | 0.66 | 78.63 | 1.08 | 64.90 | 2.08 | 76.11 | 4.48 |
| Dy | 40.86 | 2.84 | 24.11 | 3.43 | 61.00 | 0.61 | 81.70 | 0.86 | 63.89 | 1.67 | 86.96 | 2.73 |
| Y | 45.83 | 4.36 | 28.71 | 4.21 | 70.66 | 1.35 | 99.27 | 0.63 | 72.43 | 2.56 | 101.05 | 2.86 |
| Ho | 35.37 | 2.84 | 21.24 | 3.39 | 59.44 | 0.72 | 84.56 | 1.24 | 66.00 | 2.24 | 85.78 | 1.70 |
| Er | 29.38 | 2.47 | 17.15 | 2.54 | 52.29 | 0.82 | 70.44 | 0.80 | 52.85 | 1.48 | 80.40 | 1.70 |
| Yb | 26.53 | 2.94 | 15.95 | 2.41 | 50.14 | 0.91 | 71.53 | 0.95 | 54.14 | 1.95 | 86.00 | 1.71 |
| Lu | 22.24 | 2.27 | 13.01 | 1.93 | 37.57 | 0.95 | 61.22 | 0.90 | 50.05 | 2.31 | 74.90 | 2.73 |
| Hf | 0.20 | 0.09 | 0.26 | 0.06 | 4.48 | 0.20 | 2.19 | 0.11 | 1.37 | 0.22 | 1.58 | 0.24 |
| Ta | 1.50 | 0.25 | 1.82 | 0.48 | 0.71 | 0.03 | 0.49 | 0.01 | 4.56 | 0.54 | 1.85 | 0.33 |
N: number of analysis; Bdl: below detection limit; s.d.: standard deviation. Italics: samples in which equilibrium between carbonate and silicate liquids is assumed not to have been attained. ∗: sample analysed by the Agilent 7500 CS Quadrupole ICP-MS; #: sample analysed by the Agilent 7900 Quadrupole ICP-MS.
Partition coefficients between silicate and carbonate liquids, for Ca, volatiles and trace elements
| PCPC1_01 | PCPC1_02 | PCPC1_03 | PCPC2_01 | PCPC3_01 | PCPC3_02 | PCPC3_03 | PCPC4_01 | |||||||||
|---|---|---|---|---|---|---|---|---|---|---|---|---|---|---|---|---|
| P (Gpa) | 0,8 | 0,8 | 0,8 | 0,8 | 0,8 | 0,8 | 0,8 | 0,8 | ||||||||
| T (°C) | 850 | 850 | 850 | 1050 | 850 | 850 | 850 | 850 | ||||||||
| Starting material | PhCbn1 | s.d. | PhCbn1 | s.d. | PhCbn1 | s.d. | PhCbn1 | s.d. | PhCbn2 | s.d. | PhCbn2 | s.d. | PhCbn2 | s.d. | PhCbn3 | s.d. |
| Ca | 33.10 | 5.69 | 29.47 | 2.65 | 18.00 | 0.89 | 3.91 | 0.30 | 29.43 | 2.87 | 29.99 | 1.84 | 31.55 | 3.85 | 42.46 | 4.43 |
| F | 7.140 | 1.549 | 7.469 | 1.587 | 7.200 | 1.591 | 3.786 | 0.855 | 7.322 | 3.496 | 6.378 | 1.762 | 6.806 | 2.060 | 7.913 | 0.731 |
| Cl | 2.160 | 0.620 | 1.866 | 0.405 | 0.626 | 0.194 | 5.126 | 0.492 | 5.039 | 3.316 | 2.497 | 1.290 | 4.442 | 1.880 | 7.725 | 1.576 |
| P2O5 | — | — | — | — | — | — | 9.018 | 1.961 | 8.601 | 1.339 | — | — | 14.365 | 4.824 | — | — |
| Sc | 1.091 | 0.447 | 0.736 | 0.312 | 1.679 | 0.279 | 0.275 | 0.026 | 1.724 | 0.246 | 1.832 | 0.282 | 2.277 | 0.290 | 1.770 | 0.223 |
| Ti | 0.243 | 0.045 | 0.191 | 0.047 | 0.737 | 0.089 | 0.229 | 0.019 | 0.281 | 0.089 | 0.295 | 0.094 | 0.539 | 0.081 | 0.272 | 0.031 |
| Cr | — | — | 0.794 | 0.253 | 5.765 | 1.275 | 0.347 | 0.023 | 1.125 | 0.834 | 2.541 | 0.839 | 2.602 | 0.591 | 0.416 | 0.324 |
| Mn | 3.161 | 0.422 | 2.551 | 1.036 | 6.445 | 0.727 | 1.003 | 0.051 | 8.970 | 1.150 | 9.154 | 0.880 | 9.384 | 0.975 | 5.079 | 0.706 |
| Sr | 23.886 | 0.946 | 15.351 | 2.135 | 26.384 | 0.704 | 4.098 | 0.091 | 25.281 | 0.547 | 25.411 | 1.678 | 28.361 | 1.431 | 33.893 | 2.034 |
| Zr | 0.022 | 0.006 | 0.018 | 0.004 | 0.107 | 0.016 | 0.043 | 0.011 | 0.037 | 0.027 | 0.017 | 0.003 | 0.063 | 0.019 | 0.017 | 0.003 |
| Nb | 0.591 | 0.057 | 0.391 | 0.084 | 1.373 | 0.153 | 0.544 | 0.036 | 0.486 | 0.137 | 0.556 | 0.136 | 0.865 | 0.149 | 0.277 | 0.192 |
| Ba | 10.681 | 0.573 | 6.919 | 1.306 | 13.712 | 0.957 | 2.901 | 0.173 | 11.381 | 0.858 | 10.940 | 1.674 | 13.907 | 0.954 | 13.918 | 1.014 |
| La | 13.628 | 2.220 | 10.695 | 2.245 | 29.565 | 3.317 | 2.157 | 0.123 | 37.141 | 4.098 | 39.217 | 2.758 | 46.195 | 6.208 | 43.034 | 5.710 |
| Ce | 8.018 | 1.177 | 6.187 | 1.316 | 18.315 | 2.333 | 1.702 | 0.126 | 27.094 | 2.979 | 29.346 | 1.819 | 33.307 | 5.803 | 28.026 | 3.260 |
| Pr | 9.361 | 1.489 | 7.613 | 1.546 | 21.738 | 2.822 | 1.682 | 0.113 | 26.168 | 3.236 | 29.077 | 2.013 | 32.250 | 5.257 | 29.153 | 4.360 |
| Nd | 9.254 | 1.445 | 7.329 | 1.422 | 21.513 | 2.695 | 1.637 | 0.105 | 26.306 | 2.833 | 28.744 | 1.196 | 31.753 | 4.703 | 26.577 | 3.440 |
| Sm | 6.908 | 1.229 | 5.746 | 1.104 | 17.553 | 2.470 | 1.419 | 0.124 | 20.382 | 3.731 | 23.672 | 1.192 | 25.788 | 4.574 | 20.209 | 2.744 |
| Eu | 6.070 | 1.010 | 5.113 | 0.909 | 15.512 | 2.317 | 1.295 | 0.157 | 19.210 | 3.509 | 20.506 | 1.107 | 23.052 | 4.146 | 18.531 | 3.453 |
| Gd | 5.731 | 1.103 | 5.008 | 0.927 | 15.882 | 2.606 | 1.335 | 0.090 | 18.818 | 3.520 | 22.038 | 2.800 | 23.198 | 3.966 | 21.308 | 3.644 |
| Tb | 4.126 | 0.859 | 4.002 | 0.798 | 13.002 | 2.172 | 1.153 | 0.079 | 15.582 | 3.150 | 17.171 | 1.227 | 18.660 | 4.103 | 15.360 | 2.780 |
| Dy | 3.644 | 0.554 | 3.359 | 0.727 | 11.400 | 2.099 | 1.058 | 0.092 | 14.427 | 3.328 | 15.148 | 1.080 | 16.656 | 3.508 | 12.903 | 1.803 |
| Y | 3.255 | 0.515 | 3.164 | 0.694 | 10.880 | 1.956 | 1.100 | 0.097 | 13.125 | 2.966 | 14.208 | 1.173 | 15.918 | 3.504 | 14.671 | 2.109 |
| Ho | 3.285 | 0.567 | 3.080 | 0.694 | 10.251 | 2.039 | 0.999 | 0.097 | 12.297 | 2.678 | 13.240 | 1.025 | 14.809 | 3.517 | 12.092 | 1.844 |
| Er | 2.698 | 0.488 | 2.552 | 0.593 | 8.966 | 1.798 | 0.912 | 0.084 | 11.413 | 2.347 | 12.161 | 1.080 | 13.194 | 2.877 | 9.939 | 1.373 |
| Yb | 1.841 | 0.290 | 1.856 | 0.476 | 6.456 | 1.291 | 0.724 | 0.086 | 7.969 | 1.916 | 8.459 | 0.851 | 9.439 | 2.214 | 7.298 | 0.980 |
| Lu | 1.723 | 0.305 | 1.751 | 0.475 | 5.790 | 1.112 | 0.692 | 0.084 | 7.281 | 1.769 | 7.657 | 0.698 | 8.739 | 1.999 | 6.501 | 1.155 |
| Hf | 0.012 | 0.007 | 0.011 | 0.004 | 0.070 | 0.010 | 0.027 | 0.006 | 0.030 | 0.025 | 0.013 | 0.004 | 0.037 | 0.014 | 0.015 | 0.003 |
| Ta | 0.084 | 0.013 | 0.069 | 0.026 | 0.336 | 0.064 | 0.206 | 0.037 | 0.076 | 0.040 | 0.050 | 0.025 | 0.146 | 0.030 | 0.059 | 0.082 |
| PCPC4_02 | PCPC4_03 | PCPC5_02 | PCPC5_03 | PCPC6_01 | PCPC6_02 | PCPC6_03 | ||||||||||
| P (Gpa) | 0.8 | 0.8 | 0.8 | 0.8 | 0.8 | 0.8 | 0.8 | |||||||||
| T (°C) | 850 | 850 | 850 | 850 | 1050 | 1050 | 1050 | |||||||||
| Starting material | PhCbn3 | s.d. | PhCbn3 | s.d. | PhCbn4 | s.d. | PhCbn4 | s.d. | PhCbn3 | s.d. | PhCbn4 | s.d. | PhCbn2 | s.d. | ||
| Ca | 22.24 | 0.86 | 30.40 | 1.56 | 16.89 | 2.74 | 13.93 | 1.95 | 6.64 | 0.42 | 3.32 | 0.23 | 6.34 | 0.31 | ||
| F | 6.225 | 0.408 | 6.442 | 0.333 | 8.245 | 2.285 | 5.630 | 0.834 | 3.060 | 0.684 | 4.933 | 1.058 | 4.204 | 0.706 | ||
| Cl | 4.680 | 0.493 | 6.288 | 1.281 | 0.950 | 0.329 | 0.718 | 0.368 | 5.883 | 0.992 | 0.706 | 0.257 | 4.423 | 1.481 | ||
| P2O5 | — | — | — | — | — | — | — | — | 11.747 | 3.925 | 5.418 | 2.925 | 9.934 | 1.542 | ||
| Sc | 1.814 | 0.097 | 2.020 | 0.108 | 1.082 | 0.169 | 0.843 | 0.179 | 0.798 | 0.048 | 0.497 | 0.028 | 0.728 | 0.084 | ||
| Ti | 0.398 | 0.033 | 0.375 | 0.010 | 0.536 | 0.105 | 0.502 | 0.100 | 0.350 | 0.024 | 0.437 | 0.043 | 0.416 | 0.045 | ||
| Cr | 2.448 | 0.477 | 2.254 | 0.727 | — | — | 7.956 | 2.357 | 0.711 | 0.042 | 1.417 | 0.187 | 0.935 | 0.159 | ||
| Mn | 3.446 | 0.220 | 4.398 | 0.134 | 5.774 | 0.903 | 5.186 | 0.505 | 1.550 | 0.059 | 1.531 | 0.078 | 2.008 | 0.155 | ||
| Sr | 19.396 | 1.038 | 26.811 | 1.277 | 17.439 | 1.375 | 13.077 | 0.772 | 6.228 | 0.132 | 3.413 | 0.098 | 5.478 | 0.230 | ||
| Zr | 0.056 | 0.014 | 0.039 | 0.007 | 0.033 | 0.008 | 0.029 | 0.009 | 0.091 | 0.008 | 0.111 | 0.017 | 0.087 | 0.011 | ||
| Nb | 0.825 | 0.206 | 0.709 | 0.081 | 1.141 | 0.248 | 1.122 | 0.248 | 0.753 | 0.037 | 0.842 | 0.074 | 0.870 | 0.057 | ||
| Ba | 9.040 | 0.473 | 11.380 | 0.261 | 9.900 | 1.580 | 6.929 | 0.880 | 3.789 | 0.117 | 2.850 | 0.188 | 4.046 | 0.407 | ||
| La | 26.519 | 1.831 | 38.475 | 1.709 | 21.285 | 1.549 | 14.759 | 1.973 | 5.675 | 0.161 | 2.439 | 0.091 | 4.672 | 0.360 | ||
| Ce | 16.054 | 1.222 | 23.416 | 1.509 | 7.234 | 0.419 | 6.159 | 0.959 | 4.477 | 0.089 | 1.999 | 0.092 | 3.797 | 0.288 | ||
| Pr | 19.135 | 1.254 | 26.194 | 1.478 | 16.133 | 0.818 | 11.682 | 1.380 | 4.411 | 0.089 | 2.025 | 0.062 | 3.749 | 0.349 | ||
| Nd | 17.799 | 1.145 | 23.924 | 1.551 | 14.557 | 0.634 | 10.659 | 1.351 | 4.099 | 0.102 | 1.919 | 0.051 | 3.558 | 0.279 | ||
| Sm | 14.348 | 1.093 | 19.231 | 1.704 | 12.459 | 1.296 | 8.671 | 1.189 | 3.565 | 0.071 | 1.723 | 0.065 | 3.092 | 0.186 | ||
| Eu | 13.685 | 0.657 | 17.603 | 1.035 | 11.621 | 0.832 | 7.980 | 1.178 | 3.410 | 0.068 | 1.621 | 0.056 | 2.922 | 0.230 | ||
| Gd | 13.513 | 1.602 | 17.062 | 1.686 | 11.634 | 0.678 | 7.869 | 1.147 | 3.369 | 0.089 | 1.616 | 0.050 | 2.864 | 0.174 | ||
| Tb | 11.120 | 0.901 | 14.841 | 1.238 | 9.761 | 0.789 | 6.782 | 0.897 | 3.069 | 0.060 | 1.495 | 0.053 | 2.544 | 0.185 | ||
| Dy | 9.706 | 0.647 | 12.329 | 0.947 | 8.621 | 0.610 | 6.010 | 0.859 | 2.729 | 0.062 | 1.374 | 0.044 | 2.347 | 0.098 | ||
| Y | 10.960 | 0.889 | 14.687 | 0.987 | 8.353 | 0.838 | 5.715 | 0.843 | 3.200 | 0.076 | 1.408 | 0.054 | 2.383 | 0.102 | ||
| Ho | 9.234 | 0.763 | 11.817 | 0.907 | 8.093 | 0.764 | 5.597 | 0.893 | 2.678 | 0.072 | 1.324 | 0.049 | 2.197 | 0.090 | ||
| Er | 7.843 | 0.527 | 9.781 | 0.768 | 7.225 | 0.725 | 4.915 | 0.729 | 2.361 | 0.065 | 1.212 | 0.039 | 2.043 | 0.078 | ||
| Yb | 5.844 | 0.435 | 7.084 | 0.577 | 5.145 | 0.581 | 3.787 | 0.574 | 1.961 | 0.057 | 1.030 | 0.043 | 1.708 | 0.047 | ||
| Lu | 5.615 | 0.390 | 6.797 | 0.513 | 4.639 | 0.497 | 3.338 | 0.496 | 1.906 | 0.059 | 0.995 | 0.048 | 1.631 | 0.070 | ||
| Hf | 0.033 | 0.010 | 0.027 | 0.009 | 0.016 | 0.007 | 0.026 | 0.006 | 0.060 | 0.004 | 0.086 | 0.014 | 0.051 | 0.008 | ||
| Ta | 0.150 | 0.067 | 0.149 | 0.096 | 0.197 | 0.034 | 0.206 | 0.055 | 0.281 | 0.017 | 0.324 | 0.038 | 0.291 | 0.072 | ||
s.d.: standard deviation, calculated statistical uncertainty. Italics: samples in which equilibrium between carbonate and silicate liquids is assumed not to have been attained.
For some samples, the Ce partition coefficients show a negative anomaly. The
At the higher temperature (1050 °C, triangles in Figure 4), the carbonate melt enrichments in REE are lower in all four chemical systems, especially in the non-doped system with a
To summarise the REE partitioning, the experimental
4. Discussion
4.1. REE partitioning: silicate melt composition effect in F-, Cl- and P-rich environments?
In order to investigate the effect of F, Cl and P on
- the CaO content, which is a good proxy of mineral fractionation during alkaline magma differentiation (Figure 5a, Table 3);
- the alumina saturation index, abbreviated to ASI (Al2O3/(CaO + Na2O + K2O); Figure 5b, Table 3), which indicates the degree of peralkalinity of the silicate melt; we note here that all the silicate liquids from this study are peralkaline, with an ASI < 1 and a negative alkalinity index (abbreviated to A.I. in Table 3);
- the alkali/alkaline-earth cation ratio ((Na2O + K2O)/(CaO + MgO), Figure 5c).
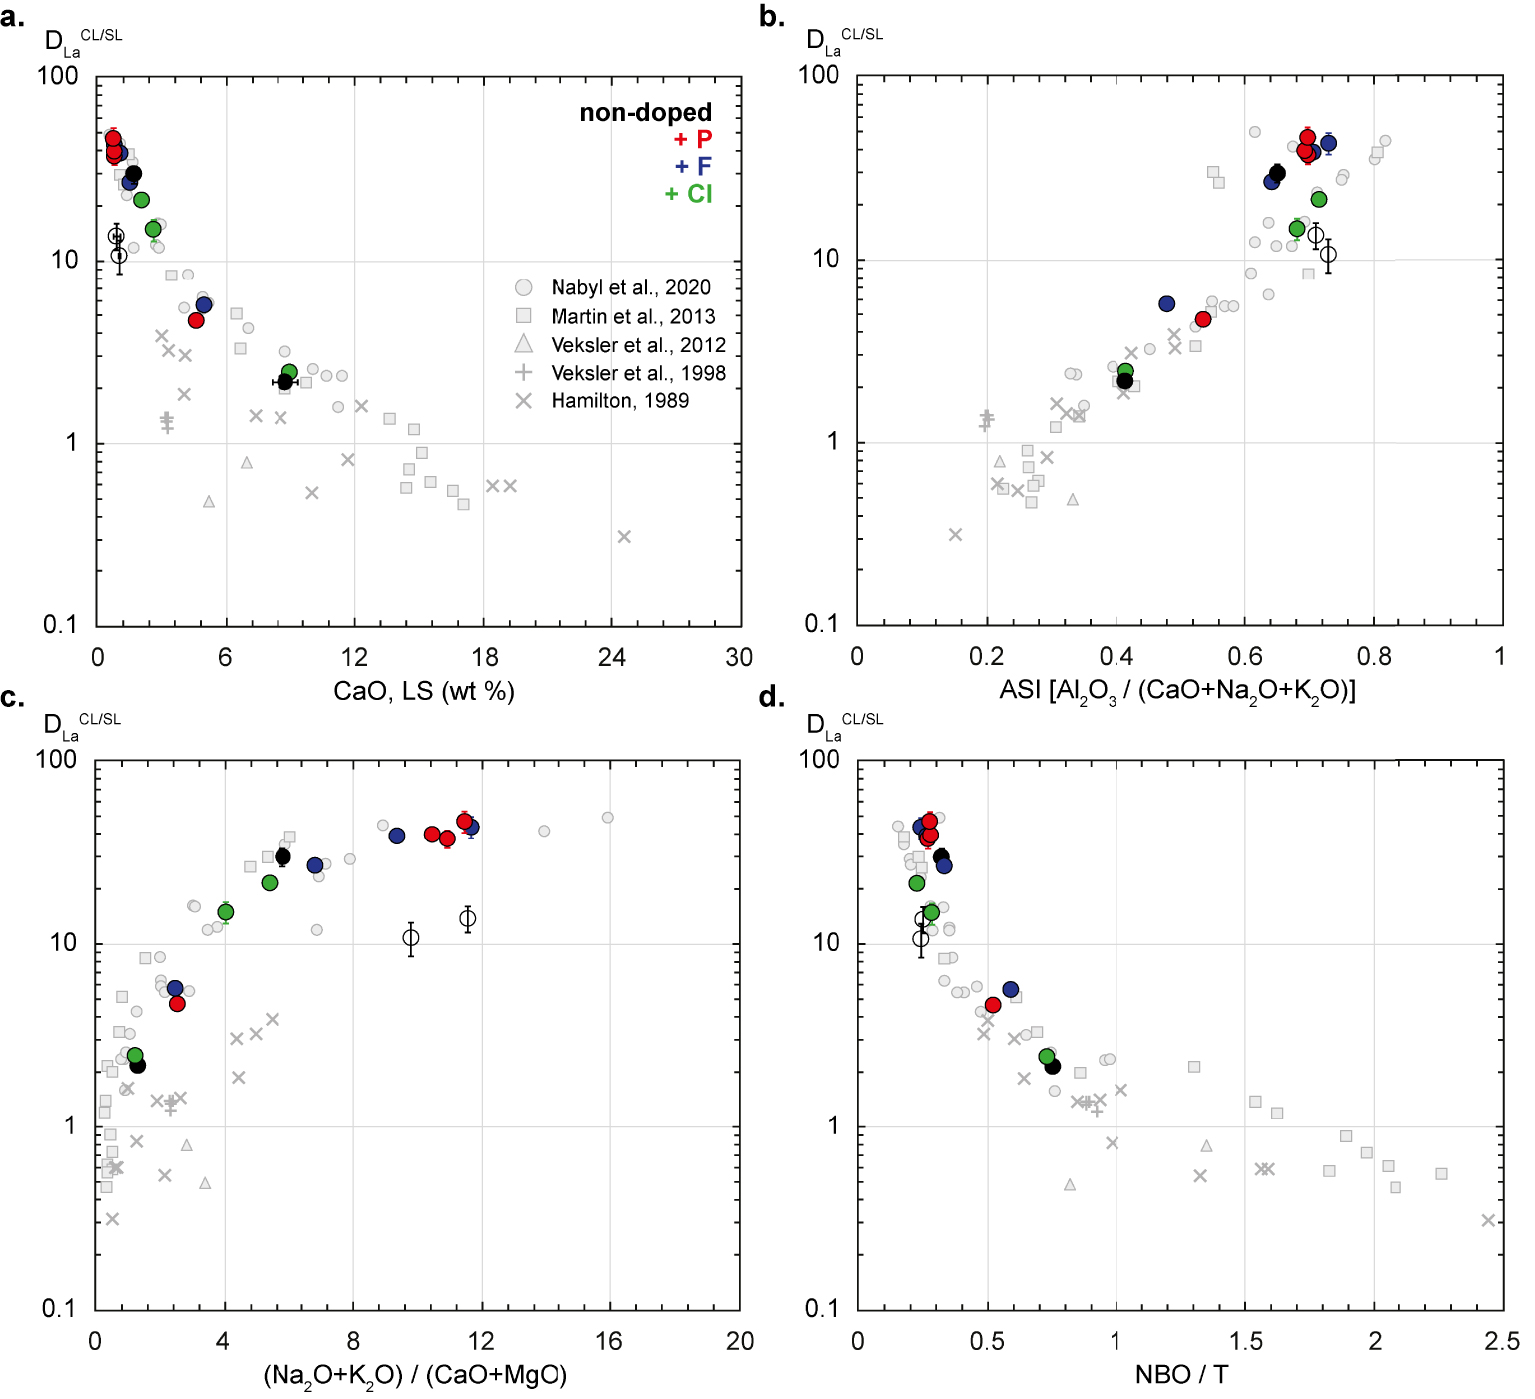
Silicate melt composition and structure effects on the La partition coefficient (
Silicate melt composition and structure effects on the La partition coefficient (
In this discussion, we also systematically use the NBO/T [non-bridging oxygen per tetrahedrally coordinated cation; Mysen et al. 1982], a classic parameter used to indicate the degree of polymerisation of silicate melts (Figure 5d).
For the 19 samples synthesized at 850–1050 °C and 0.8 GPa, in the four chemical systems (non-doped, + F, + Cl or + P) and ± additional water (Table 2), the
4.2. The role of F, Cl and P in the silicate melt composition
As suggested by Figure 5, the highest REE partition coefficients, which correspond to the F- and P-rich charges (Figures 4 and 5), demonstrate that the conjugate silicate melts are among the most fractionated, the least peralkaline and the most polymerised silicate melts. This could suggest that the addition of F and P has an impact on the composition of the silicate melts in equilibrium with carbonate melts. As described in the Introduction section, the addition of F, Cl and P has important effects on the physical properties of silicate melts. However, the new data in this study show that, only F or Cl could have a significant effect on the silicate melt structure and composition, since P2O5 concentrations are generally below the detection limit for all the experimental charges (see Table 3).
It has been shown that the addition of water, the composition of the silicate melt and the F concentration all affect F speciation in synthetic peralkaline silicate melts [Baasner et al. 2014]. Baasner et al. [2013a] also highlighted that the effect of Cl on the silicate melt structure depends on the melt composition, and that Cl and F have opposing effects on peralkaline silicate melt viscosity: Cl increases the viscosity, whereas F decreases it. Thus the F and Cl effects could impact the structure and composition of the peralkaline silicate melts of nephelinite–phonolite type used in this study, and consequently the REE partitioning between carbonate and silicate melts.
The F and Cl partition coefficients (see Table 5) are plotted in Figure 6 against NBO/T and ASI which are taken as proxies of the silicate melt composition and structure.
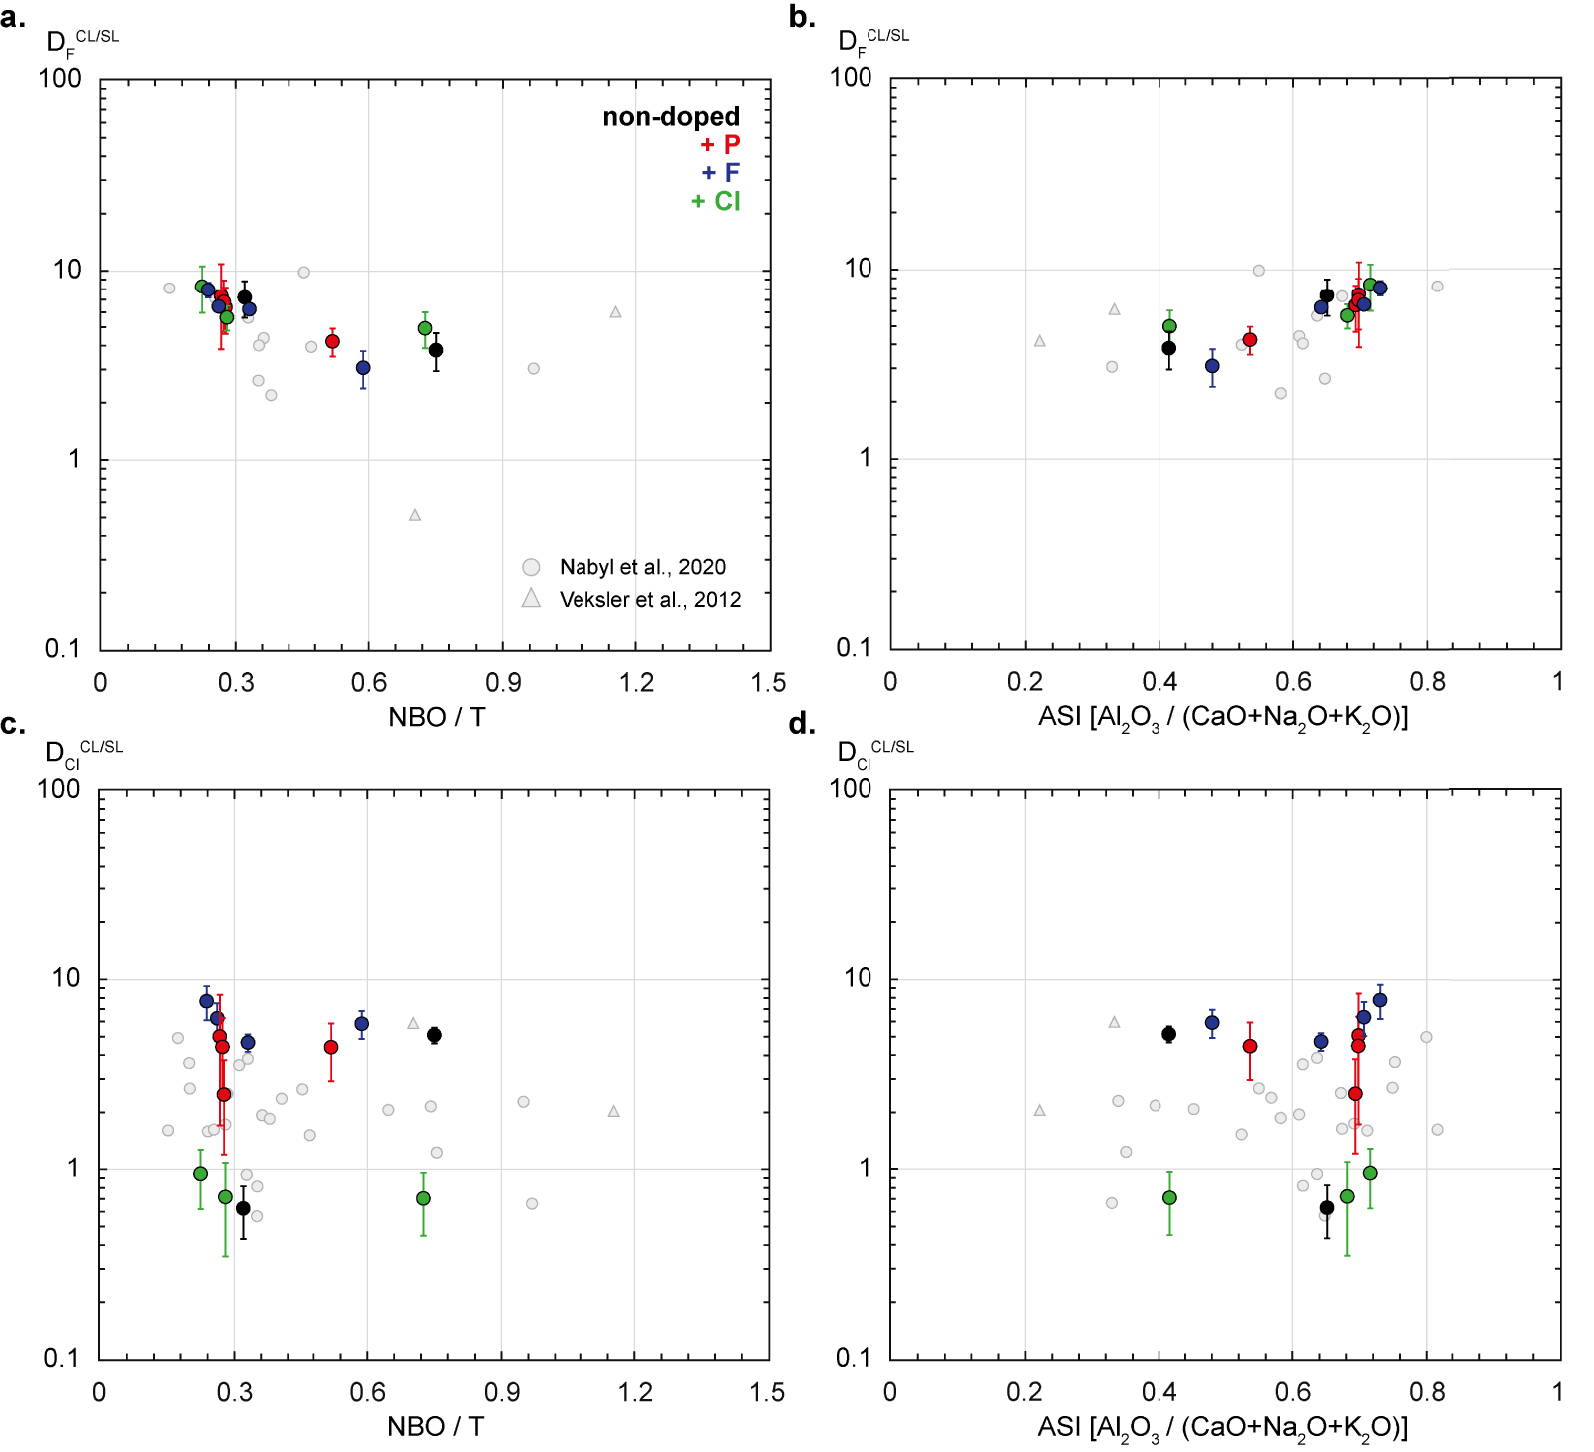
Fluorine and chlorine partition coefficients between carbonate and silicate liquids (CL and SL;
Fluorine and chlorine partition coefficients between carbonate and silicate liquids (CL and SL;
No clear correlation between
The lower
4.3. Prediction of carbonate melt REE contents in F–Cl–P-rich systems
4.3.1. Application of the carbonatite REE enrichment model to F-, Cl- and P-rich systems
The REE partitioning model between carbonate and silicate liquids of Nabyl et al. [2020] relates
The Nabyl et al. [2020] partitioning equations have been used to calculate
The
| (1) |
The
| (2) |
The calculated
Although the two partitioning data points from the secondary carbonate liquid phase (“CL2”, see Section 3.2; Figure 1b) are outliers in Figures 7 and 8b (empty black circles), they are also well-predicted in terms of
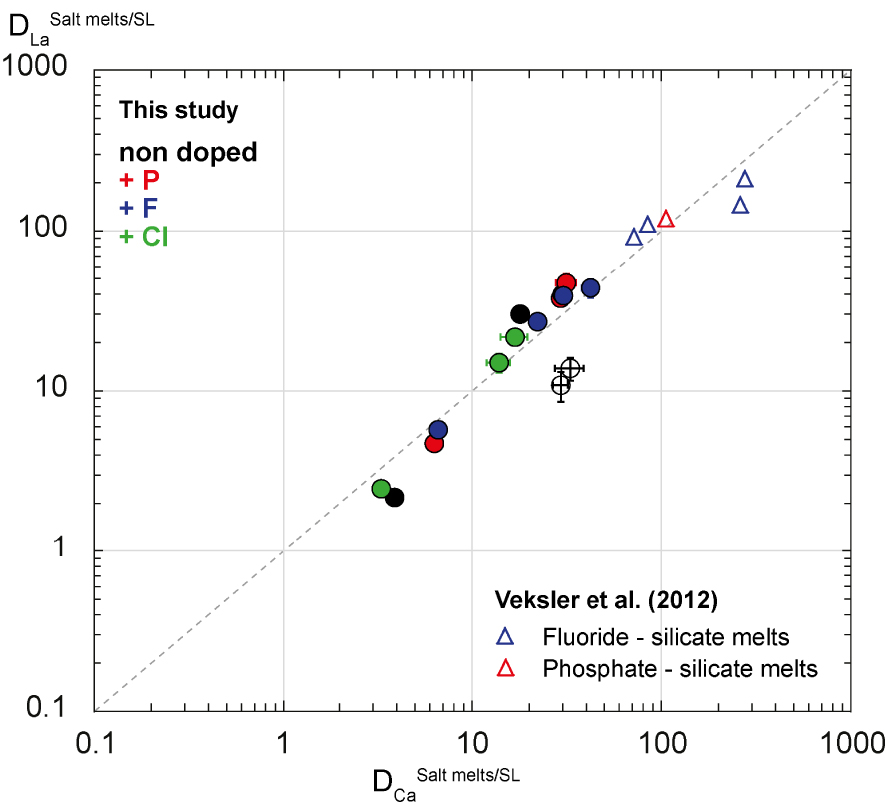
Veksler et al. [2012] have defined rare metal partitioning between salt melts—such as fluoride (F > 38 wt%), phosphate (P2O5 > 45 wt%) and chloride melts—and silicate melts. Fluoride and phosphate melts can be 100 times more enriched in REE than silicate melts [
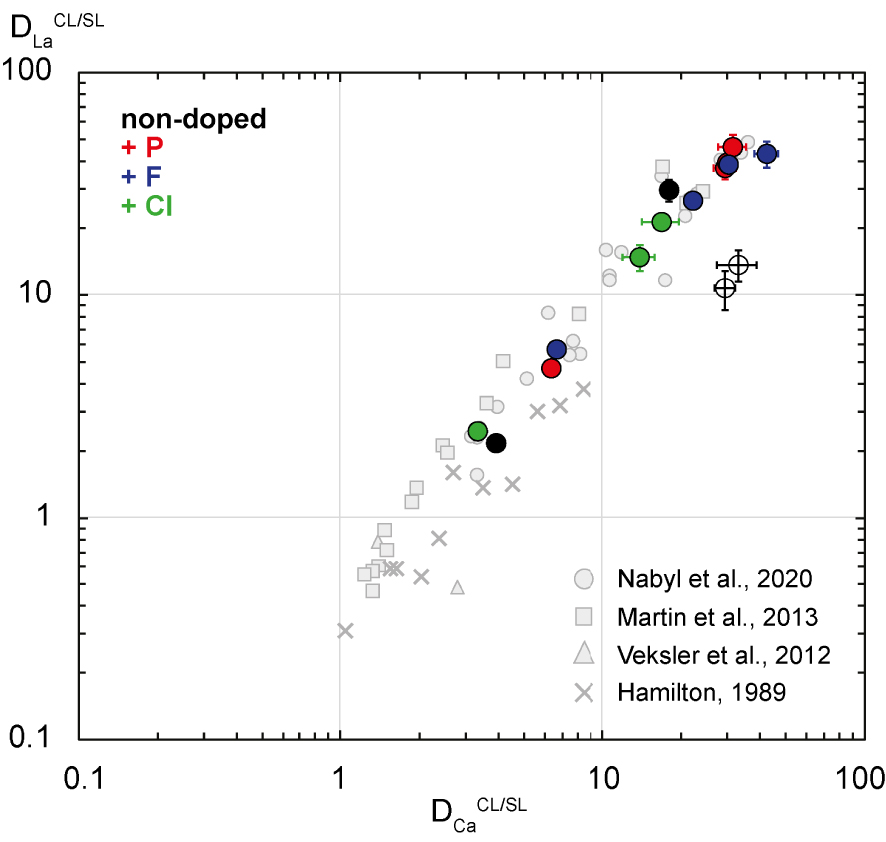
La partition coefficients (
La partition coefficients (
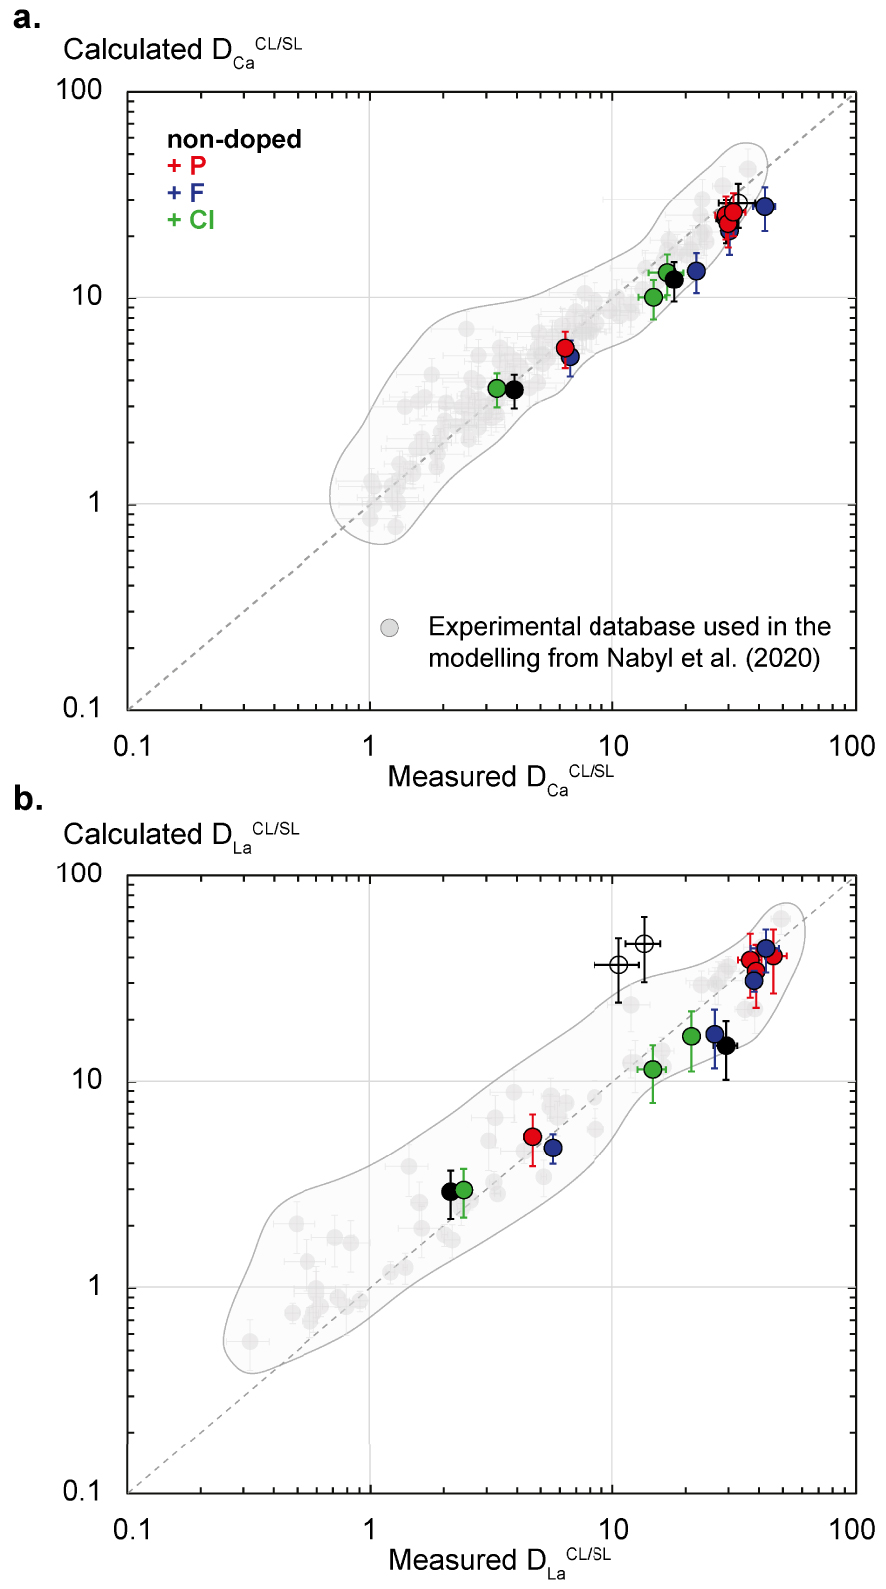
Application of the carbonate melt REE enrichment model from Nabyl et al. [2020] in the experimental F-Cl-P-rich carbonate and silicate liquids from this study. (a) Modelled Ca partition coefficients between carbonate and silicate liquids (Calculated
Application of the carbonate melt REE enrichment model from Nabyl et al. [2020] in the experimental F-Cl-P-rich carbonate and silicate liquids from this study. (a) Modelled Ca partition coefficients between carbonate and silicate liquids (Calculated
La partition (
La partition (
4.3.2. Application to natural carbonate and silicate melt inclusions
Melt inclusion studies of alkaline magmatic rocks have highlighted the existence of inclusions containing alkaline silica–undersaturated silicate melts (melilitic to phonolitic compositions) coexisting with carbonate melts [Berkesi et al. 2020; Guzmics et al. 2012, 2019; Mitchell 2009]. Guzmics et al. [2019] and Berkesi et al. [2020] have shown the existence of carbonate and silicate melt inclusions containing relatively high F, Cl and P concentrations, with up to 14 wt% of F, 5 wt% of P2O5 and 4 wt% of Cl in the carbonate melts. Those concentration ranges are similar to the melt concentrations reported in this study (see Table 3). The Nabyl et al. [2020] model (1) and (2) has been applied to the conjugate carbonate and silicate melt inclusions, including in F-rich system. Only the
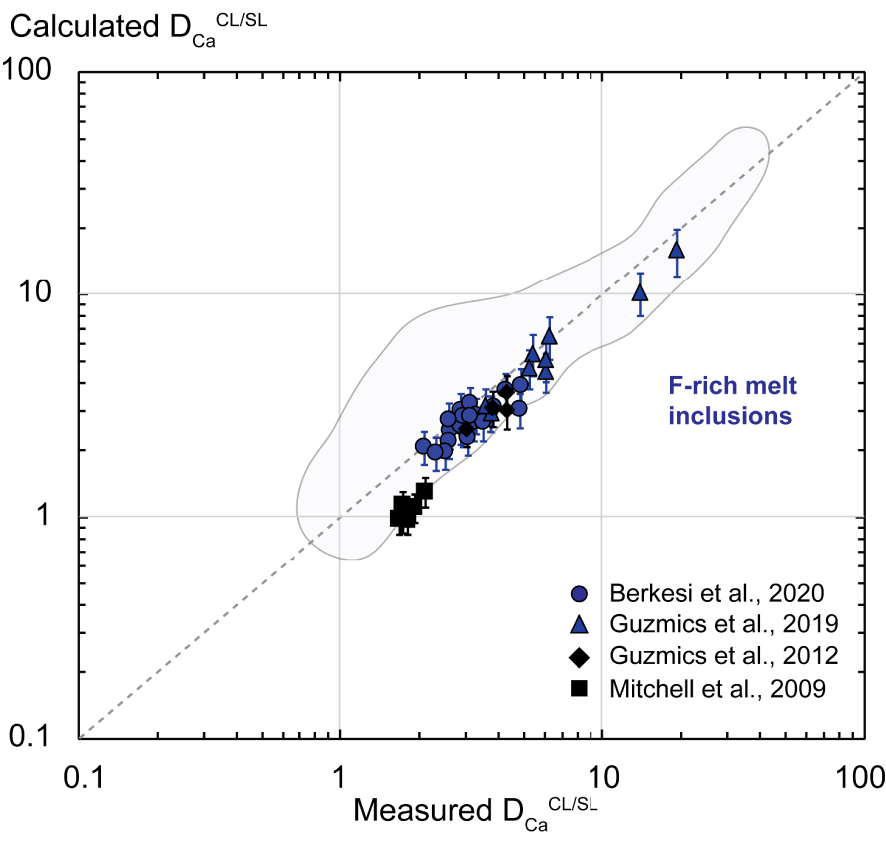
Application of the carbonate melt REE enrichment model from Nabyl et al. [2020] on natural carbonate and silicate melt inclusions. Modelled Ca partition coefficients between carbonate and silicate liquids (Calculated
Application of the carbonate melt REE enrichment model from Nabyl et al. [2020] on natural carbonate and silicate melt inclusions. Modelled Ca partition coefficients between carbonate and silicate liquids (Calculated
4.4. Role of the fluid phase
This section aims at highlighting a possible role of the fluid phase in REE behaviour between carbonate and alkaline silicate melts. As explained in Section 3.1, some charges present the texture of a fluid phase in contact with the carbonate and the silicate liquids (Figure 1d; Figures 2a, d and f; see Table 2), and the evidences presented above indicate its possible implication in Cl, alkali and REE behaviour.
The carbonate and silicate liquids in the Cl-rich system have low Cl concentrations (Cl < 1 wt%; samples PCPC5_02, PCPC5_03 and PCPC6_02; see Tables 2 and 3), despite the starting material containing 4.72 wt% of Cl (PhCbn 4, Table 1). The
Moreover, the alkali content of carbonate melts decreases in the Cl-rich system with the addition of water (3 and 6 wt% of H2O, samples PCPC5_02 and PCPC5_03, see Section 3.2 and Figure 3d). As the carbonate melts show a porous texture (Figures 1d and 2g), we can presume that Cl− forms complexes with Na+ or K+ that concentrate into the fluid phase at equilibrium with other liquid and crystal phases. The addition of water increases the amount of fluid phase, which accordingly enhances the removal of Na, K and Cl from both melts. The fluid phase plays an important role in the carbonate melt composition in the Cl-rich system, therefore leading to a change in the concentrations of alkali elements in carbonate melts.
Furthermore, the carbonate melt REE concentrations are also slightly lower in the Cl-rich samples with additional water (PCPC5_02 and PCPC5_03, Table 4; see Section 3.3), whereas the silicate melt REE concentrations do not vary significantly (Table 4), apart from the Ce concentration as described above. This results in a decrease in
5. Conclusion
This study presents experiments on the REE partitioning between immiscible alkaline silicate melts of nephelinite–phonolite type and carbonate melts, for systems that are doped in F, Cl and P. The partitioning data for these doped systems are indistinguishable from those previously modelled by Nabyl et al. [2020] in F-, Cl- and P-poor systems. The Nabyl et al. [2020] REE partitioning model can therefore be applied on any system. We use this model on natural melt inclusions revealing carbonate–silicate pairs that can be used as a test of equilibrium and to predict the level of REE enrichment in the carbonatite melt. We suggest that Cl-rich systems tend to form magmatic fluids that are likely enriched in Na and REE. Further studies on the fluid phase are nevertheless necessary to link the magmatic processes and the late magmatic hydrothermal processes thought to be commonly involved in the formation of REE-rich deposits.
Conflicts of interest
Authors have no conflict of interest to declare.
Acknowledgements
This study was a part of Z. Nabyl’s PhD, and was supported by the European Research Council (Grant no. 279790), the LABEX VOLTAIRE project (ANR-10-LABX-100-01) and the BRGM. Part of the experiments used was funded by the EquipEx PLANEX project (ANR-11-EQPX-0036). We thank J.-L. Devidal from the LMV laboratory (Laboratoire Magmas et Volcans, Clermont-Ferrand, France) and S. Erdmann from the ISTO laboratory (Orléans, France) for their support with LA-ICP-MS analysis and data treatment. We are grateful to two anonymous reviewers for their constructive comments and thoughful advices on this manuscript.