


 CC-BY 4.0
1. Introduction
Man made glasses started to be produced five millennia ago [Henderson 2013]. Through history, this industry has carried on the same base principle of mixing sand and a flux (alkali-based) to lower the melting point of silica (1710–1730 °C) and to obtain after melting and quenching, a vitrified solid material. Across ages, the empirical progresses of the technique have led to key changes in the properties of the obtained glass: the improvement of workability and transparency allowed the production of windows (first produced by pouring the glass on a flat surface and then by blowing—1 BC). The combination with coloring elements led to the development of a broad color palette allowing a multitude of artistic applications. Optical and viscoelastic properties of the glass derive directly from its chemical composition, which captures key features of its production, of interest to archaeologists, art historians, material scientists and conservation scientists viz., the raw materials and the techniques. Despite well-known key milestones in the evolution of the glassmaking technology, the detailed knowledge of the production techniques and their evolution remains to be revealed.
The rose of the Sainte-Chapelle in Paris representing the Apocalypse of Saint John.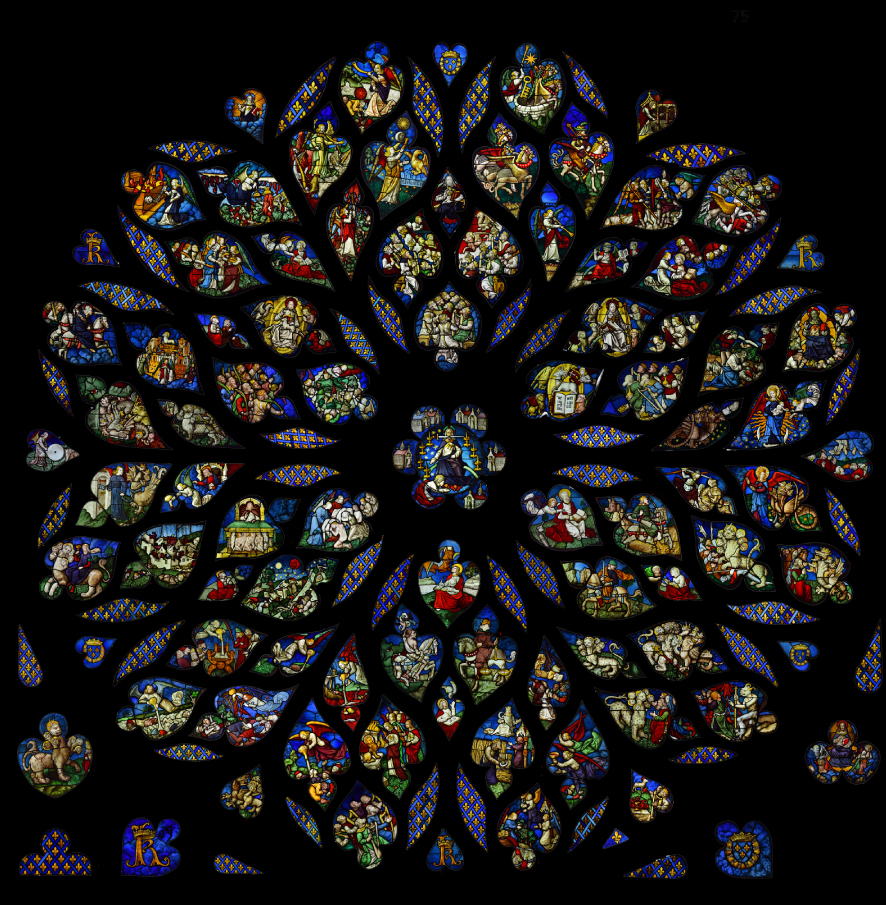
Throughout the Middle Ages, the architectural progresses allowed increasingly large apertures in the wall of immense buildings like cathedrals, where the stained glass windows could flourish as an art of pure color, symbolizing the incarnation of the divine light. The aesthetical evolution across centuries directly resulted from the diversification of the available colored glasses, a direct result of the technological progresses.
A unique witness of the technological evolution of glassmaking during the Middle Ages is hosted in the Sainte-Chapelle in Paris (France), designated a UNESCO World Heritage site, built between 1242 and 1248 by King Louis IX (Saint Louis) to receive the Passion relics. The chapel is characterized by an impressive corpus of stained glasses, mostly original, literally replacing the stone of the walls and illustrating the Old and New Testaments. While the glasses of the nave date from the initial construction, the rose of the Apocalypse (Figure 1) was replaced at the end of the 15th century by order of King Charles VIII (Figure 2a). This two-centuries-long gap led to striking artistic differences in the style of the stained glasses with complex and detailed figures and composition, changing from the sculpture aesthetic toward painting aesthetic. These glasses present a key transition from a medieval to a Renaissance painting style [Leproux 1993]. This has only been possible thanks to evolution in the materials used by the glazier. Very few archives about the origin of these glasses have survived, and most knowledge results from the 1850s restoration, then their secured storage during WWII, and the detailed inventory performed by Jean Lafond afterward, though only in situ with binoculars [Aubert et al. 1959].
(a) Stained glass windows of the Sainte-Chapelle in Paris (13th century: yellow, 15th century: pink); (b) map of the analyzed panels according to the techniques (n.a.: not analyzed), lettering and numbering refer to the panels.
Benefiting from the restoration work organized in 2014–2015, we present the results of the study of the stained glass panels of the rose after cleaning. The renewed authenticity screening of the windows (87 illustrated panels), in the ideal ex situ context of the restoration workshop, has revealed that most of the glasses are originals, thus providing an exceptional corpus of glasses testifying to the medieval glassmaking techniques.
The handling of the complete panels allowed selecting significant glasses from both the historical and physical-chemistry points of view. The glasses were chosen for the color palette represented and their authenticity. Two kinds of non-invasive and non-destructive measurements were performed (Figure 2b). The chemical composition of glasses from four panels were obtained by ion-beam analytical methods (Particle Induced X-ray Emission and Particle Induced Gamma Emission: PIXE and PIGE), which allows determining a large set of 35 major and minor chemical elements in a single acquisition [Calligaro 2008; Fleming and Swann 1987; Hunault et al. 2017a; Kuisma-Kursula 2000; Van Wersch et al. 2016; Vilarigues et al. 2020; Vilarigues and da Silva 2004]. Complementary qualitative portable X-ray fluorescence (XRF) measurements on a larger selection of panels were also achieved. The colors of the glasses were investigated by optical absorption spectroscopy (OAS) using a portable setup [Hunault et al. 2016b]. The study of the paintings (“grisaille” and yellow silver stain) falls beyond the scope of the present paper.
This study aimed at determining the color palette and types of glasses used, their chemical composition, their elaboration conditions and inferring the origin of the glasses. The obtained results are discussed in the perspective of the results published earlier on the 13th century stained glass windows of the nave [Hunault et al. 2021], to determine the changes in glassmaking technique between the 13th and 15th centuries.
2. Methods
2.1. Historical identification of the glasses
The restoration of the rose in 2014 was the unique opportunity to take a close look at each of its panels individually and update the detailed dating of each glass piece. In this interdisciplinary project, this task was conducted by art historians for each one of the 87 illustrated panels. The dating is achieved using several visual criteria such as marks of blowing technique, irregularities, thickness variations (between 2 and 4 mm), the cutting pattern of the edges when visible, alterations and last but not least the style of the paintings on the glasses. It enabled to distinguish original glasses from the 15th century and more recent glasses introduced during the successive restoration campaigns. Inserts and replacements of early modern and medieval glasses have been identified. Apart from a few exceptions, the chemical composition analyses agreed with the historical identification.
2.2. PIXE–PIGE chemical composition analysis
Four panels (K1, N3, S1 and T9, Figure 2b) were selected for ion-beam analyses (IBA) at the New AGLAE facility of the C2RMF in the Louvre (Paris, France). These panels were chosen based on a majority of original 15th century piece of glass and a large variety of the colors. A total of 36 glasses were analyzed by Particle Induced X-ray Emission and Particle Induced Gamma Emission (PIXE and PIGE) techniques. For each glass, both sides (inside and outside) were analyzed except the colorless glasses for which only the inside was analyzed. These non-destructive analyses were performed directly on the panels without sampling or removing the glass pieces. PIXE and PIGE analyses are performed simultaneously. PIXE analysis was performed using four silicon drift detectors (SDD): the first one is dedicated to the analysis of low Z elements (10 < Z < 29) and magnet and a helium flux are used to avoid backscattered particles and reduce the absorption of incident X-rays by air; the three other SDD were dedicated to high Z elements (Z > 26) and an aluminum filter (50 μm) is placed in front of the detector in order to absorb the low-energy X-rays. One HPGe detector is used for the PIGE measurement. The incident proton beam is 3 MeV with intensity of 3 to 4 nA. The analysis is 200 ms by point and the analyzed area is 1 mm2, using a 50 μm-diameter beam. For each glass sample, three measurements are performed at different points. The obtained composition correspond to the mean composition of all the analyzed area. The PIXE spectra are processed using GUPIX software combined with TRAUPIXE software developed at AGLAE [Campbell et al. 2010; Pichon et al. 2015], assuming that analyzed zones are homogeneous and that all elements are present as oxides. The geochemical diorite DR-N sample and Brill A, B, C and D glasses [Vicenzi et al. 2002] were used as reference materials to calibrate the PIGE data and control PIXE results. The composition given in this paper result from the combination of PIXE data and the sodium content obtained by PIGE.
Data were analyzed using the R software. Hierarchical cluster analysis (HCA) was performed using Ward’s method and Euclidean distances. This analytical tool has been used previously in several studies to help comparing glass composition [Cox and Gillies 1986; Kunicki-Goldfinger et al. 2000; Schalm et al. 2007].
2.3. Portable X-ray fluorescence spectroscopy
A total of 22 panels including the four panels analyzed at New AGLAE (Figure 2b) were studied using portable XRF. This allowed performing the analyses in the restoration workshop, on cleaned panels and avoiding their transportation. For all glasses, both sides of the glass were analyzed. The glasses analyzed at New AGLAE were also analyzed with XRF to allow comparison. Qualitative interpretation of the results allowed in most cases the comparison between the interior and exterior sides of the glass and the identification of flashed glasses.
XRF measurements were performed using a Bruker Tracer III-SD portable X-ray fluorescence spectrometer equipped with a rhodium target X-ray tube and a X-Flash® silicon drift detector with a resolution of approximately 145 eV at 200,000 cps. For each side of each glass, two excitation parameters were used: 15 kV/55 μA and 40 kV/16 μA without filter, with a vacuum pump and a count time of 180 s. The analyzed surface is approximately 10 mm2. With this configuration, elements heavier than aluminum (Z = 13) can be detected. The instrumentation used emits low-energy X-rays and the operators are therefore equipped with passive and active dosimetry. An exclusion zone is set up in order to comply with X-ray safety regulations.
2.4. Optical absorption spectroscopy
The optical absorption spectroscopy (OAS) measurements were performed in parallel to the chemical analyses on the same glass pieces (Figure 2b). We used a mobile setup described elsewhere [Hunault et al. 2016b], which enabled measuring optical absorption spectra in transmission over the entire UV–visible–NIR energy range (350–2500 nm) thanks to two different detectors. The beam size on the sample was smaller than 1 mm2 and enabled to select a precise spot of analysis, free from alteration and paint.
Colorimetric analysis was achieved by computing the CIE L*a*b* values in the colorimetric system defined in 1976 by the International Commission on Illumination. The colorimetric CIE L*a*b* values were calculated using D65 illuminant and CIE 1931 2° observer. L* describes the luminosity of the color (0: black; 100: white) and a* and b* describes the color hue: a* varies from − 120 (green) to 120 (red) and b* varies from − 120 (blue) to 120 (yellow), the higher a* and b* in absolute value, the more saturated the color.
2.5. Thickness
Glass thickness was measured with an Olympus ultrasound thickness gauge 45MG-X-MT-E.
3. Results and interpretations
3.1. The color palette
The color of the glasses makes the first important difference between the glass pieces of the rose of the Sainte-Chapelle in Paris and those from the nave (13th century). While early medieval glasses present only six well defined colors [Hunault et al. 2021], the Renaissance’s glasses show a wide variety of hues, as well as new colors such as various greens and violet, which are distinct from purple (Figure 3a). Despite a wide variety, glass colors are grouped into main categories following the naming by art historians as given in Figure 2. The CIEL*a*b* data (Figure 3c) show the color variety. It further illustrates the ambiguity when naming colors as some very close points are assigned to different colors.
(a) Panel S1 and identification of the colors; (b) repartition of the analyzed colors; (c) CIE L*a*b* parameters obtained from optical absorption spectroscopy.
Furthermore, naked eye observations of the panels reveal the presence of flashed glasses that enable the making of engraved patterns. Flashed glasses are composed of two (or more) layers of glass assembled together during the blowing process. The two glasses, often a colored one (e.g. blue or red) and a colorless one, come from two glass pots that were prepared at the same time. Medieval flashed glasses were already in use to produce red glasses since the 12th century [Kunicki-Goldfinger et al. 2014]. We observe in the glasses of the rose that this technique has been applied to other colors. Flashed glass could be identified by naked eye observations when the glass pieces presented a shard, or an engraving, or when the edge of the glass could be observed. However, if none of these signs are visible, it is impossible to determine by eye whether a glass was flashed or not. As a consequence, it required systematically analyzing and comparing the chemical composition of both sides of each glass piece. A flashed glass could often be identified by variations in the chromophore composition between each side of the glass. Overall, the combination of naked eye observations, PIXE–PIGE measurements and XRF analyses revealed that about 40% of the analyzed ancient glasses were flashed, 50% were not flashed and for 10% of the ancient glasses it was not possible to reach a conclusion. Other complex colored effects, such as striated glasses [Hunault et al. 2017a], red flames in green glasses, “verre aspergé” are found (Figure 4).
Overall, these stained glasses present a more diverse color palette than the stained glasses from the 13th century nave, suggesting more sophisticated glass production and a better control of colors. In the following, we will present the detailed investigation of the chemical composition and color of these glasses.
Details of some panels: examples of (a) flashed glasses and (b) other complex (“fouettés”) glasses. Yellow is obtained with silver-stain paint.
3.2. Composition of the glass matrix
3.2.1. Compositional group
Medieval glasses were obtained by melting sand, the source of silica (SiO2), which is the main network former and a flux, the source of alkalis (potassium and sodium in particular) and alkaline earth elements (calcium and magnesium), which allow lowering the melting temperature of silica down to 1100–1200 °C [Hunault et al. 2017b], a temperature range reached by medieval furnaces. The glass matrix composition (major components) can inform us on the type of recipe, in particular, the type of flux (alkalis and alkaline earth elements) used by glassmakers. In the case of the rose of the Sainte-Chapelle in Paris, the 15th century glass matrix is of potash-lime silicate type. The PIXE–PIGE data show the presence of magnesium (on average 4.5 wt%) and relatively similar contents of potassium (average: 14.6 wt%) and calcium (average: 14 wt%) as oxides, which correspond to a typical plant-ash glass recipe observed in medieval Northern France [Adlington et al. 2019; Hunault et al. 2021]. The ternary diagram in Figure 5 compares the chemical composition of the glasses in terms of potassium, sodium and calcium of the rose (15th century) and the nave (13th century) published earlier [Hunault et al. 2021]. The relative proportions of these elements are a marker of the type of flux and ashes used. The compositions are typical from recipes using wood ashes. The chemical composition of the ashes varies with the nature of the wood, its growing context (soil, climate), and its overall history [Jackson and Smedley 2008, 2004; Smedley and Jackson 2002]. Yet, despite separated by a gap of two centuries, the glasses of the rose belong to the same group of composition as the glasses of the nave: a high potassium content and a potassium to calcium ratio close to 1 or more (average 1.1, see Figure S1 in supporting information). We note however, that contrary to the 13th century glasses of the nave, the glasses of the rose do not show any sodium-enriched content (i.e. more than 1.5 wt% Na2O), except two yellow glasses and to a lower extent a purple one [Hunault et al. 2021].
Ternary diagram of the chemical composition: (top) complete diagram showing the three typical wood-ash glass composition according to [Jackson and Smedley 2004]; (bottom) zoom on a sub-part of the diagram where the data from the rose are compared to the data from the nave [Hunault et al. 2021]. Marker shapes distinguish between colored glass and colorless glass and the interior side and exterior side of the glasses. Colors represent the color category of the glass.
3.2.2. Glass matrix minor elements
The comparison between the chemical composition of the glasses of the nave and the rose reveals that differences are only clearly observed in the concentration of minor components (see Supporting Information): Cl, Ti and Zr. The chlorine content is higher in the glasses from the nave ( >3500 ppm on average) than in the glasses from the rose. No clear correlation with the sodium content is found, which discounts the use of salt in the glass recipes.
Chemical composition obtained by PIXE for (a) titanium and aluminum contents and (b) titanium and zirconium contents. For markers legend refer to Figure 4. Error bars are of the size of the markers. Color: 15th century rose, gray: 13th century nave according to Hunault et al. [2021]. Strong correlation can be observed for the glasses of the rose.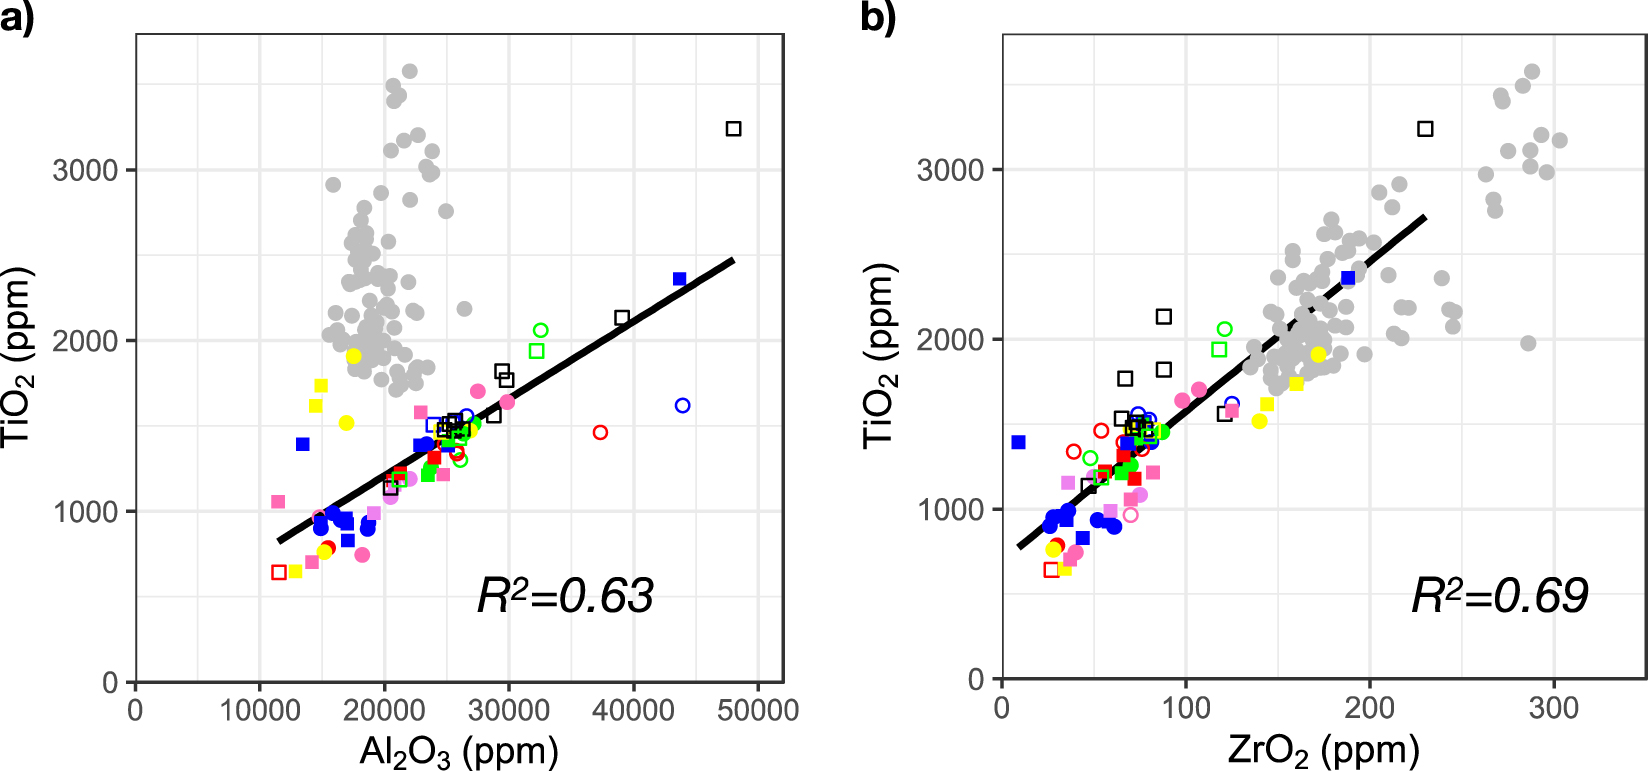
Figure 6 shows the composition of the glass pieces of the rose (15th century) for the corresponding oxides compared to the nave (13th century) [Hunault et al. 2021]. Apart from a few outliers, we observe linear correlations between the titanium and aluminum and the titanium and zirconium contents of the glass pieces of the rose (R2 = 0.63, and 0.69 respectively) (Figure 6). While no correlation between the titanium and aluminum content was found in the case of the nave, the correlation between titanium and zirconium is in line with the data from the nave. However, the concentrations are overall lower in the glass pieces of the rose than in those of the nave. The latter are similar to values observed in a corpus of French medieval glasses recently investigated [Capobianco et al. 2021]. The linear correlation between Ti and Zr contents is often observed in ancient glass [Aerts et al. 2003; Brems and Degryse 2014; Hunault et al. 2021; Rehren and Brüggler 2015]. It arises from a similar speciation of Ti and Zr: in the sands used for glass making, both are located in specific heavy minerals, zircon, rutile and ilmenite mainly. As these minerals have a refractory character and as Ti and Zr are non-volatile elements, the Zr/Ti ratio in the sand does not change during glassmaking. In addition, the high silica nature of these glasses makes their chemical composition mostly inherit from the geochemical signature of the initial sand raw materials. Tertiary sands from the Ile de France region come from the disintegration of the Massif Central weathering cover. During the transport, the concentration of heavy minerals varies with the dynamics of sedimentation, but the ratio between these heavy minerals does not change, as they are similarly transported and sedimented. Thus the linear correlation observed on Figure 6 suggests that the glass used for the rose was produced with sands from similar geological sediments. The lower concentrations found in the glass samples of the rose suggest the use of a sand of higher quality than the sand of the nave.
Glass matrix composition varies with several factors, which can be sorted into two categories [Freestone et al. 2009; Jackson 2005]: “natural variability”, arising over time from the intrinsic variation of the chemical composition of the raw materials, like the nature of the soil on which the trees grow, or the weather, and “behavioral variability”, arising from variations in the glassmaker practices, either between different workshops or within the same workshop according to an evolution of the recipes. In addition to these variations, one should also consider the potential influence of the surface alteration of the glass.
3.2.3. Influence of glass surface alteration
The chemical composition of the two sides of all colored glasses (interior and exterior) have been analyzed. In Figures 5 and 6, empty circles or square markers correspond respectively to colorless glass from either the exterior side or the interior side of the glass. The exterior side is facing the outside of the building and therefore is the most influenced by weathering. The glasses of the rose show a very good state of conservation without craters or layers of uniform alteration. The brightness of the glass is also intact. The effect of atmospheric alteration on glass composition, was assessed by comparing the compositional data between the interior and the exterior of non-flashed glasses, as they were made from a single glass piece obtained from a single glass batch.
Figure 7 shows as box plots (median, and first and third quartiles) the relative compositional variations between the interior and the exterior, which are compared to the averaged statistical analytical error (averaged relative standard deviation of the analysis). The elements are ordered by increasing atomic number (Z). For some glasses, the compositional difference of sodium, potassium, calcium, aluminum and magnesium between the interior and exterior sides of the glass are significantly larger than the averaged measurement statistical error. The variation difference is negative (smaller concentration on the exterior side than on the interior side) for potassium, calcium and magnesium and positive (higher concentration on the outer side than the inner side) for sodium and aluminum. We further observe a correlation between the variations of the concentration of potassium and calcium, silicon and aluminum, and anticorrelation between silicon and calcium (see Figure S3 in the supporting information). Apart from the case of sodium, these variations and correlations agree with a limited surface alteration process: lixiviation of mobile alkaline and alkaline earth cations resulting in a relative increase in the concentration of elements that form glass: silicon and aluminum [Gentaz et al. 2016; Libourel et al. 2011; Lombardo et al. 2013; Verney-Carron et al. 2017].
Box plots (median, and first and third quartiles) of the relative variations of the chemical composition between the interior side and the exterior side of non-flashed glasses. The red lines represent the relative standard deviation of the chemical analyses (measurement uncertainties).
These results should be discussed in light of the probing depth of the analytical methods: for PIXE, calculations performed with the GUPIX software show that the probing depth for light elements (Mg, Al) is of the order of 5 μm, while for K and Ca, it reaches 20 μm. As a result, the relative volume ratio of altered/non-altered glass decreases with increasing atomic number of the element. In the specific case of sodium, we used on purpose PIGE, which provides a probing depth of about 50 μm. As a result, the sodium measurements are relatively not influenced by the alteration and the positive relative variation reported in Figure 7 is likely an effect of the normalization of the chemical composition. Altogether, these results show that the possible influence of a small surface alteration, mainly affects the variability of sodium, magnesium and aluminum. Other elements are less influenced.
3.2.4. Workshop variability
The large number of flashed glasses analyzed offers the unique opportunity to estimate the composition variations within a workshop since each of these glasses is made of two glasses melted at the same time in two different pots and blown together. In an earlier work on a striated glass containing glasses from four different glass pots (colorless, red, purple and blue), Hunault et al. [2017a] determined a “daily workshop variability” criterion as the relative standard deviation of composition for the major component elements (Table 1). Here, although we can only consider pairs of glass pots, we can calculate similarly the compositional variation between the two glasses of each pair. The box plots of Figure 8 show a relative standard deviation of the composition between each side of the glasses for sodium, potassium, calcium, aluminum, magnesium, phosphorous and silicon as oxides. We distinguish the flashed glasses from the non-flashed glasses since, in the first case, the variability is due to glass heterogeneity and alteration, and in the second case, it also accounts for the variations in the glass recipes used for two different glass pots. The black horizontal lines indicate the “daily workshop variability” estimated earlier [Hunault et al. 2017a].
Relative standard deviation of composition obtained by PIXE–PIGE for the main oxides for different groups of glasses
| Na2O | MgO | Al2O3 | SiO2 | P2O5 | K2O | CaO | |
|---|---|---|---|---|---|---|---|
| Daily “workshop variability” according to Hunault et al. [2017a] | |||||||
| Rel. SD (%) | 14 | 4 | 6 | 1 | 3 | 4 | 7 |
| All analyses (N = 68) | |||||||
| Av. (wt%) | 0.9 | 4.5 | 2.3 | 55 | 3.9 | 14.6 | 14 |
| Rel. SD (%) | 64 | 19 | 32 | 4 | 20 | 13 | 13 |
| Interior side only (N = 39) | |||||||
| Av. (wt%) | 0.9 | 4.7 | 2.3 | 55.2 | 3.7 | 14.5 | 14.7 |
| Rel. SD (%) | 59 | 20 | 35 | 5 | 19 | 15 | 14 |
| Exterior side only (N = 29)∗ | |||||||
| Av. (wt%) | 0.9 | 4.4 | 2.3 | 56 | 4.0 | 14.6 | 14 |
| Rel. SD (%) | 70 | 17 | 30 | 3 | 21 | 11 | 11 |
| Cluster 1 (N = 58) | |||||||
| Av. (wt%) | 0.8 | 4.6 | 2.3 | 55 | 4.0 | 15 | 14 |
| Rel. SD (%) | 30 | 17 | 25 | 4.0 | 16 | 8.3 | 9.0 |
∗Only colored glasses were analyzed on the exterior side.
We observe that for sodium, potassium and calcium, the variations are smaller than the “daily workshop variability” criteria. For aluminum and magnesium, the variations are larger, but this can be assigned to the influence of glass surface alteration (although the glasses appear visually as non-altered) (see previous paragraph). This comparison provides a confirmation of the validity of the “daily workshop variability” criteria for the elements sodium, potassium and calcium, as estimated from the comparison between four glasses.
What about the entire glass corpus? Are all the glasses from the same workshop?
Relative standard deviation of the chemical composition between both sides of the glass. The black line represents the “workshop variability” as determined in Hunault et al. [2017a].
Table 1 gives the relative standard deviation of composition for the main oxides, for all analyzed glasses, interior side only and exterior side only analyses. We observe that the relative standard deviations of all three groups of glasses are similar for a given element oxide, and that it exceeds the “daily workshop variability” by at least a factor of 4. This result is not surprising since, even though all glasses were from the same workshop, they would not have been produced on the same day. Their composition might therefore vary based on variations of the nature of the ashes used and maybe small variations in the recipe.
The evidence of structure (e.g. clusters) in the data can be achieved using different multivariate analyses. Similar to the approach of Hunault et al. [2021] for the study of the glasses of the nave, we can distinguish glass clusters that would have a smaller compositional variability than the entire corpus. We have therefore used a hierarchical cluster analysis approach based on the content of major elements: Ca, K, Mg, P and Na. The variable selection is performed in order to focus on the glass matrix composition assuming that in a given glass workshop, the same glass recipe and same raw materials would be used to produce all different glasses. Elements related to the colorants are ignored [Baxter and Jackson 2001]. The dendrogram is given in Figure 9. The two first branches correspond to ten outliers, including the three yellow glasses, that can also be identified in Figures 5 and 6. The third and most important branch contains most of the glasses. For each glass of this branch, both the exterior and interior side analyses are found within this branch. We observe that the closest leaves are often the interior side and exterior side of the same glass pieces for non-flashed glasses. Concerning flashed glasses, exterior and interior side analyses can lie quite far apart although they certainly arise from the same glass workshop. Therefore, within this branch it is not possible to distinguish between sub-clusters of glasses from different origins based on the major component composition. The composition variability within this branch has been estimated and is given in Table 1. It is about 2 to 4 times higher than the “daily workshop variability”. This agrees with the fact that these glasses were probably produced over several days.
Dendrogram obtained considering the major glass matrix components except silica: Ca, Mg, K, Na, P.
3.3. A large palette of colors
Medieval glasses were colored using transition metal ions added to the glass by the glassmakers [Bamford 1977; Capobianco et al. 2019; Freestone 1992; Hunault et al. 2021] except in the specific case of silver yellow paint, which was painted on the glass surface by the glazier. The combination of chemical analyses and optical absorption spectroscopy allows us to determine the nature of the coloring species in the glass and reveal complex compositions as compared to the earlier medieval glasses [Hunault et al. 2021].
3.3.1. Colorless and purple glasses
Colorless and purple ancient glasses are respectively discolored by the iron and manganese compounds present in the raw materials [Bidegaray et al. 2020, 2019; Capobianco et al. 2019; Gliozzo 2017; Hunault et al. 2021; Jackson 2005] and colored by addition of manganese [Bidegaray et al. 2019; Capobianco et al. 2021, 2019; Hunault et al. 2021, 2017a]. We note that contrary to some Roman glasses, here antimony, sometimes used as a decolorizer, is systematically found below the detection limit for all glasses [Gliozzo 2017; Jackson 2005]. By purple, we refer to glasses of more of less intense tan hue used for the complexion of characters or purple color used for clothes. We make a distinction with violet glasses which have a distinct optical absorption spectrum and this is discussed in the next paragraph. As shown in Figure 10, the optical absorption spectra of colorless glasses show the typical broad absorption band from Fe2+ around 9000 cm−1 (1100 nm) providing to the glass a light greenish-blue hue. The optical absorption spectra of a purple glass show the broad absorption band of Mn3+ around 20,000 cm−1 (500 nm) and no absorption band from Fe2+. This results from the redox equilibrium between Fe2+/Fe3+ and Mn2+/Mn3+ making Mn3+ incompatible with Fe2+ [Capobianco et al. 2021; Hunault et al. 2017a; Schreiber et al. 1994].
Optical linear absorption (normalized by thickness) spectra of typical colorless and purple glasses (panel N3 and K1, the later being flashed).
Figure 11a shows the iron and manganese contents of these glasses. For colorless glasses, the average iron and manganese content is 0.88 ± 0.02 wt% (as Fe2O3) and 1.11 ± 0.01 wt% (as MnO), respectively. For the four analyzed purple glasses, the total iron content is on average 0.52 ± 0.01 wt% (as Fe2O3), which is significantly lower than for colorless glasses. This agrees with observations made on purple glasses of the 13th century nave [Hunault et al. 2021] and it is slightly lower than the iron content in other medieval glasses [Capobianco et al. 2021]. Three different cases of manganese contents were found in correlation with the structure of the glasses: (i) two glasses show similar manganese contents in both faces (1.6 wt%), significantly higher than the manganese content in colorless glasses; (ii) one glass (light purple hue) shows among the lowest manganese total content on both sides ( <1 wt%); (iii) one glass (light purple color also described as flesh-colored, panel K1) shows a low manganese content on one side (0.07 wt%) and a high manganese content on the other (5.2 wt%) suggesting a flashed glass. This is further supported by the optical absorption spectrum (Figure 10), which shows both Fe2+ and Mn3+ absorption bands, which are incompatible: the Fe2+ arises from the colorless layer and the Mn3+ absorption band arises from the purple layer.
(a) Manganese versus iron total contents as MnO and Fe2O3 respectively. (b) Manganese versus barium contents. Dashed lines link two data points from the same glass pieces (inside and outside). Data points from other colors are in gray for clarity. Error bars are of the size of the markers. Composition obtained by PIXE–PIGE.
Blue and violet glasses: (a) optical absorption spectra measured on panel S1 as indicated in (b).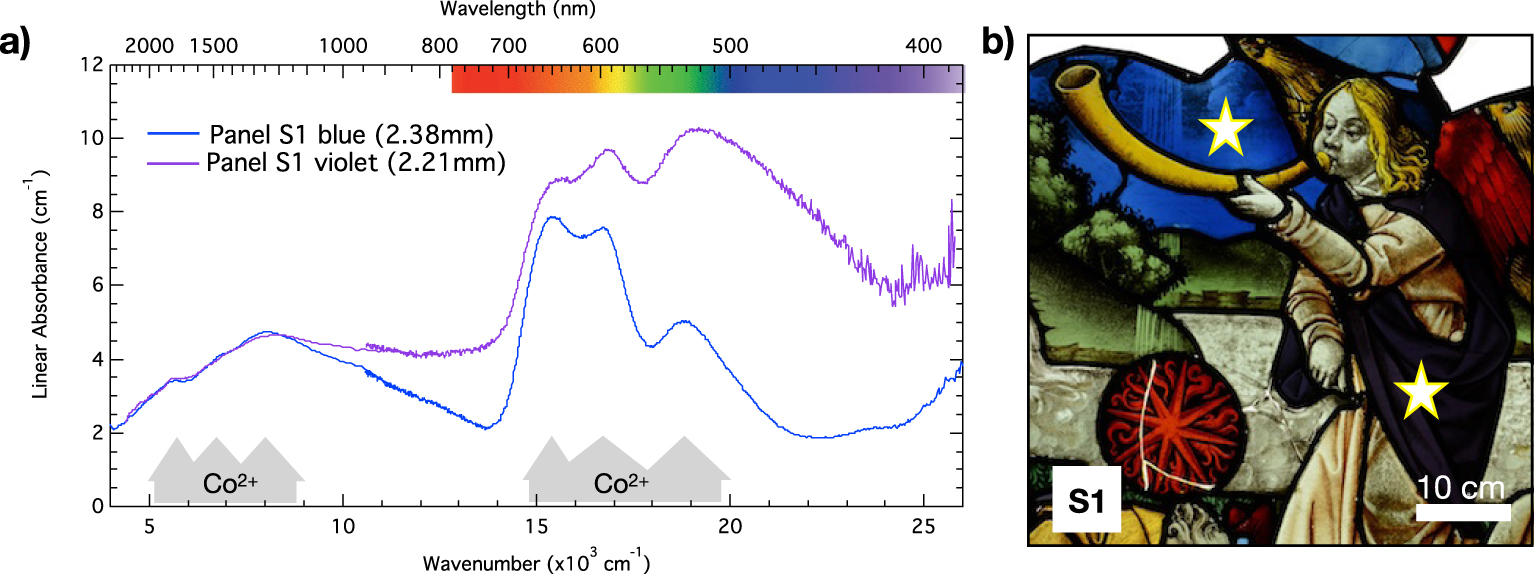
Figure 11b shows the barium content versus the total manganese content and reveals some correlation within all glasses, suggesting that the manganese arises from the ashes [Jackson and Smedley 2004] (minimum manganese offset) and also from the addition of Mn3+–Mn4+ oxide minerals like romanechite (Ba0.66Mn5O101.34 H2O), psilomelane being a discredited mineral mixture [Post 1999]. However, the high manganese content observed for purple glasses falls off the linear trend and suggests the use of a different barium-poor source of manganese, probably pyrolusite (MnO2).
The combination of the chemical composition, the glass thickness and the optical absorption data allow using the Lambert–Beer law to estimate the concentration of the coloring species and derive the redox ratios for manganese and iron in these glasses. To estimate the manganese redox, we use the Mn3+ molar extinction coefficient 𝜀 = 130 L/mol/cm [Capobianco 2018] and we find for the two bulk purple glasses analyzed with PIXE: 10% of Mn3+. This value is slightly higher than reported recently on medieval glasses [Capobianco et al. 2021]. The iron redox can be estimated using the intensity of the optical absorption band at 9000 cm−1 and the molar extinction coefficient of Fe2+ in glasses: 𝜀 = 25 L/mol/cm [Ceglia et al. 2015]. In the purple glasses cases, the iron redox is close to 100% Fe3+. In the colorless glasses, we estimate redox values varying from 55% to 80% of Fe2+ (average 73%).
3.3.2. Blue and violet glasses
The chemical composition of the blue glasses measured by PIXE and XRF show that cobalt is the main colorant used by comparison with colorless glasses. Optical absorption spectroscopy reveals the presence of Co2+ (Figure 12) [Bamford 1977; Capobianco et al. 2019; Ceglia et al. 2012; Green and Alan Hart 1987; Hunault et al. 2014, 2016a, 2017a; Meulebroeck et al. 2016; Mirti et al. 2002].
The comparison between the cobalt contents of interior and exterior sides of the blue glasses of the rose reveals that there are two types of blue glasses: flashed (blue/colorless) and bulk blue glasses. The use of the flashed blue glasses is particularly highlighted in the engraved blue glasses (Figure 4).
The analysis of the minor and trace elements reveals that in the ancient glasses, both flashed and non-flashed, cobalt is associated with nickel and molybdenum (Figure 13). We do not find any correlation with zinc, indium or arsenic (except for one sample) as can often be found in other periods [Gratuze 2013; Gratuze et al. 1996; Hunault et al. 2021]. The association with nickel and molybdenum agrees with other observations from the same period [Gratuze 2013; Gratuze et al. 1996], yet the origin of this cobalt is unclear.
(a) Nickel and cobalt contents as oxides. (b) Molybdenum and cobalt contents as oxides. Compositions obtained by PIXE–PIGE. (Gray dashed lines indicate two points corresponding to each side of the same glass.)
A new color as compared to the 13th century glasses of the nave is found in the rose of the Sainte-Chapelle: violet. This color is also found in other stained glasses from the end of the 15th century and then from Renaissance stained glasses [Leproux 1993]. The optical absorption spectrum of this color (Figure 12) reveals the presence of Co2+ absorption bands and Fe2+ NIR absorption band like in blue glasses, but another contribution overlaps at high energy. In a few cases, shards allowed revealing a flashed glass structure with one layer being blue while the color of the other layer remained undetermined. The analysis of a broken violet glass in panel J1 (Figure 14) revealed the spectrum of the other layer typical from a purple glass by comparison with Figure 12 and the absorption band of Mn3+ (Figure 14c and d). We can already note the incompatibility between the presence of the Fe2+ absorption band and the Mn3+ suggesting that the Fe2+ only arises from the blue layer.
(a) Panel J1, (b) detail of a shard in the violet glass, (c) schematic cross-section of the flashed violet glass, (d) optical absorption spectra of the violet glass, the blue part of the shard and the difference spectrum showing the Mn3+ component.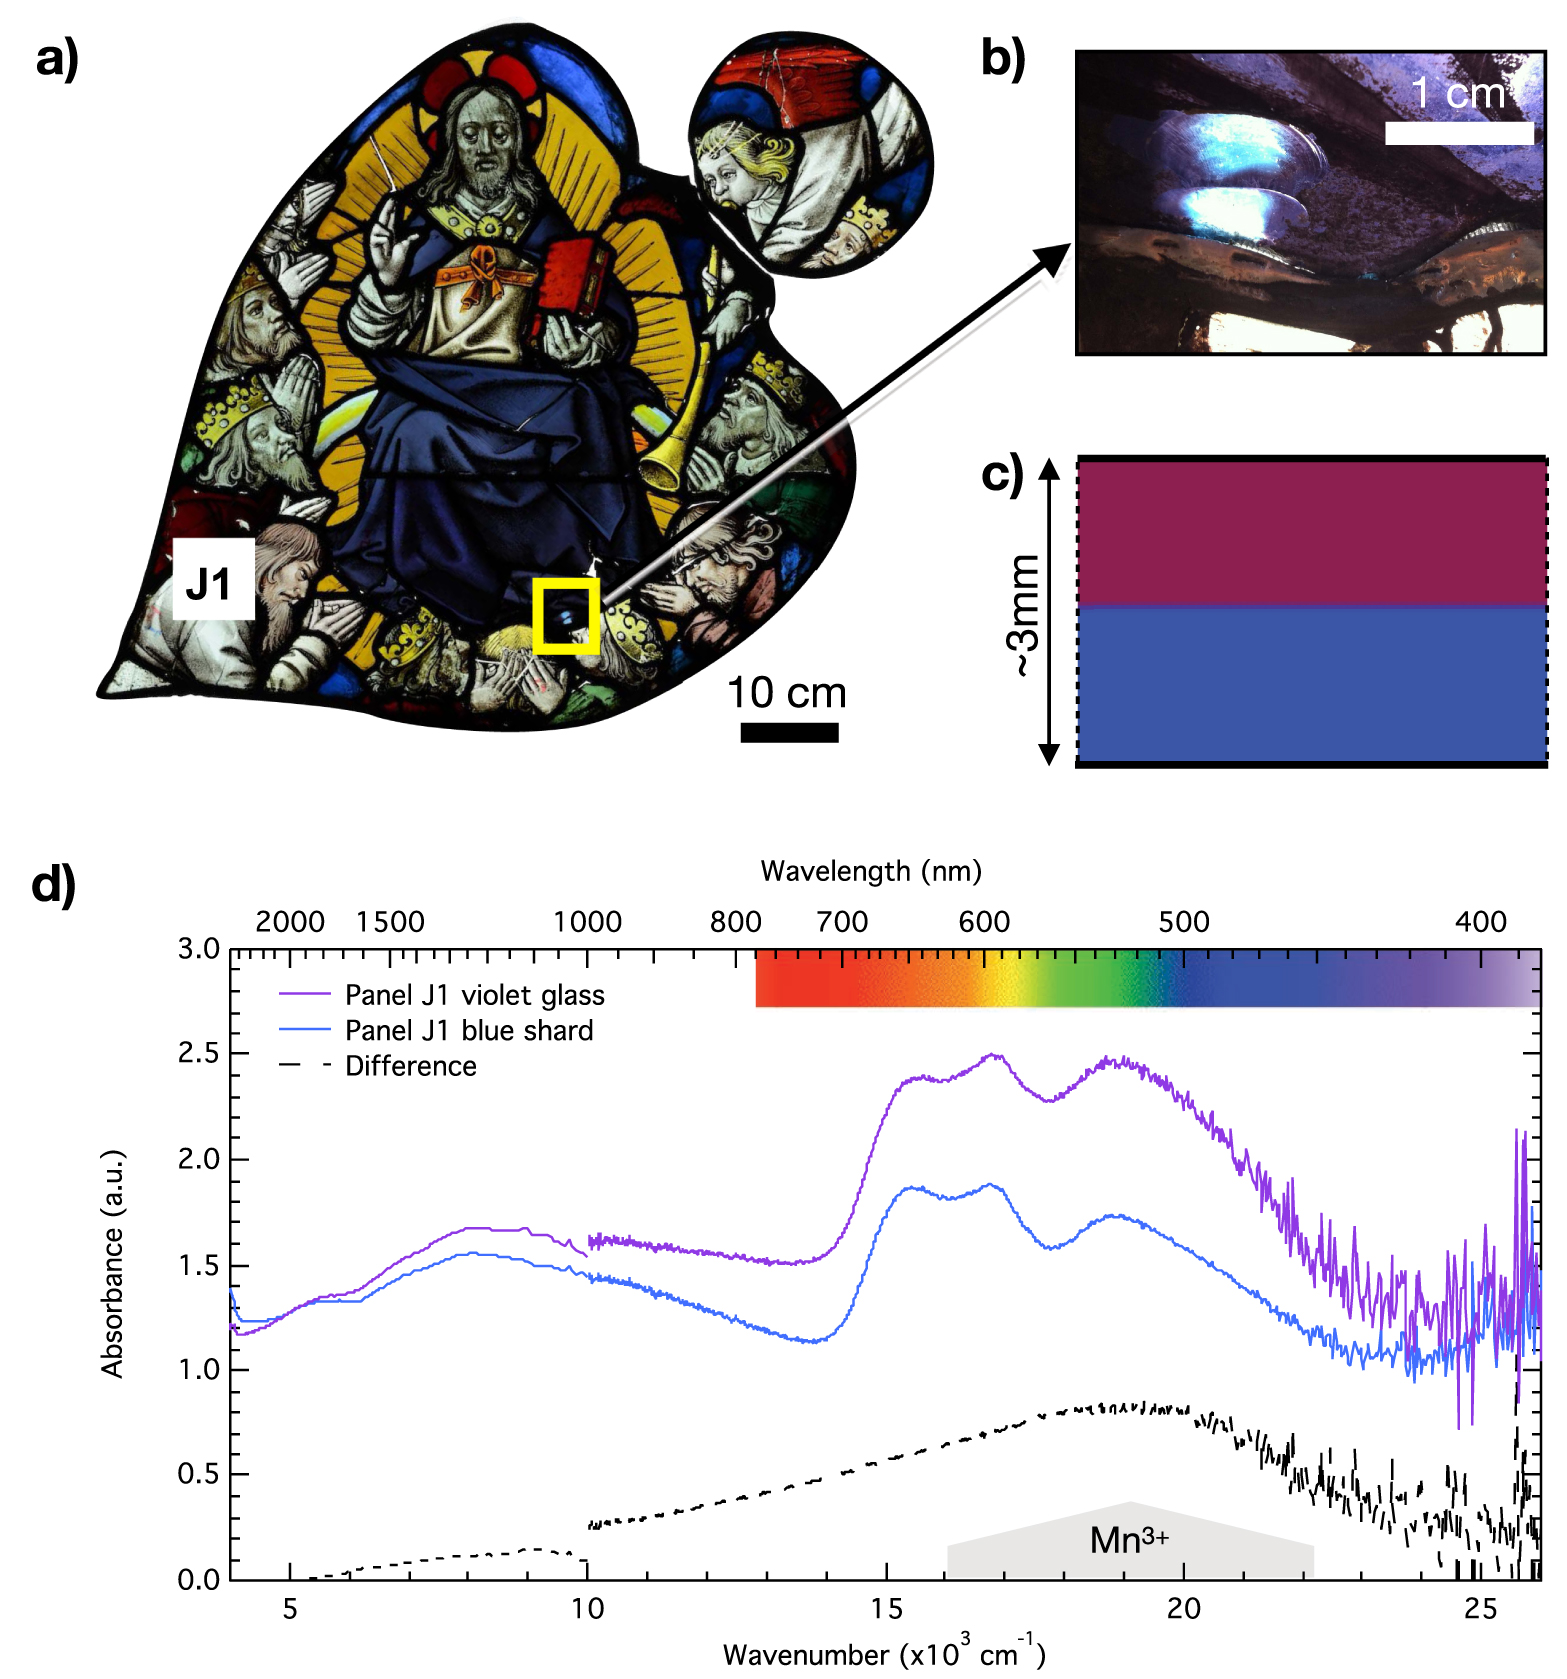
The chemical composition of the violet glasses from panel J1 was not determined. Surprisingly, the two violet glasses from panels S1 and K1 analyzed by PIXE–PIGE show same chemical composition on both sides and similar iron and manganese contents, not different from the colorless glasses, while the CoO content agrees with the blue glasses. Comparison between the optical absorption spectra of Figures 12a and 14d suggests that the same coloring process produces the violet color: Co2+ and Mn3+. However, the presence in the optical absorption spectrum of panel S1 of Fe2+ absorption bands and the low manganese concentrations prevent Co2+ and Mn3+ from being in the same bulk glass. Altogether, the chemical composition and optical absorption data allow inferring that violet glasses could be triple layered: blue/purple/blue.
3.3.3. Red and green glasses
(a) Optical absorption spectra of bulk green glass, flashed green glass, and flashed red glass from panel S1. (b) Copper and zinc contents versus copper contents as oxides analyzed by PIXE for red and green glasses (other colors shown with gray markers).
Green glasses are colored by Cu2+ as revealed by their optical absorption spectra (Figure 15a) showing an intense and large absorption band near 13,000 cm−1 [Hunault and Loisel 2020]. Some green glasses show an additional contribution from the Co2+ triple absorption bands in agreement with the relatively high CoO content (250 ppm for the S1 sample presented in Figure 15a). We find no specific use of the cobalt-containing green glasses. The PIXE analyses reveal that the total CuO content in the bulk green glass of panel S1 is 1.3 wt% (Figure 15b), which agrees with typical CuO concentrations in medieval glasses [Hunault et al. 2021]. The high copper content is needed to compensate the oxidation of Fe2+ by Cu2+, which are incompatible [Hunault and Loisel 2020] as confirmed by the absence of absorption band from Fe2+. Some green glasses show CuO contents equivalent to other colors (Figure 15b). This reveals that these glasses are flashed, in agreement with the visible observations (Figure 4). This is further confirmed by the presence of Fe2+ absorption band in the optical spectra, which can only occur in the low copper-content layer. Indeed, in glass, copper in low concentrations is mainly present as colorless Cu+ [Hunault et al. 2016a; Hunault and Loisel 2020]. Concentrations in the order of 1 wt% are typical of medieval green glasses [Hunault et al. 2021]. Some analyzed green glasses show low copper contents on both sides of the glass, which can be associated to a triple-layer flashed glass structure (colorless/green/colorless), in agreement with observations. The correlation between the copper and zinc contents (Figure 15b) suggests the use of brass as copper source.
Red glasses are also colored by copper, with reduced metallic copper nanoparticle as confirmed by the optical absorption spectra (Figure 15a) showing the typical surface plasmon resonance (SPR) around 17,580 cm−1 (568 nm) and the moderately increased copper content of red glasses (Figure 15b). The intense absorption from the SPR requires the production of thin red layers. As a consequence, red glasses always show a layered structure [Kunicki-Goldfinger et al. 2014]. The use of homogeneous flashed red glass is known since the 14th century and seems to have progressively replaced another technique called “fouetté”, which was found in the 13th century glasses of the nave of the Sainte-Chapelle in Paris. The average size of the nanoparticles can be derived from the shape of the plasmon resonance, using: , where R is the average radius of the metallic clusters, Vf is the Fermi velocity of the electrons in bulk metal (for Cu: Vf = 15.7 × 105 cm⋅s−1 [Kaye and Laby 1948]), 𝜆p is the peak position of the resonance, 𝛥𝜆 is the full width at half maximum of the absorption band (here 12 nm), and c the speed of light. We find that the average size of the Cu nanoparticle should be around 22 nm, in agreement with previous studies [Hunault et al. 2021, 2017a; Kunicki-Goldfinger et al. 2014].
(a) Optical absorption spectra of a green glass and the red marblings and the difference spectrum of a glass from panel D4 (b); (c) schematic representation of the inferred glass cross-section.
Within the green glasses, we have found special glasses showing inhomogeneous red marblings (Figure 16). We observe that these green glasses are often used in panels to create a visual effect: fabric (panel D4), monster (E2), or blood on the ground (G3). None of the panels analyzed with PIXE–PIGE contained this type of green glass. The XRF analyses of these green glasses show that these glasses are systematically flashed (double or triple layer). The comparison between the optical absorption spectra of the green glass and the marbling found in panel D4 (Figure 16a) reveals that the marbling has a typical absorption spectrum of the SPR of metallic copper nanoparticles. According to Kunicki-Goldfinger et al. [2014], the formation of metallic Cu nanoparticle can occur between two glass layers, due to the migration of Cu+ ions from the copper-rich layer to the copper-poor layer. Since the copper-poor layer is relatively more reduced than the copper-rich layer (oxidized by the excess of Cu2+), Cu+ ions undergo reduction to metallic copper and subsequent nanoparticle nucleation. In the case of green glasses, we can therefore hypothesize that the formation of the red marblings occurs between the copper-rich green layer and the copper-poor colorless layer (Figure 16c).
4. Conclusion
An extensive archaeometric study of the stained glass windows of the 15th century rose of the Sainte-Chapelle in Paris was conducted during the restoration work in 2014. The chemical composition and the colors were investigated using non-invasive and non-destructive methods.
Quantitative chemical compositions of both sides of the glasses were systematically analyzed for four panels and reveal a typical plant-ash potash-lime silicate composition. Multivariate analysis highlights that the obtained chemical composition of the glass is distinct from the 13th century nave stained glass windows of the same Sainte-Chapelle, only as far as the minor elements in the sand are concerned: aluminum from feldspar, titanium and zirconium from heavy minerals. The overall homogeneity of the corpus is further revealed suggesting a common glass production. Observations and chemical analyses reveal that half of the glasses are flashed. Optical absorption spectroscopy reveals that new colors and color effects result from the extensive use of flashed glass.
Conflicts of interest
Authors have no conflict of interest to declare.
Acknowledgments
This work was supported by the Convergence project “VITRAUX” (SU-14-R-ScPC-15-2) from Sorbonne Universités. The IBA analyses were performed at the New AGLAE facility (ANR-10-EQPX-22).
We are extremely grateful to Atelier Vitrail France, Emmanuel Putanier and colleagues for hosting the mobile lab in their workshop.
MOJYH thanks François Guilhem for precious advises in the data analysis using R software.