


 CC-BY 4.0
1. Introduction
The structure of silicate melts is of considerable importance in igneous processes and in industrial applications (furnace conditions) as the atomic-scale organization strongly affects their dynamical and physico-chemical properties (for instance, density, entropy, crystal-melt element partitioning and transport properties including viscosity and diffusivity). Glasses have long been acknowledged as good analogues of liquids with a structure that can be easily revealed experimentally. On the contrary, measurements at elevated temperatures can be challenging and can give less detailed structural information. However, important changes in properties occur above the glass transition temperature, Tg, such as an increase in heat capacity and thermal expansivity, a decrease in viscosity, etc. These observations imply that the glass structure reflects only the supercooled liquid structure frozen in at Tg with, additionally, a strong dependence due to the thermal history, i.e. typically the quenching rate [Allwardt and Stebbins 2004, Henderson et al. 2006]. Therefore, glasses may show significant structural differences compared to high-temperature liquids. To understand how data obtained on glasses can be extrapolated to melts, it is pertinent to track how the structure evolves with temperature, how fast the structural changes happen and how they can affect bulk properties [Stebbins 2008].
Liquids and glasses are both characterized by a lack of long range order. Unlike crystals for which a unique, accurate structural model can be established, the glass/melt structure is described statistically, by considering average information on the structure extending over short and intermediate range scale, referred to as SRO (short range order) and IRO. Among the many experimental tools allowing the elucidation of the complexity of silicate glasses/melts, X-ray and neutron diffraction offer the possibility to probe both SRO and IRO [Cormier 2019, Cormier et al. 2001, Wilding and Benmore 2006] and benefits from the availability of high-temperature devices [Cuello et al. 2014, Skinner et al. 2012]. Diffraction gives access to a pair distribution function (PDF) in real space that is the probability of finding an atom at a distance r from an atom taken at the origin. In addition to experimental data, a structural description provided by modelling approaches is usually required to reveal many structural aspects. This can be readily obtained from diffraction data using methods such as reverse Monte Carlo (RMC) or Empirical Potential Structure Refinement (EPSR) [Majérus et al. 2004, Nienhuis et al. 2021]. Comparatively to glasses, structural data for liquids are lacking, which preclude an evaluation of the glass/melt comparison and do not offer experimental validation for developing new, more accurate potentials in molecular dynamics (MD) simulations [Shih et al. 2021].
The MgSiO3–CaSiO3 (CMS) join is a simple system with two non-network forming cations (Mg, Ca), and having a complete glass formation region between the two end members, MgSiO3 and CaSiO3. It contains three minerals of interest to the geochemistry of upper mantle, enstatite (MgSiO3), diopside (CaMgSi2O6) and wollastonite (CaSiO3). Enstatite and diopside are pyroxene minerals [Thompson and Downs 2004, 2003]. Their structure consists of single-chains of corner-sharing SiO4 tetrahedra. These chains are connected by their apices to regular octahedral M1 sites that form a chain of edge-shared octahedra. Parallel to the M1 chains, there is a second octahedral chain with M2 sites that are larger and more distorted than M1 sites enabling the introduction of large cations. In diopside, Ca atoms fill the large M2 sites while Mg atoms fill the regular M1 sites. Due to its size, Ca atoms cannot be accommodated in M1 sites so that CaSiO3 has a slightly different structure and is referred as a pyroxenoid. In wollastonite [Hesse 1984, Trojer 1968], the tetrahedral chain periodicity is modified (3 repeat SiO4 rather than 2 repeat SiO4 for pyroxenes) to allow Ca entering M1-type sites. This results in a lower crystal symmetry.
Composition (in mol%, ±0.05) and density, d (in g⋅cm−3, ±0.002) for the CaOx ⋅ MgO1−x ⋅ 2SiO2 glasses
| Name | Nominal composition | SiO2 | CaO | MgO | NBO/Q∗ | dglass (g⋅cm−3) | dliquid (g⋅cm−3) | Tneutron (K) | TX-ray (K) |
|---|---|---|---|---|---|---|---|---|---|
| CMS00.50 (enstatite composition) | MgO–SiO2 | 50.38 | — | 49.62 | 1.97 | 2.693 | 2.502 (1923 K) | 1873 | 1973 |
| CMS12.38 | 0.5CaO–1.5MgO–2SiO2 | 49.60 | 14.08 | 36.32 | 2.03 | 2.789 | 2.547 (1773 K) | 1773 | |
| CMS25.25 (diopside composition) | CaO–MgO–2SiO2 | 50.24 | 25.33 | 25.32 | 2.02 | 2.805 | 2.563 (1873 K) | 1673 | 1973 |
| CMS38.12 | 1.5CaO–0.5MgO–2SiO2 | 48.6 | 36.98 | 14.42 | 2.11 | 2.871 | 2.612 (1773) | 1773 | |
| CMS50.00 (wollastonite composition) | CaO–SiO2 | 50.42 | 49.58 | — | 1.97 | 2.891 | 2.615 (1923 K) | 1873 | 1973 |
∗Number of non-bridging oxygen (NBO) per SiO4 tetrahedra (Q), calculated with the formula NBO∕Q = (2O–4Q)/Q.
The Ca–Mg mixing in glasses/melts adds complexity to the structure with possible evolution with temperature. As the cations have the same nominal electric charge but different cationic size (rMg2+ = 0.71 Å, rCa2+ = 1.14 Å [Shannon 1976]), distinct site preferences are expected and local coordination change or local site distortion could arise with temperature. Ca–Mg mixing along the MgSiO3–CaSiO3 join yields a non-linear variation of the viscosity, with a lower viscosity (at a given temperature) for the diopside composition compared to either end members and a minima that is enhanced near Tg [Neuville and Richet 1991]. The authors have shown that this behavior can be interpreted by an excess in configurational entropy for the liquids implying ideal cation mixing behavior. Much of the excess entropy is retained in intermediate compositions at Tg. Structural analysis of CMS glasses support random cation mixing as these compounds are described with a disordered distribution of Ca and Mg cations [Allwardt and Stebbins 2004, Cormier et al. 2010]. Though glasses in this system have been widely investigated [Cormier and Cuello 2012, 2011, De Sousa Meneses et al. 2006, Gaskell et al. 1991, Kalampounias et al. 2009, Kohara et al. 2011, Kroeker and Stebbins 2000, Schneider et al. 2003, Shimoda et al. 2008, 2007, Taniguchi et al. 1997, 1995, Wilding et al. 2004, Yin et al. 1983, Zhang et al. 1997], experimental studies in the liquid state are limited to MgSiO3 [Wilding et al. 2010, 2008] and CaSiO3 [Benmore et al. 2020, 2010, Skinner et al. 2012]. It would thus be valuable to have further investigation of the molten structure of intermediate compositions, including the important diopside composition, for which entropic and structural effects are maximized.
In this paper, we aim to explore the structural evolution along the MgSiO3–CaSiO3 join using neutron diffraction (ND) and X-ray diffraction (XRD) at high temperature. The experimental data have been fitted using the EPSR approach to reveal structural differences between glasses and melts.
2. Experimental
2.1. Sample preparation
Glasses along the Ca–Mg pyroxene join (CaxMg1−1xSi2O6, where x = 0, 0.25, 0.5, 0.75, and 1) were prepared from powders of SiO2, CaCO3 and MgO in high purity commercial forms. The decomposition of the carbonates was obtained by heating at 800 °C overnight. The mixtures were subsequently melted, at 100 °C above their respective melting temperatures, during 1 h in a Pt-10%Rh crucible. The glasses were obtained by quenching the melts, dipping the bottom of the crucibles in water. The samples were crushed in an agate mortar and remelted two times to improve the glass chemical homogeneity. Glasses are labeled CMSx.y where x = mol% CaO, y = mol% MgO and (100 − x − y) = mol% SiO2.
Pieces of each glass were embedded in epoxy resin, polished, carbon-coated and chemically analyzed using an electron probe micro-analyzer (CAMECA SX50) at the Camparis Centre (Sorbonne Université, France), as reported previously [Cormier and Cuello 2012]. The chemical compositions (Table 1) are obtained by averaging ten different points. Glass densities were measured at room temperature by the Archimedes method with toluene as immersion liquid. Melt densities were obtained or extrapolated from experimental data [Courtial and Dingwell 1999, 1995]. Table 1 gives the densities and the experimental temperatures used in diffraction measurements.
2.2. X-ray diffraction
High energy XRD measurements were carried out at the beamline ID11 at the European Synchrotron Radiation Facility (ESRF) using an aerodynamic levitation and laser heating device [Drewitt et al. 2011, Hennet et al. 2011]. The synchrotron X-ray beam, 100 × 100 μm2 in cross-sectional area and 100.456 keV in energy, was incident on the spherical liquid droplets that are levitating above the nozzle of the levitator using an argon gas flow through an aluminum conical nozzle. Two 125 W CO2 laser beams were used for heating, with temperatures measured at 1973 K (CMS00.50, CMS38.12, CMS50.00) or 1773 K (CMS12.38, CMS25.25). Two-dimensional diffraction patterns were recorded with ESRF-designed FReLoN CCD camera [Labiche et al. 2007]. The scattered beam was positioned at the corner of the detector which allows a wide total scattering momentum (Q) range extending to Qmax = 23.6 Å−1. The sample-to-detector distances, beam center and detector tilt were determined by comparison between the known d-spacings of a Si calibrant. The diffraction data were flat-fielded and corrected for dark current noise, geometrical effects and incident beam polarization and reduced to one-dimensional patterns using FIT2D software. The measured diffracted intensities were scaled to fit the sum of the Compton and self-scattering, which was then subtracted to obtain the total structure factor FX(Q), using standard procedure [Drewitt et al. 2013, 2011].
2.3. Neutron diffraction
The ND measurements were carried out on the D4C diffractometer at the Institut Laue-Langevin, using an aerodynamic levitation and laser heating device [Hennet et al. 2006]. Acquisitions at high temperature were obtained on the liquid samples and the empty levitation device inside the diffraction chamber. A vanadium standard was also measured at room temperature for absolute normalization of the scattering intensity. The neutron wavelength was 0.4979 Å−1, giving a useable Q-range up to Qmax = 23.6 Å−1. The program CORRECT was used to process the data corrections for attenuation, background, multiple scattering and inelasticity effects [Howe et al. 1996], giving the neutron total structure factor, FN(Q). The ambient ND data are those previously published, also acquired on the D4C diffractometer [Cormier et al. 2010], except the CMS25.25 glass that has been measured during this experiment.
3. Empirical potential structure refinement
Structural models for the glasses and the liquids were derived from the diffraction data using EPSR [Soper 2005]. This method refines atomic positions within a box model and interatomic potentials between atomic pairs to progressively get an agreement between the simulated and measured diffraction data. The fitting procedure was performed simultaneously on the neutron and X-ray data for all glasses, while for the liquids only X-ray data were available for CMS12.38 and CMS38.12. The potential parameters used for EPSR modelling were determined as previously reported [Weigel et al. 2008] and are given in Table 2. The atomic cubic box specifications are listed in Table 3. Initial random configurations of 5000 atoms were generated and equilibrated at room temperature (glass) or at high temperature (liquid) close to the experimental one, using the reference potential. Then, the empirical potentials were refined by variation of the requested energy amplitude (ereq values) between 0–50 kJ⋅mol−1 in order to reproduce the experimental datasets. Once a good fit is obtained, with an equilibrated internal energy, statistical structural data were collected by averaging over ensembles of >1500 configurations.
Parameters for the reference potentials in EPSR simulations
| Element | Electric charge | 𝜀 (kJ⋅mol−1) | 𝜎 (Å) |
|---|---|---|---|
| Si | +2 | 0.175 | 1.06 |
| O | −1 | 0.1625 | 3.6 |
| Mg | +1 | 0.2 | 1.8 |
| Ca | +1 | 0.2 | 2.4 |
Box lengths and densities of the EPSR models
| Glass | Box length (Å) | Atomic number, 𝜌 (atoms Å−3) | R𝜒(neutron) | R𝜒(X-ray) | Temperature (K) |
|---|---|---|---|---|---|
| CMS00.50-glass | 39.56 | 0.08076 | 0.222 | 0.431 | 300 |
| CMS00.50-liquid | 40.51 | 0.07503 | 0.339 | 0.265 | 1923 |
| CMS12.38-glass | 39.61 | 0.08048 | 0.124 | 0.339 | 300 |
| CMS12.38-liquid | 40.82 | 0.07349 | — | 0.132 | 1773 |
| CMS25.25-glass | 40.05 | 0.07781 | 0.212 | 0.603 | 300 |
| CMS25.25-liquid | 41.24 | 0.07126 | 0.369 | 0.549 | 1723 |
| CMS38.12-glass | 40.19 | 0.07702 | — | 0.359 | 300 |
| CMS38.12-liquid | 41.48 | 0.07008 | 0.088 | 0.210 | 1773 |
| CMS50.00-glass | 40.56 | 0.07493 | 0.050 | 0.272 | 300 |
| CMS50.00-liquid | 41.94 | 0.06777 | 0.247 | 0.286 | 1923 |
R𝜒 are reliability factors calculated in the real space over the range 1⩽r⩽8 Å [Wright 1993]. Temperatures used during simulations.
4. Results
4.1. Structure factors
Comparison of the measured structure factors for the glasses and melts for (a) neutron and (b) X-ray diffraction. The blue solid curve is the glass and the dashed red curve is the liquid.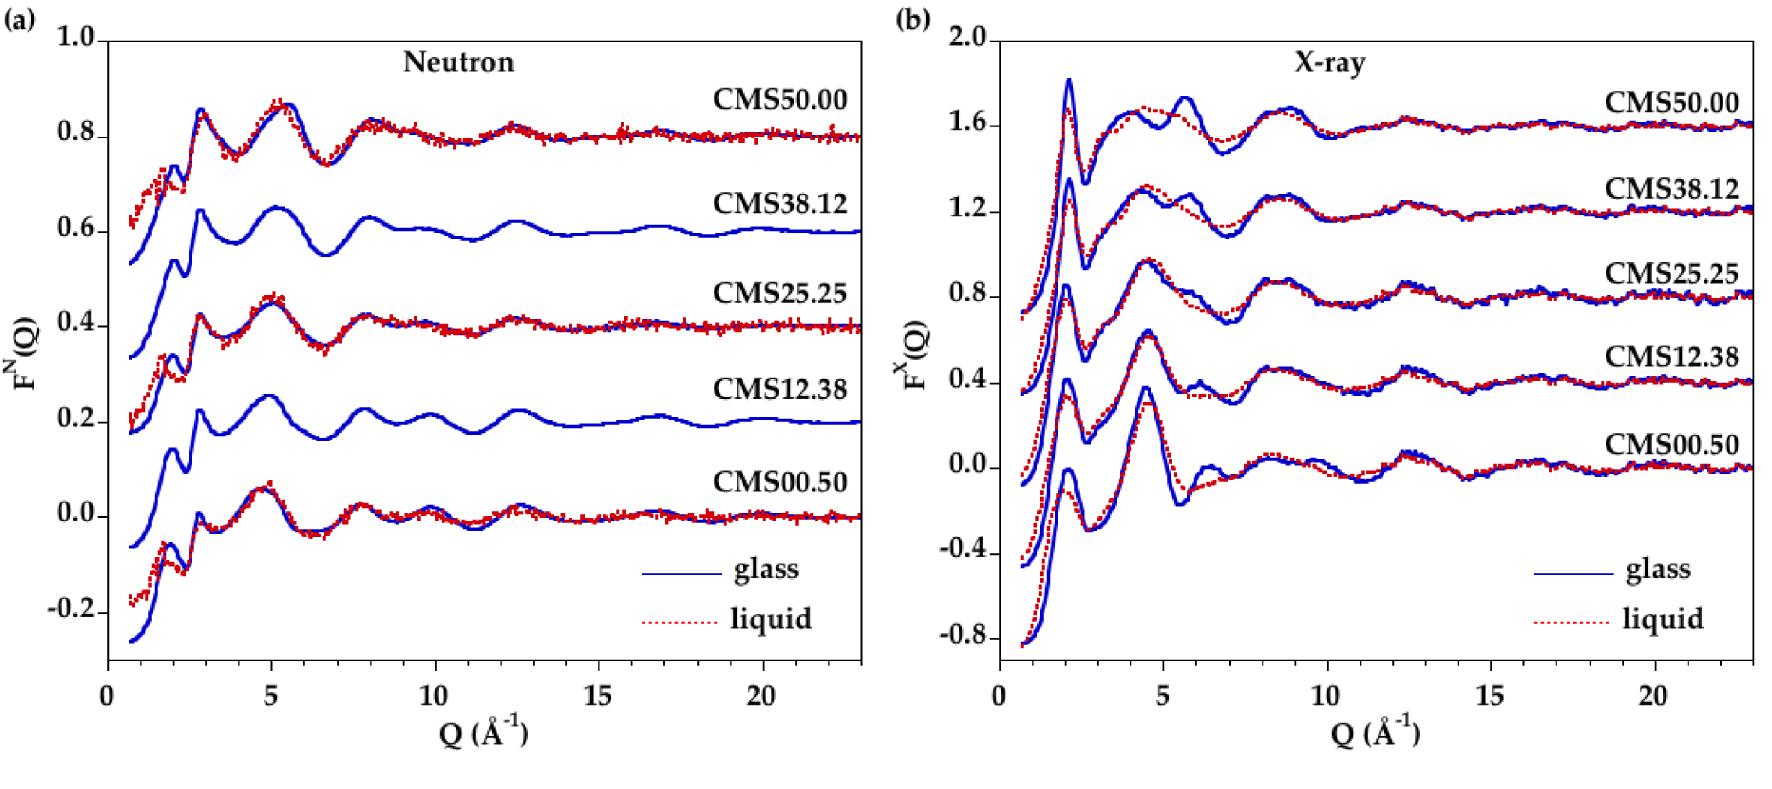
Comparison of the total pair distribution functions for the glasses and melts for (a) neutron and (b) X-ray diffraction. The blue solid curve corresponds to the glass and the dashed red curve is related to the liquid. Fourier transforms were obtained from the structure factors in Figure 1 with no modification function and using the range 0.56 Å−1⩽Q⩽22 Å−1.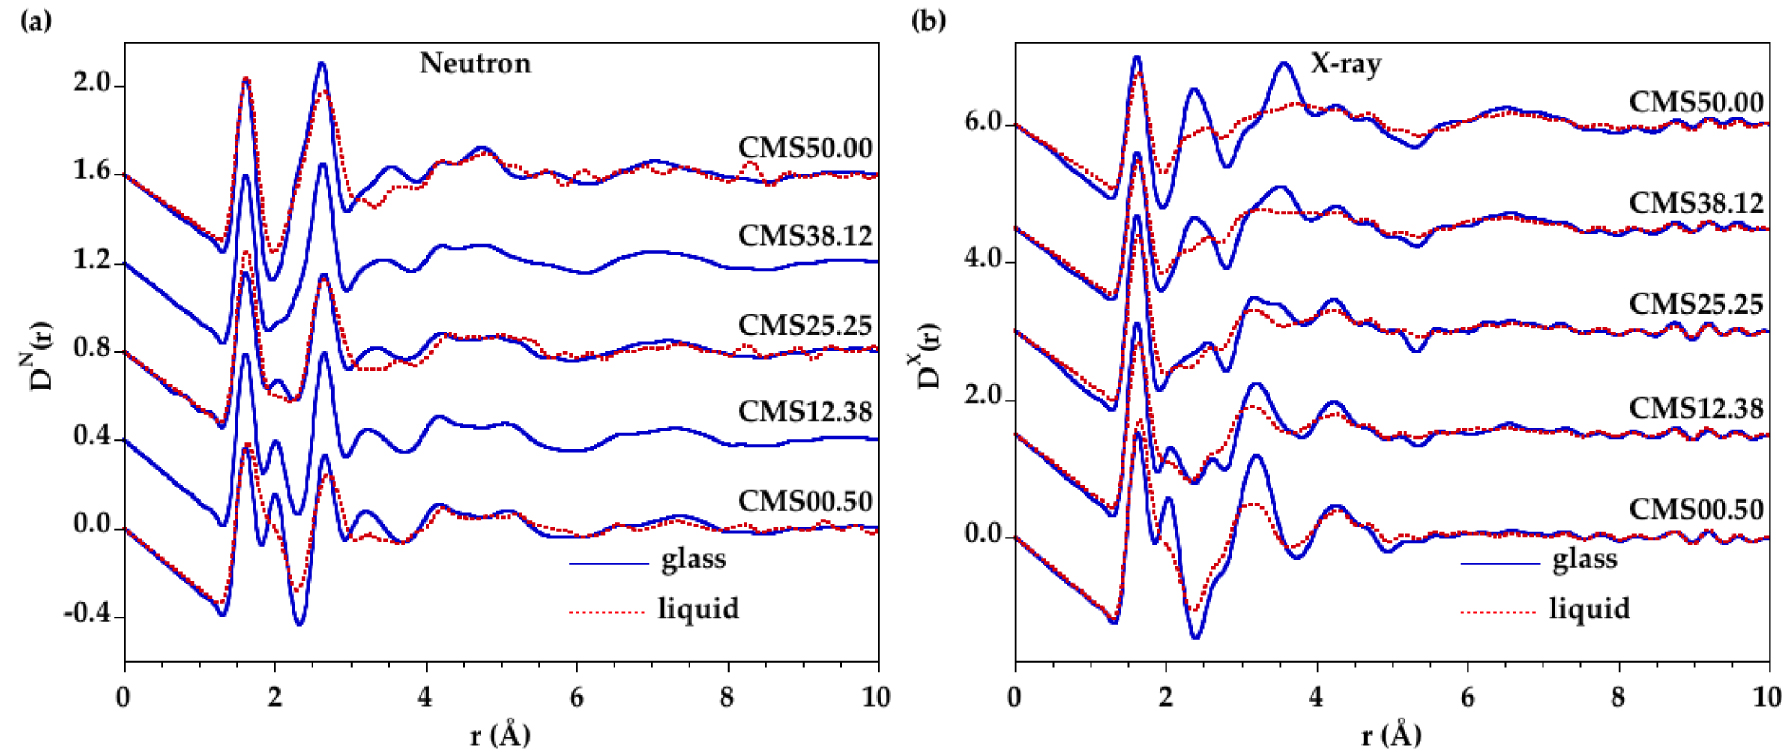
The experimental X-ray/neutron structure factors for the samples in the glass and liquid states are shown in Figure 1. As MgO is replaced by CaO in glasses, the position of the first peak, Qp, in FN(Q) functions is shifted from 1.92 ± 0.01 Å−1 for CMS00.50 to 2.05 ± 0.01 Å−1 for CMS50.00, and the Qp peak intensity slightly decreases. These positions are related to density fluctuations separated by a distance d = 2π∕Qp, giving values between 3.29 ± 0.02 Å for CMS00.50 to 3.06 ± 0.02 Å for CMS50.00. On melting, the Qp peak is clearly shifted to lower Q-values, at ∼1.67 Å−1, but the low statistics does not allow to distinguish any compositional variations. This displacement implies higher correlation distances in the liquids compared to the glasses. This can be attributed either to a density effect (lower densities in the liquid state) or to structural changes. A similar peak is observed in FX(Q) functions for glasses and liquids and, in this case, a strong chemical dependence is observed: the intensity increases as more CaO is substituted to MgO. Additionally, the peak position shifts from 2.04 ± 0.02 Å−1 to 2.12 ± 0.01 Å−1 in glasses with increasing CaO content and from 1.98 ± 0.02 Å−1 to 2.15 ± 0.02 Å−1 in liquids with increasing CaO content. This peak is thus particularly sensitive to cation organization.
For both neutron and X-ray datasets, the presence of isobestic points (common points in the diffraction patterns) is observed for the glass and the melt series (Supplementary Figure S1). These points indicate that FN(Q) or FX(Q) functions for intermediate compositions can be obtained using a linear combination of the functions for the two end members, i.e. CMS00.50 and CMS50.00 samples [Cormier et al. 2010, Cormier and Cuello 2012].
FN(Q) functions vary mainly between 4–12 Å−1 while oscillations are very similar above 12 Å−1. This latter region is mainly dominated by SRO associated with the silicate network. In the liquid state, the differences between samples are observed on a limited Q-region 3–7 Å−1. The differences with temperature reflect essentially increased degree of structural disorder. Above 7 Å−1, structure factors are not importantly changed because SRO remains very similar in glasses and liquids. At low Q values, broadening of the signal features is apparent in the liquid state.
The wollastonite compositions CMS50.00 have previously been studied in detail in the molten state using neutron and XRD techniques in combination with MD simulations [Benmore et al. 2010, Skinner et al. 2012]. Our ND data have better statistics, allowing more confidence at high Q-values. The Qp peak has a higher intensity compared to Skinner et al. [Skinner et al. 2012], which is in better agreement with room temperature data. The FX(Q) functions for the CMS50.00 glass and liquid are similar to those measured by Benmore et al. [2010], indicating reduced CaO evaporation during measurements. CMS00.50 has also been previously studied in the liquid state by Wilding et al. [Wilding et al. 2010, 2008] and their XRD data are similar to those in the present study.
4.2. Real-space functions
The Fourier transformation of the total structure factor gives the corresponding real-space function (Figure 2), called total PDF D(r). The first three major peaks in D(r) are well understood and correspond to Si–O (1.62 Å), Mg–O (2.00 Å) and Ca–O (2.40 Å) correlations. Each radiation has a different sensitivity to the elements: XRD data are dominated by elements with high atomic number (O < Mg < Si < Ca) while ND data are dominated by elements with a high neutron scattering length, b, evolving as bSi = 4.153 fm < bCa = 4.76 fm < bMg = 5.37 fm < bO = 5.803 fm. These different sensitivities explain that the Ca–O correlation is clearly distinguished at 2.38 Å in DX(r) functions while they appear in DN(r) functions as a small hump on the low-r side of the peak at 2.63 Å that is dominated by O–O contributions. The presence of isobestic points can also be observed in the D(r) functions (Supplementary Figure S2).
(a) Neutron and (b) X-ray experimental (blue line) and modeled (red dashed line) structure factors for CMS glasses.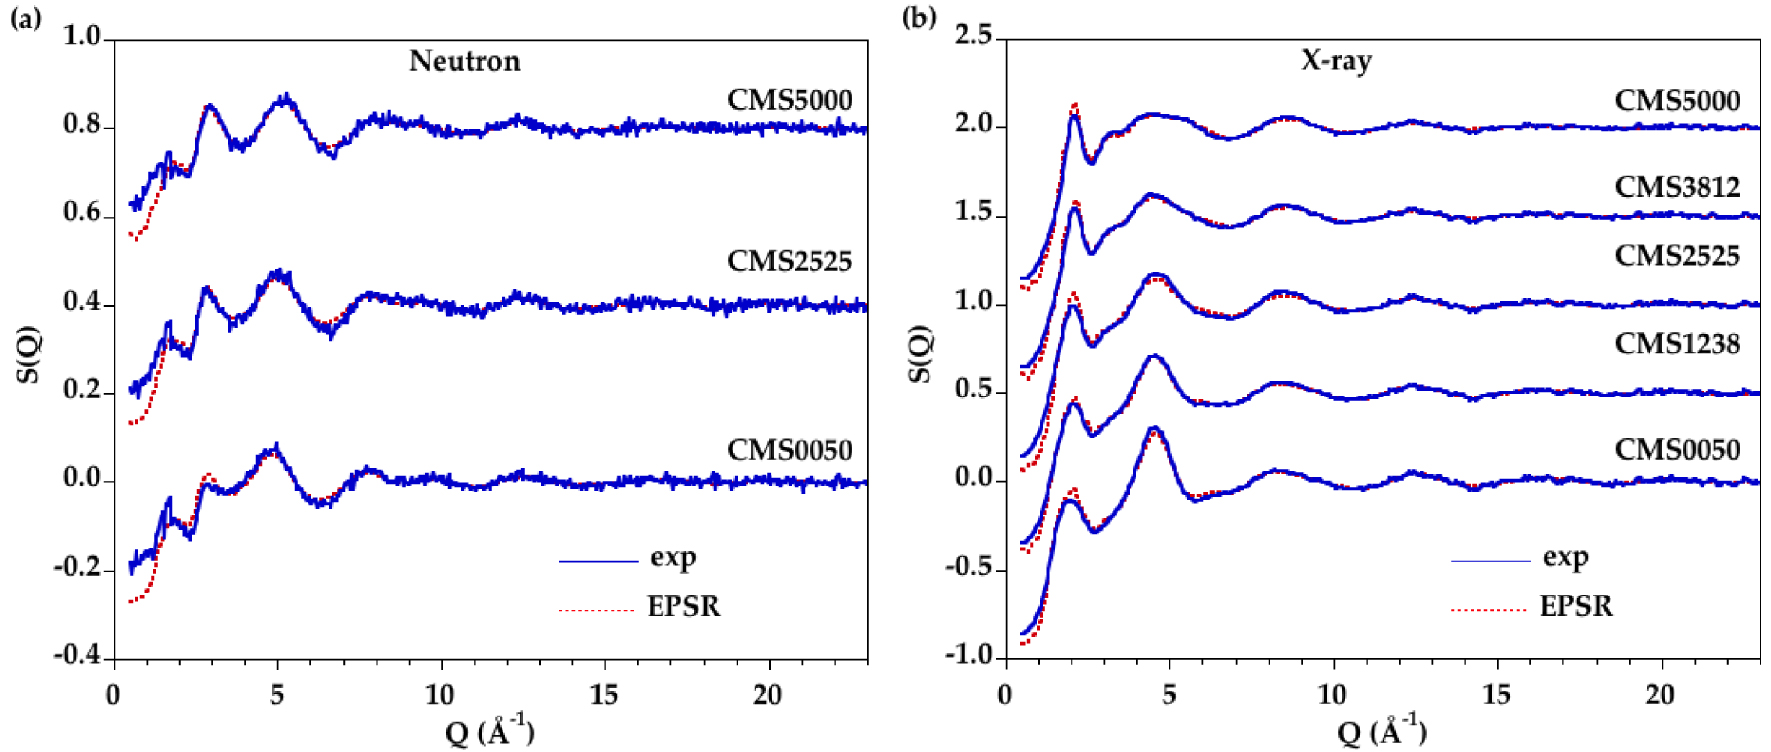
Variations at medium range distances are mainly associated with the silicate network in DN(r) functions and with correlations involving cations in DX(r) functions. In XRD data, the peak attribution has previously indicated that contributions near 3.16 Å are mainly due to Si–Mg and Mg–Mg correlations and contributions near 3.56 Å are mainly due to Ca–Ca and Ca–Si correlations [Cormier and Cuello 2012]. The functions for all liquids have similar SRO compared to glasses, with a distinct Si–O contribution that is slightly shifted from 1.62 Å to 1.63 Å with temperature. However, the Mg–O and Ca–O peaks are no longer resolved indicating important thermal disordering due to broad distributions of Mg–O and Ca–O distances. In the liquids, the Mg–O peak overlaps with the Si–O one and the Ca–O peak is less resolved in the XRD data. The structural peaks in the DX(r) functions are clearly less resolved than in DN(r) functions at high temperature and the broadening of the peaks in DX(r) functions is increasing as the CaO content is increased.
4.3. EPSR models
Accurate information about the cation–oxygen local environment is difficult to obtain from direct analysis, for instance from Gaussian fits, due to large overlap between the various contributions, which is even enhanced as the temperature is increased. EPSR modelling is an alternative fitting method allowing the extraction of detailed structural information from atomic configurations. A good agreement is obtained by fitting simultaneously the neutron and XRD data, as seen in Figure 3 for all glasses and in Figure 4 for all liquids. The corresponding D(r) functions are in Supplementary Figures S3 and S4. The reliability factors R𝜒 are determined on the D(r) functions following Wright [Wright 1993] and the values are reported in Table 3. A good level of agreement between the EPSR models and the experimental data is achieved with R𝜒 factors comparable or better than published in previous studies [Gong et al. 2021, Guignard and Cormier 2008].
(a) Neutron and (b) X-ray experimental (blue curve) and modeled (red dashed curve) structure factors for CMS liquids.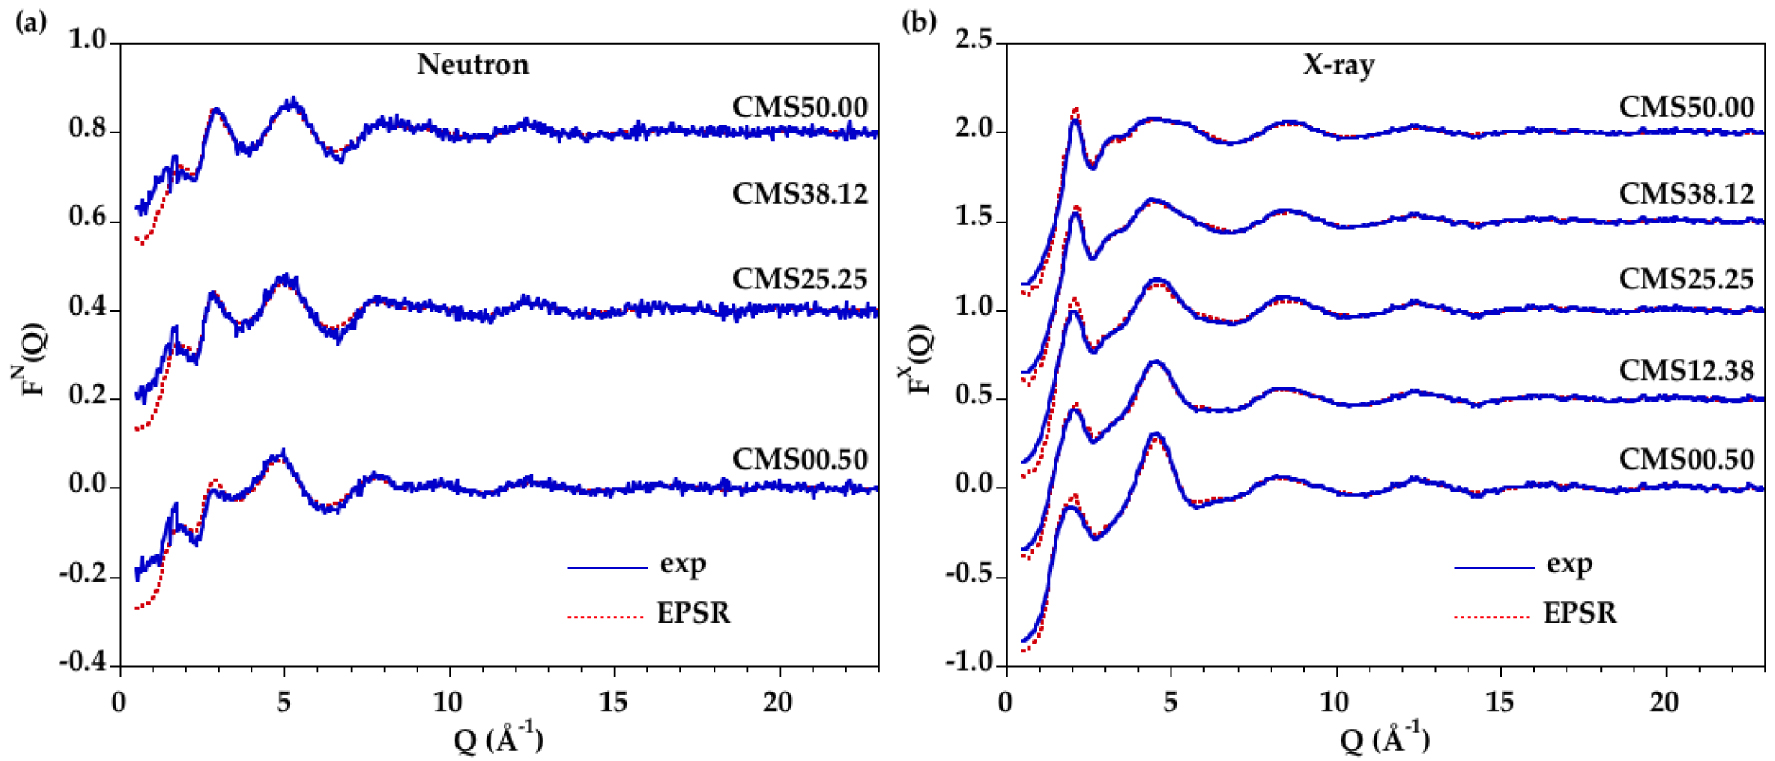
The EPSR-derived partial pair distribution functions (PPDFs) are shown in Figure 5 only for CMS00.50, CMS25.25 and CMS50.00 for clarity (all PPDFs for each glass/melt are in Supplementary Figure S5). The first peak in the Mg–O and Ca–O PPDFs exhibits a considerable broadening in the liquid state indicating that the oxygen disorder increases around these cations with temperature.
Comparison of the EPSR partial distribution functions for the glass (blue curve) and the liquid (red dashed curve) corresponding to the samples (a) CMS00.50, (b) CMS25.25 and (c) CMS50.00.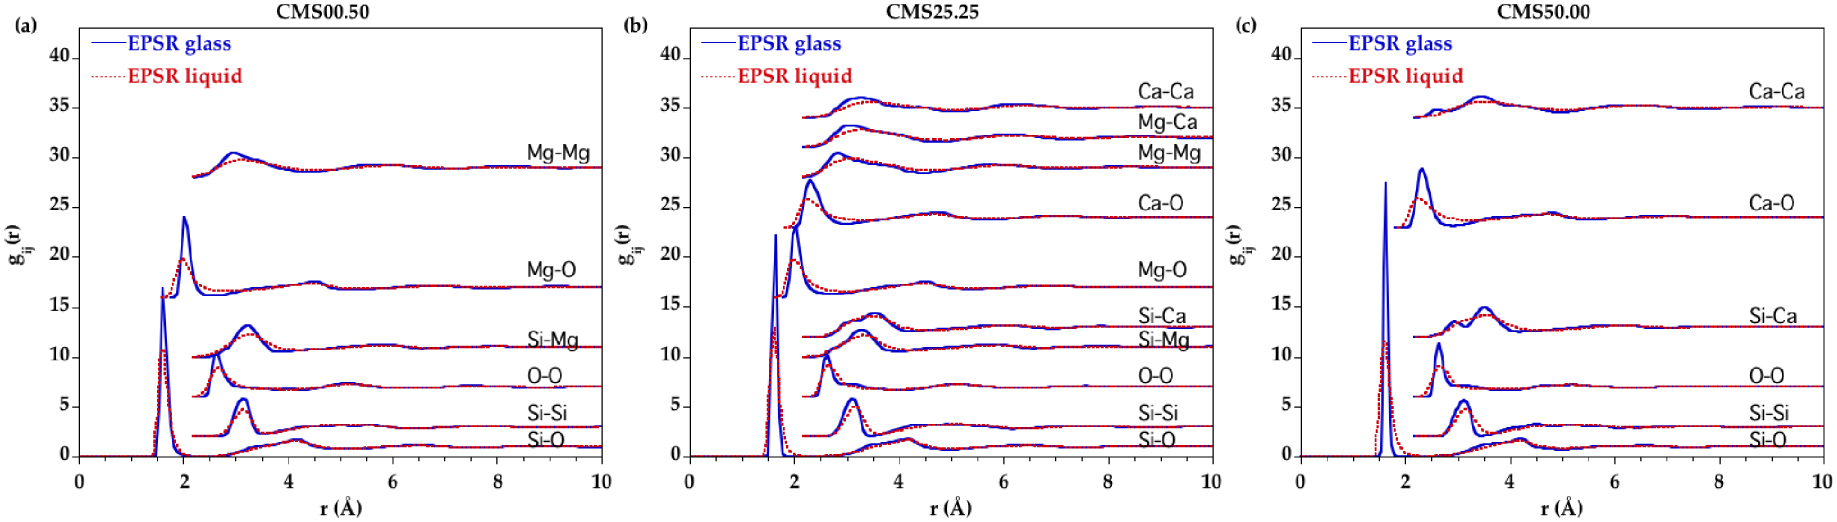
Using the minimum after the first main peak in Si–O, Mg–O and Ca–O PPDFs as a cutoff distance, the number of O neighbors around Si, Mg and Ca were determined. Cutoff distances are reported in Table 4. The average coordination numbers (CNs) are plotted in Figure 6. Silicon is mainly four-fold coordinated in all compositions for all glasses and liquids. Small amounts of three and five-coordinated Si sites ( <3%) are observed and their proportion does not change significantly with composition or temperature. This is consistent with a corner-sharing tetrahedral silicate network dominating the liquid structure at ambient pressure. The CN(Mg–O) is around 4.5 in glasses and increases by ∼0.25 with temperature. Similarly the CN(Ca–O) increases from ∼5.8 in glasses to ∼6.3 in liquids. However the CN as a function of r, CN(r) (Figure 7), shows that defining a cutoff distance in the liquid state is difficult since no clear plateau is apparent for Mg and Ca, contrary to Si. Therefore, defining the first shell of oxygen neighbors around Mg and Ca in the liquid state is non-ambiguous. This is due to the continuous distribution of Mg–O and Ca–O distances as revealed by the lack of minima going to zero in the Mg–O and Ca–O PPDFs.
Cutoff distances used in the calculation of average coordination numbers
| Si–O (Å) | Mg–O (Å) | Ca–O (Å) | |
|---|---|---|---|
| Glass | 2.10 | 2.60 | 2.95 |
| Liquid | 2.15 | 2.9 | 3.28 |
The site distribution for Mg and Ca in glasses and liquids is provided in Figure 8, using the cutoff distances in Table 4. The x-fold sites are denoted [x]Mg or [x]Ca. In glasses, the site distribution indicates a majority of [4]Mg sites, with some [5]Mg sites, and a majority of [6]Ca sites with the coexistence of [5]Ca and [7]Ca sites. The Ca and Mg site distributions show close similarities with previous models obtained by coupling MD and RMC (see Supplementary Figure S6) [Cormier and Cuello 2012, 2011].
Composition dependence of the Si–O, Mg–O and Ca–O coordination numbers determined from EPSR models for glasses (blue curves) and liquids (red dashed curves).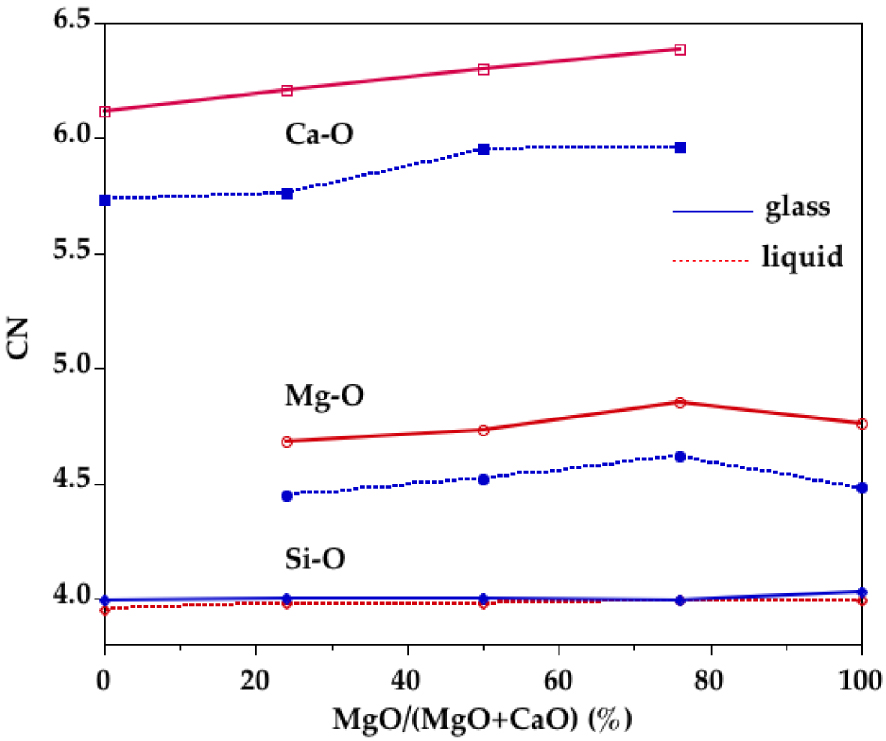
Evolution of coordination number with cutoff distance for (a) Si–O, (b) Mg–O and (c) Ca–O pairs as determined from EPSR models.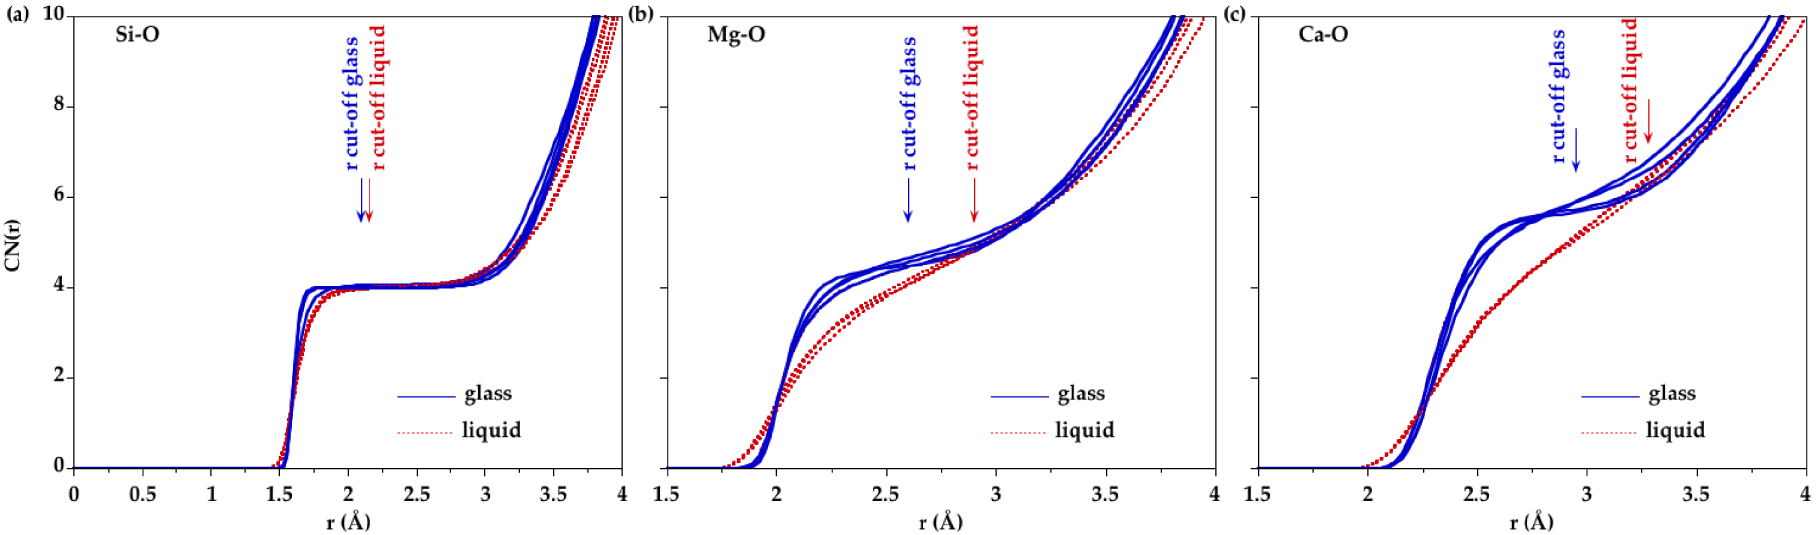
Distribution of (a) Mg and (b) Ca polyhedra extracted from EPSR models in the different glasses and melts.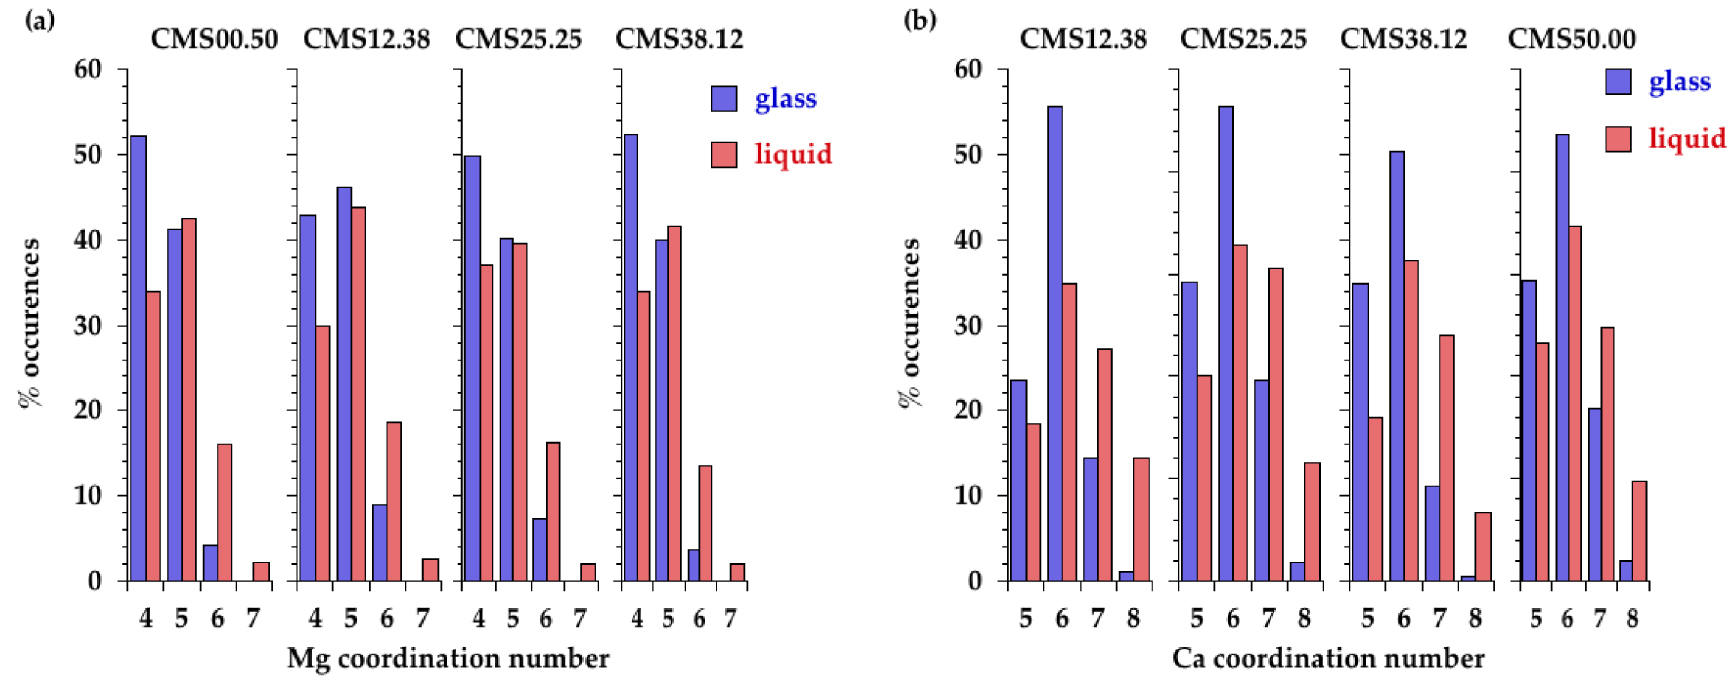
The distributions of bridging oxygens (BO), non-bridging oxygens (NBO) and free-oxygens (FO) (FO are not bonded to any Si atoms) are plotted in Figure 9a. The NBO fraction has a decreasing trend with increasing MgO content. The presence of triply bonded O is always less than 0.9% of all oxygen atoms in glasses/liquids and the content is thus not significant. In the liquid state, the NBO proportion increases, which is concomitant with a decrease in BO and FO. The low BO proportion is reflected by a lower average network connectivity that is quantified by the average number of n BO atoms around a silicon atom (Figure 9b). The average network connectivity shows increasing values as the MgO content increases in glasses and liquids.
(a) Oxygen distribution between non-bridging oxygen (NBO, squares), bridging oxygen (BO, triangles) and free oxygen (free O, circles), calculated from the EPSR models for CMS glasses (plain curves) and melts (long dashed curves). Comparison is made with previous glass models obtained by combining MD and RMC (short dashed curves) [Cormier and Cuello 2012]. Lines are only to guide the eye. (b) Average connectivity, n, derived from the EPSR models for the CMS glasses (plain curve) and melts (long dashed curve). Comparison is made with previous glass models obtained by combining MD and RMC (short dashed curve) [Cormier and Cuello 2012]. Lines are only to guide the eye.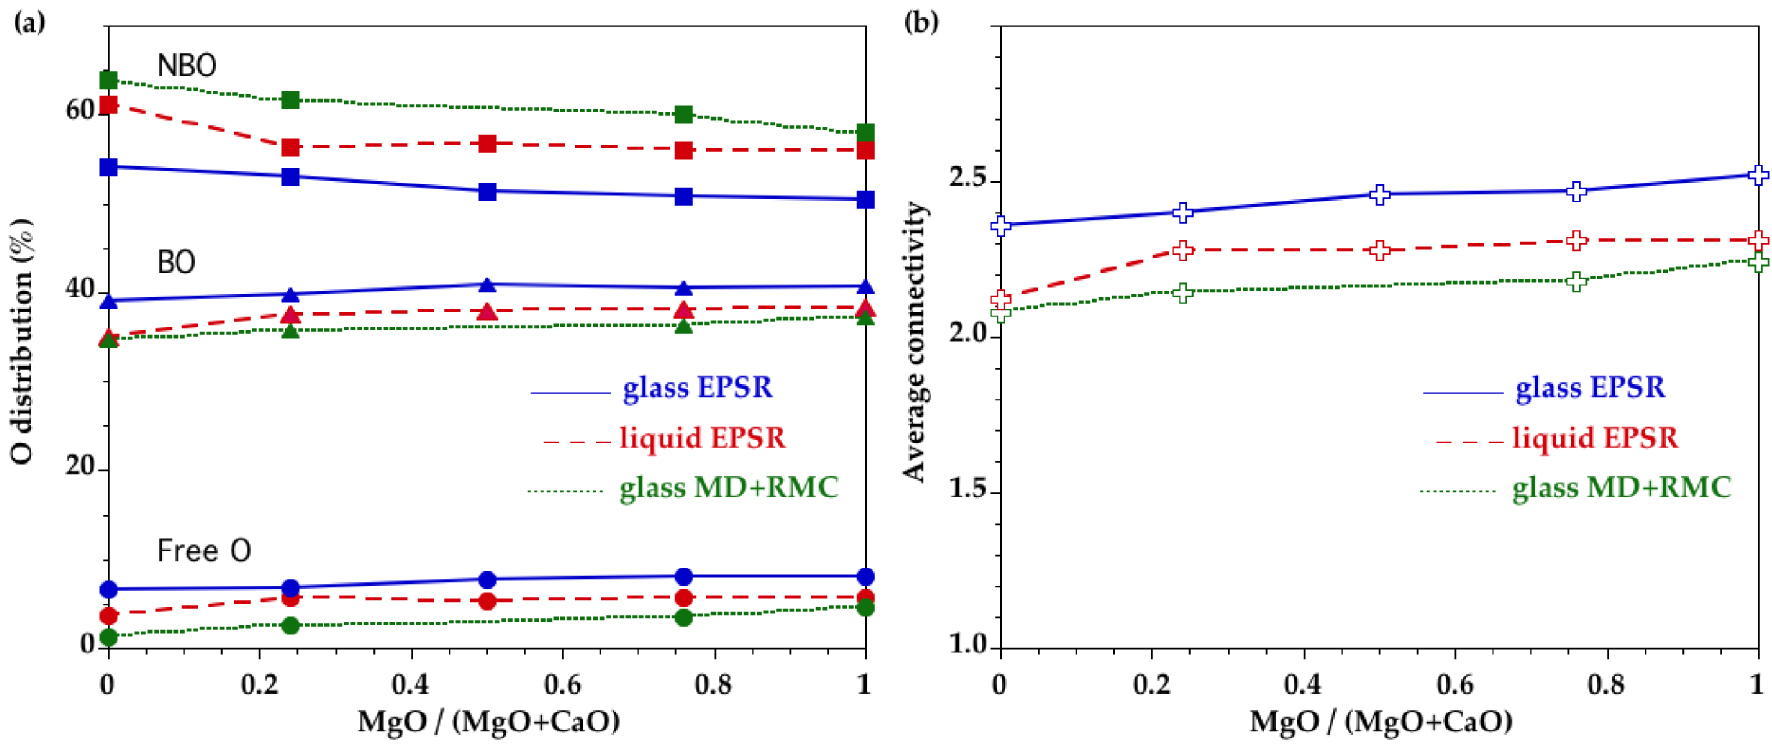
5. Discussion
5.1. Comparison between atomistic models
The EPSR models can be compared to our previous results obtained by combining MD simulations with RMC modelling [Cormier and Cuello 2012]. In CMS00.50, the average CN for Mg remains similar: CNMD+RMC = 4.35 and CNEPSR = 4.48 (Supplementary Figure S6a,b). The distribution of the various coordination sites gives almost an equal amount of [4]Mg (52%) and [5]Mg (41%) in EPSR while [4]Mg was predominant (68%) in the MD+RMC model. For Ca in CMS50.00, the average CN and the site distribution are not substantially changed (Supplementary Figure S6c,d). It thus appears that both methods of data fitting give convergent results, strengthening the validity of this approach to determine the SRO.
The distributions of BO, NBO and FO show that EPSR models contain more BO and free O compared to MD+RMC models, with a slight compositional dependence (Figure 9a). The higher BO content explains a high average connectivity in EPSR models (Figure 9b) that increases with the MgO content as in MD+RMC models. The MgSiO3–CaSiO3 join corresponds to metasilicate compositions so that n is expected to have a value of 2. The departure from this value for glasses is higher for EPSR than for MD+RMC. Interestingly, the liquid EPSR models have values closer to MD+RMC models, probably because MD+RMC models retain more structural characteristic features of the high-temperature state due to the intrinsic fast quenching rates in MD simulations and insufficient relaxation of the structure in RMC modelling of glasses.
The Qn speciation (Qn is a SiO4 tetrahedra containing n BO atoms) shows more Q3 and Q4 and less Q2, Q1 an Q0 in EPSR models compared to MD+RMC models (Figure 10). Both models present discrepancies with the Qn proportions determined experimentally by 29Si NMR for CMS00.50, CMS25.25 and CMS50.00 glasses [Schneider et al. 2003, Sen et al. 2009, Zhang et al. 1997], as these measurements determined higher Q2 and Q1 contents and lower Q3 and Q4 contents compared to models. A recent MD study with advanced potentials indicates Qn speciation for CMS00.50 and CMS50.00 very similar to our results with an underestimation of Q2 and an overestimation of Q3 and Q4 [Shih et al. 2021]. These results indicate that additional constraints should be incorporated in the models to improve the description of some specific structural units or groups. Moreover, careful comparison between experimental and atomistic models should be provided to ensure continuous improving in modelling and simulations of glasses and melts.
Qn distribution derived from the EPSR models for the CMS glasses (circles, plain curves) and liquids (squares, long dashed curves). Comparison is made with previous glass models obtained by combining MD and RMC (triangles, short dashed curves) [Cormier and Cuello 2012] and experimental point (open symbols) [Schneider et al. 2003, Sen et al. 2009, Zhang et al. 1997]. Lines are only to guide the eye.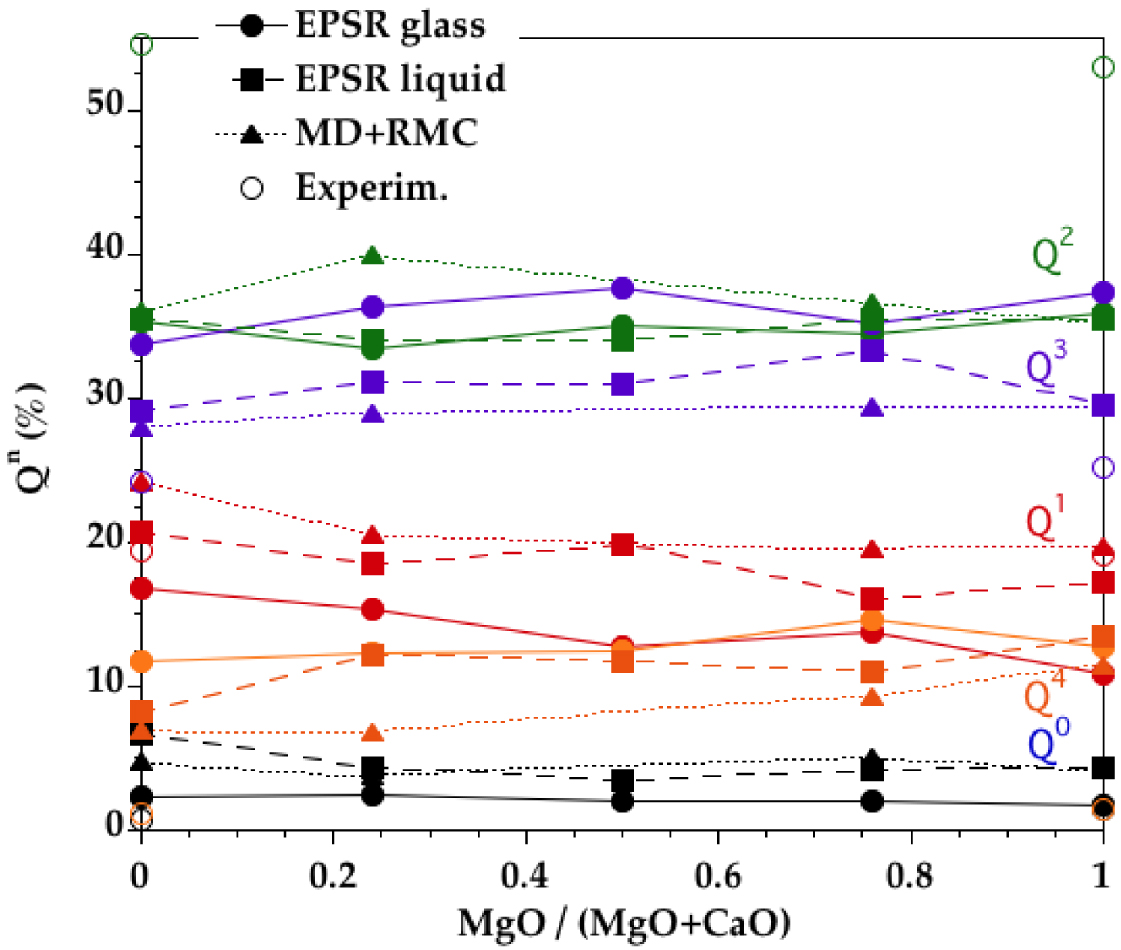
5.2. Evolution of Si environment with temperature
For the Si–O pair, the CN(r) shows a clear plateau (Figure 7a) that indicates a well-defined environment around Si atoms corresponding to SiO4 tetrahedra in both glasses and liquids, with very small proportions of other coordinated sites. SiO4 tetrahedra are poorly affected by an increase in temperature. The position of the first peak in the total D(r) functions is not informative as it is affected by Mg–O contributions. In CMS50.00 (Mg-free sample), the position of the Si–O peak is increased by + 0.01 Å with temperature. The Si–O PPDFs determined from the EPSR models do not show significant changes with temperature except a broadening consistent with thermal disordering.
The structure along the MgSiO3–CaSiO3 join is highly depolymerized with a high proportion of Q2 and Q3 species, in agreement with previous experimental findings [De Sousa Meneses et al. 2006, Schneider et al. 2003, Zhang et al. 1997]. However, the degree of connectivity displayed in Figure 9b is higher than expected considering the stoichiometry. The glass/melt structures present a broad range of Qn species compared to the structure of crystalline counterparts that is composed only of Q2 species. Based on observations on the 3D configurational boxes, the silicate network may possibly be described as a chain-like network structure of corner-sharing SiO4 tetrahedra forming broken chains coexisting with few rings. This differs from the topology of pyroxenes and pyroxenoids that is composed only of tetrahedral chains. Moreover, chemical evolutions are visible in Figure 9: the substitution of Ca by Mg yields a slight increase in connectivity associated with more BO and FO. However, as Mg and Ca cations have the same charge, the Mg/Ca mixing does not require significant charge redistribution in the structure, which explains small network modifications (Figures 9 and 10). The difference in cationic radii is essentially accommodated by a distribution of the two cations in multiple distinct sites (Figures 7 and 8).
There is a clear trend for higher NBO content and lower BO and FO contents in liquids compared to glasses (Figure 9a). These changes in oxygen speciation, associated with lower Q3 species and higher Q1 species, indicate that the liquid network is less connected. FO species correspond to oxygen not bounded to any SiO4 tetrahedra and can thus be a signature for regions that are enriched in Mg and Ca. Conversely, the high proportion of BO can indicate highly polymerized silicate regions depleted in Mg and Ca. As FO and BO contents increase upon cooling, the segregation between silicate-rich and (Mg,Ca)-rich regions is more important in glasses compared to melts.
5.3. Evolution of Mg environment with temperature
In glasses, the Mg site distribution indicates not only a prevalence of [4]Mg sites but also a large amount of [5]Mg sites. The presence of polyhedra with 4- and 5-fold coordination is also well established for other divalent cations such as Fe2+, Ni2+ or Zn2+ [Cormier et al. 2021, Galoisy and Calas 1993, Jackson et al. 2005, Waychunas et al. 1988]. In the liquids, higher coordinated sites are present, mainly [5]Mg and a small amount of [6]Mg, coexisting with still a large amount of [4]Mg (Figure 8). Upon increasing temperature, there is thus a site redistribution that is reflected in the evolution of the average CN(Mg–O) near 4.5 in glasses and near 4.7–4.8 in liquids. These values agree with very recent MD simulations for CMS00.50 [Shih et al. 2021]. The Mg–O environment is more ordered in CMS00.50 glass compared to other glasses as seen in the Mg–O PPDF that exhibits a well-defined first peak (Figure 5a). The average CN(Mg–O) in CMS00.50 is the lowest, in agreement with previous findings [Cormier and Cuello 2012]. Otherwise there is no clear compositional dependence either in glasses or in liquids within the scatter of the data. A plateau is discernible in the CN(r) in glasses (Figure 7b), allowing to define the first oxygen coordination shell around Mg atoms, whereas it is more difficult to determine the correct inflexion points for liquids. Inspection of the first peak position in the Mg–O PPDFs reveals a shift from 2.02 ± 0.02 Å in glasses to 1.98 ± 0.02 Å in liquids (Figure 5 and Supplementary Figure S7a). Though this evolution of the maximum peak position could indicate a coordination decrease, a long tail in the high r-side in liquids implies the contribution of additional long Mg–O distances that explain the increase in CN with temperature. Previous XRD or EXAFS studies have usually obtained low Mg CNs [Matsubara et al. 1988, Taniguchi et al. 1997, Yin et al. 1983] due to the difficulties to correctly determine the CN when an asymmetric distribution of distances exists. Because of disorder and site distortion, high-r contributions are regularly not detected in EXAFS data as this method is more sensitive to nearest neighbors [Kroeker and Stebbins 2000]. The modelling approaches (EPSR or RMC) give a more accurate determination of CN as this value is not based on a Gaussian fit.
The shortening of Mg–O distances in the liquids is remarkable since a thermal expansion is expected. These short Mg–O distances are compensated by the presence of long Mg–O ones, resulting in the high r-side tail and yielding a more distorted environment in the liquid than in the glass. A different behavior may be observed for divalent transition metals in the molten states. Indeed, a shortening of the Ni–O distances in a Na1.95Ni0.05Si2O5 melt has been inferred by high-temperature X-ray absorption spectroscopy [Farges et al. 1994]. This was interpreted as an increasing content of [4]Ni during the glass to melt transition. Fe2+ has also been found in four-fold coordination in alkali silicate glasses and melts with no temperature effects [Waychunas et al. 1988]. However such EXAFS studies may be insensitive to long Ni–O or Fe–O distances, especially in the liquid state.
Proportion of NBO and BO neighbors around (a) Mg and (b) Ca, as determined in the first shell of O neighbors in EPSR models of glasses and liquids.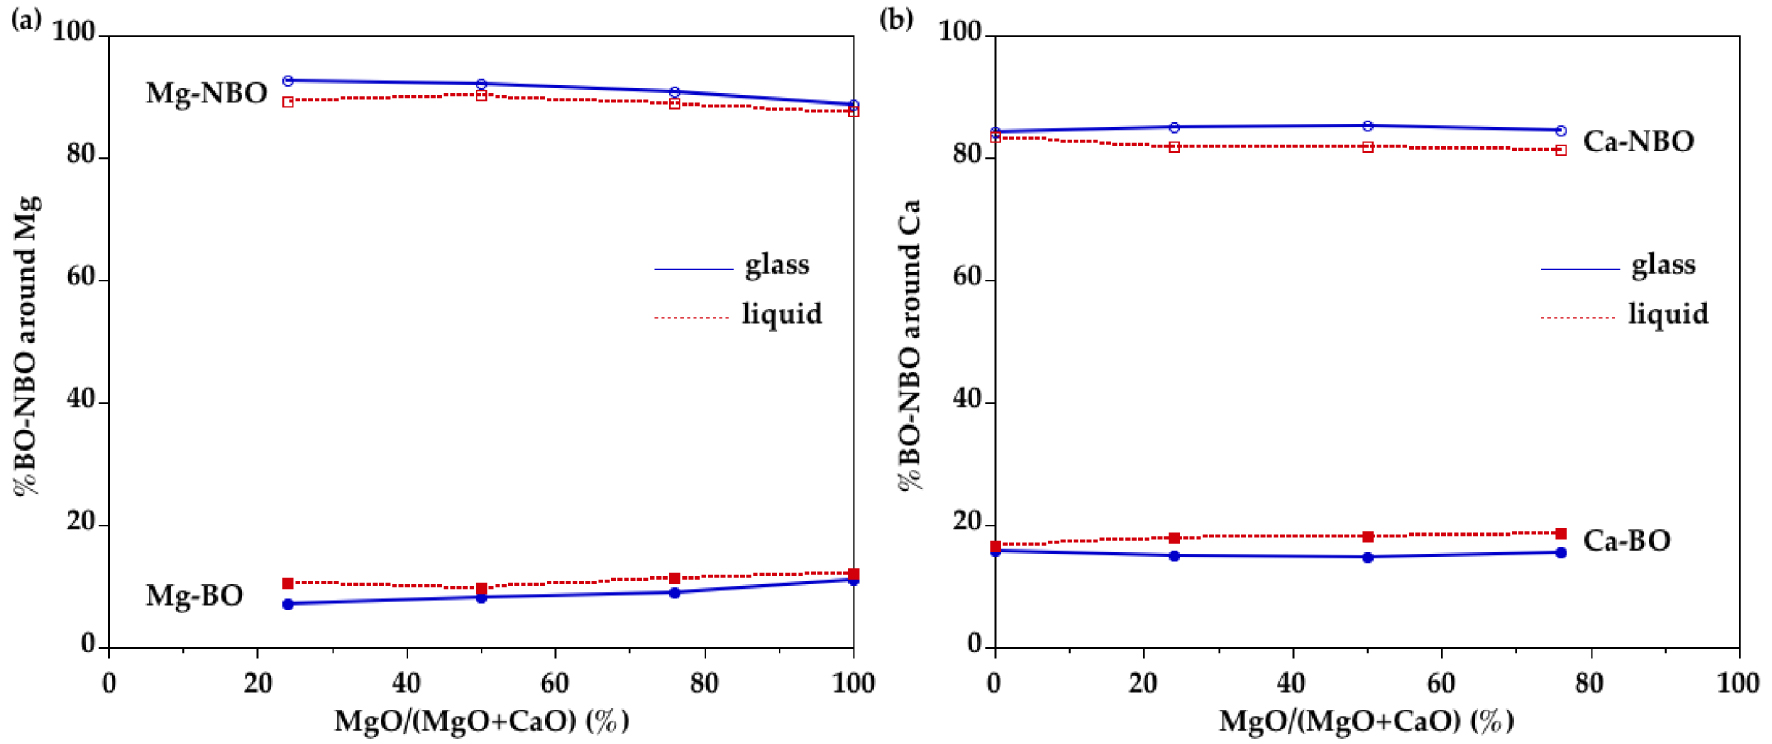
Very few studies have been performed in situ to understand the Mg environment in silicate melts. George and Stebbins have obtained 25Mg NMR spectra up to 1743 K in a diopside melt and a melt close to CMS12.38 compositions (but with 6 mol% Al2O3) [George and Stebbins 1998] and Fiske and Georges on CMS29.14 at 1673 K [Fiske and Stebbins 1994]. For the liquids, George and Stebbins have observed a change with addition of Ca (or alkalis) with a shift of the peak position to higher frequencies indicating a decrease in the average CN(Mg–O). However these changes are small. There is a strong temperature dependence of CN(Mg–O) with substantially smaller CN in the glass [Fiske and Stebbins 1994]. The NMR chemical shifts at high temperatures are in agreement with a CN between five and six and significantly different to the one expected for four-fold coordination [George and Stebbins 1998]. This behavior is consistent with the increase in CN from the glass to the liquid as deduced from the present diffraction data analysis. Gaussian fits of high-temperature X-ray PDF do not show any Mg coordination change for the enstatite composition (CMS00.50) [Wilding et al. 2010], while a small Mg–O coordination increase from 4.8 in the glass to 5.1 in the liquid for a CMS37.00 sample (37.5MgO–62.5SiO2) has been revealed using several Gaussian functions to fit the Mg–O contribution [Benmore et al. 2020].
5.4. Evolution of Ca environment with temperature
Similar to Mg, analysis of EPSR models indicate that Ca cations are localized in a wide distribution of sites (Figure 8b). The Ca environment is dominantly [6]Ca with both [5]Ca and [7]Ca in glasses. The site speciation is redistributed to higher coordinated sites in liquids (Figure 8b): less [5]Ca and [6]Ca and more [7]Ca and [8]Ca. The average coordination of Ca is higher than that of Mg in agreement with its lower field strength (defined as the ratio z∕d2, where z denotes the cation charge and d is the cation–oxygen bond length). Evolution of the first Ca–O distance in the Ca–O PPDFs shows a similar behavior than the Mg–O ones with increasing temperature: shortening of the average Ca–O bond length from 2.30 ± 0.02 Å to 2.25 ± 0.01 Å and a broadening and asymmetric distribution to the high r-side (Figure 5 and Supplementary Figure S7b). The average CN(Ca–O) is increased from ∼5.8 in the glasses to ∼6.3 in the liquids. This is consistent with MD simulations of CaSiO3 glass/melt that indicate both short and long Ca–O distances in the melt [Skinner et al. 2012]. In the latter investigation, a symmetric Gaussian fit of the first Ca–O peak yields a decrease in the Ca–O CN from 6 in the glass to 5 in the liquid [Skinner et al. 2012]. However, using additional Gaussian functions in the fit, the CN(Ca–O) does not vary with temperature (6.6 in the glass and 6.5 in the liquid) for a CMS20.00 sample (20CaO–80SiO2) measured using high-temperature XRD [Benmore et al. 2020]. This again emphasizes that a distorted environment cannot easily be captured by a simple Gaussian fit.
5.5. Distribution of Ca and Mg
To understand the connection of Mg sites with the tetrahedral silicate network, we have calculated the number of NBO and BO around cations (Figure 11). An important proportion of O neighbors are NBO (∼60%) and this proportion decreases only weakly with temperature. The proportion of BO in the first coordination shell around Ca is higher than for Mg indicating a preferential association of Ca with BO. This is attributed to the lower field strength of Ca compared to Mg and thus its lower ability to charge-balancing the negative charge around NBO sites. A [4]Mg site implies strong bond strengths and, thereby, a BO atom that is connected to two SiO4 and one MgO4 would be severely overbonded. Therefore, the oxygen connecting Mg to Si is preferentially a NBO atom. The high proportion of Ca–BO bonds may be explained by Ca atoms partly residing in more polymerized silicate-rich regions. This different behavior between Mg and Ca is supported by a O17-NMR study indicating that the Ca–Mg cation mixing may not be entirely random along the MgSiO3–CaSiO3 join [Allwardt and Stebbins 2004]. However, the Ca–Mg ordering is small compared to other cation mixing that associates cations having larger differences in charge and radius [Cormier et al. 2010]. The increase in Ca and Mg CNs in the liquids is associated with higher proportions of BO in the first coordination shell but the preferential association of BO around Ca is preserved.
The connection of cations with the silicate network can be further probed from the Si–Mg and Si–Ca PPDFs (Figure 5 and Supplementary Figure S7c,d). In the Si–Mg PPDFs, the first peak is at 3.2 Å in glasses and at 3.3 Å in liquids. The shift is small but apparent (Supplementary Figure S7c). These distances determined from the EPSR fits mainly indicate corner-sharing polyhedra. Indeed, very few examples of edge-sharing between MgO4 and SiO4 in EPSR models give Si–Mg distances at 2.7–2.9 Å. In the Mg–Si PPDFs in Figure 12a (see also Supplementary Figure S8a), a shoulder at 2.75 Å is discernible in the first peak at 3.28 Å and correspond to edge-sharing between SiO4 tetrahedra and [5]Mg and [6]Mg sites. This is also consistent with a recent DFT numerical study of Ca–Mg aluminosilicate glasses [Gong et al. 2021]. The intensity at the position of edge-sharing is higher in liquids while the corner-sharing intensity dominates in glasses. Similarly in Mg–Mg PPDFs (Figure 12c and Supplementary Figure S8c), the intensity at edge-sharing position between Mg polyhedra is higher in glasses than in liquids, and this latter shows higher intensities at Mg–Mg face-sharing and corner-sharing positions. This variation in Mg–Si and Mg–Mg PPDFS indicate less variability in glasses compared to liquids with mainly Mg–Si corner-sharing and Mg–Mg edge-sharing at ambient temperature.
EPSR partial pair distribution functions for the glass (blue curve) and the liquid (red dashed curve) for the different samples, highlighting the bond length regions characteristics of face-, edge- and corner-sharing for (a) Si–Mg, (b) Si–Ca, (c) Mg–Mg, (d) Mg–Ca and (e) Ca–Ca pairs.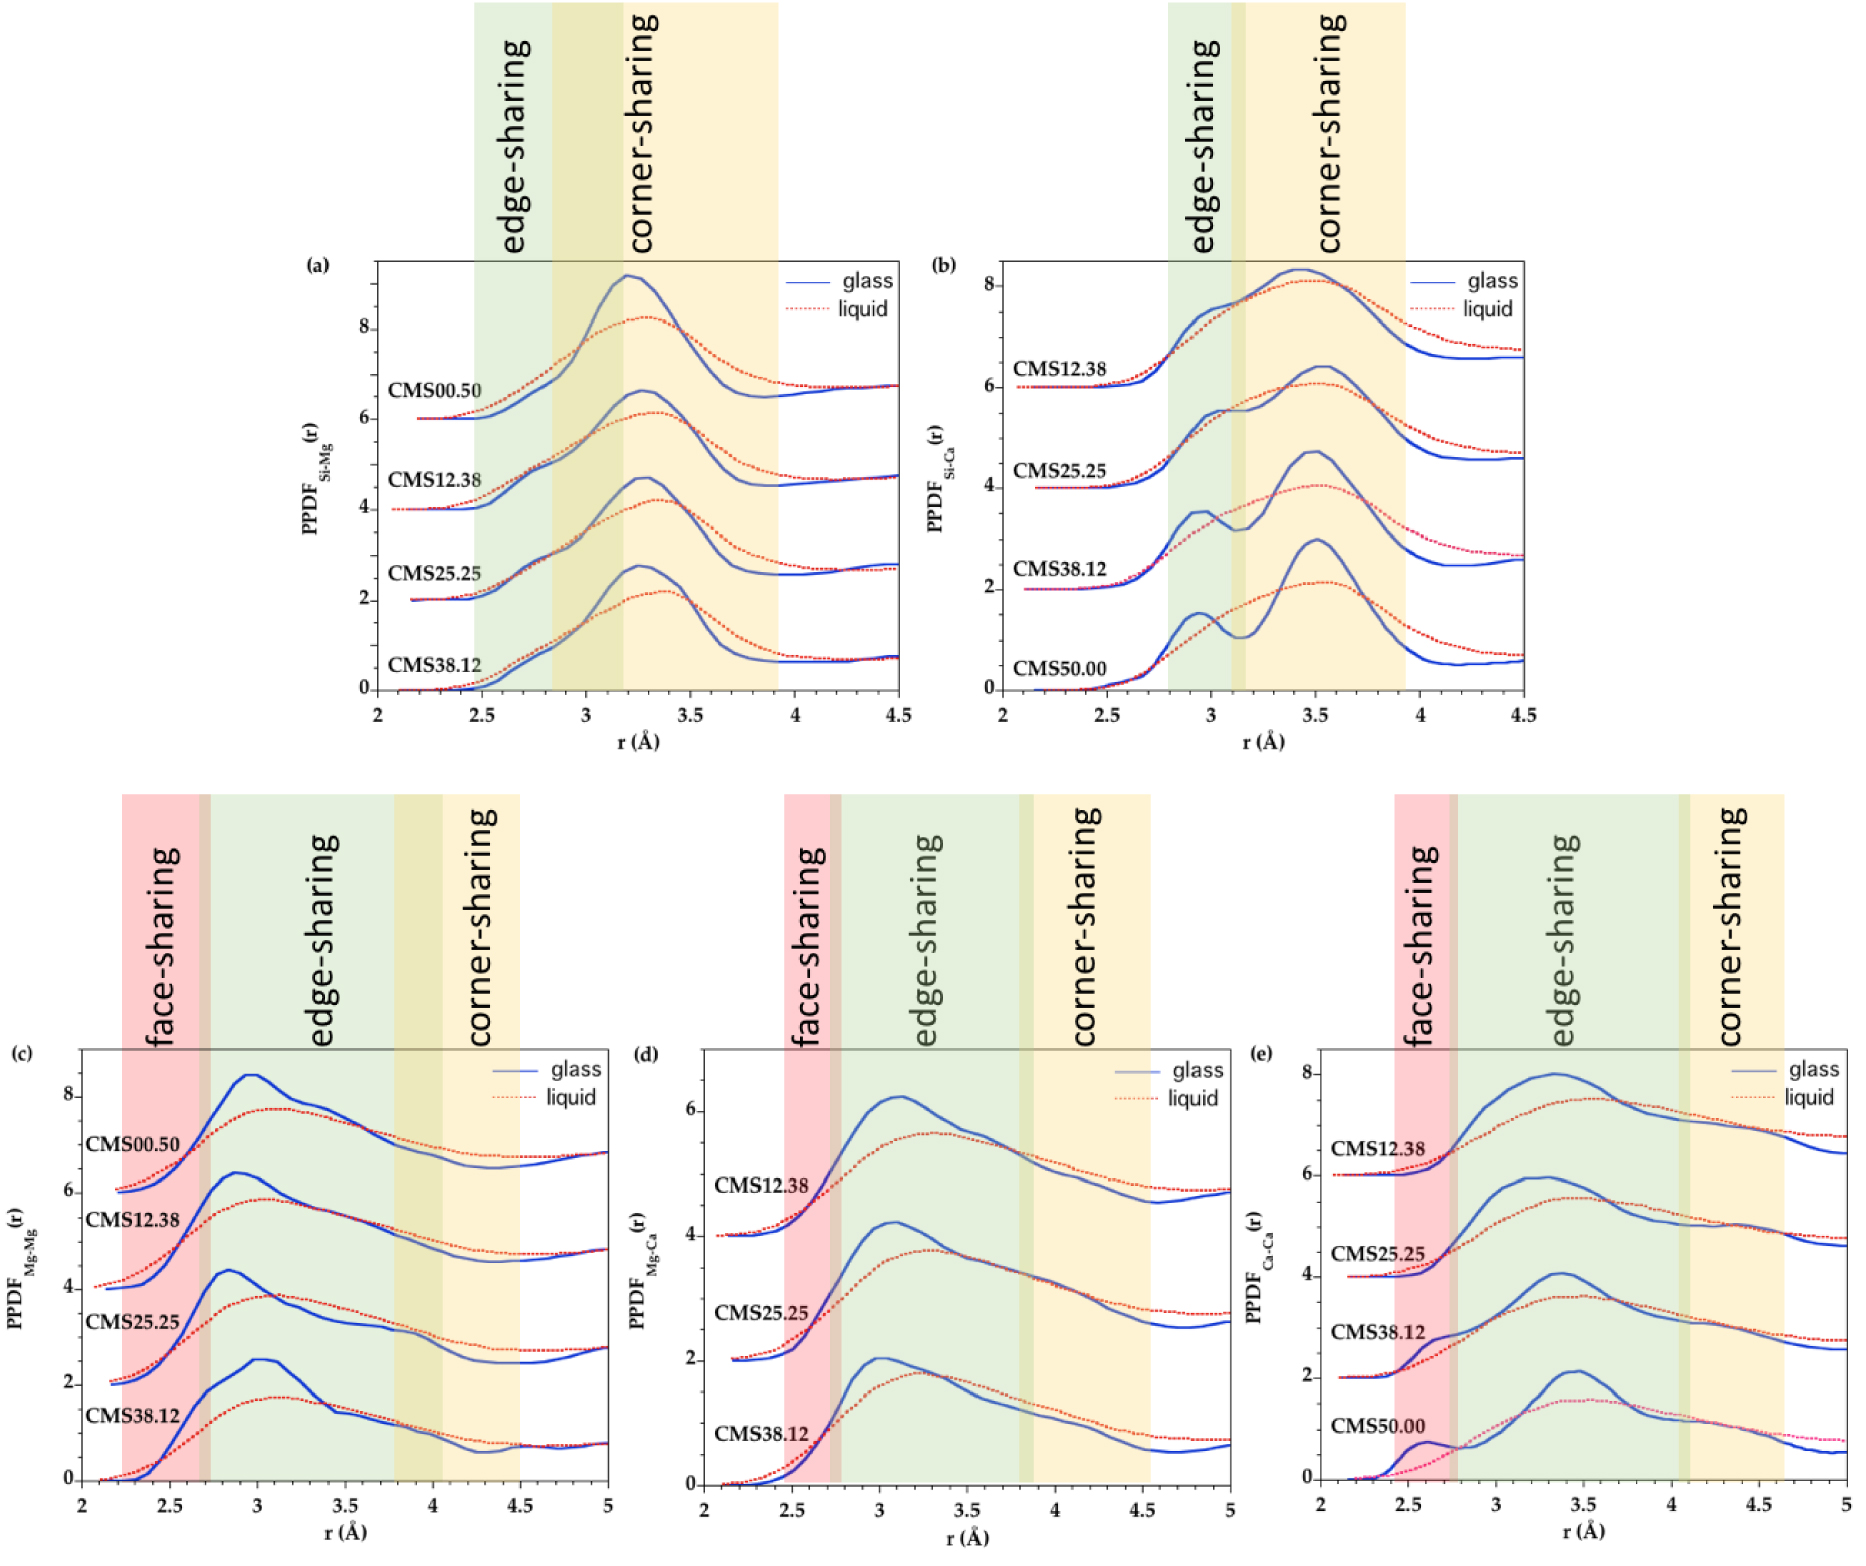
Two distinct peaks are observed in the Ca–Si PPDF of glasses (Figure 12b and Supplementary Figure S8b) at 2.95 Å and 3.50 Å that are assigned to edge- and corner-sharing connectivity between SiO4 tetrahedra and Ca polyhedra, respectively [Gong et al. 2021], with dominantly corner-sharing linkages. The intensity corresponding to Si–Ca edge-sharing decrease with temperature, a behavior dissimilar to Si–Mg linkages. The Ca–Ca PPDFs show a small peak at 2.60 Å that decreases with less CaO content, indicating a significant proportion of Ca–Ca face-sharing in CMS50.00 glass (Figure 12e and Supplementary Figure S8e). Such face-sharing connections are characteristic features of Ca-rich glasses as they disappear in the corresponding liquids. The large fraction of Ca–Ca face-sharing in the glass suggests nano-heterogeneities and Ca clustering [Benmore et al. 2010], which can result from partial liquid–liquid phase separation upon cooling [Benmore et al. 2020].
Upon cooling, a decrease in the population of Ca–Ca corner-sharing and an increase in Ca–Ca edge-sharing were previously suggested based on analysis of bond angle distributions in MD simulations of CaSiO3 glass/melt [Benmore et al. 2010]. This result is confirmed in the present investigation based on PPDFs analysis in all glasses and this trend is observed for both Ca–Ca and Ca–Mg linkages (Ca–Mg corner-sharing position has lower intensities and Ca–Mg edge-sharing position has higher intensities with a temperature decrease). For the intermediate compositions, the Ca–Mg contribution (Figure 12d) is well-defined, in agreement with a mixing between the two different cations.
The increasing fraction of edge-shared Ca/Mg polyhedra with decreasing temperature results in increasing the polymerization and Ca/Mg clustering. The Ca/Mg aggregation increases more rapidly near the glass transition temperature, which can partly explain the steep continuous rise in viscosity in the supercooled liquid as Tg is approached [Benmore et al. 2010, Skinner et al. 2012].
5.6. Structure of silicate melts
Glasses differ from melts by the configurational contributions that appear in thermodynamic properties above Tg and that imply a substantial change in structure with temperature. In silicate glasses/melts, a change in Qn distribution has been inferred from Raman and NMR studies, indicating that the disproportionation reaction 2Qn ⇄ Qn−1 + Qn+1 is displaced to the right in melts [Mysen and Frantz 1993, Stebbins 1995]. Though this contribution is important, the resulting heat capacity cannot account completely for the measured configurational heat capacity, indicating the occurrence of other structural modifications [Stebbins 2008]. In the EPSR models, changes in Qn distribution is small (less Q3 and more Q1 and Q0 at high temperature). Additional temperature-induced structural changes can be various: conformational relaxation of the network at IRO, site thermal expansion, coordination change or local distortion [Calas et al. 2006, Henderson et al. 2006, Majérus et al. 2004]. For the CMS system, the present analysis points to a considerable disordering around Mg and Ca cations at both short and medium range scale, as both cations in melts tend to enter larger sites with a change in the connection between polyhedra (Figures 8 and 12). The enhanced cation mobility with temperature allows cations to explore energetically less favorable sites with higher coordination that favors an entropy increase [de Ligny and Westrum 1996].
Our results indicate that the glass/melt structures of the two end members present significant differences though the well-defined Mg–Ca PPDFs is indicative of substantial mixing between the two sub-structures. The average CN is different between Mg and Ca with high coordinated sites for Ca and the increase in temperature yields the cations to be localized in further more coordinated sites. As a likely consequence of the larger cationic polyhedra, major modifications with temperature are seen in the cation–cation or cation–silicon linkages to accommodate the random packing of distinct MgOx and CaOx polyhedra. The greater diversity of connections explains an increase of the configurational entropy in the liquids. The structural organization evolves continuously with compositions between the two end members and, thereby, the changes are compatible with the expected ideal Ca/Mg mixing [Neuville and Richet 1991].
Dynamic processes such as viscous flow are controlled by the mechanism of Si–O bond breaking occurring during Qn-species exchange, as proposed for SiO2-rich silicate liquids [Farnan and Stebbins 1994]. In more depolymerized liquids, it was suggested that Ca–O and Mg–O bond breaking and cation mobility could significantly participate to structural relaxation and flow processes [Nasikas et al. 2012]. Indeed, a correlation between Mg motions and viscosity was confirmed in a high-temperature NMR study [George and Stebbins 1998], which indicates that this cation is strongly bounded to the silicate network. The cationic dynamics could be further enhanced by the increase entropy in the liquids resulting from diverse MgOx and CaOx connections. No studies have investigated in details the relaxation near Tg and it is then an open question if a decoupling behavior occurs as in aluminosilicate systems [Gruener et al. 2001] and if there is a different decoupling behavior between Mg and Ca containing systems.
When approaching the glass transition, it has been demonstrated that CaOx edge-shared polyhedra tend to cluster within the silicate network of CaSiO3 [Benmore et al. 2010, Skinner et al. 2012]. Similar increasing cationic heterogeneities are suggested in the present study for the complete MgSiO3–CaSiO3 join. The increase in IRO near Tg precludes the liquid to find a minimum basin corresponding to the crystal structure in its potential energy landscape. Such heterogeneities related to the Mg/Ca organization could also limit cation mobility, increase the viscosity and thereby favor glass formation. The presence of intrinsic heterogeneities in the glass structure has been reported recently in many aluminosilicate systems for cation mixing (Na–K aluminosilicate [Le Losq et al. 2017, Le Losq and Neuville 2013]; Ca–Mg aluminosilicate [Allu et al. 2018] and their spatial extent can be affected by the quenching rate [Dargaud et al. 2012].
6. Conclusions
The structure of a series of CaSiO3–MgSiO3 glasses and melts have been investigated by neutron and XRD using aerodynamic levitation. Experimental data have been fitted using the EPSR method to obtain atomistic models over the short and medium range order. The coordination of Mg and Ca has been determined at ambient and high temperature. Results show sites with higher coordination in the liquids compared to those in the glasses. This CN evolution implies modifications of the connection between Ca and Mg polyhedra and the connection of Ca and Mg polyhedra with SiO4 tetrahedra. Specifically, decreasing the temperature increases the proportion of Si–(Mg,Ca) corner-sharing, Si–Ca edge-sharing, (Mg,Ca)–(Mg,Ca) face- and edge-sharing and decreases the proportion of (Mg,Ca)–(Mg,Ca) corner-sharing. These changes suggest cationic heterogeneities along the glass series. Ca-rich compositions present Ca–Ca face-sharing and Ca is more connected to BO than Mg indicating that Ca2+ cations are slightly preferentially localized in polymerized silicate regions. The findings of these modifications at IRO bring a deeper understanding of the configurational changes with temperature.
Conflicts of interest
Authors have no conflict of interest to declare.