


 CC-BY 4.0
1. Introduction
The Critical Zone (CZ) is classically defined as “the near-surface layer where water, rock, air, and life meet in a dynamic interplay that sculpts landscapes, generates soils, and builds foundation for Earth’s terrestrial ecosystems” (National Research Council NRC 2001). Its vertical extension, beyond the few meters classically studied through the analysis of weathering profiles, is however still an open question [e.g., Riebe et al. 2017]. This lack of knowledge is probably associated with difficulties in sampling and gathering information from the deep CZ shielded by several meters of weathered materials [Riebe et al. 2017; Holbrook et al. 2019]. A commonly accepted view—but still debated [see Riebe et al. 2017]—is to assimilate the CZ lower boundary to the level where subsurface materials grades into compact rocks no longer affected by meteoric fluids [Riebe et al. 2017]. Thus, defining the deep CZ means characterizing the zones of groundwater flow connected with surface circulation and distinguishing them from deeper levels without evidence of water circulation or with circulations unrelated to surface processes. Parallel to the rise of the CZ concept, hydrogeological studies on continental water resources led to the definition of a conceptual structural scheme for Hard Rock Aquifers (HRA), i.e., aquifers in granitic and silicate metamorphic bedrocks [review in Lachassagne et al. 2021]. The theoretical HRA scheme is a stratiform structure beneath ground level and above non-weathered rocks, consisting of an unconsolidated saprolite (or regolith) level (a clay-rich zone formed by the weathering of silicate rocks) superimposed on a permeable fissured layer. The latter is characterized by a secondary fracture network with fracture density decreasing over depth until reaching the unweathered bedrock [e.g., Dewandel et al. 2011; Lachassagne et al. 2021]. In this type of structure, the hydraulic conductivity of the fractured level is mainly controlled by the permeability of sub-horizontal fractures, which is higher than that of other fracture families, and which also goes with the usual development of sub-horizontal groundwater flow at the regional scale. For its part, the existence of a secondary fracture network is interpreted as a consequence of alteration processes [e.g., Lachassagne et al. 2021; Worthington et al. 2016]. The HRA scheme has been built on the basis of a large context of field observations issued from weathering profiles [review in Lachassagne et al. 2021]. It typically concerns the first tens of meters beneath ground level [Wyns et al. 1999] and is undoubtedly a relevant model of CZ architecture in silicate rock context. However, the HRA model, similar to the CZ concept, is not very detailed regarding the exact location of their lower bound, i.e., the transition between the fissured horizon housing groundwater flow and the fractured bedrock underneath. Characterizing this boundary involves comparing, at the same location, the horizons where flow occurs and the structural and petrological data of the host rocks. This idea motivated in recent years diverse works to equip observatory sites of the CZ with deep boreholes of several tens of meters. Those should increase the cross-knowledge between the structure and architecture of the CZ over depth and the nature and types of water circulating within the CZ [e.g., Ayraud et al. 2008; Dewandel et al. 2011, 2017; Brantley et al. 2013; Buss et al. 2013; Orlando et al. 2016; Chabaux et al. 2017; Riebe et al. 2017; Hahm et al. 2019; Holbrook et al. 2019; Ackerer et al. 2021]. Such cross-information has also proved to be important for calibrating relatively recently developed hydrogeophysical investigation methods to better understand the structure and hydrological functioning of the CZ [e.g., Grelle and Guadagno 2009; Sailhac et al. 2009; Befus et al. 2011; Johnson et al. 2012; Masson et al. 2012; Holbrook et al. 2014; Parsekian et al. 2015; Orlando et al. 2016; Lesparre et al. 2020; Chaffaut et al. 2023].
The Strengbach Critical Zone Observatory (CZO) is a fully equipped environmental observatory with meteorological, hydrological, and geochemical data recorded since 1986 (https://ohge.unistra.fr). It is one of the reference sites of the French OZCAR network (Critical Zone Observatories: Research and Application—https://www.ozcar-ri.org). Specifically, the Strengbach observatory partly targets the study of weathering processes on the basis of stream water, spring water, and soil analysis [Viville et al. 2012, 2017; Pierret et al. 2018; Chabaux et al. 2019, and references therein]. It has been equipped with six 50–100 m-deep boreholes and three shallower 10–15 m-deep boreholes (hereinafter referred to as piezometers) in order to better understand the structure and circulation of water in the bedrock of the watershed. In the present study, we propose a synthesis of the main structural, petrological, and petrophysical data collected from the three deep-cored boreholes and the hydro-geophysical investigations acquired through the boreholes. These data, combined with those previously published on water chemistry and age [Chabaux et al. 2017; Ranchoux et al. 2021; Ackerer et al. 2021], allow us to propose a structural architecture of the deeper zone developed in the granitic basement of the Strengbach watershed. A consequence would be to give a first conceptual scheme for the localization and nature of water circulations at a site representative of HRA in landscapes of mid-altitude mountains.
2. The Strengbach critical zone observatory
The Strengbach CZO, hereinafter referred to as the Strengbach watershed, relates to the uppermost part of the Strengbach catchment, a watershed covering 0.8 km2. Its location is upstream of Aubure village, ≈15 km from the western border of the Rhine valley on the western side of the Upper Rhine Graben in the Vosges Mountains (Figure 1).
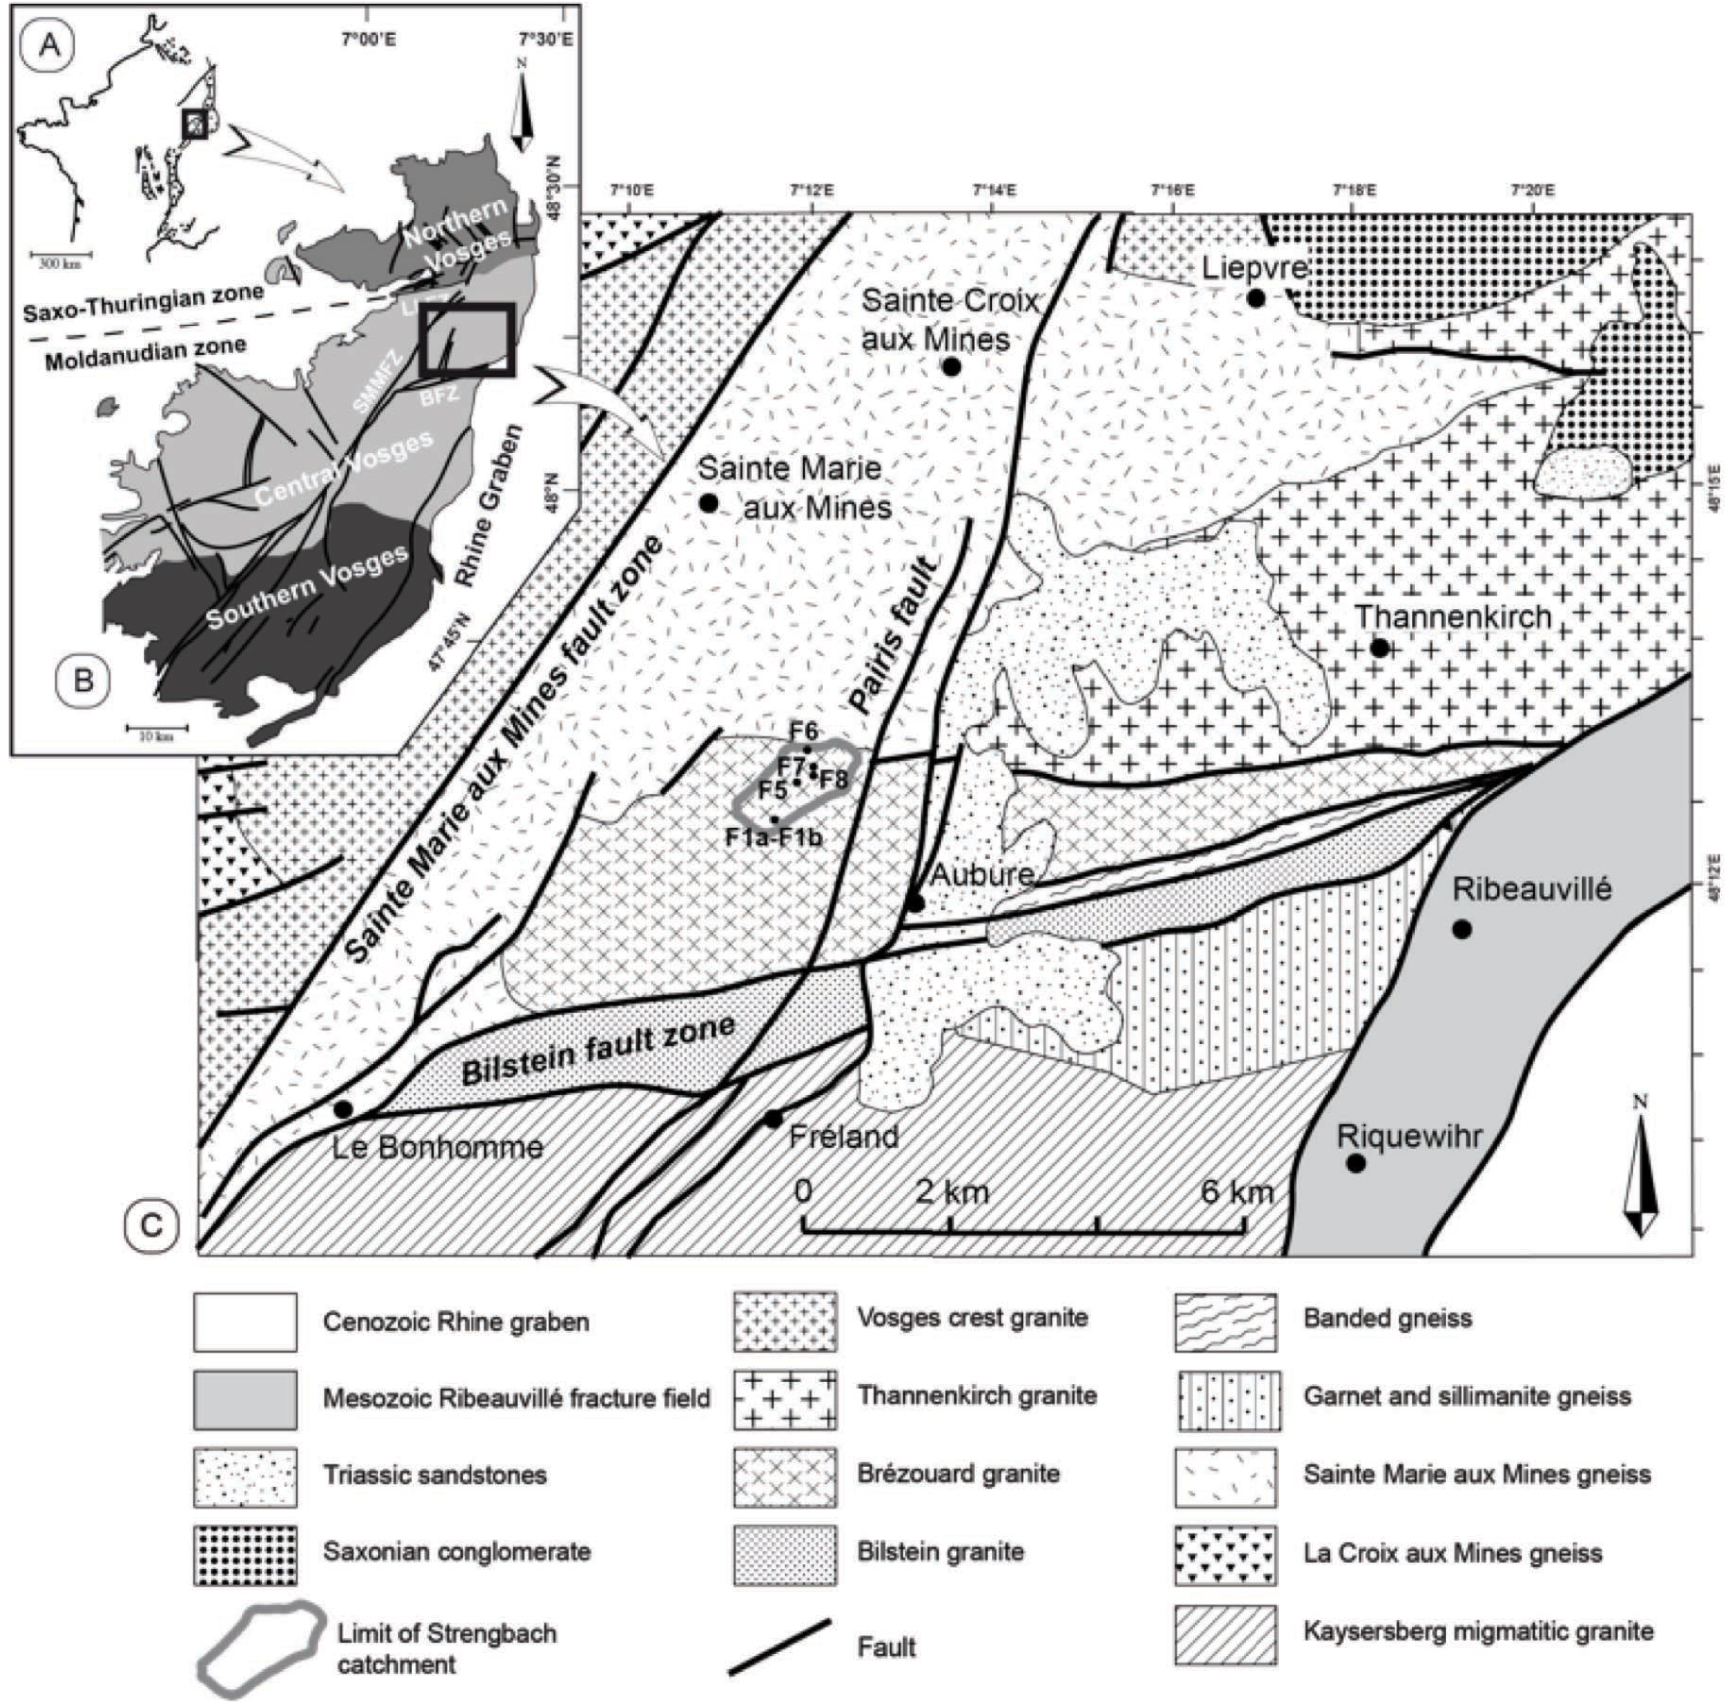
Geological setting of Strengbach watershed. (A) European Cenozoic rift system and location of Vosges Mountains in the western shoulder of Rhine graben. (B) Simplified terrain map of Vosges Mountains. (C) Geological map of Strengbach watershed and surroundings [after Blanalt et al. 1972a, b; Von Eller et al. 1975; Ménillet et al. 1978; Skrzypek et al. 2008]. SMMZ: Saintes Marie aux Mines fault zone; BFZ: Bilstein fault zone.
The geological context of the Vosges Mountains consists of an arrangement of elongated major tectonic terranes that collided during the Hercynian orogeny between −340 Ma and −320 Ma [e.g., Fluck et al. 1991; Lardeaux et al. 2014; Skrzypek et al. 2014, and references therein]. These terranes form three NE- to NNE-oriented main lithotectonic domains, known as the Northern, Central, and Southern Vosges (Figure 1). From a structural point of view, the Strengbach watershed belongs to the Central Vosges, which mainly exposes migmatites, gneisses, and granites with a complex multiphase tectonic history from the Hercynian orogeny to the formation of the current Tertiary–Quaternary reliefs. During the Hercynian collision, compressive structures induced crustal thickening associated with strike-slip faulting, followed by gravitational collapse and extensional tectonics. After a subsidence phase and Mesozoic sedimentation, the Rhine Graben opening during the Oligocene uplifted the basement in the rift shoulders. In response to the more recent Mio-Pliocene phases of alpine convergence, the Hercynian basement has been further exhumed in the Southern Vosges. As a result of this geological history, present-day regional bedrock structures trend ENE, N to NNE, and SW (Figure 1). During the Quaternary, the Vosges massif underwent erosion and weathering processes and was affected by glaciations, which decreased in impact northward together with topography [Ackerer et al. 2022].
The Strengbach watershed is located at altitudes ranging between 880–1150 m asl. The watershed is marked by significant slope asymmetry, with a gentler north-facing slope (8–9°) and a south-facing slope around 15–16° (Figure 2). The climate is temperate, oceanic and mountainous with an average rainfall of 1400 mm yr−1. Forest covers 90% of the area with 80% spruce (Picea abies L.) and 20% beeches (Fagus sylvatica). The bedrock is mainly composed of Hercynian Ca-poor granite, fairly hydrothermally altered, with small microgranite and gneiss inclusions along the southern and northern slopes, respectively [Pierret et al. 2018; Chabaux et al. 2019, and references therein]. Compared with granite, gneiss is Mg-rich due to the higher proportion of biotite and the presence of chlorite [El Gh’Mari 1995; Fichter et al. 1998a, b]. The granitic bedrock has undergone late hydrothermal alterations, which are described as more important on the northern slope of the watershed than on the southern slope [Fichter et al. 1998a, b]. The Strengbach watershed was most probably marked by periglacial events and not fully covered by glaciers or ice caps [Ackerer et al. 2016; Dehnert et al. 2010; Heyman et al. 2013]. Several meters of stripping at the summit area and colluvium deposits over the slopes occurred approximately 20 ky ago [Ackerer et al. 2016, 2022]. The bedrock is covered by ≈80–100 cm-thick soils ranging from Dystric Cambisol to Albic Podzol [brown acidic to ochreous brown podzolic, WRB 2014]. The soils usually cover a sandy saprolite, reaching several meters in thickness in some places [Pierret et al. 2018; Chabaux et al. 2019]. Bedrock outcrops are scarce, except for a few bouldery tors.
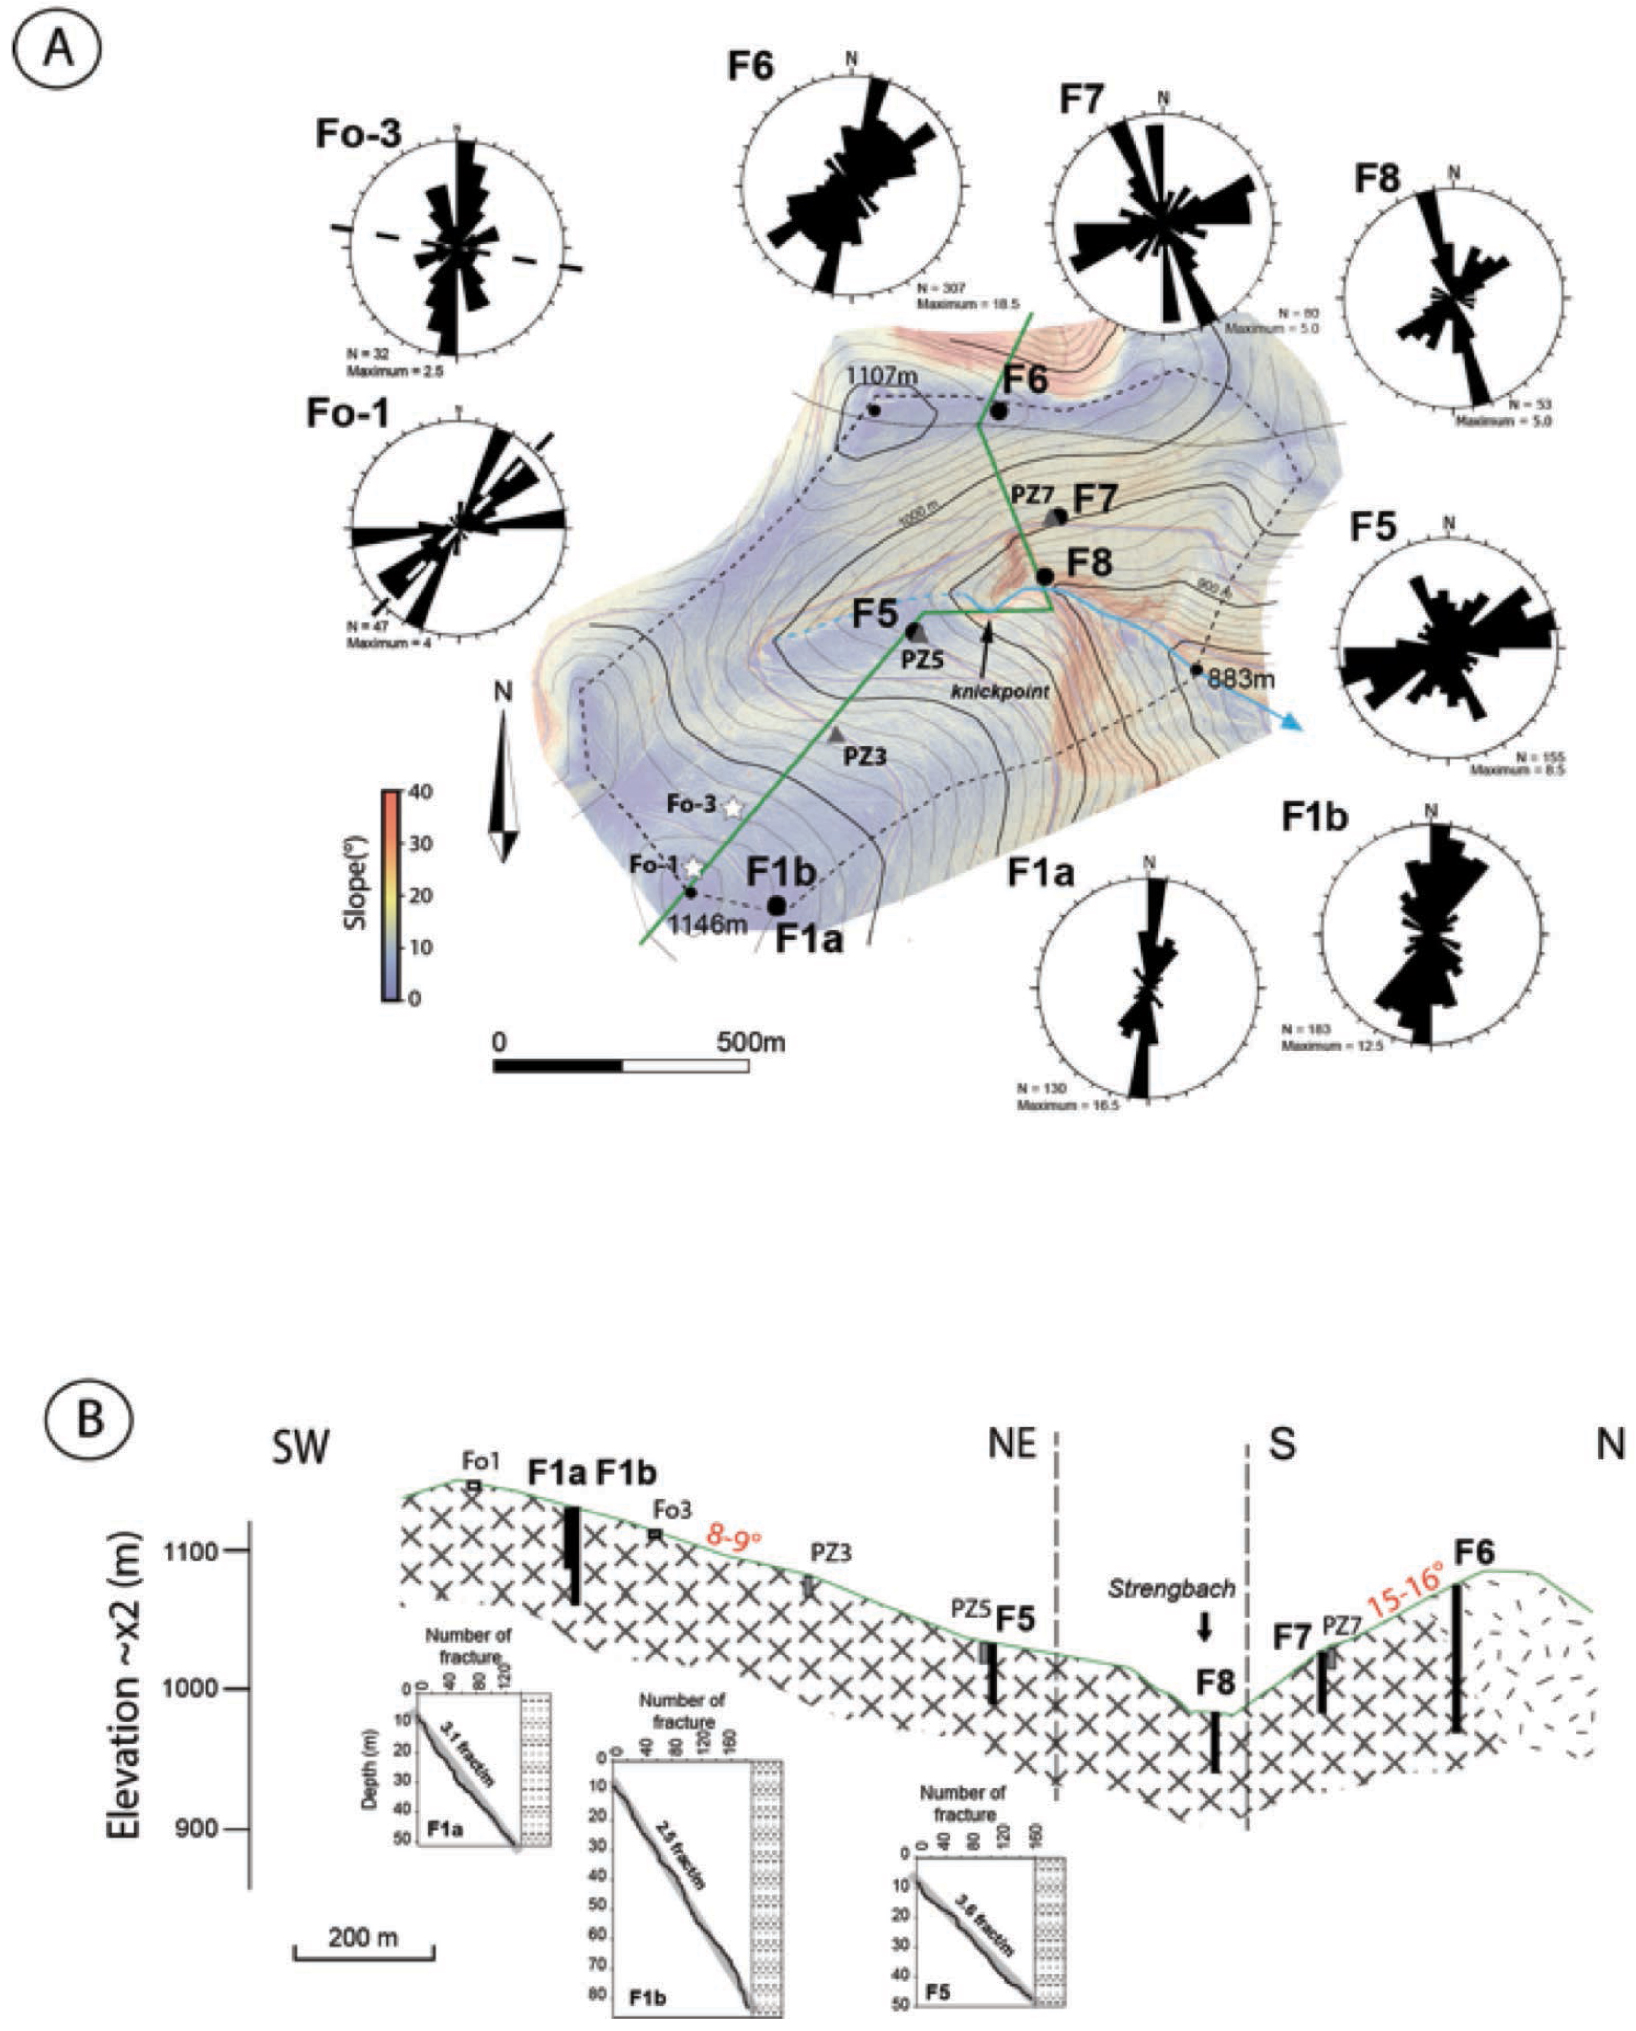
Strengbach watershed and location of the deep wells (Fx), piezometers (pzx) and pits (Fox). (A) Fracture direction measured in boreholes (Fx) and pits (Fox) located on simplified topographic map (contours every 10 m). The background is a slope map derived from an aerial 2018 Lidar survey (OHGE data). Knickpoint in valley bottom is indicated separating the western preserved upper part of the lower incised part of the watershed. Symmetrical rose diagram of direction represented with 10° classes, radius corresponds to 100% of maximum class, N: number of data; dashed line: direction of scanlines in the pits. (B) Geological cross-section with location of boreholes and pits, and fracture distribution along depth for F1a, F1b, and F5 (cumulative number of fractures vs depth). Bad image quality in other boreholes prevents relevant fracture distribution analysis. Masquer
Strengbach watershed and location of the deep wells (Fx), piezometers (pzx) and pits (Fox). (A) Fracture direction measured in boreholes (Fx) and pits (Fox) located on simplified topographic map (contours every 10 m). The background is a slope map derived ... Lire la suite
3. Sampling and analytical methods
The drilling of six deep boreholes (50–120 m depth; F1a, F1b, F5, F6, F7, F8 in Figure 2b) and three piezometers (≈15 m depth; pz3, pz5, pz7 in Figure 2b) was performed in 2012–2014. The nine boreholes are distributed along two transects, one along the south-facing slope and the other along the north-facing slope (Figure 2). F1b, F5, and F6 were cored and F6, F7, and F8 were entirely cased and equipped with multi-level screened sections. Acoustic and optical borehole wall images identify fracture zones at depth, leading to the installation of well screens (1.5 mm slots) in front of these fracture zones, considered as potential water circulation levels (five screened sections in F6, three sections in F7, two sections in F8). Sectional drawings of the six boreholes drilled in the Strengbach watershed and their main construction features are provided in Supplementary Section 1. A gravel pack (gravel diameter: 3–5 mm) was set up outside the screened sections to ensure proper water flow, and clay plugs of bentonite were used to isolate the screened sections. F5 and F1 remained uncased, except for the first 8 m, where a PVC casing and cement sheath were installed.
Physical–chemical loggings were regularly performed in the different wells with an OTT KL 010 TCM probe over the period 2015–2019 and an Idronaut Ocean Seven 303 multiparameter CTD probe in 2018. Electrical conductivity calculated at 25 °C (μS/cm) and temperature (°C) were always measured, with the latter probe providing pH, redox potential (expressed in mV in reference to the potential of the Standard Hydrogen Electrode), and dissolved oxygen concentration (% of saturation) profiles in the water column of the wells. The presentation of the downhole logging approaches used in the study is given in Supplementary Section 2.1. We also determined the fracture number and orientation in boreholes F1, F5, F6, F7, and F8 from the analysis of acoustic and optical borehole wall images acquired in November 2012 and June 2014. Fracture orientations were also measured along scanlines in the two pits Fo1 and Fo3 (Figure 2), previously studied by Ackerer et al. [2016], Ackerer [2017]. The method is detailed in Supplementary Section 2.2. Rock samples representative of the principal rock types observed in the cores were collected along cores F1b, F5, and F6 for porosity and permeability determination. Methods are detailed in Supplementary Section 2.3.
4. Results
4.1. Petrological units
The three cores’ macroscopic petrological characteristics are given in Supplementary Section 3. The principal information is summarized below and in Figure 3 and Supplementary Figure S1 (Supplementary Section 3).
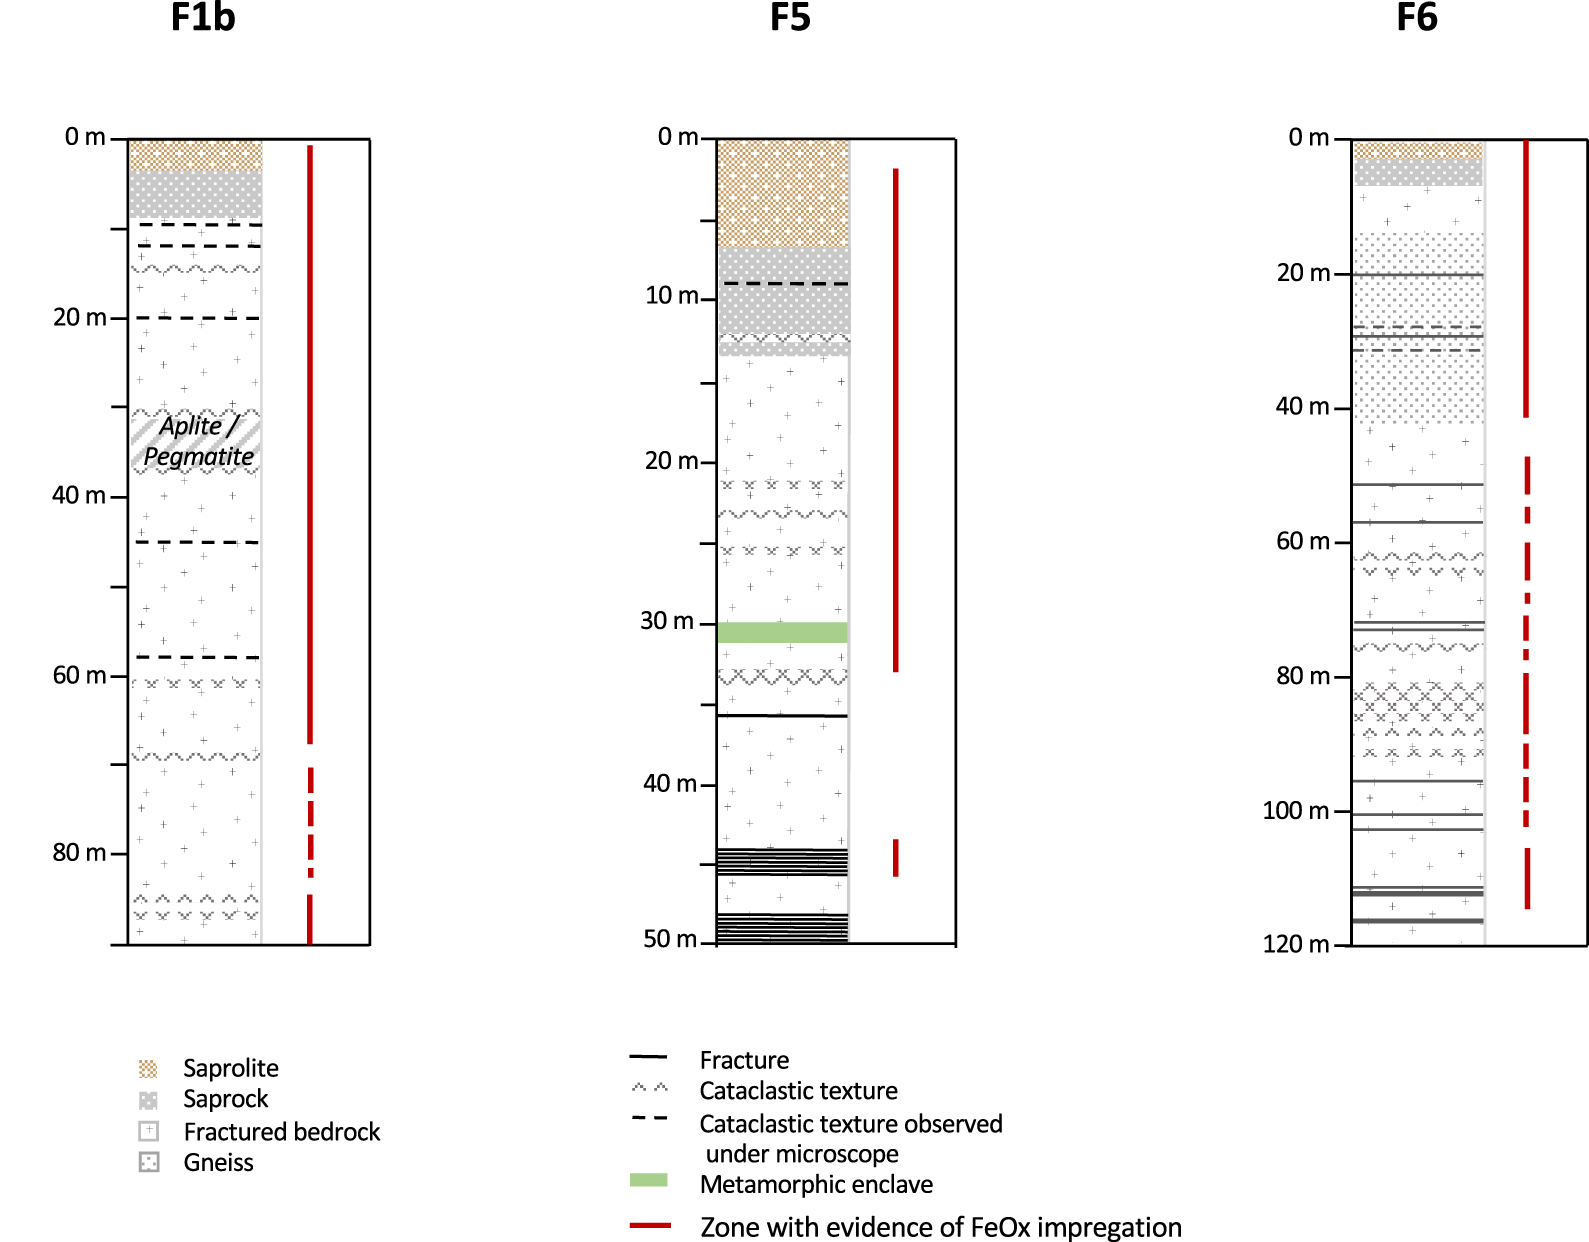
Geological log of the three cored boreholes (F1b, F5, and F6) with localization of the main fractures and indications of the main zones of FeOx impregnation.
The data, associated with those previously published for pits Fo1 and Fo3 [Ackerer 2017; Ackerer et al. 2016], show that in pits Fo1 and Fo3 and boreholes F1b and F5, the bedrock is porphyry granite. In F1b, the granite is crosscut by decimetric aplite and pegmatite veins at 31–35 m and 71–72 m. Core F5 is marked by the presence of a metamorphic enclave at 30.66 m. F6, located on the northern slope, first crosscut the gneiss injected by granite down to 42 m depth and then a porphyry granite similar to that observed on the southern slope.
Based on the petrological description of the three cores given in Supplementary Section 3, the following main features can be drawn:
- The three cores can be divided into a soil horizon with limited vertical extension (0.8–1.2 m), an unconsolidated saprolite level, and an in-place fractured bedrock. The latter is subdivided into an upper level of a few meters with open sub-horizontal fractures that pass with depth to a more massive bedrock with much less or no visible open sub-horizontal fracturing. The soil and unconsolidated saprolite horizons constitute the so-called mobile regolith of the profile. The upper part of the in-place granite with open sub-horizontal fractures is usually named the saprock level and is identified as such in this study. The fractured bedrock term has thus been limited to the bottom section of the core below the saprock level.
- The fractured bedrock is more massive than the saprock with the presence of macroscopic fracture zones or non-horizontal cataclase zones of limited vertical extension. The zones of fractures and cataclases identified in the cores along with their main direction are located in Figure 3. These zones evidenced current or recent water circulation. Outside such zones, the deep bedrock is slightly altered in appearance.
- Saprock and fractured bedrock horizons are characterized by mesoscale fractures clogged by secondary mineralogical infills. In both levels, these sealed fractures are intersected by the presently open fractures.
- The mobile regolith thickness increases along the southern slope of the basin, from ≈1–2 m upslope (Fo1) to ≈9–10 m downslope, close to the Strengbach stream. The saprock zone is less developed in core F1b (2–3.3 m) than in core F5 (9–12.5 m).
- In borehole F6, located at the top of the northern slope, the transition between mobile regolith and in-place gneiss of the saprock horizon is at 2.5 m depth, and the transition between saprock and fractured gneiss horizons is at 3.3–3.5 m. F7, F8, and pz7, located along the same hillside, were not cored. However, as detailed in Supplementary Section 3, some observations suggested a mobile regolith thickness of ≈2 m, varying only slightly from top to bottom along the south-facing slope as opposed to observations from the north-facing slope.
- Colluvium horizons are observed in pit Fo3 [Ackerer 2017; Ackerer et al. 2022] and, as detailed in Supplementary Section 3, in cores F5 and likely F1b, indicating a relatively large lateral extension of colluviums on the north-facing slope. The absence of pits or non-destructive coring along the south-facing slope made it impossible to assess whether or not the regolith of this hillside is also dominated by colluvium deposits.
4.2. Fracture network: description and orientations
Borehole wall images are only available below 3–8 m depths, depending on the wells, essentially within the saprock and fractured bedrock zone. Borehole imagery combined with core observations shows that the basement of the Strengbach watershed is affected by a large fracture network, irrespective of depth (Figure 2; Supplementary Table S1). Two types of fractures are distinguished: the meso-fractures, which are thin fractures with an aperture less than 1 mm, and major fractures, which present thick or associated thin fractures in fractured zones with a thickness over 1 cm.
Most of the meso-fractures have a steep dip (>50°). They are present both in saprock and fractured bedrock and are the major ones in the fractured bedrock. Others with a <20° dip are considered as sub-horizontal fractures. They are often sealed by iron hydroxides and occur as sub-parallel <4–5 cm long and <1 mm-thick cracks. Open sub-horizontal fractures are mainly observed in the saprock horizon and only a few in the fractured bedrock. The largest fractures show mineral infilling, cataclastic texture, and associated wall-rock alteration (Figure 3). Orientations of the largest fractures and of steep-dipped meso-fractures give evidence of one to two main fracture sets, depending on the considered borehole (Figure 2). The main set S1 is oriented N–S to NNE–SSW, and the secondary set S2 is oriented NE–SW to E–W. S1 has an orientation similar to the direction of the Upper Rhine Graben (Rhenan direction), whereas S2 has an orientation similar to the Hercynian terrane directions (Figure 1c). These two main fracture directions are thus those of the regional tectonic orientations inherited from the geological history of the massif.
4.3. Porosity and permeability
Porosity and permeability were measured in core samples from the boreholes F1b, F5, and F6 (Supplementary Table S2; Figure 4). The data pointed out a general decrease in porosity with depth. Porosity decreases from 20% to 0.6% in F5 when depth increases from 6 to 47 m. Even if the feature is less pronounced and assigned larger data dispersions, porosity decreases from 19% to 1.6% in F6 when the depth increases from 14 m to 118 m. The range of porosity variation was smaller in F1b, dropping from 5% to 1% as depth increased from 2 m to 86 m, except at 30 m depth, where a singular high porosity value was measured. The relationship between permeability and depth is similar to that of porosity (Figure 4). Permeability decreases by three orders of magnitude as depth increases from 6 m to 47 m in F5. There is a similar decrease for F6 but over the whole depth range (ca. 100 m) and if the data corresponding to the fracture zones (≈60 m) are not considered. Finally, there is almost uniform permeability over the investigated depth range for F1b, with two exceptions at 20 m and 86 m. The fracture measurements on the pit outcrops Fo1 and Fo3 indicate that the dominant fracture sets are roughly NE–SW (N20° E–N60° E) and E–W (N80°E–N90° E) oriented in Fo1 and NNE–SSW (N0° E–N30° E) in Fo3 (Figure 2b).
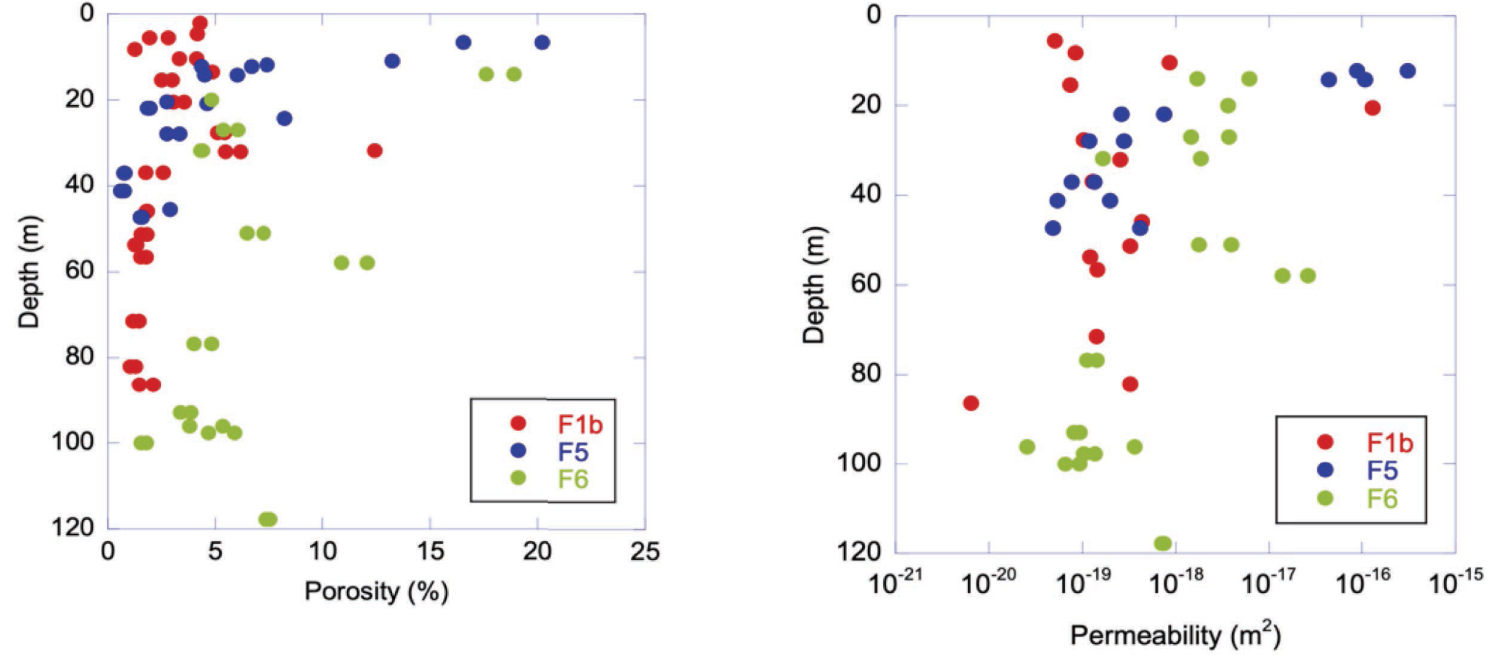
Depth variation of porosity and permeability. For F5, the porosities decrease progressively down to 14 m depth (≈ bottom of the saprock horizon) to reach low values at 20 m depth and beyond, except in the vicinity of macroscopic fracture or cataclastic fractured zones. In F1, the low saprock extension logically results in low porosity and permeability from 3–4 m depth. In F6, high porosity values are measured well below the saprock level, i.e., up to 31 m depth, which is in line with the high degree of fracturation of the gneiss bedrock horizon. Masquer
Depth variation of porosity and permeability. For F5, the porosities decrease progressively down to 14 m depth (≈ bottom of the saprock horizon) to reach low values at 20 m depth and beyond, except in the vicinity of macroscopic fracture ... Lire la suite
4.4. Physical–chemical borehole fluid logging
Several physical and chemical waterlogging campaigns have been performed since 2016, following the protocols given in Supplementary Section 2.2. The majority of the loggings were carried out under natural flow conditions and only a few after water extraction by pumping. The results of these logs are described below for borehole fluid temperature and electrical conductivity under natural flow conditions and after pumping.
4.4.1. Temperature
Temperature profiles measured under natural flow conditions in boreholes and piezometers (Figure 5) show seasonal variations down to 20–25 m depth, whether the well is cased or not. Borehole F6, with its deeper water table level, is an exception as it was only slightly influenced by seasonal changes. Below 20–25 m depth (40 m depth for F6), temperatures were much more stable over time and increased with depth according to the regional geothermal gradient. These profiles reflect water columns in thermal equilibrium with their local environment and therefore indicate that water inflows are not sufficiently large to disrupt these temperature profiles at depth.
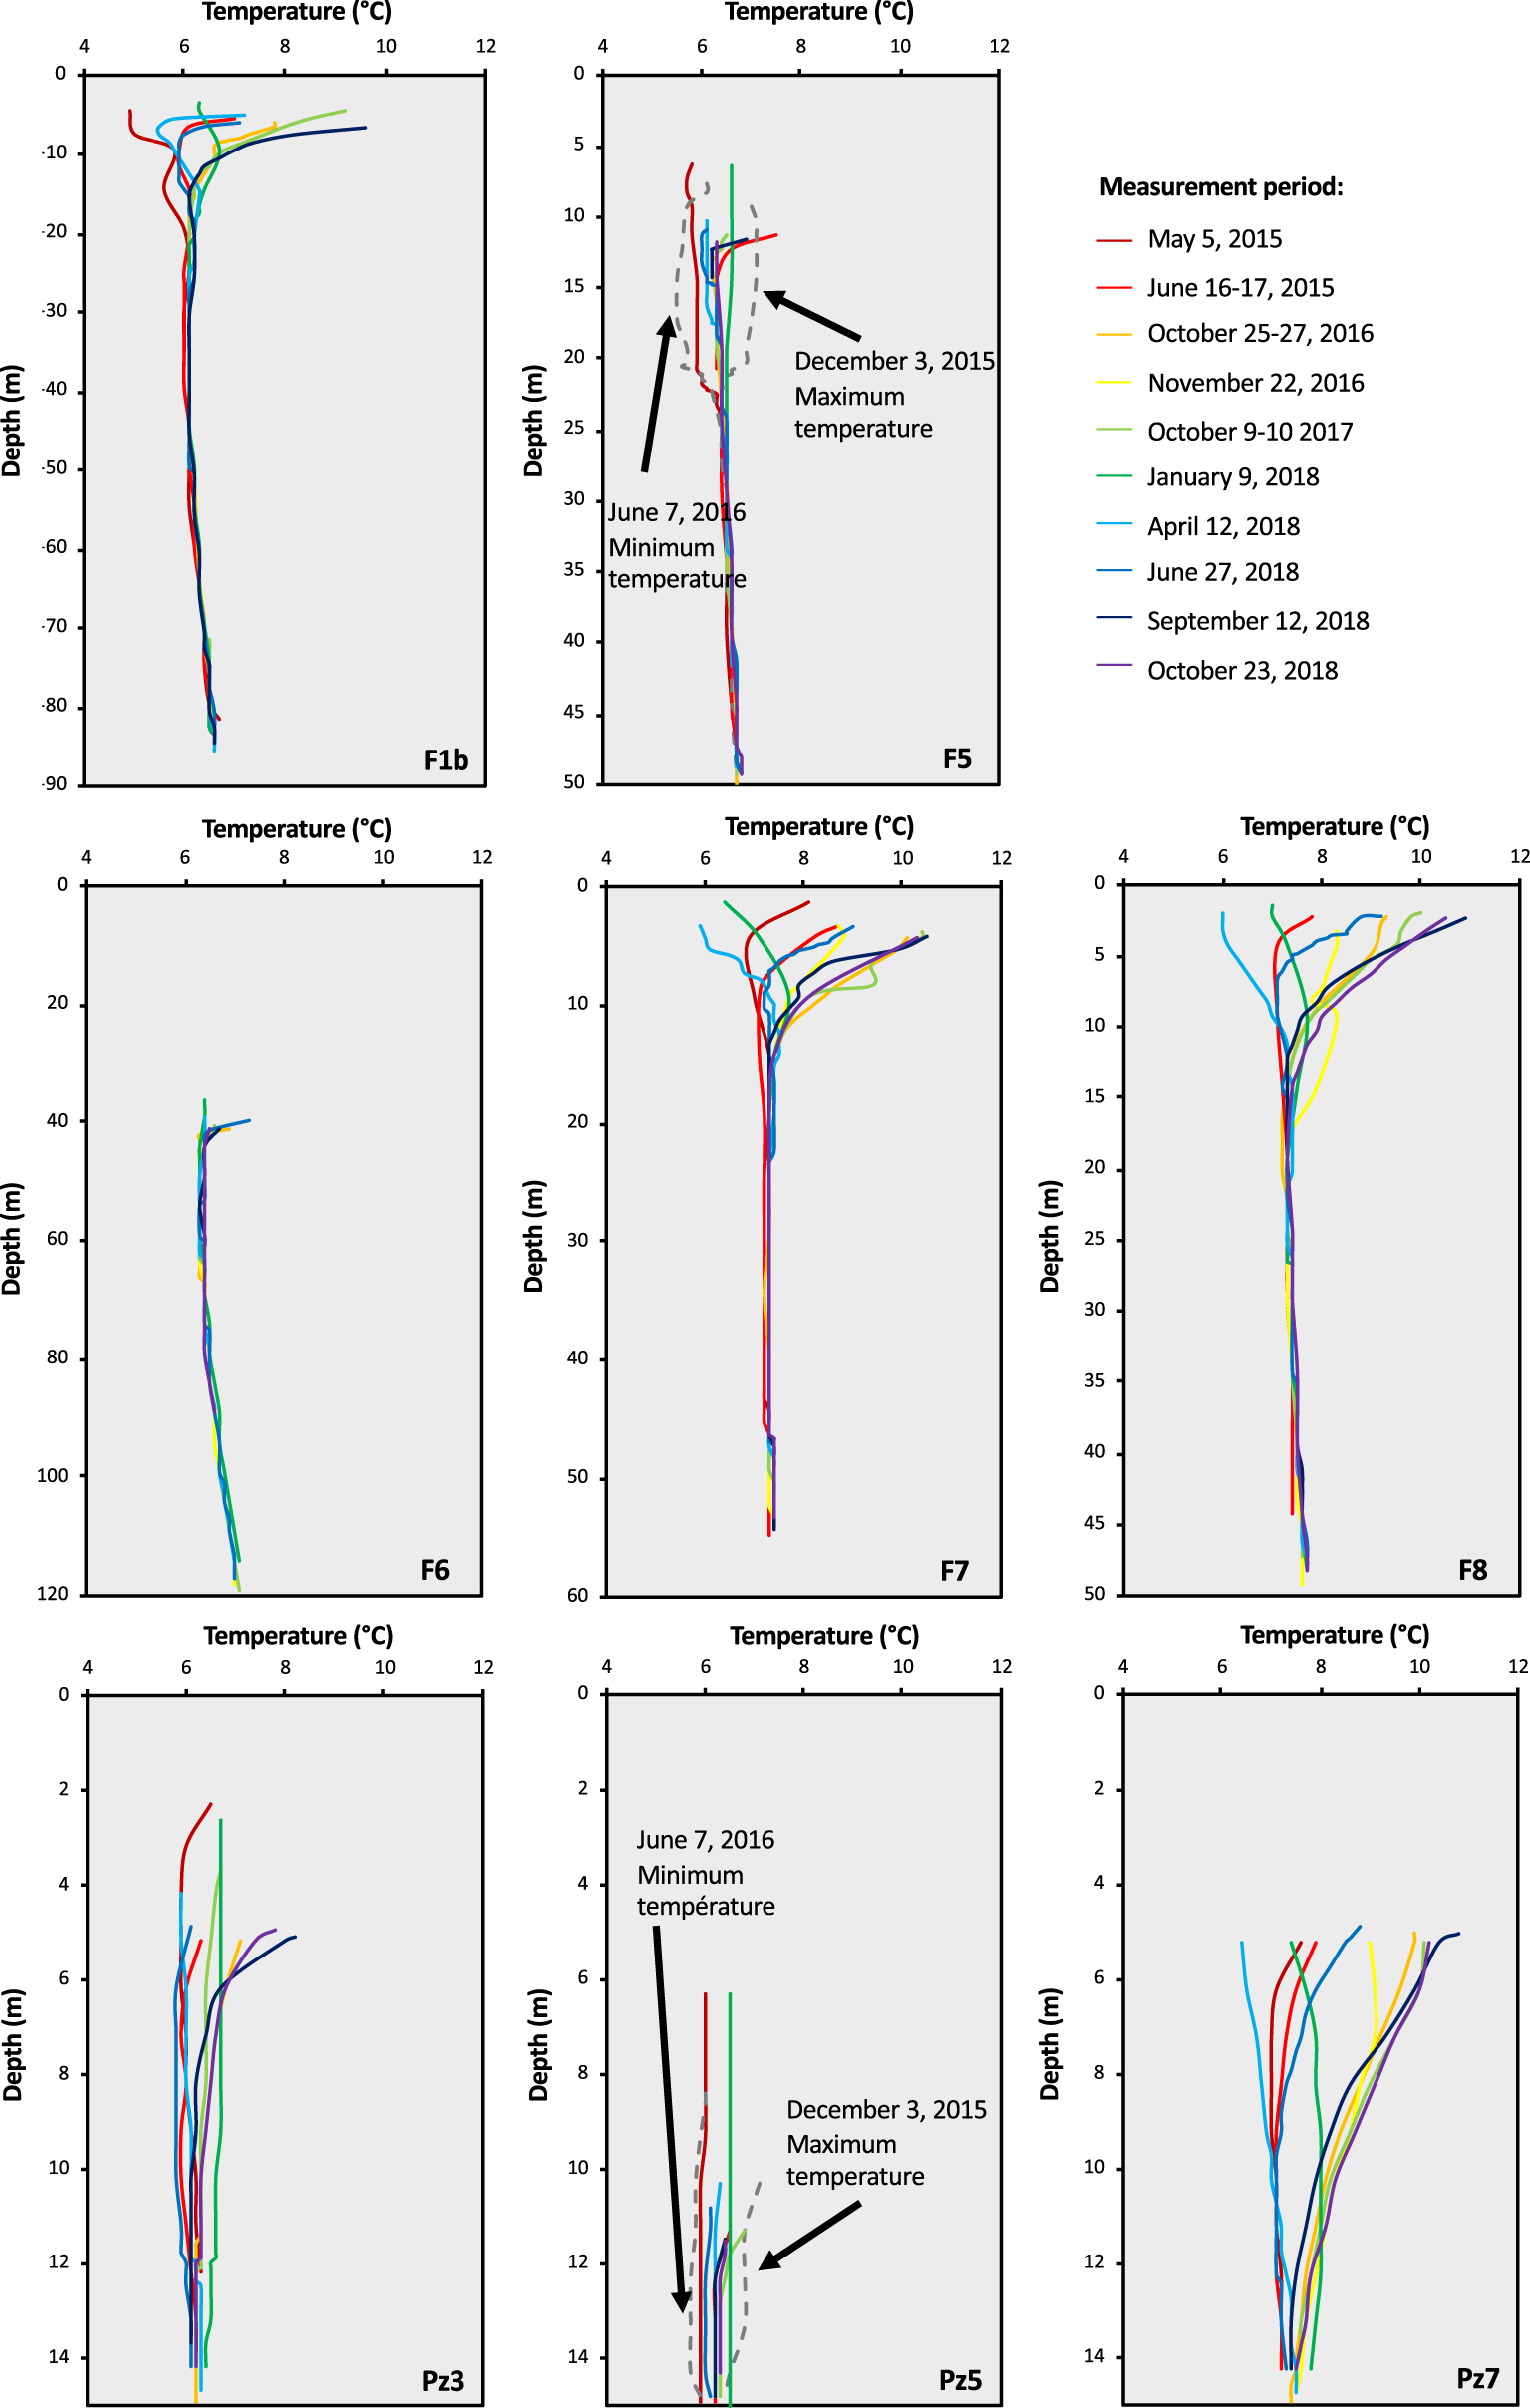
Borehole fluid temperature loggings using the OTT KL 010 TCM probe.
4.4.2. Fluid electrical conductivity
The borehole fluid electrical conductivity profiles are given in Figure 6. They are more contrasted than temperature profiles. A first group of boreholes includes F6, pz5 and pz7, where the electrical conductivity does not vary with depth, or slightly at the well as a result of the dissolution of accumulated material [Ranchoux 2020]. Changes over time in electrical conductivity are limited everywhere. A second group includes all the other boreholes and pz3. Conductivity profiles show one or several increases with depth, e.g., from values near 30 μS/cm (at 25 °C) from 2 to 12 m depth up to >200 μS/cm from 12 m to 15 m in pz3. Changes of similar amplitude were observed in F5, with sudden increases varying in depth as a function of time, shallower when the static level was shallow (6.3 m and 12 m respectively), and deeper when the static level was deeper (11.6 m and 23 m depth, respectively). However, the interface depth is not a direct function of the water table level evolution. As F5 is largely uncased, such conductivity profiles suggest the existence of at least two contrasted water inflows along the borehole, with low-conductivity water similar to that measured in spring water at the surface and higher-conductivity water in the deeper part of the borehole.
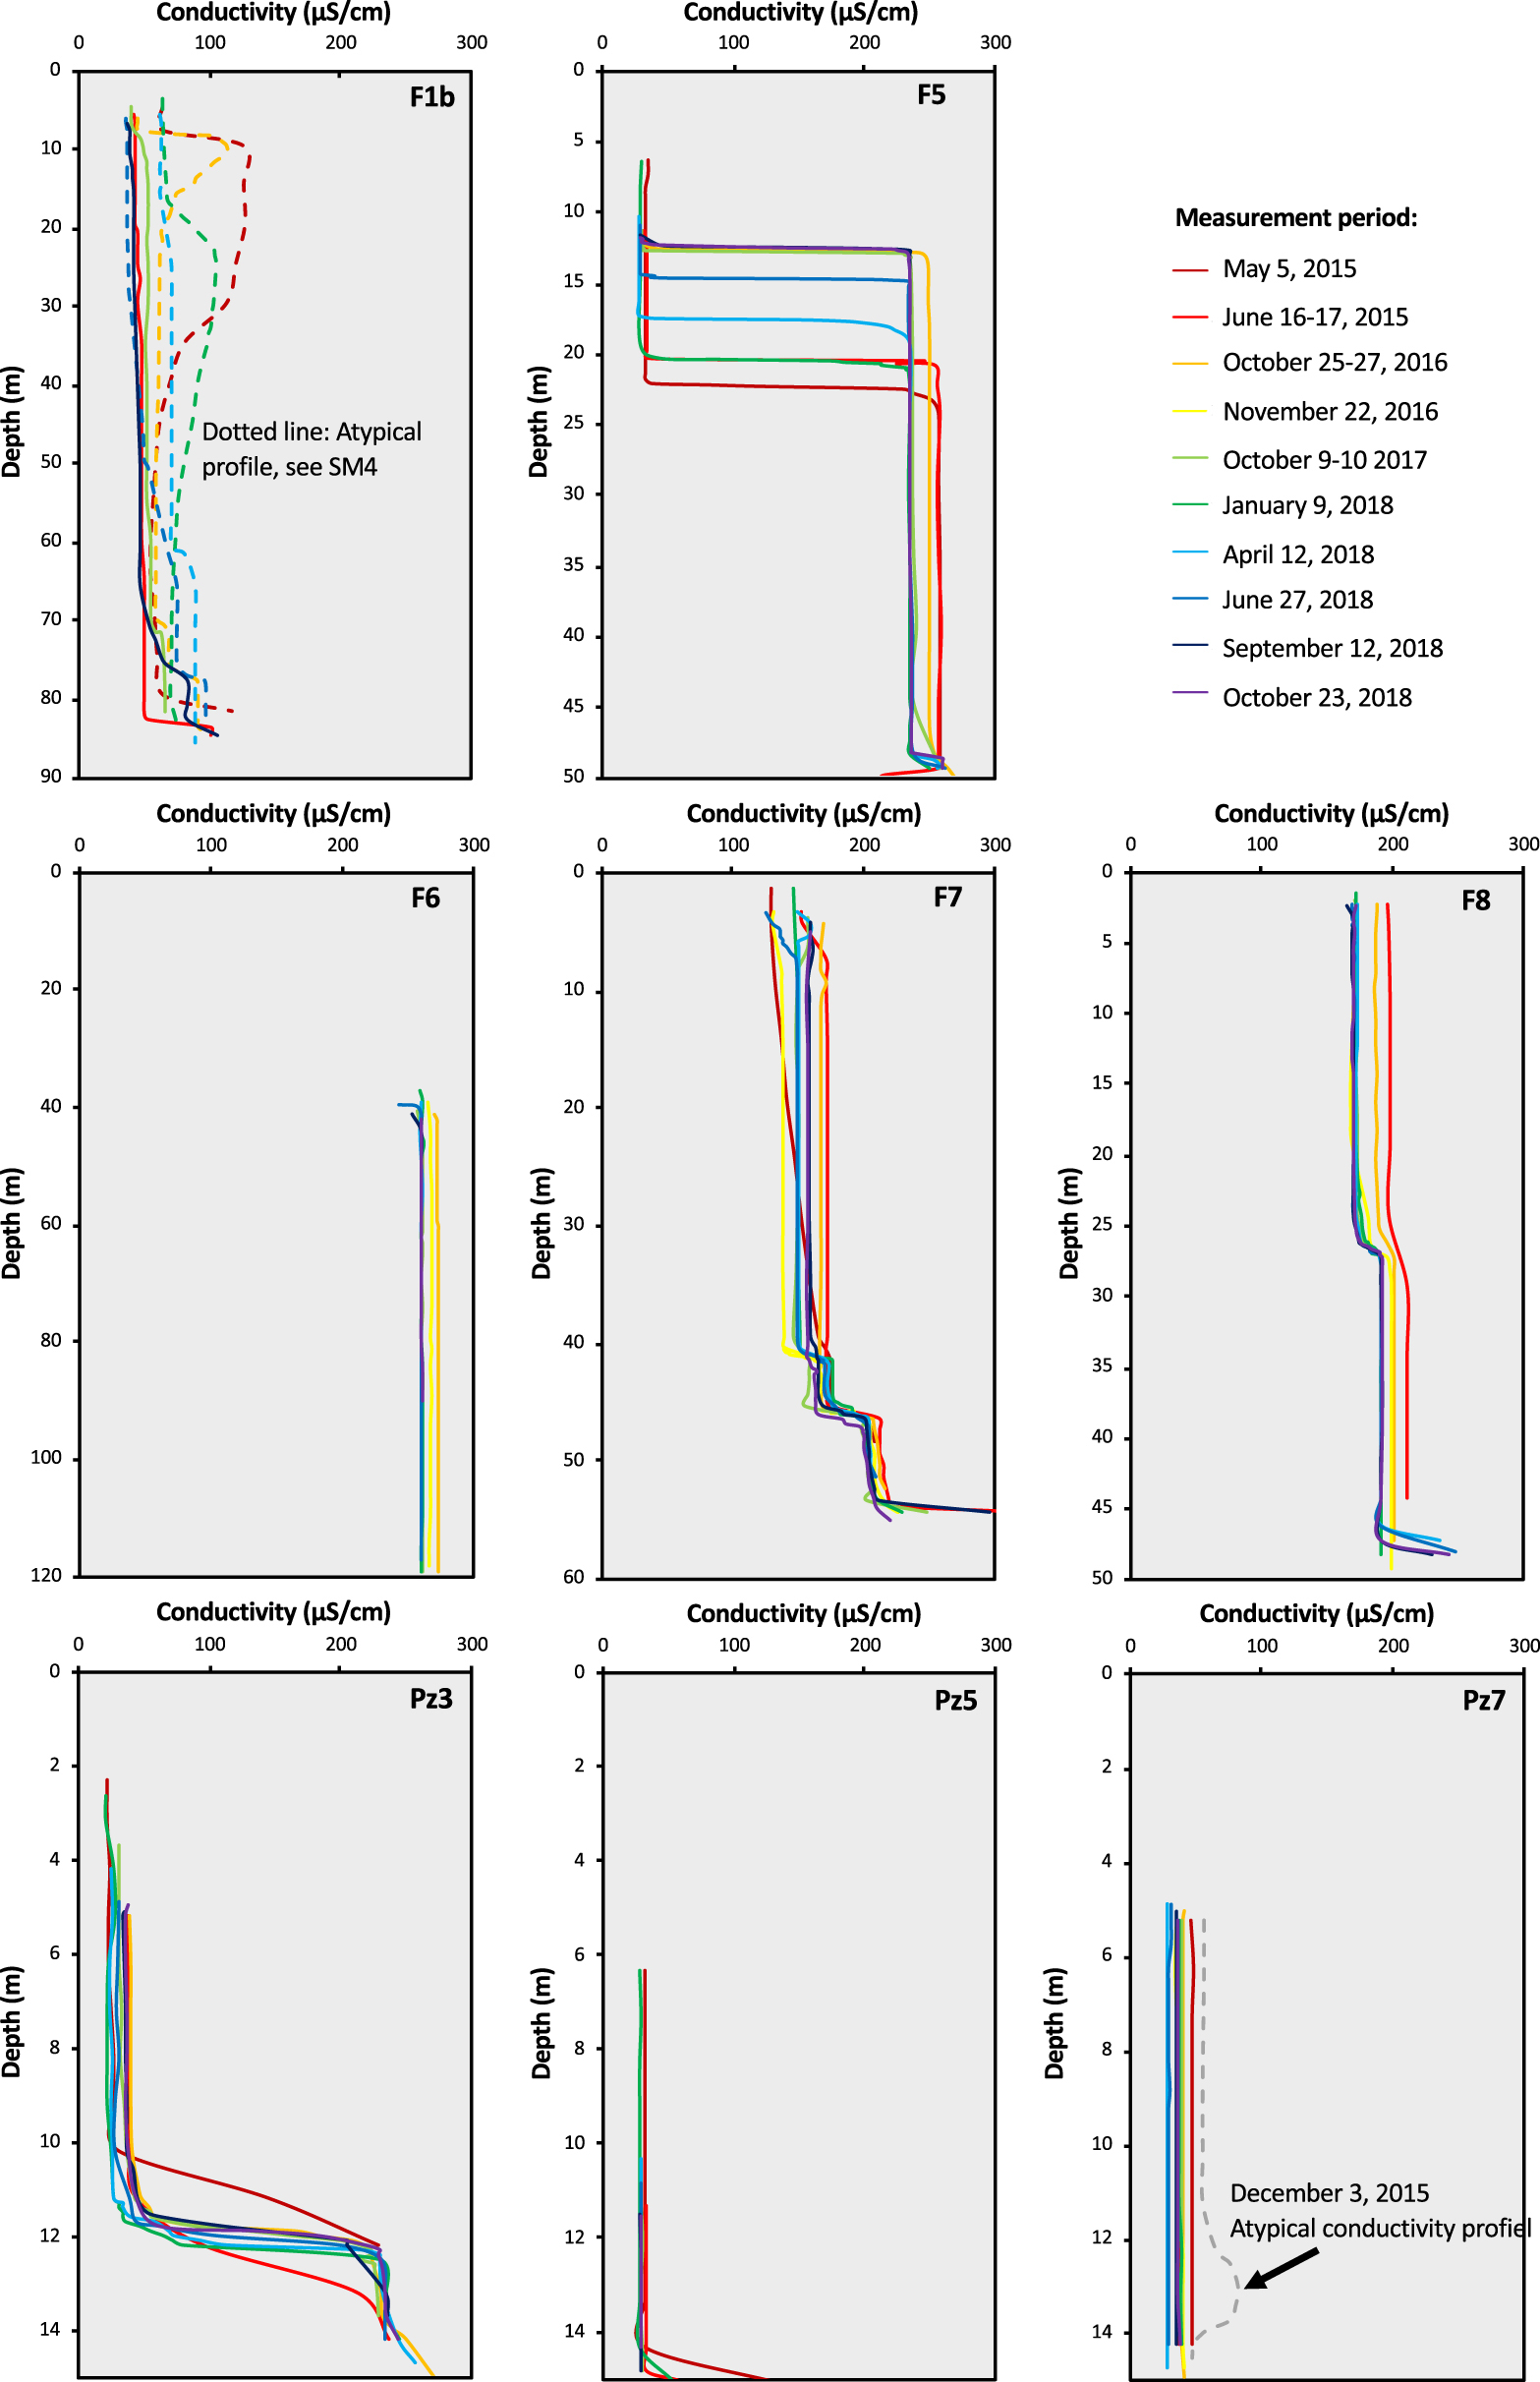
Borehole fluid conductivity loggings using the OTT KL 010 TCM probe.
For F1b, when the static water level is high, an interval of higher conductivity often appears at the top of the water column. It is attributed to concrete leachate (see Supplementary Section 4). The conductivity profiles in F1b also suggested that this higher level progressively migrated downhole over time and was therefore not diluted by lateral flow. This implies a low rate of water production in this borehole. This is confirmed by the weak local hydrological connection between F1b and F1a, 6 m away from each other, indicated by the absence of any significant variation in the piezometric level in F1b when F1a was purged. The conductivity in F1b is low compared to that measured in the deep F5 levels, but systematically higher than that of spring water or piezometer water. Moreover, two to three different conductivity zones were observed during some investigations, with conductivity increasing with depth (Supplementary Figure S2 in Supplementary Section 4), suggesting the occurrence of different deep-water inflows in F1b.
Contrary to F1b and F5, F6, F7, and F8 were equipped with a succession of cased and multi-level screened sections (Supplementary Section 1). Their water conductivity was high, e.g. >120 μS/cm for the lowest values of F7 to approximately 260–270 μS/cm in F6 or the highest water conductivities in F7 (Figure 6). There are no low conductivity horizons and thus no surface waters infiltration in these boreholes due to the casing of the upper part. Only F6, equipped with four screened sections, has relatively uniform conductivity profiles throughout the water column. Such an observation can indicate that this borehole is mainly supplied by the water flow identified at 63 m depth during drilling and with no other significant contribution from other horizons. Borehole F7, equipped with three screened sections, has a conductivity profile marked by several steps, suggesting the existence of several water-productive horizons along the borehole, with at least two different production zones between 40 m and 47 m. Borehole F8, with two screened sections, shows small conductivity changes with depth that occurred at a depth between 25 m and 30 m (Figure 6), suggesting the occurrence of at least one specific water supply in each screened section.
4.4.3. Influence of pumping on physical–chemical logs
The influence of pumping on the temperature and chemical profiles of the water column was evaluated by performing physical–chemical logs just after a pumping session. The results are compared to the logging results before pumping (Figure 7), the latter being considered representative of equilibrium conditions under natural flow. In addition to a decrease in the water table level, indicative of relatively low-productive water horizons (pumping rate <1.5 m3/h), the temperature and chemical profiles change in all boreholes and depart from equilibrium conditions, with the occurrence of some anomalies. When the temperature peak is at the pump level, an artifact induced by the local pumping stress cannot be avoided (e.g., heating induced by the pump rotor). However, when located at different depths or associated with other chemical changes, the temperature anomalies are better related to water inflow from productive zones. In our study, temperature anomalies were often associated with conductivity anomalies, as shown in Figure 7. For example, this is the case for F6 at 62–63 m depth, where an increase of more than 0.5 °C is measured. Second-order changes are observed from pH or dissolved oxygen concentrations. Based on such anomalies, a limited amount of water circulation zones are identified. These zones are systematically associated with fracture zones identified on the cores and borehole wall images. These zones are listed in Table 1.

Comparison of borehole fluid physico-chemical logs (temperature, electrical conductivity, pH, and dissolved oxygen using the Idronaut probe) prior to and after pumping. The geometry of the boreholes is indicated by the technical sections. The main productive water horizons are indicated by arrows.
Water flow levels determined from the physico-chemical loggings in the Strengbach watershed boreholes and relation with geological features deduced from borehole imagery and core observations
| Borehole | Water flow depth interval (m)* | Used physico-chemical criteria | Geological observation |
|---|---|---|---|
| Pz3 | 11–12 | Temperature and redox | No available observation |
| F5 | 15–16 | Electrical conductivity | NE–SW and E–W fractures |
| F5 | 20–24 | Dissolved oxygen | E–W fracture zone |
| F5 | 30–33 | Temperature | Lithological discontinuity at 33 m |
| F5 | 43–44 | Electrical conductivity | E–W fracture zone at 45 m |
| F6 | 62–63 | Temperature, electrical conductivity and dissolved oxygen | Major fracture zone at 63.5–64.3 m (N72° E direction) |
| F6 | 77–80 | Dissolved oxygen | Large N–S fracture at 79 m |
| F6 | 110 | Temperature | NW–SE to E–W fracture zone between 113.3–114.4 m |
| F7 | 41–42 | Electrical conductivity | NE–SW single fractures |
| F7 | 46 | Temperature, pH and electrical conductivity | NE–SW single fractures |
| F8 | 21 | Dissolved oxygen and electrical conductivity | E–W (N72° E) fracture at 20.7 m depth |
| F8 | 27–28 | Electrical conductivity and temperature | NE–SW fracture zone between 25–29 m |
| F8 | 43–47 | Dissolved oxygen | N55° E single fracture |
* Depth interval as suggested by changes noticed on physico-chemical logs when comparing log under natural flow conditions and log shortly after pumping.
Physico-chemical logging, performed sequentially after pumping, provides data on the return time to equilibrium. Figure 8 shows such acquisitions, performed only in F5, which is open below 9 m (i.e., above the static water level). All the water column data correspond to flow conditions in open holes, with lateral flows coming from productive levels and eventually from vertical flows induced by temperature and/or salinity gradients. Three reference logs acquired under undisturbed conditions (natural flow conditions before pumping) are presented for April 2018 and June/July 2019 (Figure 8).
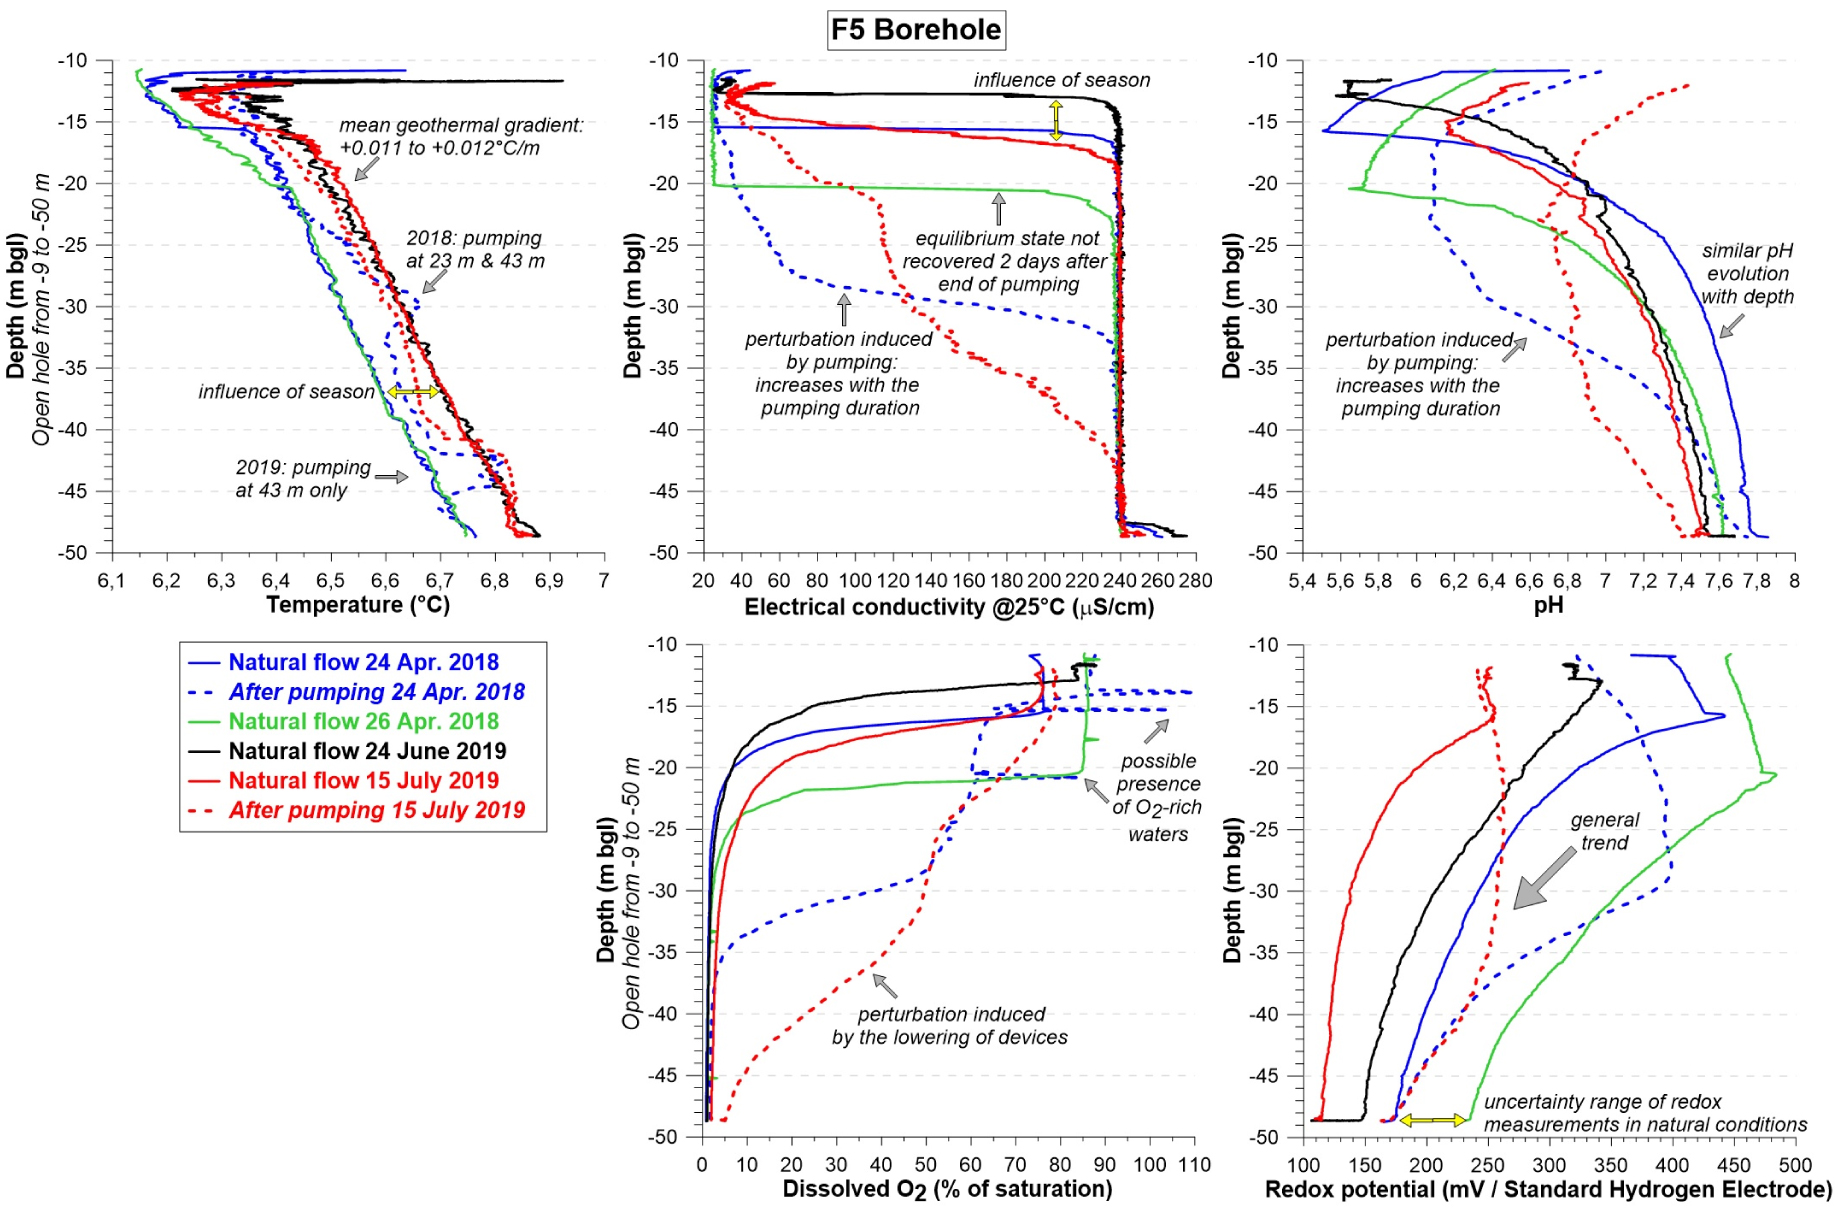
Borehole fluid physico-chemical logs from the Idronaut probe in F5, presenting temperature, electrical conductivity, pH, dissolved oxygen, and redox changes prior to and after pumping.
Pumping actions performed without packers severely disturbed the natural flow conditions, as shown by the conductivity log performed shortly after pumping on April 24, 2018. This perturbation was not rapidly resorbed, as highlighted by the conductivity log recorded two days later (April 26). Thus, several days were needed to recover steady-state conditions, as also evidenced by Ranchoux [2020] for similar monitoring made in 2015. A similar statement can be proposed regarding pH and even dissolved oxygen. The situation is different with temperature. The effect of pumping is shortly transient, probably because the fluid temperature is quickly buffered by the rock temperature. Perturbations lasting several days also suggest quite a reduced water production from the different production levels.
5. Discussion
The results from the Strengbach CZO lead to a comparison of the architecture of the watershed bedrock with the nature of the water flowing through it. Such a combined dataset, still scarce at this scale, is relevant to discuss the aquifer and water circulation level pattern in this watershed, representative of mid-mountain granitic basins.
5.1. Nature and vertical extension of the surface aquifer
Structural and petrological observations of the cores and boreholes combined with observations of the pits give a first view of the underground vertical structure in the Strengbach watershed. It consists of a loose or mobile saprolite, on top of which the soil develops and under which an in-place fractured bedrock zone extends over depth. The in-place bedrock is subdivided into a few meters of extended saprock level characterized by open sub-horizontal fractures that pass with depth to a more massive bedrock (the fractured bedrock level) with few or no visible open sub-horizontal fracturing. Nowhere is a level of fresh bedrock reached without evidence of water circulation.
Water conductivity data evidence that the piezometer and surface waters from F5 have much lower conductivities than the F5 deep waters. Moreover, their conductivities are close, not to say identical, to those of spring waters. Such an observation indicates that both water types circulate in the same aquifer system. The very similar geochemical and isotopic data of these waters [Chabaux et al. 2017; Ackerer et al. 2018, 2020; Ranchoux et al. 2021], as well as the results of the modeling of the geochemical composition of the spring waters and the piezometers of the south-facing slope [Ackerer et al. 2020], lead to the same conclusions. All these waters circulate within the same hydrological compartment corresponding to the surface aquifer controlling the spring waters’ chemical composition. Comparison of hydrological data with core and well data helps clarify the nature and vertical extent of this aquifer.
Borehole F5 was drilled in a 9 m-thick mobile regolith zone and a 3–4 m-thick saprock zone. It was sealed with PVC and cement pipe to a depth of 8–9 m. Borehole F5 can, therefore, only be fed by water circulating in the lower horizons of the mobile regolith or deeper. Observation of water of low conductivity in the upper part of the water column to depths up to 13 m depth or more, depending on the season and in the absence of wellbore flow, suggests that the water in the so-called shallow subsurface zone may still circulate below a depth of 10 m, that is, in the saprock. The measurement of very high porosity and permeability at 10 m depth and still high at 12–15 m depth in core F5 is consistent with this conclusion. The conductivity profiles measured in pz5, always with low values of the spring water type, are also consistent with this scheme. The pz5 was drilled close to F5 down to a depth of 15 m, with a sealed casing over the first two meters, thus a priori only intersecting the mobile regolith–saprock level. In the core from F5 below these depths and particularly below 20 m, the bedrock is characterized by low porosity and permeability measurements, apart in the close vicinity of fracture zones, suggesting a different water circulation scheme in the fractured bedrock zone, as detailed in Section 5.3. Therefore, based on these different observations, the entire saprolite–saprock system can be interpreted as representing the watershed’s shallow aquifer in the Strengbach critical zone observatory.
Field data show a thickening of the saprolite-mobile saprock system along the north-facing slope of the watershed and an a priori thinner thickness on the south-facing slope, at least in the vicinity of F7 and F8. Assimilation of this zone to the subsurface aquifer would, therefore, imply similar characteristics for the aquifer, which hydrogeochemical data confirmed. Pz3, set up at the mid-slope of the north-facing slope, is located in a thinner saprolite–saprock zone than F5. Sealed over its first two meters, pz3 collects water flowing between 2 and 14 m depths. The conductivity profiles show low values (≈30 μS/cm) of spring water-type up to ≈10 m depth and more conductive water deeper down. This suggests that this piezometer might intercept the deep circulation system in its lower part. The electrical conductivity profiles carried out after pumping in the piezometer pz3 confirm this characteristic as they show a fracture-type water inlet at 11–12 m depth (Figure 6). Borehole F1b is drilled further up the slope where the mobile regolith is thinner than in pz3 and is watertight over its first 8 m depth, i.e., over the entire zone of mobile regolith and saprock section of the core (Figure 3). Therefore, this well would only drain water circulating in the fractured bedrock. The higher water conductivities in F1b (≈50 μS/cm or above) than in spring water and piezometers (20–30 μS/cm) certainly validate that the waters in F1b are not part of the shallow circulation system but of one with a deeper circulation. The observation of low porosity and permeability in samples from F1b (Figure 4) is consistent with this pattern since the samples used for these analyses were taken at depths of 2 m and more, thus essentially outside the shallow aquifer, explaining their low porosity and permeability values.
On the south-facing hillside, the casing equipment of F6 and F8 (see Supplementary Section 1) only allows for sampling waters below the saprock. Only pz7, sealed over the first 2 m depth, allows for surface water sampling. Low water conductivity measurements in pz7, similar to the conductivity of water from other piezometers and spring water, indicate that this well is mainly supplied by shallow subsurface water. The flow rate through this well seems much lower than in pz3 and pz5, based on the very rapid emptying of the well compared to the other two during pumping operations. This would imply a relatively weak circulation for the saprolite not occluded by the casing, consistent with the suggestion that on this hillside, at least at the location of F7 and F8, the saprock’s vertical extension is lower than on the opposite slope. Such a configuration would also imply that F7, uncased between 8 m and 18 m depth, is not supplied by surface water, as confirmed by the absence of any low conductivity water level measurement in this well, unlike F5.
All these observations confirm a pattern of meteoric water flow in a shallow aquifer, formed by mobile saprolite and saprock, with reasonably strong lateral variability in aquifer thickness at the watershed level. A more accurate geometry of the subsurface aquifer at the watershed scale will certainly be necessary to model hydrological flows at this scale. This will undoubtedly be achieved through geophysical investigation methods. Our results are interesting in providing a relatively simple and sound scheme for the vertical structure of the subsurface aquifer for the Strengbach watershed. This scheme implicitly assumes or confirms that the saprock level marked by subhorizontal open fractures certainly represents the propagation zone of the surface weathering front in the bedrock and thus marks the lower limit of the shallow aquifer of the Strengbach watershed.
5.2. Spatial variation of the surface aquifer thickness
Our data suggest a difference in the regolith thickness depending on slope orientation, as well as along the north-facing slope. Watersheds under geomorphological equilibrium or steady-state forcing conditions usually have greater mobile regolith thicknesses near the summit than in the talweg [Rempe & Dietrich 2014]. This was not observed on the north-facing slope and may suggest that the watershed is far from equilibrium. The Lidar Digital Terrain Model (DTM) of the Strengbach watershed (Figure 2) and, especially, the derived slope map highlight the recent V-shaped stream carving of the valley bottom, incising the gentler slopes of the upper parts of the catchment. The well-defined slope breaks surrounding the deepest part of the valley suggest a regressive erosion of the Strengbach stream and that the watershed is not in a geomorphological steady state but on the way to re-equilibration. 10Be data validate such an interpretation [Ackerer et al. 2022]. This interpretation implies that the watershed can be subdivided into two sub-zones. First, a zone above the knickpoint, preserving the topography inherited from erosion processes that occurred during the last glacial maximum and stabilized afterward. Second, a zone of active erosion below the slope break where the V-valley morphology is observed. Upstream and west of the system, where pits and boreholes F1–F5 are located, the watershed is a large valley with gentle slopes (8–9°) with little headward erosion. Downstream and further north, primarily where F7 and F8 are located, the valley is narrower with steeper slopes (15–16°) in response to stream carving. Based on these different observations, we propose to explain the differences in slope geometry and structure between the two hillsides by different erosion rates or processes between the two watershed slopes based on the fact that the Strengbach watershed area has not yet reached a geomorphological steady state.
5.3. Deep water circulations and spatial variations of water conductivity
The loggings in the fractured bedrock below the saprock horizon, especially those after pumping stimulations, identify specific and well-localized water inflows along the cores. When comparing the location of the water inflows to the description of the available cores (F1–F5–F6) or wall images, they are found to be systematically associated with or close to well-identified fracture zones or discontinuities (Table 1). These data, therefore, identify in the deep part of the bedrock a specific water circulation in the macroscopic fracture zones riddling the bedrock. Nevertheless, at this stage, it is not possible to eliminate a matrix circulation in the deep zone outside the macroscopic fracture zones. If such a matrix circulation exists, our data point out, however, that it would be much weaker than the circulations in the fracture network and undetectable based on the measurements presented in this work.
Our data also suggest a systematic variation of deep-water conductivity with water circulation depth in granitic bedrock. In F7 and F8, cored on the south-facing slope and only collecting water circulating in the fractured granitic bedrock, an increase with depth of water conductivity (150–205 μS/cm in F7 and 170–200 μS/cm in F8) was observed. Such a systematic variation can suggest that flow paths or water travel times are longer when water circulates deeper in the bedrock. On the north-facing slope, F1b and F5, also drilled in the granitic bedrock, are open along their whole length except the upper 8 m. The equilibrium conductivity profiles of F5 imply feeding by a highly conductive deep water (Figure 6). Pumping experiments in F5 suggest circulation levels at ≈23 and ≈32 m depth (Figure 7), with intermediate conductivities between those of deep water and surface water, even if it is difficult to precisely characterize them. In F1b, for periods assumed to be free of pollution problems (details in Supplementary Section 4), two or three circulation levels with different and increasing conductivities from surface to depth can also be considered. Thus, these data follow the logic observed on the opposite slope, indicating that for the entire granitic basin, the deeper the fractures, the longer the path and/or the longer the water transit time in the fractures. With that kind of scheme, the lower water conductivities in F1b compared to the deep water in F5 would indicate that borehole F1b at the top of the slope is supplied with water of relatively short transit times compared to the F5 deep-water borehole. This would be logical in a context fed with local water, i.e., waters simply percolating from the catchment area and not imported by subsurface flow from farther areas. Only the water from borehole F6, cored at the top of the south-facing slope and mainly fed by a fracture at 63 m depth, does not follow the above pattern. Deep water in F6 is more conductive than that in F7 and F8, located further down the slope. It is tempting to link this difference to the lithological variability of the watershed, particularly as F6 intersects a significant thickness of gneiss, unlike the other wells in the watershed. Nevertheless, it cannot be excluded that this well, marked by a vast cataclase zone, could drain water from outside the watershed, unlike the other wells, even if the hydrogeochemical modeling of the deep water does not support such a scenario [Ackerer et al. 2021].
Global water fluxes transiting through deep circulations cannot be quantified on the basis of our data. However, qualitative information can be derived from the partial emptying experiments of F5 (Figure 8). An extension of the low conductivity level toward the lower part of the water column during the borehole emptying, whatever the pumping depth, indicates that systematically, the water produced by the deep horizon was preferentially abstracted during pumping and was not renewed at a rate corresponding to that of the pumping. This suggests that the production of more mineralized water from the deeper part of the well is low and that pumping induces the invasion of bottom-holes by less mineralized waters from shallower horizons. Such an observation is easily explained in the context of surface circulation marked by more intense water fluxes than in deep-water circulation systems. Similarly, the fact that it took a few days to bring the disturbed chemical profiles to an equilibrium profile, marked by a high electrical conductivity level rising to its pre-pumping level, indicates a lower intensity of the deeper water circulation than the subsurface one. A low circulation intensity in the deep fracture zones compared with the surface circulation is also consistent with the difficulty of detecting these flows by flowmetry for all wells. These methods could only identify a flow in the fractured zone associated with cataclastic textures in F6 at a depth of 63 m by identifying a low and not quantifiable intensity flow just slightly above the background noise of the flowmeter. Based on these data, we propose a circulation in the deep bedrock mainly through the fracture network that structures it, with lower intensities (this study) and much slower circulation times [Ranchoux et al. 2021; Ackerer et al. 2021] than those estimated for waters in subsurface aquifers. Our data show that the fracture network is developed along regional tectonic orientations inherited from the region’s geologic history. Thus, it corresponds to a pre-existing fracture network, partially reopened. These results highlight the need to consider the inherited geological structures to understand the water circulation pathways in the deep CZ and, more generally, the structure and functioning of the CZ. The data also question the cause of the fracture opening. Is it an opening of clogged fractures that progressively propagate via the action of water infiltrating them? Or an opening prior to the circulations that secondarily offer a path to the shallower waters infiltrating them? Our data are inconclusive, but the hypothesis of a reopening of the fractures in response to rock decompression during the development of the Tertiary and Quaternary Vosges reliefs, or simply in connection with erosion processes, is entirely conceivable. In such a scenario, the vertical extension of these open fractures and thus of the deep circulations they control in the bedrock could be much larger than the few tens of meters investigated by the boreholes. It may imply a water outlet much further downstream in the valley than the Strengbach CZO outlet. Independent of this point, our data also question the significance of this deep water with respect to the critical zone: is the deep water still influenced by surface circulations and therefore does it still belong to the critical zone? Or is ancient water that is decoupled from current surface processes and/or has another origin (marine, glacial …) as seen in deep hard rocks [Sanjuan et al. 2016; Négrel et al. 2001, 2018] or in more shallow waters as observed in the Armorican massif for instance [Aquilina et al. 2015]. In the case of the Strengbach deep waters, our results and interpretation suggest that deep waters are fed by waters simply percolating from the catchment area. Water dating using CFC methods [Ranchoux et al. 2021] shows ancient ages for the Strengbach borehole deep waters. However, these initial results do not allow us to choose between a pattern of ancient waters disconnected from surface waters and a pattern of mixing between ancient waters and present-day surface waters. Further investigations are needed to constrain the precise degree of connectivity of the deep waters with the surface waters, and therefore whether they should be considered as belonging to the critical zone or not.
6. Conclusion
This study integrates geological, petrophysical, and hydrogeological information from six 50–120 m-depth boreholes, complemented by three 15 m-depth piezometers drilled at the Strengbach Observatory site. The observation of the boreholes, in addition to the analysis of cores recovered for three of the six deep boreholes, renders the first detailed picture of the structure/architecture of the first ≈100 m of the CZ at the scale of the Strengbach CZO. The main features of hydrogeological functioning are characterized, and a simple conceptual model of water circulation can be proposed. It includes shallow water circulation within an aquifer corresponding to the geomorphological mobile saprolite horizon and the upper part of the saprock. This shallow circulation superimposes a deeper circulation in the fractured bedrock via the fracture networks riddling this horizon. The data show that the vertical extension of the saprolite and saprock horizons, and thus of the shallow aquifer, differs for the two hillsides. We propose to relate these differences to an evolving erosion regime between the upstream and downstream portions on each side of a knickpoint in the main stream bed. The data also show that a deep bedrock level without evidence of water circulation is never reached even below 100 m depth. They also provide evidence that deep water circulations in the fractured bedrock horizon are controlled by fractures of regional orientation inherited from the geological history of the Vosges massif, integrating the Hercynian orogeny and the Tertiary and Quaternary tectonics. All these results show the importance of accounting for the geological heritage of the rocks. Correctly modeling the hydrogeochemical functioning of the CZ at the scale of a watershed requires an understanding of the bedrock emplacement’s long-term geological history. It is also necessary to consider in detail the more recent history of the Quaternary erosion and alteration, incorporating it into the overall view of the system.
Declaration of interests
The authors do not work for, advise, own shares in, or receive funds from any organization that could benefit from this article, and have declared no affiliations other than their research organizations.
Acknowledgments
The authors warmly thank the Guest Editors, especially Valérie Plagnes, for their advices and suggestions, which greatly helped to improve the article. They also thank the three anonymous reviewers for their constructive comments and suggestions. This study was financially supported by the French ANR program under grant agreement ANR-15-CE06-0014 (Project CANTARE-Alsace). Core drillings were funded by the REALISE program (CPER Etat Alsace 2003–2014) along with a funding contribution from INSU-CNRS and another one from the French Equipex program CRITEX. The contributions of the two OHGE responsables (M. C. Pierret and S. Cotel) are acknowledged.
Vous devez vous connecter pour continuer.
S'authentifier