

 CC-BY 4.0
1. Introduction
Streamflow data provide information on water availability across time and space and constitute the main source of information used in hydrological studies such as water resource planning and management [WMO 2010], hydroelectric energy generation [Stickler et al. 2013], flood forecasting and control [MoussaBocquillon 2009], and understanding the hydrological cycle from a global perspective [Huntington 2006].
Population centers in the Amazon basin are located along the main river channels, where water is used for both consumptive purposes and transport of people and consumer goods. In this region, the modeling of hydrological systems focused on understanding the occurrence of extreme events is essential for mitigating the related negative impacts [Collischonn et al. 2007; Getirana et al. 2009; Guimberteau et al. 2012; Paiva et al. 2011; Yamazaki et al. 2011].
Discharge series provide key information for calibrating and validating these hydrological models at several scales, and they are pivotal to understanding the impacts caused by both local changes in land cover and climate change on a larger scale [Mahmoud et al. 2009; Peña-Arancibia et al. 2015].
Historically, the most common method used to obtain a continuous discharge data series is the conversion of a water stage data series via the application of a curve that describes the relationship between the stage and the discharge in a specific cross section of the river. This approach is called the “discharge rating” or “rating curve” method [WMO 2010].
The process typically consists of fitting a parametric function such as Q(t) = a(h(t) − h0)c, where Q(t) represents the discharge at time t, h(t) is the concurrent water level, h0 is the water level corresponding to zero flow, and a and c are coefficients related to cross-sectional characteristics and are calibrated for each specific station [Rantz 1982]. Using this approximation is essential since the discharge field measurements are complex and expensive, and in most cases, they remain impracticable for continuous monitoring [Durand et al. 2016; Muste et al. 2011].
However, for this approximation to be valid, certain hydraulic conditions must be observed such as permanent flow and stable channel. Ideally, the stream gauge must be installed in a channel where there is a feature at the downstream section that forces the flow through a critical depth such as a rock riffle or artificially constructed weir. The downstream section feature “controls” the flow, creating a unique relationship between the stage and the discharge [Holmes et al. 2016]. These conditions, however, are not always feasible in the Amazon basin. In this poorly inhabited basin, the choice of gauge sites depends first on the proximity of inhabitants who can perform the hydrological observations.
Thus, gauges are frequently installed next to the confluence of large rivers, where an ambiguous relationship can occur between the stage and the discharge, under a backwater effect induced by changes in downstream water levels [Mansanarez et al. 2016; WMO 2010]. In large Amazon rivers, even in the main channel several kilometers from the mouth, this backwater effect also exists and can be caused by water changes between the main channel and the floodplains [Meade et al. 1991]. In hydraulic terms, this variable backwater affects the flow energy line and renders it non-parallel to the channel bottom. Thus, it must be considered as a complementary variable when estimating discharge [Jaccon and Cudo 1989].
The stage–fall–discharge method and the constant-fall method are the most commonly applied approaches for stage–discharge relations affected by variable backwater [ISO 9123 2001]. Their application requires the consideration of the slope of the energy line in the stretch, which is estimated by the difference between the water levels at the main station and at an auxiliary station located on the same river [ISO 9123 2001; Petersen-Øverleir and Reitan 2009].
These processes are supported by the method in Hall [1916], which is based on the Chezy–Manning equation. Specifically, the “real” discharge Qr has been proposed, which considers the backwater effect, and it can be calculated as , where Qn is the “reference discharge”, Sr is the “real” slope, and Sn is the “normal” slope of the energy line.
Overview maps of the Solimões catchment and the Solimões River between the Manacapuru and Careiro stations. Elaborated by authors. Source of the satellite image: Google Earth.
The application of these methods can produce acceptable discharge estimates for flows experiencing a backwater effect. Nevertheless, there is an additional factor that must be considered when determining an accurate discharge series: the variation in roughness along the channel [Mansanarez et al. 2016].
In natural channels, resistive forces exerted by the banks and bed over the flow can vary as the water level changes. The resistance caused by friction from deeper flows can be less expressive than that from shallow flows [Pan et al. 2016]. However, when the flow reaches the floodplain, which is common in the Amazon plain [Rudorff et al. 2014], the resistive forces exerted by more densely vegetated surfaces can represent an increase in the roughness for that water level. Therefore, in situations where these variations are significant, it is important to consider their effects when calculating discharge [Le Coz et al. 2014].
Although the Manning equation was adapted from the Chezy equation with the aim of forcing the roughness coefficient to be constant in a specific section, several studies reported that for natural courses, the roughness coefficient varies as a function of the water level [Dingman 2009; Ferguson 2010; Le Coz et al. 2014; Pan et al. 2016]. Therefore, based on the knowledge of the slope of the energy line and the relationship between the roughness coefficient and the water level, it is possible to estimate the discharge using the Manning equation while still considering the effects of both the variable roughness and the backwater.
The aim of this work was to generate an accurate daily discharge data series for the Solimões River, which experiences flow under the backwater effect. Variations in the energy slope and the roughness of the channel had to be considered in the computations. Thus, it was necessary to establish the relationship between each Manning equation parameter and the water level in the channel.
2. Materials and methods
2.1. Study area
The proposed method for computing streamflow was tested for the Manacapuru station (Code 14100000). The Manacapuru station is located on the Amazon plain, 80 km upstream from the confluence with the Negro River. It is the most downstream station of the Solimões River. This confluence marks the start of the Amazonas River. The Manacapuru station represents a drainage basin of approximately 2.2 million km2 or 36% of the total Amazon basin area (Figure 1).
Cross-sectional profile of the Manacapuru station obtained from acoustic discharge measurements performed in June 2015 (2077 cm stage).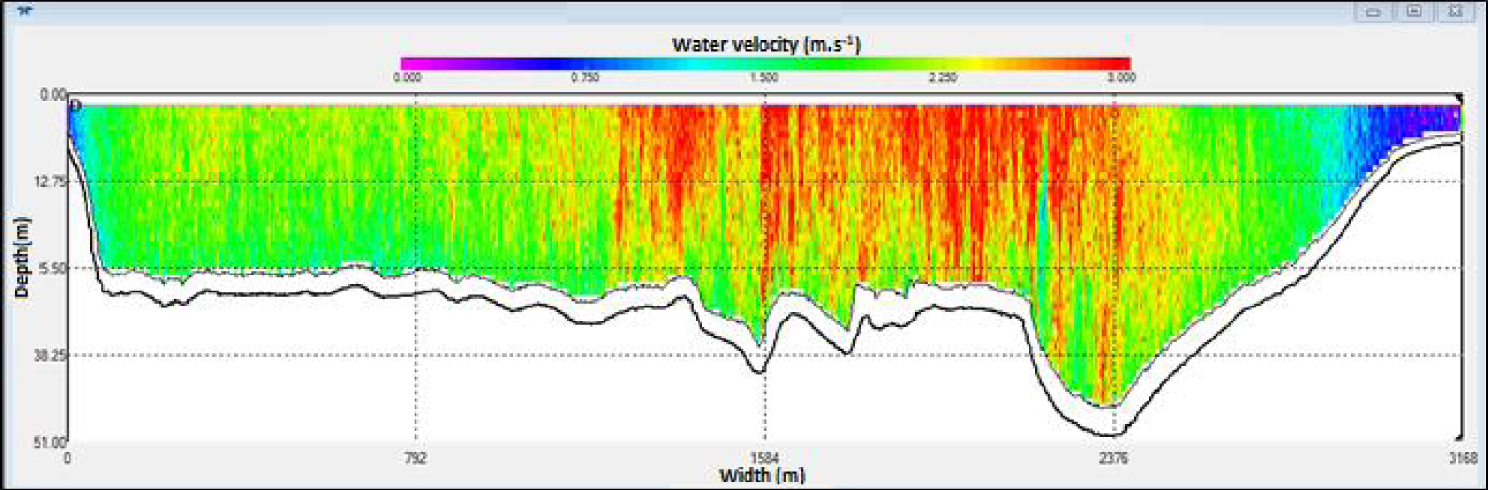
In this Amazon plain region, the flow dynamics of big rivers induce an important effect of backwater, which can be observed several kilometers from the river mouths. This effect is a result of the seasonal storage of water on floodplains and is associated with timing differences in tributary inflow [Meade et al. 1991; Trigg et al. 2009].
The downstream backwater effect on the Manacapuru station affects the relationship between the stage and the discharge in this station, and a unique rating curve is not able to accurately calculate the discharge data series [Jaccon 1986]. In hydraulic terms, the downstream backwater effect can be quantified as the variation in the dimensionless hydrostatic pressure gradient [Tsai 2005].
2.2. Modeling methods and data
To consider the downstream backwater effect in the discharge calculation, we propose to estimate the discharge by the Manning equation:
| (1) |
The variation in the hydrostatic pressure gradient over time was represented by the variation in the “energy slope” parameter of the Manning equation. The other parameters of the Manning equation were established as a function of the water level, which is explained in Section 3. Then, the Manning equation was applied to the daily stage series to generate the discharge data series.
The geometric parameters of (1) (the area A and hydraulic radius Rh parameters) were estimated as functions of the water level based on a cross-sectional profile obtained from an acoustic profiler discharge measurement performed in high waters (Figure 2). The established profile could be used to simulate the geometric parameters at every daily water level.
The “slope of the energy line” parameter was estimated as the “water-surface slope” between the Manacapuru and an auxiliary station. This estimate assumed that variations in the velocity head are negligible in the stretch and the flow gradually varies. The auxiliary station was the Careiro station (Code 14040000), which is located 90 km downstream from the Manacapuru station at a branch of the Amazonas River. The water levels of the Careiro station were corrected to the Manacapuru datum based on information provided by Moreira et al. [2010]. The water-surface slope was calculated as the difference between the Manacapuru and Careiro water levels divided by the distance between the two stations (Figure 1).
To establish the relationship between the Manning roughness coefficient n and the water level, we used discharge field measurement data and the corresponding water level. With the discharge value available and all the other parameters of the Manning equation calculated for the associated water level, the Manning roughness coefficient n was computed by inverting (1). Then, for each measurement, we obtained the n coefficient, which was plotted with the corresponding water level, and fitted the equation that best described the relationship. With the relationship established, the roughness coefficient could be inversely estimated for daily data at each water level.
Then, all the parameters of the Manning equation were calculated as a function of daily water levels, and the equation was applied to generate a daily discharge data series. The software Hydraccess [Vauchel 2005] was used to facilitate the estimation and calculation of the Manning parameters.
The water stage, discharge measurements, and daily discharge series generated by traditional rating curves were obtained from Brazilian National Water Agency (ANA) databases (available at http://www.snirh.gov.br/hidroweb). For the present analyses, only the discharge measurements collected using acoustic equipment were considered because previous results indicated that the method by which the measurements are performed significantly affects the relationship between the water level and the discharge at the Manacapuru station. The statistical analyses and the comparison of hydrographs that supported these findings are described in Alves et al. [2017b].
Relationship between the stage (cm) and discharge measurements (m3⋅s−1) at the Manacapuru station. Data are discretized by the average velocity.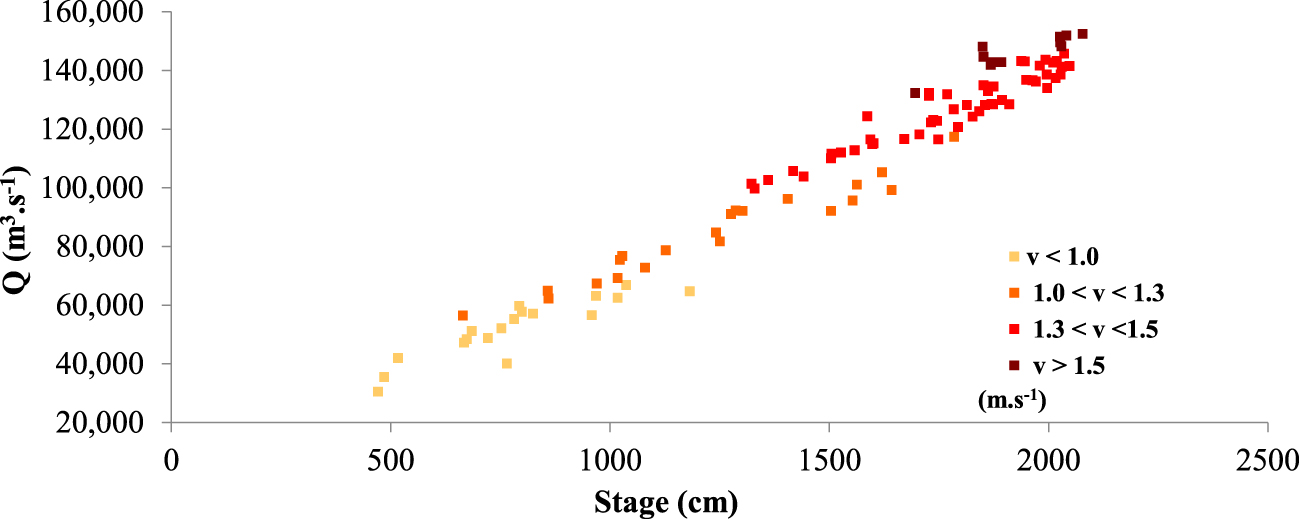
Usually, discharge field measurements were performed once every 4 months in the Amazon basin. For this study, we complemented the traditional database with information from two projects by the Geological Survey of Brazil (SGB), “Sistemas de Alerta Hidrológico” and “Dinâmica Fluvial do Sistema Negro-Solimões-Amazonas”, which are supported by the SGB and the ANA (i.e., the Brazilian National Water Agency). In these contexts, discharge measurements were performed every month for 8 years (from 2009 to 2016) using acoustic Doppler current profilers (ADCPs) at 300 or 600 kHz coupled to Global Positioning System (GPS) equipment on a large vessel. An example of an ADCP measurement result is shown in Figure 2. The use of GPS was important because this station presents a moving bed during certain periods of the year, which can make it difficult to obtain the position by the bottom tracking of ADCP [Mueller et al. 2009]. This complemented database generated an unprecedented amount of detailed information for the Amazon river.
The 85 discharge measurements available varied between 30 500 and 163 300 m3⋅s−1, with an average of 107 889 ± 33 893 m3⋅s−1 (average ± standard deviation). They were obtained between the stages of 4.71 and 20.77 m, which basically encompass the entire range of stages observed in the historical series of the Manacapuru station. From the 16 245 daily stage data points available in the Manacapuru series, only 15 (0.09%) were lower than the minimum measurement stage and only 1 (0.01%) was higher than the stage observed for the maximum discharge measurement.
2.3. Model evaluation
The proposed methodology for discharge estimates was evaluated by analyzing statistical indexes that are typically used in hydrological modeling, that is, the mean absolute error (MAE) (2), the root mean square error (RMSE) (3), and the Nash–Sutcliffe efficiency (NSE) index (3) [Moriasi et al. 2007].
| (2) |
| (3) |
| (4) |
Monthly box plots of the slopes of the surface lines for the complete water level series from Manacapuru and Careiro stations (1977–2016). The dashed line represents the average slope value. Upper and lower vertical line extremes indicate the maximum and minimum values, respectively, and box boundaries represent first and third quarters.
3. Results
The relationship between the discharge field measurements and stages is presented in Figure 3. Data are discretized by color as a function of the average velocity (measured discharge divided by section area) obtained in the measurements. As can be observed in the figure, the relationship between discharge and stage is not unique along the total range of observed data.
For example, at an intermediary stage of 16.00 m, the discharge data varied between 99 160 and 124 300 m3⋅s−1, presenting a difference of 25% in the discharge values. For lower stages, dispersion also occurs. The discharge associated with a stage of 7.65 m (40 000 m3⋅s−1) was 31% lower than the discharge measured for a stage of 6.65 m (56 439 m3⋅s−1). The full dispersion of stage–discharge along the plot seems to indicate that the backwater effect is active at all stages of variation observed in the database.
Analyzing the different patterns of average velocities shows that the dispersion between points is caused by different flow velocities associated with a determined stage value. For example, for the same discharge of 100 000 m3⋅s−1, the velocity varies between 1.15 and 1.34 m⋅s−1 and is associated with stages between 16.42 and 13.23 m (Figure 3).
In hydraulic terms, these different velocity patterns can be explained by the variation in the slope of the energy line of the flow, which is induced by the variable backwater effect. In this case, the flow is controlled by the downstream level.
3.1. Slope of the energy line
The variation in the slope of the energy line was estimated as the variation in the water-surface slope between the Manacapuru and Careiro stations. This variation was visible throughout the year, mainly between August and March (Figure 4).
For the months of April, May, and June, that is, the period when the maximum stages occur at Solimões River, the variability of the slope (shown by the height of the box plots) is notably lower than that observed in other months. However, the water-surface slope is shown to be higher in magnitude in these months than the annual average. From August to October, the slopes reach the minimum values (with a higher variability), and between November and January, they tend to increase in magnitude.
Variations in the water-surface slope along this stretch are mainly caused by the storage effect of floodplains, which is present in a major part of the Solimões and Amazonas systems [Meade et al. 1991; Rudorff et al. 2014]. When the flow affluent to the Manacapuru station starts to decrease at the end of the full period, which occurs between June and July, the water level at this station also starts to decrease. As the water level in the channel falls, the water that was stored in the floodplains during the full period starts to return to the channel. Then, the water level at the downstream station is reduced by a lower rate than that at the Manacapuru station, thus causing a softer downstream recession curve [Alsdorf et al. 2000].
Figure 5 presents the stage records observed at Manacapuru and Careiro stations in 2015 (the year when the maximum stage occurred at the Manacapuru station) to illustrate this process. From August, when the downstream level falls at a smaller rate relative to the upstream station, the water-surface slope tends to be reduced as seen in the figure.
Stage (cm) and slope (m⋅m−1) variations in 2015. Careiro stages converted to Manacapuru datum based on data provided by Moreira et al. [2010].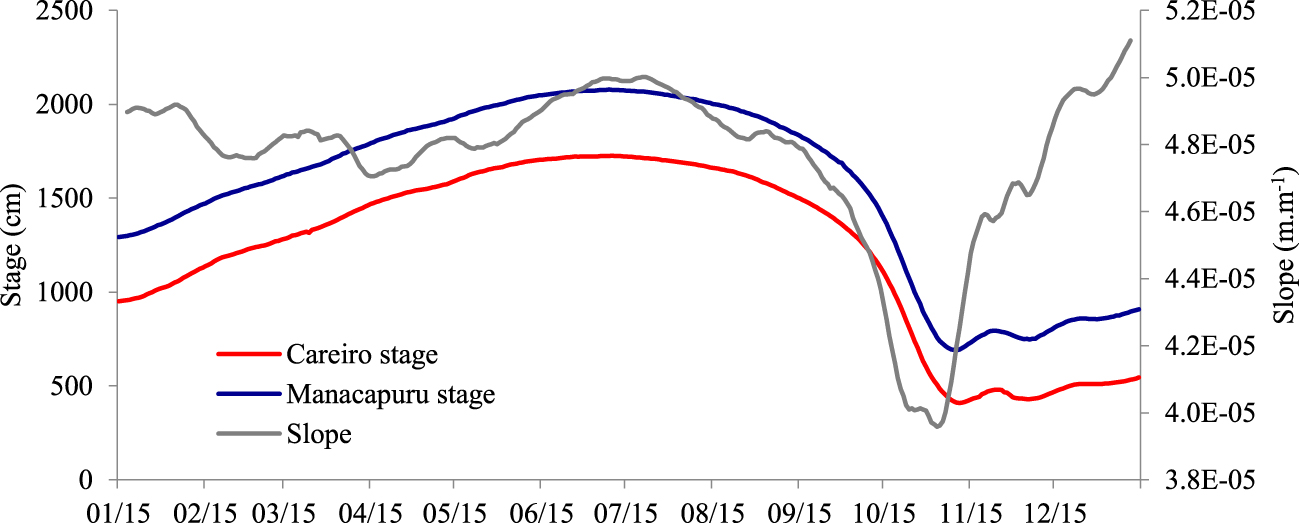
An inverse pattern is observed when the flow affluent to the Manacapuru station begins to increase. The water level increases in the main channel, and the water starts to flow from the channel to the floodplains. The water that overflows to the floodplains delays the rate at which the downstream level increases. In this case, the water-surface slope starts to increase. In Figure 5, this process starts between October and November. In Figure 4, the process can be observed from the end of October to December.
Changes in slope magnitude are associated with the rising and falling processes of the river, and the monthly variation in the slope (illustrated by the height of box plots in Figure 4) can be explained based on the time when the inversion of rising and falling limbs occurs.
For the rising limb, the maximum annual stages occurred in June and July in the Manacapuru station in 97% of the years in the database. Therefore, in May, June, and July in almost all the years, the rivers and the floodplains are full and the slope magnitudes are always similar. This results in an almost constant value of the water-surface slope of approximately 4.4 × 10⁻⁵ m⋅m−1 in the stretch.
Area and hydraulic radius of the Manacapuru section calculated as a function of the water level.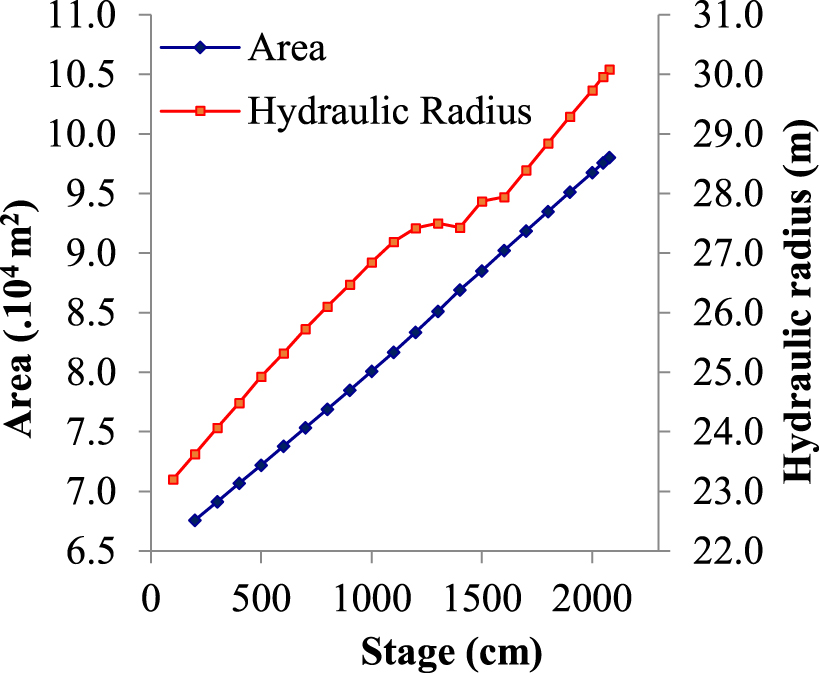
For the falling limb, the minimum annual stage has been recorded between the months of October and January. For these months, depending on when the processes have changed, the slopes can be characteristic of the rising or falling limbs and vary between 3.0 and 5.0 × 10⁻⁵ m⋅m−1.
It is worth noting that the changes between the channel and floodplains occur not only by the river overflowing its banks but also via breaks in the lateral levees in the Amazon system [Rudorff et al. 2014; Trigg et al. 2012]. Therefore, the processes of filling and draining of floodplains take place even before the occurrence of the bankfull level, and such dynamics impact the whole level range throughout the year.
Manning roughness coefficients (s⋅m−1∕3) estimated for each field discharge measurement as a function of the measured water level (cm).
The effects of floodplain storage on the slope variability and, consequently, on the stage–discharge relationship have already been investigated by Meade et al. [1991] for several stations along the Solimões River. However, these authors did not have access to data to correct water levels to a unique datum. Thus, they recommended discretizing the stage–discharge data in rising and falling periods to improve the discharge estimates. The present results indicate that rising/falling discretization is not clear for this station and the consideration of slope parameters is paramount to obtaining an accurate data series for the Manacapuru station.
3.2. Geometric parameters
The relationships between the wetted area and hydraulic radius parameters and water level are presented in Figure 6. The relationship between the wetted area and the water level presents a unique trend and is approximately linear throughout the whole range of stage variations. For the hydraulic radius, however, a break can be observed as the right bank becomes flatter next to the 13.00 m stage (see Figure 2). For this flat region, a small increase in water level causes a large increase in the wetted perimeter and a small increase in the wetted area. The hydraulic radius can thus decrease even under a rising water level.
3.3. Manning roughness coefficient
The estimated Manning coefficient varied between 0.035 and 0.063 s⋅m−1∕3 with an average of 0.045 ± 0.004 s⋅m−1∕3 (average ± standard deviation) as presented in Figure 7. The plot of the Manning roughness coefficient and the water level shows that they are inversely related for low and medium stages (Figure 7). This pattern has been already observed in several other studies [Dingman 2009; Ferguson 2010].
The inverse relationship can be explained by the variation in the impact exerted by the resistive forces of the bed and bank friction in natural channel flow [Mansanarez et al. 2016]. For a shallow flow, the impact of the resistive forces exerted by the riverbed is great, resulting in high values of the Manning coefficient. For a deeper flow, this impact is softer; thus, the Manning coefficient decreases.
Such a relationship is also observed from a wider point of view when comparing the roughness coefficients estimated for different water courses of variable magnitude [Ferguson 2010]. By analyzing a compilation of published data in which discharges varied from 0.02 to 3000.00 m3⋅s−1, Ferguson [2010] observed a significantly inverse correlation between n and discharge for several of the analyzed water courses. In their analysis, however, they excluded data where the flow overtopped the bank and was affected by the floodplain vegetation.
When considering the flow over the floodplain, the Manning roughness coefficient–stage relationship is modified and can tend asymptotically toward a constant value [Domeneghetti et al. 2012; Ferguson 2010; Moramarco and Singh 2010]. In the floodplain, which is more densely vegetated, the roughness and Manning coefficients can be higher than those in the main channel, and they increase as the flow progresses toward the plain. For the Manacapuru section, the floodplain and the higher parts of the banks present denser vegetation (grass and large trees with exposed roots; see Figure 8). Therefore, trends in the coefficients for the section as a whole depend on the effects of the roughness variations in the floodplains relative to the variations in the main channel [Le Coz et al. 2014].
Images from the left bank of the Manacapuru section. (a) Image taken on 08/27/2017 at the 1580 cm stage illustrating the density of exposed tree roots, which affects the surface roughness. (b) Image taken on 07/27/2017 at the 1857 cm stage when the roots were flooded, thus highlighting the considerable presence of grasses on the banks.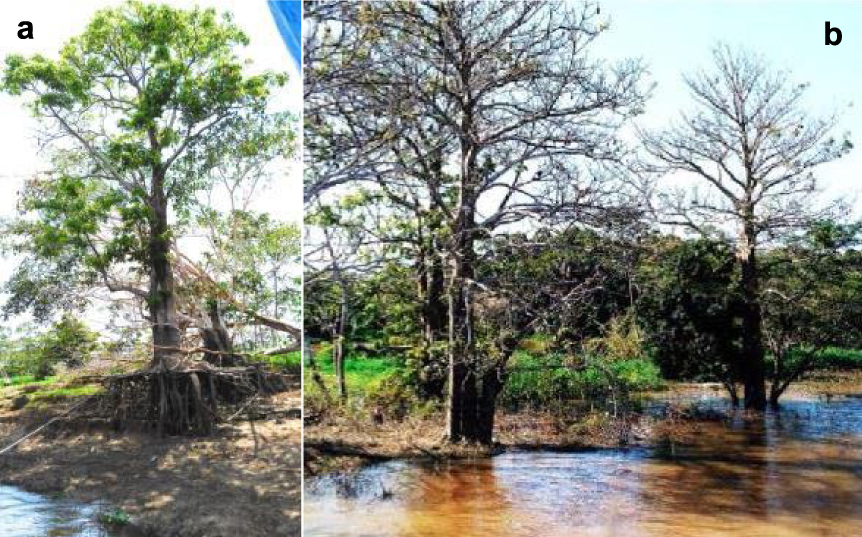
Hydrographs obtained by applying the Manning equation (ME) and rating curve (RC) methodologies and field measurements. Bars represent the uncertainty of discharge measurements (±5.3%) for a 95% confidence interval [ISO 748 1997].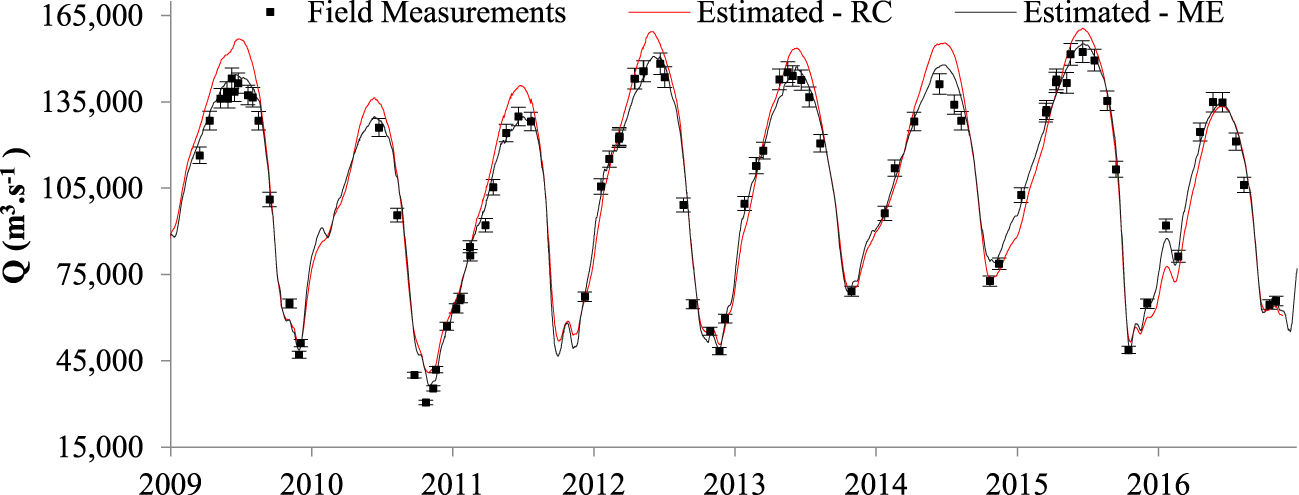
In this work, the function that best fitted the relationship between the roughness coefficient and the water level at the Manacapuru station was a quadratic polynomial with an inflection point near the 17.00 m stage. Researchers studying this relationship for other sections have observed similar results [Le Coz et al. 2014; Pan et al. 2016].
It is worth noting that although the Manning coefficient is a physical parameter related to bed and bank roughness, it has been used as a calibration coefficient in a substantial number of hydraulic and hydrological models. In such cases, the observed values are not always physically interpretable or justifiable [Di Baldassarre et al. 2010]. In the present work, these coefficients were obtained by the direct application of the Manning equation using field discharge measurements performed using the best available technology at this site (ADCP equipment associated with GPS). In fact, the magnitude of the roughness coefficients that was obtained was within the range recommended by the classical literature [Chow 1959]. Therefore, the presented results can be used as reference coefficients for related future studies at this station.
3.4. Discharge calculation
Once all the relationships between the Manning parameters and water levels were established, it was possible to apply this equation to daily stage data, thereby enabling the generation of the daily discharge data series. Hydrographs obtained by applying the Manning equation as well as the data generated by using simple rating curves and discharge field measurements are presented in Figure 9. The results of the model evaluation indexes for discharge estimations are presented in Table 1.
Model evaluation indexes: mean absolute error (MAE), root mean square error (RMSE), and Nash–Sutcliffe efficiency (NSE) for both methodologies (RC—rating curve and ME—Manning equation). The “observed values” are relative to discharge field measurements
| MAE (m3⋅s−1) | RMSE (m3⋅s−1) | NSE | |
|---|---|---|---|
| RC | 7293 | 8597 | 0.94 |
| ME | 3806 | 5297 | 0.98 |
Maximum annual discharge obtained by both methodologies (RC—rating curve and ME—Manning equation)
| Maximum annual discharge (m3⋅s−1) | |||
|---|---|---|---|
| Year | RC | ME | Difference |
| 2009 | 160 615 | 143 900 | 16 715 |
| 2010 | 137 967 | 131 300 | 6 667 |
| 2011 | 142 567 | 131 200 | 11 367 |
| 2012 | 163 467 | 150 300 | 13 167 |
| 2013 | 156 932 | 147 000 | 9 932 |
| 2014 | 158 953 | 147 500 | 11 453 |
| 2015 | 164 780 | 154 100 | 10 680 |
| 2016 | 134 695 | 136 000 | −1 305 |
| Average | 9 834 | ||
An analysis of the statistical indexes shows that both methods can be considered adequate to estimate the discharge at the Manacapuru station. Considering that the average measured discharge is 110 014 m3⋅s−1, the values of both the MAE and the RMSE errors are lower than 10% of the average discharge. For the NSE index, values closer to 1 indicate that the two methods are acceptable for estimating discharge.
In a comparative analysis, estimating discharges using the Manning equation led to better results in terms of the MAE, RMSE, and NSE. The hydrographs presented in Figure 9 support the results of the evaluation indexes, indicating that the main differences are related to the maximum discharge estimates. In the upper peaks, the results obtained by the Manning equation seem to have a better fit to the discharge measurements than the rating curve, which overestimates the maximum peak discharges.
Table 2 presents the maximum annual discharge obtained by each methodology. The differences can reach approximately 17 000 m3⋅s−1 such as for 2009. On average, the differences between the annual discharges estimated by the different methods are approximately 10 000 m3⋅s−1.
For hydrological modeling, this magnitude of variation could be reasonable because the differences for both methodologies are approximately 10% of the average discharge. However, it is of paramount importance to note that this work focuses on the generation of an accurate discharge database that can be used to calibrate and validate several kinds of other models.
As an example of the broad application of this database, discharge data series of the Manacapuru station were used to estimate the solid discharge of the Amazonas River to the ocean [Park and Latrubesse 2014], create a multidecadal hydrological retrospective [Correa et al. 2017], and forecast streamflow [Paiva et al. 2013]. Thus, it is essential for the discharge series to be as accurate as possible.
4. Discussion
Applying the Manning equation has two main advantages relative to the traditional rating curve. Each parameter is considered separately, which allows for a consideration of variations, and the energy slope is included in the computations.
For example, the discontinuity of the “stage–hydraulic radius” curve is not considered in the rating curve calculations although this condition of an irregular cross section can be incorporated into the estimation of the rating curves by using different curves for each range of stage variation [Jaccon and Cudo 1989]. Nevertheless, under the analyzed conditions of the Manacapuru station, this break is not clear in the stage–discharge representation (see Figure 3) since the dispersion caused by the variable energy slope is visually more expressive.
The observed data dispersion in the stage–discharge relationship is mainly caused by a variable backwater effect associated with the changes between channels and floodplains. To consider this factor in calculations, the slope of the energy flow line estimated by the water-surface slope was considered in the discharge estimates. According to WMO recommendations [WMO 2010], to estimate the water-surface slope between two stations, the distance between the main and the auxiliary station should be enough to establish a difference of 15 cm in observed stages. Nevertheless, we have to consider that the distance between them is sufficiently short to have a linear water profile between the two gauges. The stretch between the stations should be as uniform as possible because the contractions and obstructions in the channel cannot cause significant breaks in the water-surface slope between the gauges [Petersen-Øverleir and Reitan 2009]. The auxiliary station should be sufficiently far from the backwater source [WMO 2010]. However, in practical terms, these assumptions are difficult to achieve under Amazonian conditions.
In the present work, the observed falls between the stations varied between 2.70 m and 4.71 m. The gauges are separated by a distance of 90 km in a stretch defined as “anabranching” [Latrubesse 2015], which includes levees and large islands as shown in Figure 1. From a theoretical point of view, this stretch is far from ideal for considering the kinetic energy loss constant and estimating the slope of the energy line as the slope of the surface between the two stations. Nevertheless, the fine adjustments of the estimated discharge series to the field discharge measurements indicate that it is fully feasible to consider these assumptions in a region with such a flat relief such as the Solimões basin.
Because the roughness coefficient decreases as a function of the water level and tends to reach a constant value, these results also reflect the importance of detailing these relationships, which is especially significant when considering the fact that in discharge estimates, the calculated discharge is inversely proportional to the coefficient at a one-to-one rate. Considering an average coefficient instead of using a variable coefficient could lead to an overestimation of the minimum discharge and an underestimation of the maximum flows. Such errors are undesirable when considering that the discharge data are used to calibrate and validate hydrological models for extreme events. These results were described by Alves et al. [2017a] for the Solimões River at the Manacapuru station and corroborated by Mansanarez et al. [2016] for the Madeira River.
Finally, it is worth noting that the present analysis was possible only due to the availability of a robust field discharge database with temporal details sufficiently fine to represent the dominant hydrological processes. A database with this amount of detail is not available for most Brazilian stations.
To apply the methodology for stations without such detailed data, it is likely that the relationships obtained between the parameters and the water level will have to be extrapolated, which is the standard procedure for several other methodologies. However, the advantage of applying the Manning equation is related to the possibility of analyzing each parameter separately. For the present station, it is reasonable to understand that by analyzing each relationship obtained for the parameters (area, hydraulic radius, and roughness coefficient), similar results could be obtained even when extreme data are not available.
For the roughness coefficient, the best fit was found for a quadratic equation. However, from a practical perspective, an initial stretch that is inversely proportional to the water level should be considered, followed by a second stretch that tends toward a constant value. Such considerations can be applied for other stations without sufficient data to cover the entire range of water level variations.
At the Manacapuru station and several other stations located on large Amazon rivers, the hydrographs are stable over time and present a unique period of rising and a unique period of falling. Therefore, the discharge measurements performed once a month were sufficient to adequately represent the evolution of hydrological processes. For stations located in smaller catchments with faster responses to precipitation events, the frequency of field measurements must be enhanced by focusing on the measurements of extreme events.
Hence, it is important to highlight the importance of dedicating efforts toward obtaining satisfactory field databases for establishing an adequate stage–discharge relationship and determining the best method to estimate discharge. This information improves the generation of continuous discharge data series, especially for flows affected by variable backwater effects.
5. Conclusions
The results verified the importance of considering the variable backwater effect on discharge calculations for water level data series. The slope of the energy line, which is estimated by the water-surface slope between two gauges, can be adequately applied for this purpose. Individualizing each of the Manning equation parameters as a function of the water level is also extremely important for enhancing the quality of the generated data series. When these data are available, the Manning equation can be applied for each daily water level, thereby generating an accurate discharge data series. Applying the Manning equation appeared to enhance the results compared with the traditional methodology of using rating curves, especially in terms of the maximum discharge peaks. To obtain this accurate discharge data series, it is crucial to have a robust field database to support the development and evaluation of the best method for establishing stage–discharge relationships.